Abstract
MicroRNAs are small non-coding RNAs that control gene expression during development, physiology, and disease. Transcription is a key factor in microRNA abundance and tissue-specific expression. Many databases predict the location of microRNA transcription start sites and promoters. However, these candidate regions require functional validation. Here, dCas9 fused to transcriptional activators or repressors - CRISPR activation (CRISPRa) and inhibition (CRISPRi)- were targeted to the candidate promoters of two intronic microRNAs, mmu-miR-335 and hsa-miR-3662, including the promoters of their respective host genes Mest and HBS1L. We report that in mouse embryonic stem cells and brain organoids, miR-335 was downregulated upon CRISPRi of its host gene Mest. Reciprocally, CRISPRa of Mest promoter upregulated miR-335. By contrast, CRISPRa of the predicted miR-335-specific promoter (located in an intron of Mest) did not affect miR-335 levels. Thus, the expression of miR-335 only depends on the promoter activity of its host gene Mest. By contrast, miR-3662 was CRISPR activatable both by the promoter of its host gene HBS1L and an intronic sequence in HEK-293T cells. Thus, CRISPRa and CRISPRi are powerful tools to evaluate the relevance of endogenous regulatory sequences involved in microRNA transcription in defined cell types.
Introduction
microRNAs (miRNAs) are short non-coding RNAs that play a central role in regulating gene expression in plants and animals (Jones-Rhoades et al., 2006; Bartel, 2018). miRNAs impact development and physiology and are dysregulated in diseases, including cancer (Schanen and Li, 2011; DeVeale et al., 2021; Xue et al., 2021). Stringent gene annotations suggest that there are ∼500 miRNAs in mice (Chiang et al., 2010) and humans (Fromm et al., 2015). It is estimated that approximately half of the mammalian miRNAs are intronic (Rodriguez et al., 2004; Meunier et al., 2013; Hinske et al., 2014). miRNA biogenesis sequentially involves transcription, cleavage of the miRNA hairpin precursor out of the primary transcript, transport of intermediate forms, and loading of the mature miRNA into the RNA-induced silencing complex (Westholm and Lai, 2011; Ha and Kim, 2014; Bartel, 2018; O’Brien et al., 2018).
The mechanisms that regulate miRNA transcription, a key factor of miRNA abundance and tissue-specific expression, are not well defined, in particular for intronic miRNAs. Intronic miRNAs were first observed as frequently co-regulated with their host genes (Rodriguez et al., 2004; Seitz et al., 2004; Baskerville and Bartel, 2005; Liang et al., 2007; He et al., 2012), suggesting that their transcription depends on the promoter activity of the host gene. By contrast, recent work suggests that most intronic miRNAs are not co-regulated with their host genes and they have independent transcription start sites (Steiman-Shimony et al., 2018). Many additional studies have tried to map miRNA promoters using bioinformatics tools (Chen et al., 2019). For instance, genome-wide mapping of cardinal features of promoters, including RNA PolII or PolIII binding, enrichment in specific histone marks, transcription factor binding sites and depletion in nucleosomes, shows that 30%–35% of miRNA have independent promoters (Ozsolak et al., 2008; Monteys et al., 2010) of miRNA have independent promoters. The location of miRNA promoters was also inferred from CAGE data (Cap analysis gene of expression) (Chien et al., 2011; Marsico et al., 2013). Recently, de Rie and coworkers as part of the FANTOM5 project (Functional Annotation of Mammalian Genome) have combined CAGE and RNA-seq data to locate TSS and the 5’ end of pri-miRNAs in many tissues and cell types. They estimated that there are 1,357 promoters for humans and 804 for mouse miRNAs (de Rie et al., 2017). However, these putative regulatory regions were not functionally validated.
CRISPR (Clustered regularly interspaced short palindromic repeats)/Cas9 activation (CRISPRa) and inhibition (CRISPRi) are two techniques that take advantage of a dead Cas9 (dCas9) that is fused to either activators or repressors of transcription. CRISPRi or CRISPRa complexes are targeted to a specific genomic region using a complementary single guide RNA (sgRNA), which results in an increase (for CRISPRa) or a decrease (for CRISPRi) in the expression levels of the targeted gene (Gilbert et al., 2013; Konermann et al., 2015; Lee et al., 2016; Yeo et al., 2018). CRISPRa/i tools have been previously used to test the function of long non-coding RNAs (Liu and Lim, 2018; Zhao et al., 2021). Hence, we reasoned that CRISPRa/i might be used to map miRNA promoters and validate predictions made using bioinformatics tools. As a proof of principle, here CRISPRa or CRISPRi complexes were directed to the predicted regulatory sequences of two intronic miRNAs, mmu-miR-335 and hsa-miR-3662, including intronic sequences and the promoters of their respective host genes Mest and HBS1L.
Material and methods
Cell culture
Mouse embryonic stem cells (mESCs) and mESCs-derived brain organoids
E14Tg2a mESCs were cultivated on gelatine-coated dishes and maintained pluripotent in Serum/Lif media as described (Varrault et al., 2018).
Brain organoids were generated in 96-well (U-bottom) Ultra-Low Adhesion plates (Sumitomo) by seeding 3,000 ESCs in corticogenesis medium 1: DMEM/F-12/GlutaMAX supplemented with 10% KSR, 0.1 mM of non-essential amino acids, 1 mM of sodium pyruvate, 50 U/mL penicillin/streptomycin, 0.1 mM of 2-mercaptoethanol (Sigma), 1 µM DMH1-HCl (in house synthesized, Vanderbilt University) and 240 nM IWP-2 (Tocris). On day 8 of differentiation, organoids were transferred to bacterial plates (Greiner) in corticogenesis medium 2: DMEM/F-12/GlutaMAX supplemented with N2 and B27 (without vitamin A) supplements, 500 μg/mL of BSA, 0.1 mM of non-essential amino acids, 1 mM of sodium pyruvate, 0.1 mM of 2-mercaptoethanol, and 50 U/mL penicillin/streptomycin (Le Digarcher et al., 2022).
Mouse embryonic fibroblasts (MEFs)
Immortalized CRISPRa (SAM) MEFs (gift from Giacomo Cavalli’s lab, unpublished) were cultivated in DMEM supplemented with 10% FBS and 50 U/mL penicillin/streptomycin. All media components were from Life Technologies unless otherwise stated. Cell lines were routinely tested for the absence of mycoplasma (Mycoalert, Lonza).
HEK-293T cells
HEK-293T cells were obtained from the American Type Culture Collection (Manassas, VA). They were grown and maintained in high-glucose DMEM supplemented with 10% FBS and 1% penicillin/streptomycin (100 U/L penicillin and 100 U/L streptomycin).
CRISPRa and CRISPRi cell lines
Generation of CRISPRi (dCas9-KRAB-MeCP2) mESCs
To generate CRISPRi mESCs, E14Tg2a mouse ESCs were co-transfected with pCMV-HA-HyperpiggyBase (Yusa et al., 2011)–pB- and pB-dCas9-KRAB-MecP2 (Yeo et al., 2018) (Addgene plasmid # 110824) using a Neon transfection system (Life Technologies). Forty-8 hours post-transfection, cells were selected using Blastidicin (15 μg/mL, SIGMA). The detailed protocol to generate CRISPRi and CRISPRa cell lines was previously published (Le Digarcher et al., 2022).
Generation of CRISPRa (SAM) HEK-293 cells
To generate CRISPRa HEK293 cells, the pB-SAM (Addgene, #102559) and HyperpiggyBase plasmids were co-transfected using Lipofectamine 3,000 (Thermo Fisher Scientific). HEK-293 colonies stably expressing the CRISPRa system were selected with blasticidin (10 μg/mL) and validated by Western blot using an anti-Cas9 antibody.
CRISPRa (SAM) mESCs and SAM MEFs
SAM mESCs (Bonev et al., 2017) and SAM MEFs were a gift from Giacomo Cavalli’s lab.
Generation and design of sgRNAs
sgRNA sequences targeting Mest promoters were designed using CRISPick https://portals.broadinstitute.org/gppx/crispick/public (formerly GPP sgRNA Design tool) or manually. sgRNAs that target the putative miR-335 promoter (mm10_dna range = chr6_30740830–30741300) were designed using CHOPCHOP (Labun et al., 2019).
Plasmids
Pairs of oligonucleotides (Eurofins) were annealed and subcloned into either sgRNA (MS2) cloning backbone (Addgene Plasmid #61424) or Lenti sgRNA (MS2)_zeo backbone (Konermann et al., 2015) (Addgene plasmid # 61427) that were previously digested with either BbsI or BsmBI (NEB), respectively, and purified on a Chromaspin column (Clontech). All constructs were verified by Sanger sequencing (Genewiz). sgRNA sequences are listed in Supplementary Table S1.
Lentiviruses
Lentiviruses were prepared as described elsewhere (Lin et al., 2002). Briefly, lentiviral transfer vectors were co-transfected with the HIV packaging plasmid psPAX2 and the plasmid pMD2G (coding for the vesicular stomatitis virus envelope glycoprotein G), in HEK-293T cells by the calcium phosphate method. Supernatants were collected on day 2 post-transfection and concentrated on sucrose by ultracentrifugation at 95 528 g for 1.5 h at 4°C.
Expression of sgRNAs in CRISPRa/i cells by lentiviral transduction or transfection
Generation of SAM CRISPRa ESC lines expressing sgRNAs that target Mest promoters
E14Tg2a ESCs stably expressing the SAM system (Bonev et al., 2017) –SAM ESCs-were transfected with Lenti sgRNA (MS2)_zeo plasmids expressing the following sgRNAs: control, Mest distal promoter, Mest proximal promoter#1, or Mest proximal promoter#2. ESCs were selected using Zeocin (250 μg/mL, Life Technologies) and clones were picked and expanded.
Generation of CRISPRi ESC lines expressing sgRNAs that target the promoters of Mest
CRISPRi ESCs were transduced with lentiviruses expressing the following sgRNAs: control, Mest distal promoter, Mest proximal promoter#1, or Mest proximal promoter#2. Seventy-2 hours post-infection, cells were selected using hygromycin (1 mg/mL, Life Technologies), and clones were picked and expanded.
Transient transfection of sgRNAs in SAM MEFs
80,000 MEFs stably expressing the SAM system (SAM MEFs) were transfected using Lipofectamine 2000 with 300 ng of sgRNA (MS2) plasmid expressing either one control sgRNA, one Mest distal promoter sgRNA (out of 3 different sgRNAs), one Mest proximal promoter sgRNA (out of 2 different sgRNAs), or one miR-335-putative promoter sgRNA (out of 3 different sgRNAs). Forty-8 hours later, RNAs were harvested.
Transient transfection of sgRNAs in SAM HEK293 cells
3 μg of lenti-sgRNA-(MS2)-zeo plasmid expressing either a control sgRNA, sgRNAs targetting miR-3662 or HBS1L promoters were transfected into CRISPRa HEK-293 cells using Lipofectamine 3,000. RNAs were collected 24 h, 48 h, and 72 h after transfection.
RNA extraction and gene quantification
For miR-335 and Mest, total RNAs were extracted using quick-RNA miniprep kits (Zymo) and quantified on a Nanodrop. RNAs were retro-transcribed with N6 primers and M-MuLV retro-transcriptase (RT). qPCR was performed using validated primers and SYBR Green Mix (Roche) in 384-well plates on a LightCycler480 device (Roche) as described in (Bouschet et al., 2017). Each gene’s expression level was normalized to the average expression levels of three housekeeping genes selected with geNorm (Vandesompele et al., 2002): Gapdh, Tbp, and Mrpl32 for ESCs and Gapdh, Tbp and Gusb for MEFs (and Gapdh and Tbp when comparing ESCs to MEFs). miRNAs were retro-transcribed with gene-specific primers and multiscribe RT (Life Technologies). Their levels of expression were measured with TaqMan probes (miRNA Taqman assays # 000546 for miR-335-5p, and # 002185 for miR-335-3p). and normalized to that of U6 snoRNA (assay # 001973) (ThermoFisher). U6 was found to be stably expressed across samples (not shown).
For miR-3662 and HBS1L, 1 μg of RNA was reverse transcribed using miScript II RT Kits (QIAGEN, Hilden, Germany) or Mir-X miRNA qRT-PCR TB Green Kit (Takara Bio United States, Inc.) according to the manufacturer’s protocol. Then, cDNA was used as a template for real-time PCR using a QuantStudio 3 (Applied Biosystems, Waltham, MA) with miScript SYBR Green PCR kits (QIAGEN) at 95°C for 15 min, followed by 40 cycles of 95°C for 15 s, 55°C for 30 s and 72°C for 30 s or Mir-X miRNA qRT-PCR TB Green Kit (Takara Bio United States, Inc.) 95°C for 10 s, followed by 40 cycles of 95°C for 5 s, 60°C for 20 s. For coding genes, 1 μg of RNA was reverse-transcribed using a High-Capacity cDNA Reverse Transcription Kit (Catalog number: 4,368,813). Then, cDNA was used as a template for real-time PCR using QuantStudio 3 (Applied Biosystems, Waltham, MA) with SYBR™ Green PCR Master Mix (Catalog number: 4,309,155). The relative quantities of miRNA and coding gene were determined by the comparative method (2−ΔΔCT) with a U6 and GAPDH respectively as a reference.
qPCR primer sequences are listed in Supplementary Table S2.
Immunofluorescence
Immunofluorescence experiments were performed as described (Varrault et al., 2018) using antibodies directed against (species; provider; catalogue number): CAS9 (mouse; Cell signalling; #14697); NANOG (mouse; BD Pharmingen; #560259); NESTIN (mouse; Santa Cruz; sc-33677); PAX6 (mouse; Covance; PRB-278P); POU5F1 (rabbit; Cell signalling; #2840); TBR1 (rabbit, Cell signalling; #49661); TUBB3 (mouse; Covance; MMS-435P). Secondary antibodies were anti-mouse or anti-rabbit coupled to Alexa Fluor® 488 or Cy3 (Jackson Immunoresearch Laboratories). Nuclei were labelled with DAPI and slides were mounted with mowiol and observed under a fluorescence microscope (ImagerZ1, Zeiss). Images of organoids were obtained by tiling and stitching, and insets were taken using the apotome mode.
Statistical analysis
Statistical analysis was carried out using GraphPad Prism Version 8 (GraphPad Software, San Diego, United States) and the test names are indicated in the figure legends.
Results
Development of a pipeline to test the activity of putative miRNA promoters with CRISPRa and CRISPRi
To test the function of regulatory regions on miRNA expression, we designed an experimental pipeline in four steps (Figure 1). The first step consists in locating active promoters using CAGE and/or RNA-seq data, which are either homemade or publicly available from consortiums, including the FANTOM5 consortium (de Rie et al., 2017). In the example depicted in Figure 1, the host gene has two promoters and the intronic miRNA has one promoter. FANTOM5 CAGE data (de Rie et al., 2017) peaks colocalize with promoter 1 (host gene) and the intronic miRNA promoter, showing that these promoters are active in this cell type. RNA-seq data confirms that promoter 1 of the host gene is active. The FANTOM5 further predicts that the pri-miRNA originates at promoter 1 of the host gene. Then, in step 2, two to three sgRNAs are designed to target these genomic regions. In parallel (step 3), CRISPRi and CRISPRa modules are stably introduced in the cell type of interest. Here, for CRISPRi we have used a dCas9 fused to the repressors of transcription KRAB and MeCP2 (Figure 1). dCas9-KRAB-MeCP2 was previously shown to be efficient for repressing a vast panel of genes in HEK-293T cells (Yeo et al., 2018). The CRISPRa system was composed of dCas9 and three transactivators: VP64, p65 and HSF1 (Konermann et al., 2015). This CRISPRa tool is also known as SAM (for Synergistic Activation Mediator (Konermann et al., 2015)) and is considered one of the most efficient CRISPRa systems. Finally, in step 4, sgRNAs are expressed in CRISPRi or CRISPRa cells and the levels of the host gene and the miRNA are quantified by RT-qPCR. If the level of the miRNA is affected by certain sgRNAs, this suggests that the targeted genomic region has a functional role in the expression of the miRNA.
FIGURE 1

Flowchart of the four-step strategy to test the functional role of genomic regions in miRNA expression. Step 1: The putative promoters are inferred from CAGE data (here from the FANTOM5 consortium, which also predicts pri-miRNA transcription start), and/or RNA-seq data. In the depicted example, the host gene has two predicted promoters and the intronic miRNA has one promoter. CAGE reads map to the host gene promoter and to a lesser extent to the intronic miR promoter, indicating that these two promoters are active (preferentially the host gene promoter 1 over the miRNA intronic promoter). By contrast, the host gene promoter 2 is inactive (no CAGE reads). CAGE data can be corroborated with RNA-seq data (here, they confirm that the host gene promoter 1 is active). Step 2: two to three sgRNAs are designed to target the three putative promoter regions (green sgRNAs for host gene promoter 1, orange sgRNAs for host gene promoter 2, and blue sgRNAs for the miRNA intronic promoter). Step 3. Production of CRISPRi and CRISPRa cell types of interest that express dCas9 fused to the repressors of transcription KRAB and MeCP2 (CRISPRi) or the transactivators p65, HSF1, and VP64 (CRISPRa). Step 4: sgRNAs are expressed in CRISPRi and/or CRISPRa cells and the levels of the host gene and miRNA are quantified by RT-qPCR. If the level of the miRNA is affected by certain sgRNAs in CRISPRa/i experiments, this suggests that the targeted genomic region has a functional impact on miRNA expression. Adapted with permission from (Le Digarcher et al., 2022). TSS: transcription start site.
CRISPRi-mediated repression of Mest promoter suppresses the expression of hosted miR-335 in embryonic stem cells
We first applied our pipeline to miR-335. miR-335 is located in an intron of the protein-coding gene Mest (Figures 2A, B). miR-335 is transcribed from the same DNA strand as its host gene, a common feature of intronic miRNAs (Hinske et al., 2014). Mest and miR-335 are highly conserved during evolution and frequently co-regulated (Liang et al., 2007; Ronchetti et al., 2008; Tomé et al., 2011; Yang et al., 2014; Hiramuki et al., 2015). This suggests that Mest and miR-335 share common regulatory sequences. Mest has one distal promoter (D) and one proximal promoter (P) (Figure 2A). In addition, the PROmiRNA and FANTOM5 databases (Marsico et al., 2013; de Rie et al., 2017) suggest that the promoter of miR-335 is the Mest P promoter. In mouse embryonic stem cells (mESCs), RNA-seq (Bouschet et al., 2017) and CAGE (de Rie et al., 2017) data show that Mest transcripts originate predominantly from the P promoter, close to the predicted TSS of the pri-miRNA (Figure 2A). (Capitano et al., 2017; Ji et al., 2017; Medley et al., 2021)
FIGURE 2

CRISPRi-mediated repression of Mest promoter suppresses the expression of hosted miR-335 in embryonic stem cells (A) Transcription of Mest and pri-miRNA-335 originate from the proximal promoter of Mest (P) in mouse embryonic stem cells. From top to bottom panels: genome organisation of the Mest gene with Mest distal (D) and proximal (P) promoters and miR-335 located in an intron of Mest. Chromosomal coordinates and gene annotation are from the RefSeq mm10 build. CAGE signals of TSS activity in ESCs–in duplicate, ES-46C embryonic stem cells, neuronal differentiation, day00, biol_rep1 and 2 - and the pri-miRNA TSS are mapped at the Mest P promoter (data are from the FANTOM5 database (de Rie et al., 2017; Lizio et al., 2019)). Integrative Genomics Viewer capture shows coverage plot and alignment of RNA-seq reads in mESCs (GSE75486 (Bouschet et al., 2017)). Reads for Mest (blue) are transcribed from the + strand, while reads from Copg2 (pink) are transcribed from the - strand. Mest transcripts originate from the P promoter and + strand, corroborating CAGE data. The Copg2 gene is not entirely shown. D: Mest distal promoter; P: Mest proximal promoter. (B) Schematic of mouse Mest gene with the CRISPRi module (dCas9-KRAB-MeCP2) targeting the proximal promoter P of Mest. (C, D) Repression of the Mest promoter downregulates Mest(C) but does not affect the expression of neighbouring Copg2(D). RNAs were quantified in two CRISPRi ESC clones expressing the control sgRNA (grey) and two CRISPRi ESC clones expressing Mest sgRNA (red). Data are mean ± sem of five independent experiments and expressed as fold change over control clone #1. **:p < 0.01 (Mann-Whitney test). (E, F) Repression of the Mest promoter downregulates miR-335-3p and miR-335-5p levels. Data are mean ± sem of five independent experiments and expressed as fold change over control clone #1. **:p < 0.01 (Mann-Whitney test).
We reasoned that if miR-335 expression depends on the activity of either Mest promoters, then repressing transcription at Mest promoters with CRISPRi should decrease miR-335 transcripts in mESCs. Using Hyper-piggyBac transposase (Yusa et al., 2011), we first generated a CRISPRi mESC line that stably expresses dCas9 fused to the repressors of transcription KRAB and MeCP2. CRISPRi mESCs (characterized in Supplementary Figure S1) were transduced with lentiviruses that express either a control sgRNA (no match in the mouse genome) or a sgRNA targeting either the D or the P promoters of Mest (Supplementary Figure S2A). sgRNAs targeting Mest promoter P downregulated Mest while targeting distal promoter D had no obvious effect (Supplementary Figure S2B). Thus, as expected, CRISPRi was efficient only when targeting the active Mest promoter. Levels of the neighbouring gene Copg2 were unaffected (Supplementary Figure S2C).
We then selected two CRISPRi mESC clones expressing the control sgRNA and two clones expressing the sgRNA Mest P2 for further analyses (Figure 2B). There was a >100-fold downregulation of Mest in CRISPRi Mest clones compared to CRISPRi control clones (Figure 2C). By contrast, Copg2 expression was unaffected (Figure 2D). To determine whether the expression of miR-335 depends on Mest, we next quantified miR-335 in CRISPRi mESCs stably expressing either the control sgRNA or the sgRNA targeting the promoter of Mest. miR-335 is known to generate two mature products, miR-335-5p, considered as the main product of the miR-335 biogenesis pathway and miR-335-3p (or miR-335*, known as the passenger miRNA) (Kozomara et al., 2019; Medley et al., 2021). miR-335-3p was previously reported to be expressed in mESCs but the expression of miR-335-5p was not assessed in this study (Kingston and Bartel, 2019). Using gene-specific RT followed by qPCR with Taqman probes (see Methods) we detected both miR-335-3p and miR-335-5p in control ESCs (Figures 2E, F). In CRISPRi Mest clones, miR-335-3p and miR-335-5p levels were reduced to less than 1% of levels measured in CRISPRi control clones (Figures 2E, F), a massive downregulation that paralleled that of Mest (Figure 2C). Thus, the transcriptional activity of Mest proximal promoter is required for the expression of intronic miR-335 in mESCs.
Mest promoter activity is required for miR-335 expression in brain organoids
Because Mest and miR-335 are co-expressed in the nervous system, where they play functional roles (Capitano et al., 2017; Ji et al., 2017), we next determined whether we could downregulate both Mest and miR-335 via CRISPRi targeting of the Mest promoter in brain cells. Brain organoids were generated from CRISPRi mESCs in ultra-low adhesion plates according to a ground-breaking protocol (Eiraku et al, 2008), which we slightly modified (Le Digarcher et al., 2022). As expected, CRISPRi mESCs-derived organoids contained neural progenitors of dorsal identity (NESTIN + PAX6+ cells) after 8 days of differentiation, and neurons (TUBB3+ cells), including neurons that expressed the cortical marker TBR1 after 15 days of differentiation (Figure 3A). The neural identity of organoids was further confirmed by RT-qPCR using primers for Nestin (neural progenitors), Fabp7 (radial glia) and Tubb3 (neurons) (Figure 3B).
FIGURE 3

Mest promoter activity is required for miR-335 expression in brain organoids (A) Immunofluorescence staining on brain organoids derived from mESCs using antibodies for brain primordium markers NESTIN/PAX6 (middle panels) and TUBB3/TBR1 (right panels) after eight and 15 days of differentiation. The top panels show entire organoids and the bottom panels are zoom-in insets. Scale bars: 200 µm for organoids (top panels) and 50 µm for insets (bottom panels). (B) Time course of expression of Mest and miR-335 mature products during the development of brain organoids from CRISPRi ESCs stably expressing either control sgRNA or Mest sgRNA. The heatmap shows the mean of four independent experiments performed on two CRISPRa sgRNA control and two CRISPRa sgRNA ESC clones. Heatmap was built using Morpheus. https://software.broadinstitute.org/morpheus/.
Mest and miR-335 transcripts were co-upregulated during the generation of brain organoids from CRISPRi mESCs expressing the control sgRNA (Figure 3B). By contrast, Mest RNA was barely detectable in CRISPRi organoids expressing the Mest sgRNA (Figure 3B), showing that the Mest promoter remains repressed in differentiated cells. Importantly, miR-335 mature products were also barely detectable in these organoids (Figure 3B). Thus, the activity of the Mest promoter is required for miR-335 expression in both undifferentiated mESCs and their neural progeny.
CRISPRa-induced upregulation of Mest induces the expression of miR-335 in ESCs
Next, we tested whether transactivating the Mest promoter using CRISPRa is sufficient to increase miR-335 levels. To this aim, mESCs stably expressing the CRISPRa system SAM (Bonev et al., 2017) were transduced with lentiviruses expressing either a control sgRNA or a sgRNA targeting Mest (D) or (P) promoters (Supplementary Figure S3A) –and as described for CRISPRi-. Transactivating the distal promoter of Mest efficiently increased Mest transcripts (Supplementary Figure S3B). By contrast, transactivating Mest proximal promoter with sgRNAs P1 and P2 had no major effect on the Mest transcript level (Supplementary Figure S3B), likely because this promoter is already active in ESCs (Figure 2A). The level of Copg2 was not altered by any of the three Mest sgRNAs (Supplementary Figure S3C). We selected for further analysis two CRISPRa control and two CRISPRa Mest clones (expressing the D sgRNA, Figure 4A). On average, there was a 3.2-fold increase in Mest transcript in CRISPRa Mest clones compared to control clones (Figure 4B). Copg2 expression was unaffected (Figure 4C). Strikingly, the levels of both miR-335-3p and miR-335-5p also increased by a ∼3-fold factor (Figures 4D, E). Thus, activating the distal promoter of Mest with CRISPRa/SAM is sufficient to increase the levels of hosted miR-335.
FIGURE 4

CRISPRa-induced upregulation of Mest induces the expression of miR-335 in ESCs (A) Schematic of mouse Mest gene structure with the CRISPRa SAM - synergistic activation mediator-module targeting the distal promoter D of Mest. (B, C) Transactivation of the Mest promoter upregulates Mest(B) but does not affect neighbouring Copg2 expression (C). Data are mean ± sem of five independent experiments performed on two CRISPRa sgRNA control (grey) and two CRISPRa sgRNA Mest clones (green) and expressed as fold change over control clone#1.**:p < 0.01 (Mann-Whitney test). (D, E) Transactivation of the Mest promoter increases miR-335-3p (D) and miR-335-5p (E) levels. Data are mean ± sem of four independent experiments and expressed as fold change over control clone#1. *:p < 0.05 (Mann-Whitney test).
CRISPRa on the intronic promoter of miR-335 does not affect miR-335 levels in MEFs
A previous study based on luciferase assays performed in HEK-293T cells suggests that the sequence upstream of miR-335 (situated in a Mest intron and named pro2) has some promoter activity (Zhu et al., 2014). Thus, we next tested whether we could upregulate miR-335 by directing the SAM complex to this genomic region.
Because SAM efficiency correlates with the baseline expression levels of the targeted gene–the fold of upregulation is inversely correlated with basal transcript level- (Konermann et al., 2015), we reasoned that to maximize the chance to increase miR-335, these SAM experiments should be performed in cells with lower baseline levels of miR-335 than mESCs. MEFs (mouse embryonic fibroblasts) were reported to express miR-335-5p (Kingston and Bartel, 2019). We observed that MEFs expressed both miR-335-3p and miR-335-5p (Figure 5A). miR-335-3p and miR-335-5p levels were respectively 13 and 47 times lower in MEFs compared to mESCs (Figures 5A, B). Mest expression was also ∼60 times less expressed in MEFs than in mESCs (Figure 5C), adding further support for the coregulation of Mest and miR-335. Thus, MEFs have low baseline levels of endogenous miR-335 and Mest and they seem an appropriate model to perform CRISPRa experiments with maximised chances to observe an effect on miR-335 levels.
FIGURE 5
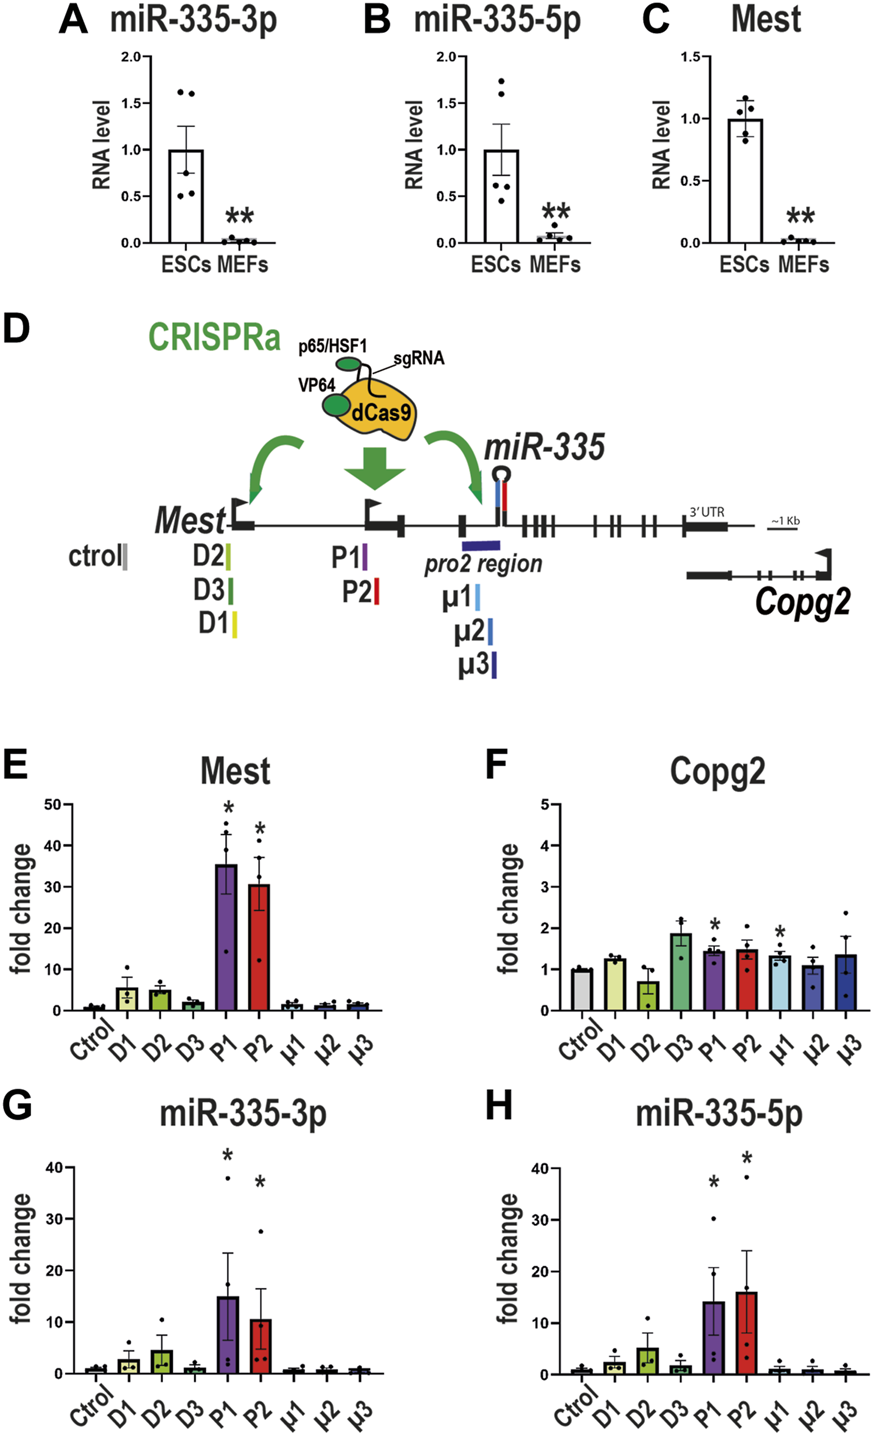
CRISPRa on the intronic promoter of miR-335 does not affect miR-335 levels in MEFs (A–C) Lower expression of miR-335 and Mest in SAM MEFs compared to SAM ESCs. Data are mean ± sem of qPCR experiments performed on five MEF and five ESC samples and normalized to the average value obtained on ESCs.**:p < 0.01 (Mann-Whitney test). (D) Structure of mouse Mest gene with SAM targeting either the distal promoter of Mest D (D1-D2 sgRNAs), the proximal promoter of Mest P (P1-P3 sgRNAs), or the putative promoter of miR-335 (µ1-µ3 sgRNAs, which target the pro2 region). (E–H) Levels of expression of Mest(E), Copg2(F), miR-335-3p(G), and miR-335-5p(H) were measured after transactivation of either Mest D or P promoters or miR-335 putative promoter. SAM MEFs were transfected with plasmids expressing sgRNAs targeting Mest D (sgRNAs D1, D2, and D3), Mest P (P1 and P2), or the putative promoter of miR-335 (µ1, µ2, and µ3). Data are mean ± sem of three to four independent experiments and expressed as fold change over sgRNA control taken as 1. *: p < 0.05 in Mann-Whitney test (comparison with sgRNA control values). None of the sgRNAs that direct the CRISPRa/SAM machinery towards the miR-335 putative promoter (µ1, µ2, and µ3) altered miR-335 levels.
To test the putative miR-335 promoter (pro2 (Zhu et al., 2014), which has 96.8% sequence homology between mouse and Humans), we designed three sgRNAs (µ1, µ2, and µ3) and compared their efficiency in upregulating miR-335 to that of sgRNAs that target Mest promoters (Figure 5D). We observed that sgRNAs P1 and P2 (which target Mest P promoter) strongly upregulated Mest (Figure 5E) and had no major effects on Copg2 expression (Figure 5F). sgRNAs P1 and P2 also strongly upregulated miR-335 mature products in SAM MEFs (Figures 5G, H). The upregulation of Mest was much higher in MEFs than in mESCs, as expected from their relative Mest baseline levels (Figure 5C). By contrast, the three sgRNAs that target the putative promoter of miR-335 (sgRNAs µ1, µ2, and µ3) did not affect miR-335-3p nor miR-335-5p levels (Figures 5G, H). Thus, this genomic sequence likely does not regulate miR-335 expression in MEFs.
Transactivation of the promoters of miR-3662 or host gene HBSIL increases miR-3662 levels
Next, we sought to extend our approach to another intronic microRNA, hsa-miR-3662 (hereafter: miR-3662). miR-3662 is a human-specific miR that plays bivalent roles in cancer, acting either as a tumour suppressor or an oncogene in different cellular contexts (Powrózek et al., 2015; Maharry et al., 2016; Powrózek et al., 2017). We recently reported that MIR-3662, located in an intron of the HBSL1 gene, is tunable by CRISPRa/i targetting of an intronic sequence in HBSL1 (Yi et al., 2022). The FANTOM5 database (de Rie et al., 2017) predicts from CAGE data that MIR-3662 uses the promoter of its host gene HBSL1. Thus, we next investigated whether the expression level of miR-3662 is also tunable by activating the promoter of HBS1L. We first generated a HEK-293 cell line that stably expresses the CRISPRa SAM system using PB-SAM (Supplementary Figure S4). Next, SAM HEK-293 cells were transfected with plasmids expressing sgRNAs that target the HBS1L promoter (3 sgRNAs, called HBS1L H1-3), a control sgRNA, or 3 sgRNAs, called miR-3662-sgRNA1-3, that target the miR-3662 promoter (in an intron of HBS1L,Figure 6A) and which we previously found efficient with the CRISPRa system VPR (Yi et al., 2022). The expression levels of HBS1L and miR-3662 were monitored by qPCR at 24 h, 48 h and 72 h after transfection. As expected, HBS1L was upregulated when targeting its promoter with CRISPRa (Figure 6B). miR-3662 was also transiently upregulated by targeting its host gene HBS1L (Figure 6C). In parallel, miR-3662 was upregulated by targeting its promoter with SAM and sgRNAs-miR-3662 (Figure 6D). Thus, miR-3662 can be activated by targeting both its own promoter and its host gene promoter in HEK-293T cells.
FIGURE 6

Transactivation of the promoters of miR-3662 or host gene HBSIL increases miR-3662 levels (A) Structure of the human HBS1L gene (modified screen capture from the UCSC genome browser) with the SAM complex targeting either the promoter of HBS1L (sgRNAs HBS1L 1–3) or the promoter of miR-3662 (sgRNAs miR-3662 1–3), which is located in an intron of HBS1L. According to FANTOM5 data, transcription of HBS1L and pri-miRNA-3662 both originate from the promoter of HBS1L. Chromosomal coordinates and gene annotation are from the RefSeq hg38. CAGE signals (max and total read counts on the reverse strand) are from the FANTOM5 database. (B–D) SAM HEK-293T cells were transiently transfected with the three sgRNAs targeting the promoter of HBS1L(B, C) or the 3 sgRNAs targeting the promoter of miR-3662 (miR1-3)(D). The expression of HBS1L(B) and miR-3662(C, D) was quantified by RT-qPCR after 24, 48, or 72 h of transfection. Tukey’s multiple comparison tests were performed. *: p < 0.05 and **: p < 0.01 (comparison with sgRNA control value at the same time after transfection).
Discussion
Here we show that CRISPRa and CRISPRi, where dCas9 is fused to transcriptional activators or repressors, respectively, are powerful tools to test genomic regions predicted to be microRNA promoters in databases such as those released by the FANTOM5 consortium (de Rie et al., 2017).
Others have previously used CRISPR-based approaches to manipulate miRNA levels and/or map their promoters. As early as 2014, Zhao and colleagues observed that dCas9 targeted to the upstream sequence of the miR cluster miR17-92 leads to the repression of miR-19a, miR-20a and miR-92 (Zhao et al., 2014). In these experiments, dCas9 was not fused to a transcriptional repressor. Thus, Zhao and colleagues hypothesized that dCas9 sterically blocked RNA PolII (hence they have used the term CRISPR interference and not CRISPR inhibition) (Zhao et al., 2014). More recently, Drobna-Śledzińska and colleagues have developed a complete pipeline from microRNA TSS prediction to sgRNA design and CRISPR inhibition. TSS prediction was inferred from four databases (miR start, DIANA-miRGen, CRISPR tool and FANTOM 5) (Drobna-Śledzińska et al., 2022). Here, as described by Drobna-Śledzińska and colleagues, we have used FANTOM 5 as a prediction tool for promoter activity and CRISPRi. We have further completed the prediction of FANTOM5 with RNA-seq experiments. Prediction tools, including FANTOM5, predict active promoters. Hence, these tools are useful to design sgRNAs for CRISPRi experiments.
In addition to CRISPRi, we also performed CRISPRa experiments. We observed that CRISPRa did not upregulate Mest RNA when the SAM complex targeted the Mest proximal promoter (predicted to be active in mESCs by FANTOM 5). By contrast, CRISPRa was effective when targeting the inactive Mest promoter (hence absent from the FANTOM5 database). Collectively, this suggests that sgRNAs for CRISPRi should target the active promoter (predicted in databases such as the FANTOM5 database), while for CRISPRa it is worth targeting all of the known promoters, especially those that are inactive.
This also likely depends on the basal level of expression and cell type. Indeed, our data obtained in MEFs also revealed that transactivating the (P) promoter resulted in a strong increase in Mest and miR-335 while transactivating the (D) promoter had moderate effects. This contrasts with results obtained in ESCs where the most potent sgRNAs were those targeting the (D) promoter (Figure 4 and Supplementary Figure S3). Thus, taken together, these data suggest that transcriptional activation of one or the other Mest promoter is sufficient to increase the levels of intronic miR-335. This also suggests that this CRISPR-based approach is effective to locate miR regulatory sequences in a cell-type-specific manner. Finally, it also supports the existence of primary transcripts, originating either at (D) or (P) promoters that contain both Mest and miR-335 precursors.
From CAGE data, the FANTOM5 consortium predicts that the promoters of mmu-miR-335 and hsa-miR-3662 are the promoters of their host genes (Mest and HBS1L, respectively), which we verified experimentally here.
Indeed, the activity of the Mest promoter was both necessary (as shown by CRISPRi) and sufficient (as shown by CRISPRa) to drive miR-335 expression. In addition, miR-335 was upregulated by activating different Mest promoters: the proximal promoter (located in the imprinted centre control region of this locus (Lefebvre et al., 1998)) in mESCs and the distal promoter in fibroblasts. This shows that CRISPR can reveal the regulatory regions involved in miRNA expression in specific cell types.
We also observed that in all our experimental setups (CRISPRa or CRISPRi, ESCs or MEFS, and brain organoids), the levels of miR-335 parallel those of Mest. Mest and miR-335 gene products might therefore converge on a common pathway. In this context, both Mest and miR-335 influence neuronal migration, as shown using shRNA for downregulating Mest and a miR-inhibitor for miR-335 (Ji et al., 2017). Using CRISPRa/i on the promoter of Mest should allow for studying the function of coregulated Mest and miR-335 in one go. We did not observe major differences in the expression of the neural markers Nestin (neural progenitors), Fabp7 (radial glia) and Tubb3 (neurons) between CRISPRi Mest and CRISPRi control organoids. This suggests that neural differentiation was grossly normal (as estimated by these three typical markers) at these developmental time points when both Mest and miR-335 are strongly downregulated. A more comprehensive exploration is required to determine whether other neurodevelopmental genes are affected. In addition, it is also possible that the residual ∼1% of Mest and miR-335 expression are sufficient for normal neurodevelopment in vitro. On the other hand, in other tissues and cell types, Mest and miR-335 might perform independent functions as shown in the muscle. Indeed, Mest KO animals but miR-335 KO animals display a muscular defect (Hiramuki et al., 2015).
We failed to upregulate miR-335 by CRISPRa-mediated targeting of its predicted promoter located in a Mest intron (Zhu et al., 2014). Collectively, this suggests that the expression of miR-335 only depends on the activity of the promoter of Mest. We cannot rule out that miR-335 has an independent promoter located in another region or is active in another cell type. In this context, the prediction of miR-335 promoter location made by the PROmiRNA database (Marsico et al., 2013) suggests that there could be several miR-335 promoters depending on the tissue, the most probable being Mest (D) and (P) promoters - what we confirmed experimentally here-, and less probably, a third region situated in another intron of Mest. It is also possible that additional regulatory sequences, including enhancers situated at long distances, influence the expression of miR-335. In this context, it will be interesting to screen the Mest locus along several Mbs with a wider range of sgRNAs, not only with the CRISPRa and CRISPRi molecular platforms as done here but also with dCas9 fused to enhancer regulators (Li et al., 2020).
The positive co-regulation of intronic microRNA and host gene strongly predicts that the microRNA’s transcription depends on its host gene’s promoter (Rodriguez et al., 2004; Seitz et al., 2004; Baskerville and Bartel, 2005; Liang et al., 2007; He et al., 2012). Previous works propose that evolutionarily conserved intronic miRNAs, such as miR-335, are more frequently co-expressed with their host genes than recently appeared intronic miRNAs (He et al., 2012; Steiman-Shimony et al., 2018). This suggests that the transcription of conserved intronic miRNAs depends on the host promoter while recently appeared intronic miRNAs tend to have independent promoters, which we confirmed here for the human-specific miR-3662. miR-3662 is a recently appeared intronic miRNA and was CRISPR activable by targeting both its host gene HBS1L promoter and an independent promoter located in an intron of HBS1L. Although we previously demonstrated that targeting dCas9-KRAB to the intronic promoter of miR-3662 resulted in its downregulation (Yi et al., 2022), in the present study, we were unable to confirm our observation with CRISPRi when targeting the promoter of HBS1L due to the failure to establish a stably expressing CRISPR dCas9-KRAB-MeCP2 HEK-293 cell line.
Here, we have used the SAM CRISPRa system, which is composed of dCas9 linked to three transactivator domains: VP64, p65 and HSF1 (Konermann et al., 2015). The CRISPRi consisted of dCas9 fused to KRAB and MeCP2. In recent years, there has been a tremendous development of the CRISPRa/i toolkit. The current view is that activators or repressors act in synergy and that duo or trio of activators or repressors works better than alone (Konermann et al., 2015; Kampmann, 2018; Yeo et al., 2018). We have not compared the activating or repressing efficiencies of different CRISPRa and CRISPRi systems on miRNA levels. However, our approach is likely feasible using other CRISPRa/i tools. As an example, we have recently reported that miR-3662 levels can be modified using dCAS9 fused to the VPR (CRISPRa) or KRAB (CRISPRi) (Yi et al., 2022). Drobna-Śledzińska and colleagues have also repressed several miRNAs using dCas9 fused to KRAB (Drobna-Śledzińska et al., 2022).
Nevertheless, our approach suffers from some limitations:
1/It requires that the promoter activities are defined in the cell type of interest. In addition, as mentioned above, alternative regulatory regions other than promoters are also possible. Thus, a strategy would be to screen several Mbases along the host gene/hosted miRNA locus to find regulatory regions in an unbiased manner. In this context, CRISPRi was previously used to map the regulatory elements (including distant elements) involved in MYC and GATA1 expression (Fulco et al, 2016).
2/Our approach depends on the basal level of expression of the targeted miRNA. When the miRNA is expressed at low levels, expressing the CRISPRa module and the sgRNA in a few cells is likely sufficient to exceed the low level and obtain an upregulation. By contrast, for highly expressed miRNAs, the CRISPRa complex and sgRNA should be expressed in a maximum of cells to eventually get an upregulation effect.
For CRISPRi, to obtain a good downregulation, the CRISPRi module should be expressed in all cells. To illustrate this, we obtained a much better downregulation effect on Mest/miR-335 on clones (Figure 2), where all cells are supposed to express the CRISPRi module and the sgRNA, than on the polyclonal population (Supplementary Figure S2) which is a mix of cells with efficient and inefficient CRISPRi. Thus, collectively, our strategy is easily amenable to models that are easy to transfect (such as cell lines) but less applicable to complex tissues, which in essence are difficult to transfect.
However, this approach is compatible with organism models such as C.elegans and zebrafish, where the CRISPRa/i module and guide RNAs can be injected into one-cell stage embryos (Long et al., 2015).
3/sgRNAs can have off-target effects. Here, we focused our study on the targeted locus and we can not rule out that our sgRNAs have unintended targets. Reciprocally, for sgRNAs that did not work, such as those targeting the intronic miR-335 promoter (sgRNAs µ1-µ3), it will be worth confirming that these sgRNAs bind to their intended DNA targets, using chromatin immunoprecipitation with anti-Cas9 antibody for example.
To conclude, and despite these limitations, CRISPRa/i experiments on miR-335 and miR-3662 in mouse and human cells confirm the prediction that transcription of these two intronic miRNAs depends on the promoter of their host genes Whether this applies to other intronic miRNAs needs to be demonstrated.
We also observed that CRISPRa can reveal cell type-specific promoters (at least for miR-335). This CRISPR-based approach could be used to test the function of regulatory sequences (including microRNA promoters and enhancers) with the high genomic precision of sgRNAs on a genome-wide scale in different cell types.
Statements
Data availability statement
The raw data supporting the conclusion of this article will be made available by the authors, without undue reservation.
Author contributions
RL, LW, and TB conceived the project and designed the study with inputs from AV; PK performed cell culture and qPCR experiments on hsa-miR-3662 and IC, MC, and TB on mmu-miR-335; AL, PK, and TB generated constructs; AM and CL generated lentiviruses; CH generated DMH1-HCl; PK and TB generated CRISPR cell lines; PK and TB performed all of the analyses. TB drafted the manuscript; PK, RL, LW, AV, and TB revised the manuscript. All authors read and approved the final version of the manuscript.
Acknowledgments
We thank Laurent Journot for helpful discussions and suggestions; Lauriane Fritsch, Boyan Bonev, and Giacomo Cavalli for SAM ESCs and SAM MEFs; Hervé Seitz, Adrien Décorsière, and Laure Garnier for critical reading of our initial draft manuscript; Chris Planque for advice; Philaé Gil and Pierre Nègre for technical assistance; Lionel Quentin and Nicolas Boucharel for performing mycoplasma tests; members of the IGF for continuous support. pB-CAGGS-dCas9-KRAB-MeCP2 was a gift from Alejandro Chavez and George Church (Addgene plasmid # 110824). HyperPiggyBac Transposase (pCMV-HA-HyperpBase) was a gift of Kosuke Yusa and Allan Bradley and was kindly provided by Thomas Dibling (Sanger, Cambridge, United Kingdom). PB-SAM (Addgene, #102559) was a gift from Ying Liu. sgRNA(MS2) cloning backbone and Lenti sgRNA(MS2)_zeo backbone were a gift from Feng Zhang (Addgene plasmids # 61424 and 61427).
Conflict of interest
The authors declare that the research was conducted in the absence of any commercial or financial relationships that could be construed as a potential conflict of interest.
Publisher’s note
All claims expressed in this article are solely those of the authors and do not necessarily represent those of their affiliated organizations, or those of the publisher, the editors and the reviewers. Any product that may be evaluated in this article, or claim that may be made by its manufacturer, is not guaranteed or endorsed by the publisher.
Supplementary material
The Supplementary Material for this article can be found online at: https://www.frontiersin.org/articles/10.3389/fgene.2023.1147222/full#supplementary-material
References
1
Bartel D. P. (2018). Metazoan MicroRNAs. Cell173, 20–51. 10.1016/j.cell.2018.03.006
2
Baskerville S. Bartel D. P. (2005). Microarray profiling of microRNAs reveals frequent coexpression with neighboring miRNAs and host genes. RNA11, 241–247. 10.1261/rna.7240905
3
Bonev B. Mendelson Cohen N. Szabo Q. Fritsch L. Papadopoulos G. L. Lubling Y. et al (2017). Multiscale 3D genome rewiring during mouse neural development. Cell171, 557–572. 10.1016/j.cell.2017.09.043
4
Bouschet T. Dubois E. Reynes C. Kota S. K. Rialle S. Maupetit-Mehouas S. et al (2017). In vitro corticogenesis from embryonic stem cells recapitulates the in vivo epigenetic control of imprinted gene expression. Cereb. Cortex27, 2418–2433. 10.1093/cercor/bhw102
5
Capitano F. Camon J. Licursi V. Ferretti V. Maggi L. Scianni M. et al (2017). MicroRNA-335-5p modulates spatial memory and hippocampal synaptic plasticity. Neurobiol. Learn. Mem.139, 63–68. 10.1016/j.nlm.2016.12.019
6
Chen L. Heikkinen L. Wang C. Yang Y. Sun H. Wong G. (2019). Trends in the development of miRNA bioinformatics tools. Brief. Bioinform.20, 1836–1852. 10.1093/bib/bby054
7
Chiang H. R. Schoenfeld L. W. Ruby J. G. Auyeung V. C. Spies N. Baek D. et al (2010). Mammalian microRNAs: Experimental evaluation of novel and previously annotated genes. Genes Dev.24, 992–1009. 10.1101/gad.1884710
8
Chien C.-H. Sun Y.-M. Chang W.-C. Chiang-Hsieh P.-Y. Lee T.-Y. Tsai W.-C. et al (2011). Identifying transcriptional start sites of human microRNAs based on high-throughput sequencing data. Nucleic Acids Res.39, 9345–9356. 10.1093/nar/gkr604
9
de Rie D. Abugessaisa I. Alam T. Arner E. Arner P. Ashoor H. et al (2017). An integrated expression atlas of miRNAs and their promoters in human and mouse. Nat. Biotechnol.35, 872–878. 10.1038/nbt.3947
10
DeVeale B. Swindlehurst-Chan J. Blelloch R. (2021). The roles of microRNAs in mouse development. Nat. Rev. Genet.22, 307–323. 10.1038/s41576-020-00309-5
11
Drobna-Śledzińska M. Maćkowska-Maślak N. Jaksik R. Dąbek P. Witt M. Dawidowska M. (2022). CRISPRi for specific inhibition of miRNA clusters and miRNAs with high sequence homology. Sci. Rep.12, 6297. 10.1038/s41598-022-10336-3
12
Eiraku M. Watanabe K. Matsuo-Takasaki M. Kawada M. Yonemura S. Matsumura M. et al (2008). Self-organized formation of polarized cortical tissues from ESCs and its active manipulation by extrinsic signals. Cell Stem Cell3, 519–532. 10.1016/j.stem.2008.09.002
13
Fromm B. Billipp T. Peck L. E. Johansen M. Tarver J. E. King B. L. et al (2015). A uniform system for the annotation of vertebrate microRNA genes and the evolution of the human microRNAome. Annu. Rev. Genet.49, 213–242. 10.1146/annurev-genet-120213-092023
14
Fulco C. P. Munschauer M. Anyoha R. Munson G. Grossman S. R. Perez E.-M. et al (2016). Systematic mapping of functional enhancer–promoter connections with CRISPR interference. Science354, 769–773. 10.1126/science.aag2445
15
Gilbert L. A. Larson M. H. Morsut L. Liu Z. Brar G. A. Torres S. E. et al (2013). CRISPR-mediated modular RNA-guided regulation of transcription in eukaryotes. Cell154, 442–451. 10.1016/j.cell.2013.06.044
16
Ha M. Kim V. N. (2014). Regulation of microRNA biogenesis. Nat. Rev. Mol. Cell Biol.15, 509–524. 10.1038/nrm3838
17
He C. Li Z. Chen P. Huang H. Hurst L. D. Chen J. (2012). Young intragenic miRNAs are less coexpressed with host genes than old ones: Implications of miRNA-host gene coevolution. Nucleic Acids Res.40, 4002–4012. 10.1093/nar/gkr1312
18
Hinske L. C. França G. S. Torres H. A. M. Ohara D. T. Lopes-Ramos C. M. Heyn J. et al (2014). miRIAD—integrating microRNA inter- and intragenic data. Database2014, bau099. 10.1093/database/bau099
19
Hiramuki Y. Sato T. Furuta Y. Surani M. A. Sehara-Fujisawa A. (2015). Mest but not MiR-335 affects skeletal muscle growth and regeneration. PLOS ONE10, e0130436. 10.1371/journal.pone.0130436
20
Ji L. Bishayee K. Sadra A. Choi S. Choi W. Moon S. et al (2017). Defective neuronal migration and inhibition of bipolar to multipolar transition of migrating neural cells by Mesoderm-Specific Transcript, Mest, in the developing mouse neocortex. Neuroscience355, 126–140. 10.1016/j.neuroscience.2017.05.003
21
Jones-Rhoades M. W. Bartel D. P. Bartel B. (2006). MicroRNAs and their regulatory roles in plants. Annu. Rev. Plant Biol.57, 19–53. 10.1146/annurev.arplant.57.032905.105218
22
Kampmann M. (2018). CRISPRi and CRISPRa screens in mammalian cells for precision biology and medicine. ACS Chem. Biol.13, 406–416. 10.1021/acschembio.7b00657
23
Kingston E. R. Bartel D. P. (2019). Global analyses of the dynamics of mammalian microRNA metabolism. Genome Res.29, 1777–1790. 10.1101/gr.251421.119
24
Konermann S. Brigham M. D. Trevino A. E. Joung J. Abudayyeh O. O. Barcena C. et al (2015). Genome-scale transcriptional activation by an engineered CRISPR-Cas9 complex. Nature517, 583–588. 10.1038/nature14136
25
Kozomara A. Birgaoanu M. Griffiths-Jones S. (2019). miRBase: from microRNA sequences to function. Nucleic Acids Res.47, D155–D162. 10.1093/nar/gky1141
26
Labun K. Montague T. G. Krause M. Torres Cleuren Y. N. Tjeldnes H. Valen E. (2019). CHOPCHOP v3: Expanding the CRISPR web toolbox beyond genome editing. Nucleic Acids Res.47, W171–W174. 10.1093/nar/gkz365
27
Le Digarcher A. Lemmers C. Monteil A. Hong C. Varrault A. Bouschet T. (2022). “A CRISPR/Cas9-Based toolkit to test gain- and loss-of-gene function in brain organoids,” in Translational research methods in neurodevelopmental disorders neuromethods. Editors MartinS.LaumonnierF. (Springer US), 75–92. 10.1007/978-1-0716-2569-9_5
28
Lee H. B. Sundberg B. N. Sigafoos A. N. Clark K. J. (2016). Genome engineering with TALE and CRISPR systems in neuroscience. Front. Genet.7, 47. 10.3389/fgene.2016.00047
29
Lefebvre L. Viville S. Barton S. C. Ishino F. Keverne E. B. Surani M. A. (1998). Abnormal maternal behaviour and growth retardation associated with loss of the imprinted gene Mest. Nat. Genet.20, 163–169. 10.1038/2464
30
Li K. Liu Y. Cao H. Zhang Y. Gu Z. Liu X. et al (2020). Interrogation of enhancer function by enhancer-targeting CRISPR epigenetic editing. Nat. Commun.11, 485. 10.1038/s41467-020-14362-5
31
Liang Y. Ridzon D. Wong L. Chen C. (2007). Characterization of microRNA expression profiles in normal human tissues. BMC Genomics8, 166–220. 10.1186/1471-2164-8-166
32
Lin Y.-L. Mettling C. Portales P. Reynes J. Clot J. Corbeau P. (2002). Cell surface CCR5 density determines the postentry efficiency of R5 HIV-1 infection. Proc. Natl. Acad. Sci.99, 15590–15595. 10.1073/pnas.242134499
33
Liu S. J. Lim D. A. (2018). Modulating the expression of long non-coding RNAs for functional studies. EMBO Rep.19, e46955. 10.15252/embr.201846955
34
Lizio M. Abugessaisa I. Noguchi S. Kondo A. Hasegawa A. Hon C. C. et al (2019). Update of the FANTOM web resource: Expansion to provide additional transcriptome atlases. Nucleic Acids Res.47, D752–D758. 10.1093/nar/gky1099
35
Long L. Guo H. Yao D. Xiong K. Li Y. Liu P. et al (2015). Regulation of transcriptionally active genes via the catalytically inactive Cas9 in C. elegans and D. rerio. Cell Res.25, 638–641. 10.1038/cr.2015.35
36
Maharry S. E. Walker C. J. Liyanarachchi S. Mehta S. Patel M. Bainazar M. A. et al (2016). Dissection of the major hematopoietic quantitative trait locus in chromosome 6q23.3 identifies miR-3662 as a player in hematopoiesis and acute myeloid leukemia. Cancer Discov.6, 1036–1051. 10.1158/2159-8290.CD-16-0023
37
Marsico A. Huska M. R. Lasserre J. Hu H. Vucicevic D. Musahl A. et al (2013). PROmiRNA: A new miRNA promoter recognition method uncovers the complex regulation of intronic miRNAs. Genome Biol.14, R84–R23. 10.1186/gb-2013-14-8-r84
38
Medley J. C. Panzade G. Zinovyeva A. Y. (2021). microRNA strand selection: Unwinding the rules. WIREs RNA12, e1627. 10.1002/wrna.1627
39
Meunier J. Lemoine F. Soumillon M. Liechti A. Weier M. Guschanski K. et al (2013). Birth and expression evolution of mammalian microRNA genes. Genome Res.23, 34–45. 10.1101/gr.140269.112
40
Monteys A. M. Spengler R. M. Wan J. Tecedor L. Lennox K. A. Xing Y. et al (2010). Structure and activity of putative intronic miRNA promoters. RNA16, 495–505. 10.1261/rna.1731910
41
O’Brien J. Hayder H. Zayed Y. Peng C. (2018). Overview of MicroRNA biogenesis, mechanisms of actions, and circulation. Front. Endocrinol.9, 402. 10.3389/fendo.2018.00402
42
Ozsolak F. Poling L. L. Wang Z. Liu H. Liu X. S. Roeder R. G. et al (2008). Chromatin structure analyses identify miRNA promoters. Genes Dev.22, 3172–3183. 10.1101/gad.1706508
43
Powrózek T. Krawczyk P. Kowalski D. M. Winiarczyk K. Olszyna-Serementa M. Milanowski J. (2015). Plasma circulating microRNA-944 and microRNA-3662 as potential histologic type-specific early lung cancer biomarkers. Transl. Res.166, 315–323. 10.1016/j.trsl.2015.05.009
44
Powrózek T. Mlak R. Dziedzic M. Małecka-Massalska T. Sagan D. (2017). Analysis of primary-miRNA-3662 and its mature form may improve detection of the lung adenocarcinoma. J. Cancer Res. Clin. Oncol.143, 1941–1946. 10.1007/s00432-017-2444-0
45
Rodriguez A. Griffiths-Jones S. Ashurst J. L. Bradley A. (2004). Identification of mammalian microRNA host genes and transcription units. Genome Res.14, 1902–1910. 10.1101/gr.2722704
46
Ronchetti D. Lionetti M. Mosca L. Agnelli L. Andronache A. Fabris S. et al (2008). An integrative genomic approach reveals coordinated expression of intronic miR-335, miR-342, and miR-561 with deregulated host genes in multiple myeloma. BMC Med. Genomics1, 37. 10.1186/1755-8794-1-37
47
Schanen B. C. Li X. (2011). Transcriptional regulation of mammalian miRNA genes. Genomics97, 1–6. 10.1016/j.ygeno.2010.10.005
48
Seitz H. Royo H. Bortolin M.-L. Lin S.-P. Ferguson-Smith A. C. Cavaillé J. (2004). A large imprinted microRNA gene cluster at the mouse dlk1-gtl2 domain. Genome Res.14, 1741–1748. 10.1101/gr.2743304
49
Steiman-Shimony A. Shtrikman O. Margalit H. (2018). Assessing the functional association of intronic miRNAs with their host genes. RNA24, 991–1004. 10.1261/rna.064386.117
50
Tomé M. López-Romero P. Albo C. Sepúlveda J. C. Fernández-Gutiérrez B. Dopazo A. et al (2011). miR-335 orchestrates cell proliferation, migration and differentiation in human mesenchymal stem cells. Cell Death Differ.18, 985–995. 10.1038/cdd.2010.167
51
Vandesompele J. De Preter K. Pattyn F. Poppe B. Van Roy N. De Paepe A. et al (2002). Accurate normalization of real-time quantitative RT-PCR data by geometric averaging of multiple internal control genes. Genome Biol.3, RESEARCH0034. 10.1186/gb-2002-3-7-research0034
52
Varrault A. Eckardt S. Girard B. Le Digarcher A. Sassetti I. Meusnier C. et al (2018). Mouse parthenogenetic embryonic stem cells with biparental-like expression of imprinted genes generate cortical-like neurons that integrate into the injured adult cerebral cortex. Stem Cells36, 192–205. 10.1002/stem.2721
53
Westholm J. O. Lai E. C. (2011). Mirtrons: microRNA biogenesis via splicing. Biochimie93, 1897–1904. 10.1016/j.biochi.2011.06.017
54
Xue B. Chuang C.-H. Prosser H. M. Fuziwara C. S. Chan C. Sahasrabudhe N. et al (2021). miR-200 deficiency promotes lung cancer metastasis by activating Notch signaling in cancer-associated fibroblasts. Genes Dev.35, 1109–1122. 10.1101/gad.347344.120
55
Yang D. Lutter D. Burtscher I. Uetzmann L. Theis F. J. Lickert H. (2014). miR-335 promotes mesendodermal lineage segregation and shapes a transcription factor gradient in the endoderm. Development141, 514–525. 10.1242/dev.104232
56
Yeo N. C. Chavez A. Lance-Byrne A. Chan Y. Menn D. Milanova D. et al (2018). An enhanced CRISPR repressor for targeted mammalian gene regulation. Nat. Methods15, 611–616. 10.1038/s41592-018-0048-5
57
Yi B. Wang S. Wang X. Liu Z. Zhang C. Li M. et al (2022). CRISPR interference and activation of the microRNA-3662-HBP1 axis control progression of triple-negative breast cancer. Oncogene41, 268–279. 10.1038/s41388-021-02089-6
58
Yusa K. Zhou L. Li M. A. Bradley A. Craig N. L. (2011). A hyperactive piggyBac transposase for mammalian applications. Proc. Natl. Acad. Sci.108, 1531–1536. 10.1073/pnas.1008322108
59
Zhao Y. Dai Z. Liang Y. Yin M. Ma K. He M. et al (2014). Sequence-specific inhibition of microRNA via CRISPR/CRISPRi system. Sci. Rep.4, 3943. 10.1038/srep03943
60
Zhao J. Ma W. Zhong Y. Deng H. Zhou B. Wu Y. et al (2021). Transcriptional inhibition of lncRNA gadd7 by CRISPR/dCas9-KRAB protects spermatocyte viability. Front. Mol. Biosci.8, 652392. 10.3389/fmolb.2021.652392
61
Zhu L. Chen L. Shi C.-M. Xu G.-F. Xu L.-L. Zhu L.-L. et al (2014). MiR-335, an adipogenesis-related MicroRNA, is involved in adipose tissue inflammation. Cell Biochem. Biophys.68, 283–290. 10.1007/s12013-013-9708-3
Summary
Keywords
microRNA, CRISPRa, CRISPRi, promoter, Mest/PEG1, miR-335, miR-3662, embryonic stem (ES) cell
Citation
Kumar P, Courtes M, Lemmers C, Le Digarcher A, Coku I, Monteil A, Hong C, Varrault A, Liu R, Wang L and Bouschet T (2023) Functional mapping of microRNA promoters with dCas9 fused to transcriptional regulators. Front. Genet. 14:1147222. doi: 10.3389/fgene.2023.1147222
Received
18 January 2023
Accepted
18 April 2023
Published
05 May 2023
Volume
14 - 2023
Edited by
Mohammadreza Hajjari, Shahid Chamran University of Ahvaz, Iran
Reviewed by
Martin Seifert, Connexome GmbH, Germany
Lirong Wang, University of Pittsburgh, United States
Updates
Copyright
© 2023 Kumar, Courtes, Lemmers, Le Digarcher, Coku, Monteil, Hong, Varrault, Liu, Wang and Bouschet.
This is an open-access article distributed under the terms of the Creative Commons Attribution License (CC BY). The use, distribution or reproduction in other forums is permitted, provided the original author(s) and the copyright owner(s) are credited and that the original publication in this journal is cited, in accordance with accepted academic practice. No use, distribution or reproduction is permitted which does not comply with these terms.
*Correspondence: Runhua Liu, runhua@uab.edu; Lizhong Wang, lwang12@uab.edu; Tristan Bouschet, tristan.bouschet@igf.cnrs.fr
‡These authors have contributed equally to this work and share first authorship
† Present address: Charles Hong, University of Maryland School of Medicine, Baltimore, MD, United States
Disclaimer
All claims expressed in this article are solely those of the authors and do not necessarily represent those of their affiliated organizations, or those of the publisher, the editors and the reviewers. Any product that may be evaluated in this article or claim that may be made by its manufacturer is not guaranteed or endorsed by the publisher.