
94% of researchers rate our articles as excellent or good
Learn more about the work of our research integrity team to safeguard the quality of each article we publish.
Find out more
ORIGINAL RESEARCH article
Front. Genet., 10 February 2023
Sec. Cancer Genetics and Oncogenomics
Volume 14 - 2023 | https://doi.org/10.3389/fgene.2023.1094838
 Tongzuan Chen1†
 Liqian zhao2†
 Junbo Chen3†
 Gaowei Jin4†
 Qianying Huang3Ming Zhu1Ruixia Dai4Zhengxi Yuan3Junshuo Chen5Mosheng Tang6
 Tongke Chen7
 Xiaokun Lin8Weiming Ai7*Liang Wu9*Xiangjian Chen1*Le Qin10*
Gastric cancer (GC) is highly heterogeneous and GC patients have low overall survival rates. It is also challenging to predict the prognosis of GC patients. This is partly because little is known about the prognosis-related metabolic pathways in this disease. Hence, our objective was to identify GC subtypes and genes related to prognosis, based on changes in the activity of core metabolic pathways in GC tumor samples. Differences in the activity of metabolic pathways in GC patients were analyzed using Gene Set Variation Analysis (GSVA), leading to the identification of three clinical subtypes by non-negative matrix factorization (NMF). Based on our analysis, subtype 1 showed the best prognosis while subtype 3 exhibited the worst prognosis. Interestingly, we observed marked differences in gene expression between the three subtypes, through which we identified a new evolutionary driver gene, CNBD1. Furthermore, we used 11 metabolism-associated genes identified by LASSO and random forest algorithms to construct a prognostic model and verified our results using qRT-PCR (five matched clinical tissues of GC patients). This model was found to be both effective and robust in the GSE84437 and GSE26253 cohorts, and the results from multivariate Cox regression analyses confirmed that the 11-gene signature was an independent prognostic predictor (p < 0.0001, HR = 2.8, 95% CI 2.1–3.7). The signature was found to be relevant to the infiltration of tumor-associated immune cells. In conclusion, our work identified significant GC prognosis-related metabolic pathways in different GC subtypes and provided new insights into GC-subtype prognostic assessment.
Gastric cancer (GC) is a common malignancy and is considered a main contributor to cancer-related deaths throughout the world (Erratum, 2020). GC classification is typically done via the Lauren or WHO classifications, as well as the TNM grading system, according to the clinicopathologic characteristics. This, to a large degree, dictates appropriate therapy (Ajani et al., 2016; Daum et al., 2020). GC is a heterogeneous disease (Chia and Tan, 2016). Tumor heterogeneity indicates the presence of differences between patients with one type of malignancy or among the tumor cells of one patient, with variations in both genotype and phenotype. As such, patient prognosis can vary significantly, even when patients present with similar clinical characteristics and receive similar treatments. This typically signifies that the use of clinicopathologic factors and the current classification systems are ineffective for accurate prognosis prediction and risk-stratified analyses (Shah and Ajani, 2010; Noh et al., 2014). Hence, it is of great importance to identify new signatures, with higher accuracy of prediction, to improve the prognosis of GC patients.
Metabolic reprogramming is a major feature of solid tumors, and it contributes directly to the malignancy of tumors through the processes of metastasis, invasion, and disease progression (Boroughs and DeBerardinis, 2015; Sun et al., 2018). As described above, GC tissues are highly heterogeneous. This applies also to metabolic heterogeneity, which represents metabolic heterogeneity and flexibility between tumors or even different regions of the same solid tumor (Sathe et al., 2020; Sexton et al., 2020). Furthermore, tumor metabolites can reshape the tumor microenvironment (TME) mediated by various metabolic signaling pathways that promote tumorigenesis (Jiang et al., 2019; Xiang et al., 2019). Brand et al. (2016) discovered that LDHA-derived lactate reduced the ability of T cells and NK cells to conduct immune surveillance of cancer cells. Furthermore, Leone et al. (2019) reported the activation of different metabolic pathways through the blockage of glutamine in cancer cells to overcome immune invasion. Increasing evidence highlights the profound significance of metabolic heterogeneity in GC, which may explain the challenges faced by current therapeutics and in the prediction of clinical outcomes of GC patients (Zhang et al., 2020a; Zhu et al., 2021a). Given that there is still much to learn about the metabolic heterogeneity of GC, it is critical to explore and identify new potential metabolic signatures related to GC prognosis.
In our research, we established subtypes of GC based on genes associated with a number of core metabolic pathways, including, but not limited to, glycolysis, nucleic acid metabolism, amino acid metabolism, and lipid metabolism in tumors, using normalized RNA-Seq data from the public databases Gene Expression Omnibus (GEO) and The Cancer Genome Atlas (TCGA). We further analyzed the genomic distinctions of these molecular isoforms to assess their potential roles in prognosis prediction. To achieve this, we generated a model of risk prognostication using differentially expressed genes (DEGs) between the different GC forms, with verification of selected DEGs in clinical samples using qRT-PCR. Moreover, we explored the relationship between immune cell infiltration and our newly developed model and analyzed further biological characteristics and functional enrichment of the DEGs. Lastly, the stability of the risk model was validated using an external database. In summary, we analyzed the metabolic features of GC, integrating these with the current clinicopathologic characteristics and grading system for GC. A predictive model based on specific genetic features was developed, and the incorporated genes may serve as potential therapeutic targets for GC as well for accurate prediction of patient outcomes.
We collected the original gene expression profiling data of tumor and adjacent normal tissues, as well as the clinical characteristics of GC cohorts from the Gene Expression Omnibus (http://www.ncbi.nlm. nih.gov/geo/) database (Barrett et al., 2013). After the removal of samples without complete survival information, 865 GC samples and patient information were included in the analysis. This included patients from the GSE84437 and GSE26253 cohorts. We used the 865 GEO GC study cohort with 865 patient information for validation of our prognostic model. The GC RNA-Seq data, as well as corresponding clinical data (415 tumor and 34 para-tumor samples), were extracted from The Cancer Genome Atlas (TCGA, https://portal.gdc.cancer.gov/) website (Wang et al., 2016). The format of the downloaded data was HTSeq-Counts and was normalized and preprocessed using uniform log2 (exprset+1). A filtered sample of 350 patients was included in the study. The TCGA data filtering criteria were as follows: 1. complete prognostic information; 2. survival time > 1 month; 3. patients with both GC and healthy volunteer transcriptome data; 4. removal of duplicate and normal samples. Genomics data were also obtained from the TCGA database, and after the removal of unmatched patients, the genomic data of 348 patients were included in our final analysis. Table 1 summarizes the clinical baseline information of all cohorts used in this study.
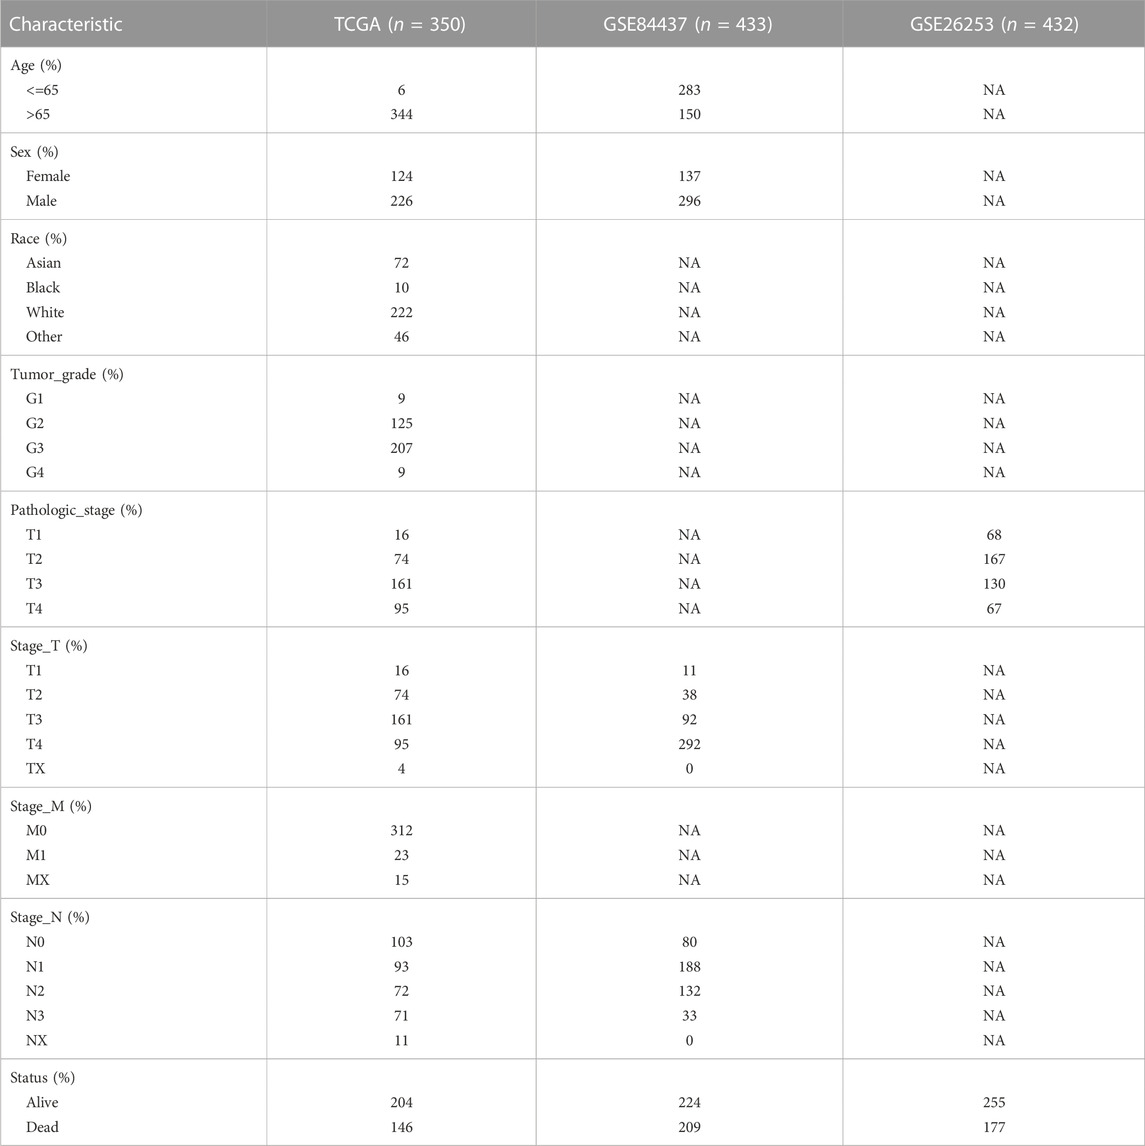
TABLE 1. Clinical baseline information of patients from TCGA and GEO.
Moreover, the single-cell transcriptome dataset GSE184198 was selected from the GEO Datasets of NCBI, and the tumor sample GSM5580154 was extracted. The single-cell transcriptome data were processed using the Seurat package. Firstly, the single-cell data were subjected to cell quality control and low-quality cells were filtered out. Cells with ribosomal gene expression percentage greater than 20% and red blood cell gene expression percentage greater than 3% were removed, and 9,383 cells that met the criteria were screened out. The NormalizeData function was used to normalize the single cell data, the FindVariableFeatures function was used to find hypervariable genes, and the ScaleData function was used to normalize the hypervariable genes. The principal component analysis (PCA) was performed using the hypervariable genes. Cells were clustered by the FindNeighbors function and FindClusters function. The annotation results were divided into epithelial cells, B cells, T cells and other cell types. Using the scMetabolism package, each cell was scored using the VISION algorithm to derive activity scores for different cell types in different metabolic pathways (Wu et al., 2022).
Metabolism-related genes were identified from the Molecular Signatures Database (MSigDB) (https://www.gsea-msigdb.org/gsea/msigdb/index.jsp) (Subramanian et al., 2005). Overall, 12 metabolic gene sets were obtained, which included the reactome pyrimidine catabolism, reactome pentose phosphate pathway, reactome purine catabolism, reactome metabolism of amino acids and derivatives, reactome citric acid/TCA cycle and respiratory electron transport, reactome glycogen metabolism, reactome metabolism of lipids, reactome fatty acid metabolism, reactome glutamate and glutamine metabolism, reactome pyruvate metabolism, reactome glucose metabolism, and reactome metabolism of nucleotides.
Evaluation of the relative enrichment of select genomes was conducted using Gene set variation analysis (GSVA), which is generally employed to reflect pathway variation across a sample population (Hanzelmann et al., 2013). Functional enrichment and pathway analyses, which cluster genes with similar functions and correlate them with biological phenotypes, were executed with the R package “cluster Profiler” (Yu et al., 2012).
The “limma” package in R was used to examine DEGs between tumors and adjacent normal tissues (Ritchie et al., 2015). The DEG filter threshold was set at |log2 FC (fold-change)| >1 and p < 0.05. In order to obtain more DEGs, we relaxed the DEG screening standards, i.e., we chose the pre-correction p-value, because we could tolerate the problem of excessive false positives, since this evaluation would be followed up with more stringent gene screening criteria, such as, univariate cox regression, random forest, and lasso regression to identify the most critical DEG metabolism-related genes.
The “Cell-type Identification By Estimating Relative Subsets Of RNA Transcripts (CIBERSORT)” (Newman et al., 2015) (https://cibersort.stanford.edu) algorithm was used to predict immune cell infiltration in the GC samples. After entering the expression data of the samples, the proportions of 22 types of infiltrating immune cells were obtained. CIBERSORT was used to calculate the p-value, which was dependent on the Monte Carlo permutation test. Lastly, p < 0.05 was considered significant.
We next assessed the 12 metabolic gene sets in MSigDB, including reactome pyrimidine catabolism, reactome pentose phosphate pathway, reactome purine catabolism, reactome metabolism of amino acids and derivatives, reactome citric acid/TCA cycle and respiratory electron transport, reactome glycogen metabolism, reactome metabolism of lipids, reactome fatty acid metabolism, reactome glutamate and glutamine metabolism, reactome pyruvate metabolism, reactome glucose metabolism, and reactome metabolism of nucleotides. After merging of the genes and removing duplicates, a total of 1,489 metabolism-related genes were selected. We conducted consensus clustering using NMF to identify different metabolic preference patterns, based on the expression of 1,489 regulators. The expression of 1,489 metabolic regulators [Matrix V, Gene (F) × Patient (N): 1,489 × 350] was factorized into 2 non-negative matrices W [Gene (F) × Patient program (K): 1,489 × 3] and H [Expression program (K) × Patient (N): 3 × 350] (i.e., V ≈ WH). Specifically, we decompose the matrix V into a basis matrix W and a coefficient matrix H. On the one hand, the basis matrix W is characterized by patient programs: each one of patient programs is a vector in W. On the other hand, each column vector of the coefficient matrix H can be regarded as the coordinates obtained by projecting the corresponding column vector of the matrix V onto W: each expression program is a row in H. Repeated factorization of matrix V was performed, and its outputs were aggregated to obtain consensus clustering of GC samples. The optimal number of clusters was then selected, according to the cophenetic, dispersion, and silhouette coefficients. The R package ‘NMF’ (version 0.23.0) with the brunet algorithm and 100 n runs were used to perform the consensus clustering.
To further identify prognosis-related genes in GC, we initially screened 412 significant genes by univariate Cox proportional-hazards regression analysis of NMF_corDEGs (1841 DEGs among 3 metabolic subtypes) using the “coxph” function in the “survival” R package. To eliminate multicollinearity among these candidate genes, we applied LASSO regression with optimal penalty parameters and minimum 10-fold cross-validation to screen 30 independent prognosis-related genes. Subsequently, the “randomForestSRC” R package was used to reduce the size of candidate genes based on their variable importance (VIMP) and minimum depth (Ishwaran et al., 2014). Only genes with VIMP > 0.01 along with their corresponding minimum depth were selected, and a total of 26 genes were obtained after intersection with the LASSO regression results. After further adjustment, multivariate Cox regression (stepwise model) was performed to identify the pivotal genes, and finally, 11 gene signatures were obtained. At this point, glmnet package is used for lasso regression analysis, and My stepwise package is used for Cox model building The coefficients obtained from the regression algorithm were used to obtain the risk scores based on the following formula: riskscore = valGene1*β1 + valGene2*β2 + ⋯+ valGenen*βn. Furthermore, according to the above formula, the risk scores of GC patients were calculated separately, and the patients were divided into high-risk and low-risk groups using the median as the cut-off value (Sullivan et al., 2004).
Five matched GC tissue samples from patients who were diagnosed at the Department of Gastrointestinal Surgery of the First Affiliated Hospital of Wenzhou Medical University were obtained between October 2021 and January 2022. The distance between the tumor tissue and adjacent normal tissue was > 5 cm. This study received approval from the Institutional Ethics Committees of the First Affiliated Hospital of Wenzhou Medical University and followed the guidelines of the Declaration of Helsinki. The ethics ID number related to experiments in this study is 2019–089. All participants were fully informed and signed informed consent forms prior to participating in this research. Total RNAs from the tumor and adjacent tissues of GC patients were extracted using TRIzol reagent (Invitrogen). The cDNA synthesis was done via Taq DNA Polymerase (Bio-Rad) and the qRT-PCR was performed on the CFX96 optics module connected to a C1000 thermocycler system (Bio-Rad). β-actin was used as internal control, and fold change (2−△△CT) was used to express the relative gene expression. The primer sequences are listed in Supplementary Table S1.
R software (version 4.0.1) was used for all statistical analyses, and the χ2 test was used for analysis of differences between two groups of categorical variables. Student’s t-test or Wilcoxon rank-sum test was used for conducting differential comparisons. One-way analysis of variance or the Kruskal–Wallis test was used to conduct differential comparisons of multiple groups. The Kaplan–Meier method and the log-rank test were used for survival analyses. p < 0.05 was considered statistically significant.
The detailed pipeline of the study design is illustrated in Figure 1A, and a summary of the main work and findings is shown in Figure 1B. First, we investigated the activation and deactivation of 12 major metabolic pathways in GC samples using GSVA. The 12 major pathways included the reactome pyrimidine catabolism, reactome pentose phosphate pathway, reactome purine catabolism, reactome metabolism of amino acids and derivatives, reactome citric acid/TCA cycle and respiratory electron transport, reactome glycogen metabolism, reactome lipid metabolism, reactome fatty acid metabolism, reactome glutamate and glutamine metabolism, reactome pyruvate metabolism, reactome glucose metabolism, and reactome nucleotide metabolism (Figure 2A). In addition, metabolic analysis of these 12 pathways in the single-cell dataset showed that most metabolic pathways were enriched in epithelial cell types (Supplementary Figure S1D, E). These highlight the presence of marked metabolic heterogeneity in GC samples.
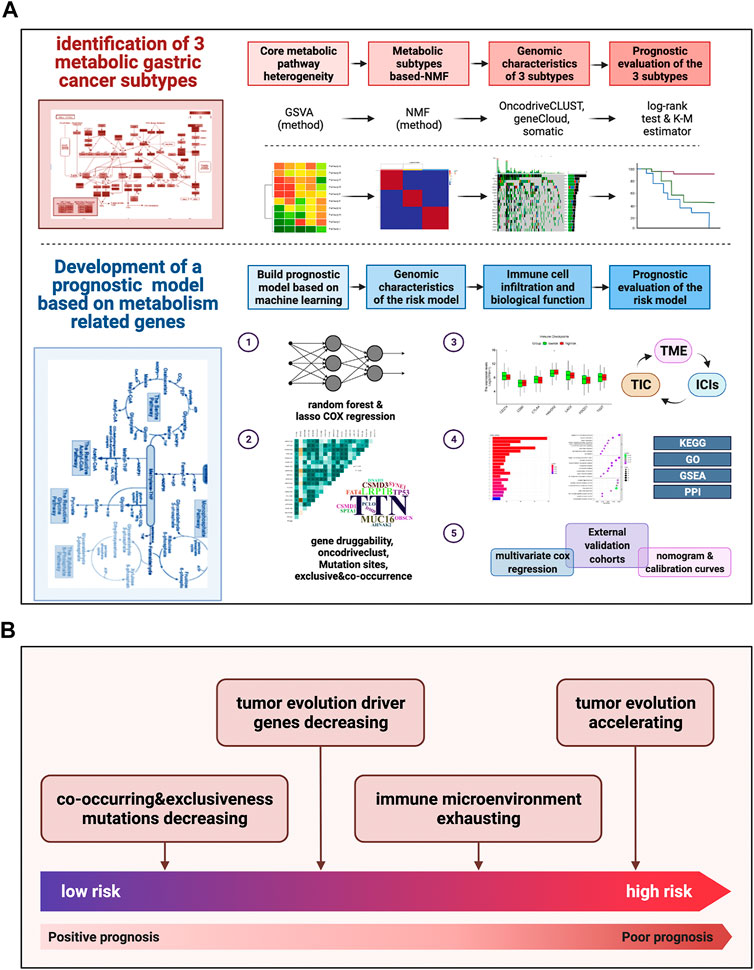
FIGURE 1. Pipeline of the study design and a summary of main work and findings (A) Our detailed pipeline of the study design. (B) A summary of our main work and findings.
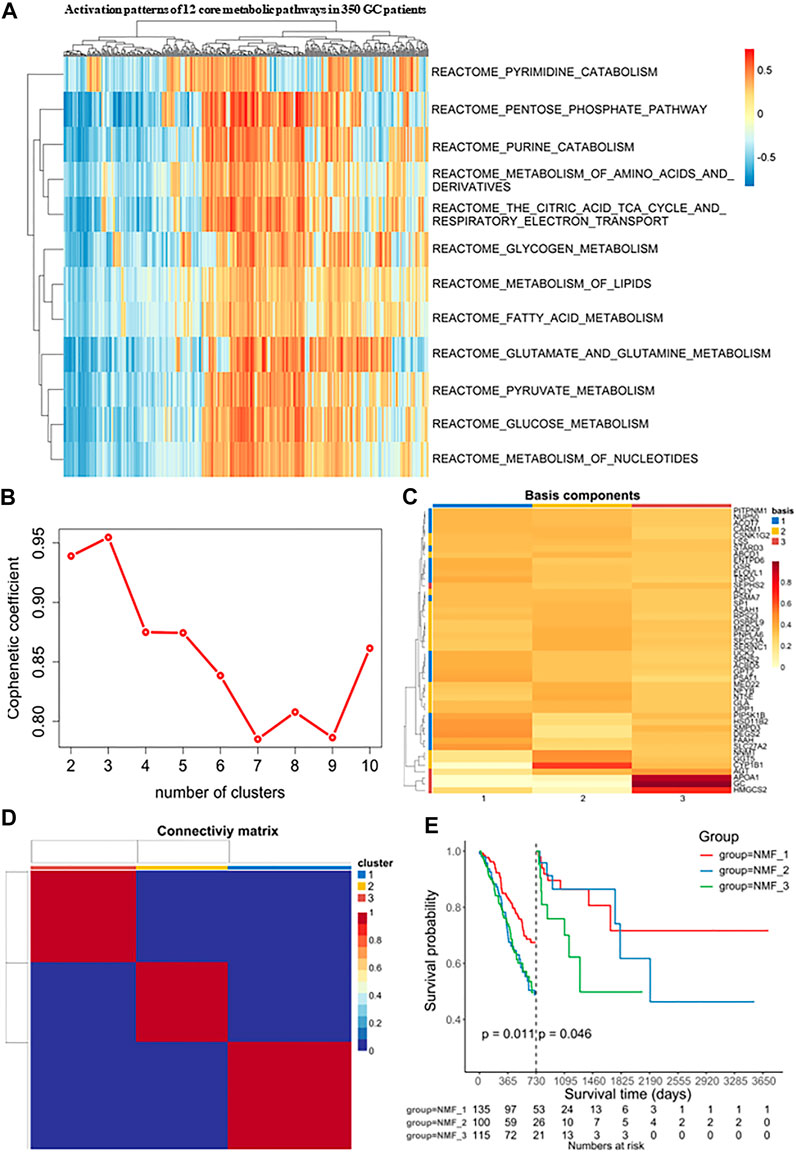
FIGURE 2. Identification of molecular isoforms for metabolic signatures of gastric cancer based on NMF (A) Heatmap of enrichment score of 12 main metabolic pathways gene sets in GC and adjacent non-tumor samples, which demonstrated metabolic heterogeneity among patients with gastric cancer. (B) The optimal number of clusters was selected with factoextra package. (C) Classification of expression profiles into 3 categories based on signature levels using NMF. (D) GC samples were clustered by non-negative matrix factorization (NMF) method. (E) Survival analysis was used to evaluate the different survival patterns between metabolic subtypes.
Next, Consensus Cluster Plus was used to identify a variety of genes derived from the above pathways. At present, this algorithm is widely used in cancer research as a commonly used analysis method in NMF typing and can be used to determine the optimal number of clusters K. In our study, the clustering was deemed to be most robust at k = 3, where the steepest drop-off of the cophenetic correlation coefficients appeared (Figures 2B, C). The expression levels of these metabolism-related genes in the three GC subtypes is shown in a heatmap (Figure 2D). The three subtypes were distinguished using principal component analysis (PCA) and clustering (Supplementary Figure S1A). Additionally, it was clear that the prognoses associated with these subtypes were distinct. In the NMF_3 subtype, patient prognosis ranked the worst after two years (p = 0.046, Figure 2E) while the NMF_1 subtype showed the best outcomes after two years (p = 0.011, Figure 2E), with the NMF_2 group falling in between NMF_3 and NMF_1. To ensure the reproducibility of the Consensus Cluster Plus results, we validated the results using two external datasets, namely, GSE66229 and GSE26253. In the GSE66229 cohort, GC patients were also found to be clustered into three categories, and the prognosis of the three subtypes was significantly different (Supplementary Figure S1B-1, 2, 3). In the GSE26253 cohort, the Kaplan-Meier curves of the three subtypes showed slight differences in survival outcomes, although the differences were non-significant possibly due to insufficient sample size or the high heterogeneity of GC (Supplementary Figure S1C-1, 2, 3).
In order to analyze and visualize mutation(s) in somatic cells of the three GC subtypes, we utilized the R package “maftools”. The genomic data of 348 patients were analyzed, including those of 135 NMF_1 patients, 98 NMF_2 patients, and 115 NMF_3 patients. As depicted in the waterfall plot in Figure 3A, different colors were used to distinguish between different types of mutations and show detailed information on the mutants in each sample. The results showed that the top three mutated genes in patients in the NMF_1 subtype were TTN (66%), MUC16 (41%), and TP53 (41%), while those in NMF_2 patients were TTN (47%), TP53 (44%), and LRP1B (31%), and those in NMF_3 were TP53 (54%), TTN (40%), and MUC16 (20%). These results also demonstrated that in the three groups, GC patient prognosis was negatively correlated with increased incidence of mutated TP53 and positively correlated with increased mutations in TTN and MUC16. Meanwhile, word clouds were drawn with the size of scripts reflecting the numbers of mutant genes in the samples (Figure 3B). It was apparent that there were a greater number of mutations in the NMF_1-subtype were counted the most while, while NMF_3 had the fewest. Interestingly, patients carrying more mutations had a more favorable prognosis while those with fewer mutations tended to have unfavorable outcomes. This finding is consistent with the results of a report from JAMA Oncology, which concluded that MUC16 mutations were associated with increased numbers of mutations in tumors together with better survival outcomes in GC patients (Li et al., 2018). In addition, the correlations between somatic cell mutations in the different groups were analyzed. This showed that somatic cells of the NMF_1-subtype showed the highest incidence of chain mutation and unique mutations while the incidence of common and unique mutations was lowest in the NMF_3 subtype (Figure 3C). These data suggest the potential for analyzing mutations and their expression in developing treatments for GC. At this point, we inferred that the ratio of subtype-unique mutations to mutations in TP53, involving genes such as USH2A, PIK3CA, KMT2D, FAT4, and ARID1A, was positively related to patient prognosis. To confirm this, we performed a more comprehensive analysis with patient prognostic information. Associations between the most highly mutated genes in the three subtypes were then investigated. This identified three genes that were exclusively correlated with mutations in p53, namely, PIK3CA, KMT2D, and ARID1A (Supplementary Figure S2A). As expected, these three genes were positively correlated with GC patient prognosis, i.e., the higher the gene expression, the better the patient prognosis (Supplementary Figures S2B–D). In addition, we further explored the gene PIK3CA that was exclusively associated with TP53 mutations and occurred only in subtype 1 (suggesting an association with good prognosis). The GC patients were divided into four groups, namely, TP53-/PIK3CA-, TP53-/PIK3CA+, TP53+/PIK3CA-, and TP53+/PIK3CA+, and Kaplan-Meier analyses were conducted to estimate the prognostic impact of TP53 and PIK3CA mutations. This revealed that the patients in the TP53-/PIK3CA + group had better outcomes compared with the TP53+/PIK3CA-group, although the difference was non-significant on the log-rank test (Supplementary Figure S2E). This may have been due to insufficient sample size. In addition, we also identified the most common mutated gene in GC, MUC16, which showed a potentially exclusive mutational relationship with LRP1B. Hence, we divided the patients into the MUC16-/LRP1B+ and MUC16+/LRP1B- groups and performed survival analysis which showed that the former group experienced worse outcomes (Supplementary Figure S2F, log-rank test, p = 0.066). We also explored driver genes that drove mutations in the three subtypes and identified a new driver gene termed CNBD1 (Figure 3D). Interestingly, only a single evolutionary driver gene CNBD1 was present in the NMF_3 subtype with the worst outcomes. This was relevant to the malignancy and prognosis of GC. Survival analysis and log-rank tests were performed for CNBD1, showing that it was, indeed, associated with worse outcomes in patients with GC (Supplementary Figure S2G, p = 3.5e−05, HR = 1.62, 95%CI 1.28–2.03, n = 631). The result was also primarily intended to show that outcomes were ranked as NMF1 > NMF2 > NMF3, and that the evolutionary driver genes for the three subtypes also tended to vary from more to less in this process (Figure 3D). This observation was very interesting and suggested that the worse the prognosis of the patient, the greater the evolutionary pressure, and, therefore, the less the expression of the evolutionary driver genes. Furthermore, we carried out analyses on the druggability of the mutant genes in these subtypes, as well as the crosstalk between genes and drugs, thus displaying the latent classification of druggable genes (Supplementary Figure S2H). The identification of the evolutionary driver genes was mainly based on the Oncodrive CLUST (Tamborero et al., 2013).
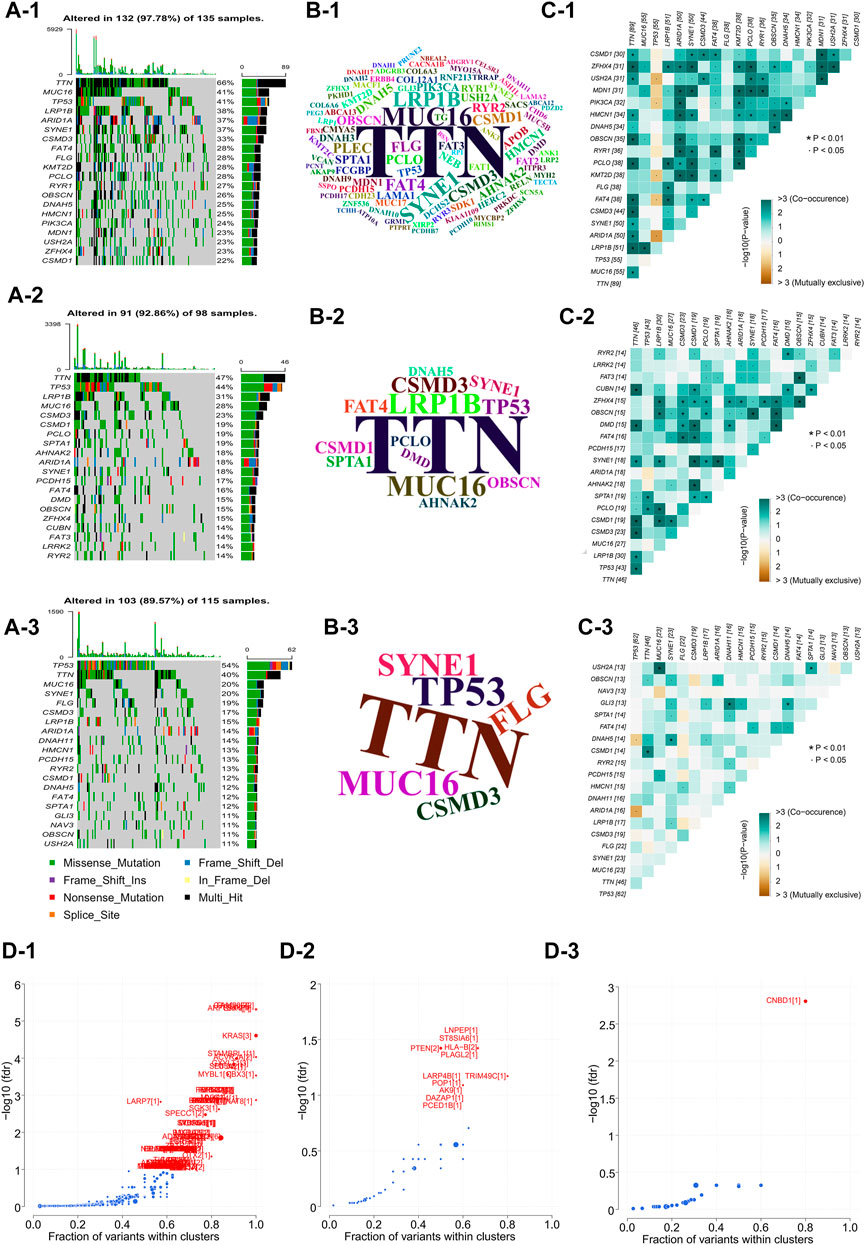
FIGURE 3. Comparison of inter-genomic differences between molecular isoforms (A) Waterfall plot of the top 20 mutant genes in the 3 metabolic subtypes (A-1: NMF_1, A-2: NMF_2, A-3: NMF_3). (B) Wordclouds were drawn with size of scripts bound up with amounts of samples containing certain mutant genes in the 3 metabolic subtypes (B-1: NMF_1, B-2: NMF_2, B-3: NMF_3). (C) Correlation heat map to show the degree of correlation between mutant genes in the 3 metabolic subtypes, suggesting that the worse the typing prognosis, the less correlated the mutation is (C-1: NMF_1, C-2: NMF_2, C-3: NMF_3). (D) Volcano map used to demonstrate mutation driver genes in the 3 metabolic subtypes (D-1: NMF_1, D-2: NMF_2, D-3: NMF_3).
Using the limma package in R with a threshold of p < 0.05 and absolute of |log2 FC| > 2, intersections in the expression of DEGs between two of the three subtypes were obtained (Figure 4A). This identified 1841 common DEGs which were analyzed by univariate Cox regression analysis to select meaningful genes to generate models (Figure 4B). Next, the glmnet package was used to conduct LASSO-Cox regression analysis. As shown in Figure 4C, the plot depicts the tracks of each independent variable. The results revealed that with a decrease in λ (lambda value), the number of coefficients of the independent variable close to 0 increased. We next used a 10-fold cross-validation to determine the best λ, and we observed that the regression coefficients of most of the variables stabilized when the λ was around −3.324. Hence, it was considered that the λ can be set to −3.324. Using this parameter, 29 genes were selected for subsequent analyses. The confidence intervals of each λ are displayed in Figure 4D. To identify genes with high prognostic importance in GC, we employed the randomForest R package to include prognostically relevant DEGs in the model, identifying 176 genes with high prognostic impact from 412 genes, and the intersection of these with the results of the LASSO regression was determined (Figure 4E). Additionally, stepwise multivariate Cox regression was used to further refine the number of relevant genes from 26 to 11. These 11 genes were SERPINE1, MEF2B, S100Z, AXIN2, IGFBP1, GRP, ADH4, APOH, KRT15, ADTRP, and ADRA1B (Figure 4F). After the final determination of the relevant genes, the risk scores of each sample in the training cohorts, based on their expression levels, were calculated and the patients were classified into high-risk or low-risk groups, according to the corresponding median scores. The overall survival (OS) rates of patients with high-risk scores were significantly lower than those with low-risk scores, indicating the association of high-risk scores with poor prognosis (Figure 4G). The performance of the prognostic prediction model was then analyzed using receiver operating characteristic (ROC) curves using the time ROC package. As shown in Figure 4H, the areas under the ROC curve (AUCs) were 0.71 (at 1 year), 0.77 (at 3 years), and 0.73 (at 5 years). The expression of the 11 signature genes was then verified using qRT-PCR (five matched clinical tissues of GC patients). The expression of these genes was found to be highly heterogeneous in GC samples (expression levels vary greatly across samples, Figure 4I). In addition to this, we also calculated the coefficient of variation for 5 matched clinical tissues of GC patients in cancerous and paraneoplastic tissues, which showed that these genes were more stably expressed in paraneoplastic tissues, but very unstably expressed in cancerous tissues (Figure 4J). These results further demonstrated the high heterogeneity of the expression of these genes in GC tissues.
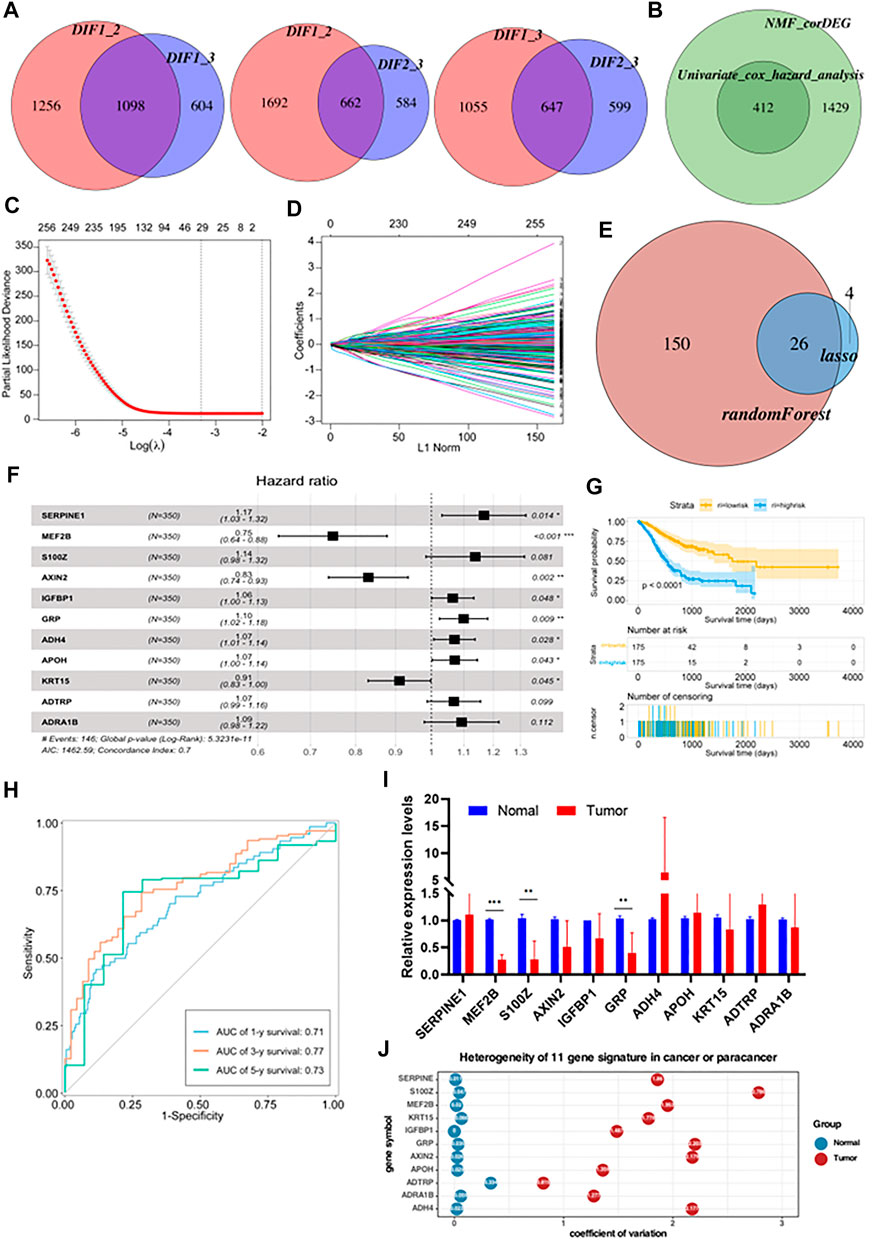
FIGURE 4. Construction of a prognostic risk model based on metabolism-related genes (A) The differential enrichment score of gene sets was calculated between each of the two subgroups and intersected them. Subtype 1, subtype 2 and subtype 3 had 1,098, 662 and 647 distinct gene sets, respectively. (B) Batch Cox regression analyses screening for prognosis-related differential genes. (C) The dotted vertical lines represent the optimal values of λ. The top x-axis has the numbers of gene sets, whereas the lower x-axis revealed the log (λ). (D) Least absolute shrinkage and selection operator (LASSO) coefficient profiles (y-axis) of the gene sets and the optimal penalization coefficient (λ) via 10-fold cross-validation based on partial likelihood deviance. (E) Take the intersecting genes after lasso and random-forest screening. (F) Constructing a stepwise Cox proportional hazards model. (G) Kaplan–Meier OS curves with difference detection by log-rank test for patients from the training datasets. (H) ROC curve analyses based on the 11 gene signature. (I) Relative expression levels of mRNA for 11 gene signature. (J) Coefficient of variation of 11 gene signature in cancer and paracancerous tissues.
Firstly, the waterfall plot in Figure 5A depicts a variety of color annotations that distinguish distinct mutation types and the mutations associated with groups with different risk scores. It was found that missense mutations, single nucleotide polymorphisms (SNPs), and C > T mutations were most common in the different categories (Supplementary Figure S3A, B). The frequencies of variants in the different samples were then illustrated using boxplots, finding that frameshift mutations were more common in groups with high-risk scores, compared with groups with lower risk scores (Supplementary Figure S3C, D). As shown in Supplementary Figure S3E, F, there appeared to be differences in gene druggability between patients with different risks, and in the crosstalk between drugs and genes in these patient samples. Next, we investigated DNA copy number variations (CNVs) in tumors to elucidate whether the characteristics of our risk models can serve as signatures for tumor development. The results demonstrated that the incidence of CNVs was higher in groups with high-risk scores, compared with those with low-risk scores, indicating lower genome-wide stability and higher mutation loads in groups with high risks (Figures 5B–1, 2). In addition, word clouds were used with script sizes reflecting the frequencies of mutant genes in the different samples (Figures 5C–1, 2). The word clouds showed that the groups with low-risk scores harbored the greatest numbers of mutant genes, while groups with high risk scores contained the fewest. Additionally, we also analyzed the correlation between different mutations in the somatic cells of patients with different risks. This revealed that in the somatic cells of low-risk patients, the incidence of chain mutation and mutually exclusive mutations accounted for the most mutated genes, while in the high-risk patients, the incidence of co-mutations and mutually exclusive mutations accounted for the fewest mutated genes (Figures 5D–1, 2). This was consistent with the conclusion of Figure 3C and highlighted the relationship between the number of mutant genes and the prognosis of GC patients. Apart from the above, we also observed that patients with different risks possessed different numbers of driver mutations (Figures 5E–1, 2).
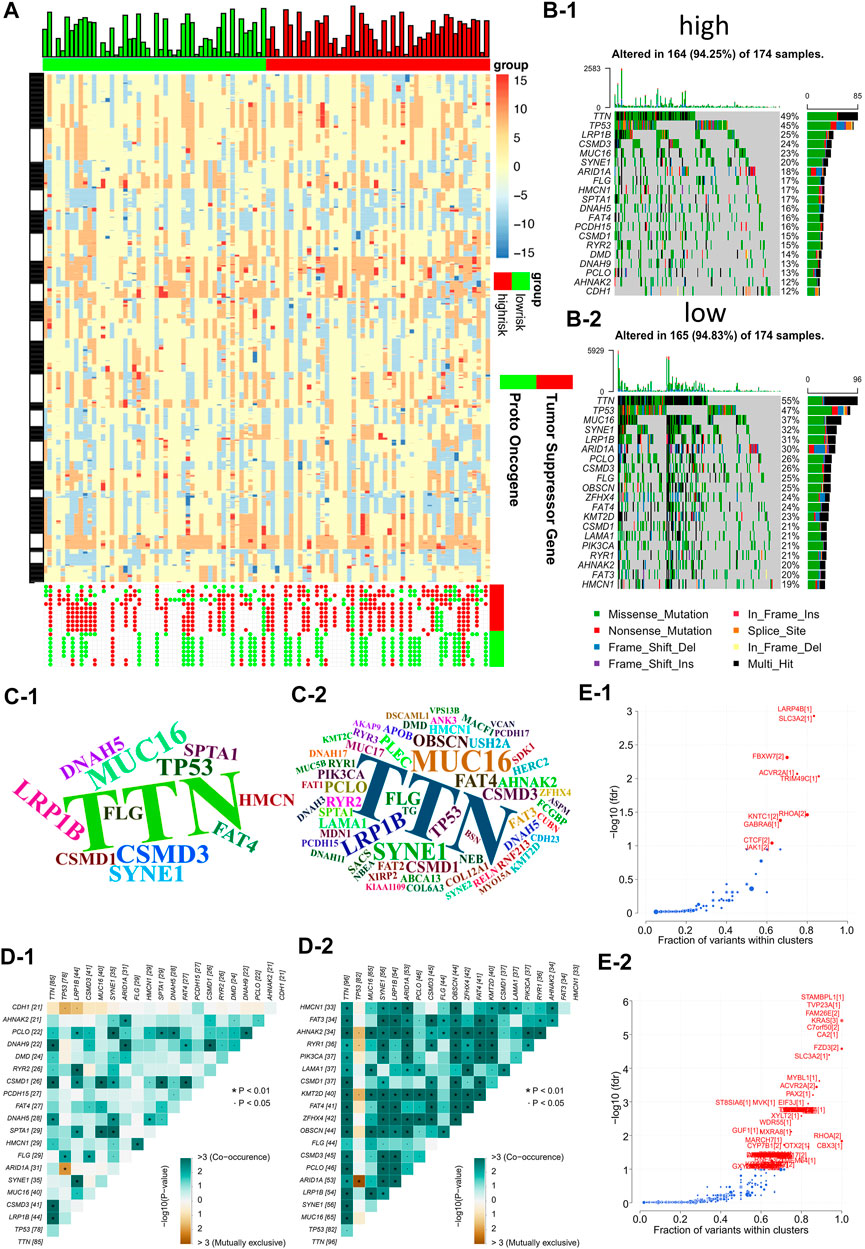
FIGURE 5. Risk models are associated with genomic instability (A) Comparing low and high risk group tumor sectors (top), bar chart showing the altered genome fraction (second top), heatmap showing differential copy number variations (CNV) level (middle) and copy number status of the selected genes showing significant deletion or amplification (bottom). (B) Waterfall plot of the top 20 mutant genes in the high and low risk groups (B-1: high risk group, B-2: low risk group). (C) Wordclouds were drawn with size of scripts bound up with amounts of samples containing certain mutant genes in the high and low risk groups (C-1: high risk group, C-2: low risk group). (D) Correlation heat map to show the degree of correlation between mutant genes in the high and low risk groups (D-1: high risk group, D-2: low risk group). (E) Volcano map used to demonstrate mutation driver genes in the high and low risk groups (E−1: high risk group, E−2: low risk group).
To identify the correlation between infiltration of immune cells and risk scores, the ESTIMATE-package was utilized to assess stromal, immune, and estimate scores. We first generated bar plots to show the proportions of 22 types of immune cells in GC samples (Supplementary Figure S4A). Next, we displayed the levels of these immune cells in samples with different risk scores using a heatmap (Supplementary Figure S4B). This showed marked differences in the infiltration scores of the immune cells between these samples, particularly, in terms of type Ⅱ macrophages, resting mastocytes, monocytes, resting NK cells, follicular helper T cells, and regulatory T cells (Figure 6A). Pearson correlations were analyzed using the cor. test function. Groups with high risks showed greater concentrations of M2 and mastocytes, implying deprivation of the immune microenvironment. To explore the tumor-associated immune cell crosstalk between high- and low-risk patients, a correlation heatmap of the 22 immune cell types was constructed. This showed differences in the immune microenvironments of groups with different risks (Figures 6B–1, 2). Meanwhile, we further probed the relationship between gene expression and infiltration of tumor-associated immune cells (TAICs) (Figure 6C). In addition, to ensure the reliability of the results, other immune scoring methods, namely, ssGSEA and MCP were also used to explore the differences in the immune microenvironment between the two groups (Supplementary Figure S4C, D). The results revealed that the two groups indeed had different microenvironments and immune cell interaction patterns. The levels of resting NK cells were positively associated with genes such as MEF2B, APOH, ADTRP, and ADH4, while the level of Tregs was negatively correlated with genes such as SERPINE1, S100Z, ADRA1B, and ADH4. Furthermore, we investigated the relationships between the risk models and immune checkpoints. The results showed that there were profound differences in CD274 (PD-L1) and HAVCR2 expression between the two groups (p < 0.05; Figure 6D). Importantly, the level of PD-L1 checkpoint was lower in the high-risk group, thus indicating that it is not appropriate to treat high-risk patients with PD-L1 inhibitors.
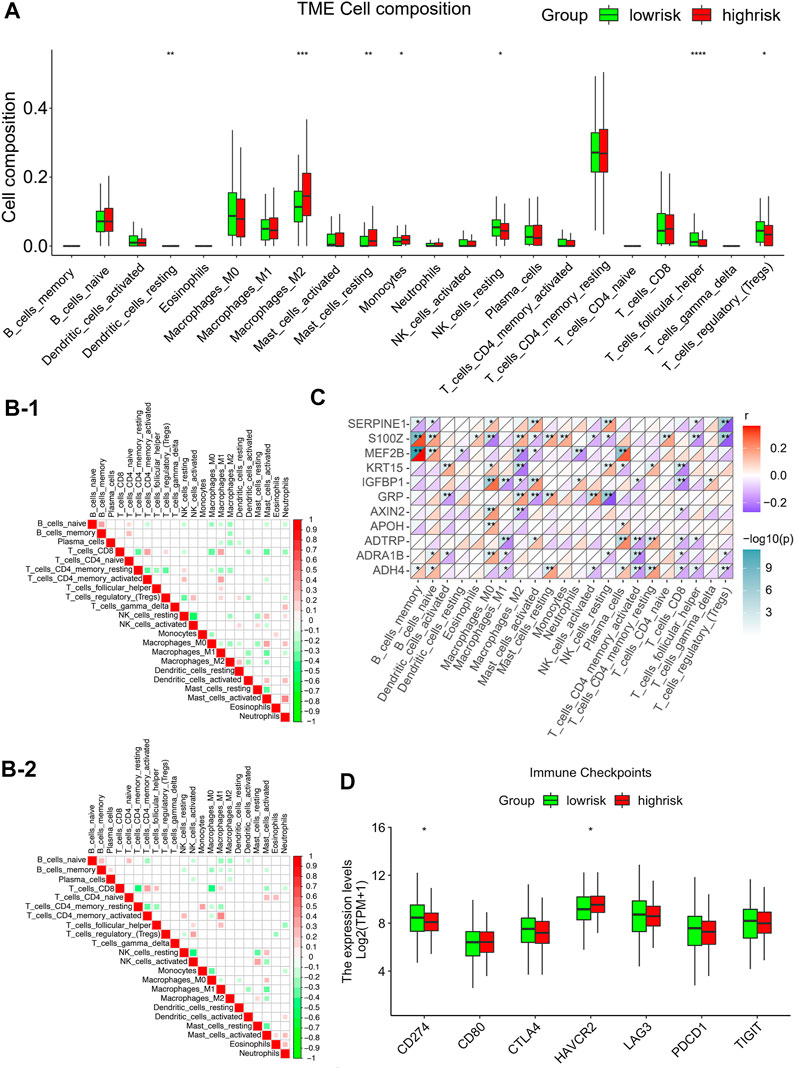
FIGURE 6. Correlations between infiltration of tumor-associated immune cells and risk modeling (A) Differential analysis of the level of infiltration of 22 immune cells in the high and low risk groups. (B) Different correlation patterns among 22 immune cell subsets in the high and low risk groups (B-1: high risk group, B-2: low risk group). (C) Heat map of the correlation between 11 gene signature and 22 immune cells. Red is used to represent the positive correlation between genes and immune cells, and blue is used to represent the p-value of the correlation between the two. (*p < 0.05; **p < 0.01; ***p < 0.001). (D) Expression of common immune checkpoints in high and low risk groups.
Enrichment analyses were then performed to investigate the underlying biological processes that affect the risk scores. Using the TCGA cohorts, 1,183 upregulated and 138 downregulated genes were identified between the high and low-risk subgroups (with a threshold of p < 0.05 and absolute of |log2 FC|> 2, Supplementary Figure S5A). KEGG and GO analyses indicated that these genes were primarily enriched in pathways such as neuroactive ligand-receptor interaction, cAMP signaling pathway, pancreatic secretion, olfactory transduction, and calcium signaling pathway, amongst others (Figure 7A). In addition, GO annotations revealed enrichment in the regulation of membrane potential, collagen-containing extracellular matrix, receptor-ligand activity, and signaling receptor activator activity, amongst others (Figure 7B). The functional networks between the DEGs were constructed using Cytoscape, and the potential biological networks affecting risk scores are shown in Figure 7C. Consistent with these findings, the results from GSEA demonstrated that samples with high risks were correlated with activation of typical carcinogenic characteristics, involving the EMT and the KRAS and MYC pathways, suggesting the underlying mechanisms associated with poor prognosis in the high-risk samples (Figure 7D). Furthermore, we constructed a gene-related network based on the risk scores-related DEGs. This showed that the expression of genes such as ALB, F2, APOA1, APOA2, APOA3, and AHSG was affected by risk scores (Figure 7E). The expression of these genes in terms of high and low-risk scores in tumor and normal tissues are shown in Supplementary Figure S5C, while the correlations between these genes and patient prognosis are shown in Supplementary Figure S5D.
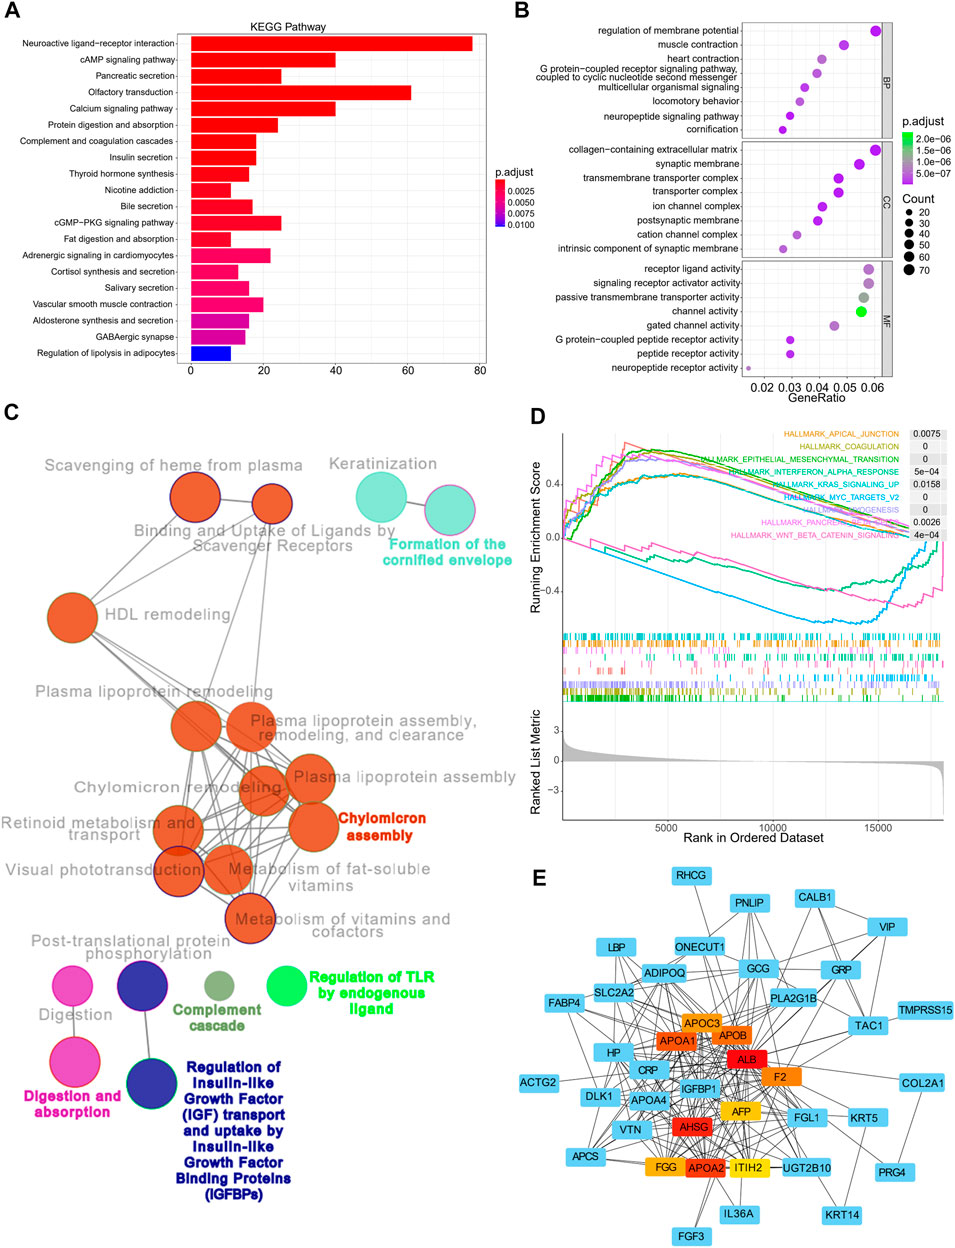
FIGURE 7. Functional annotation, genomic enrichment analysis of gastric cancer samples with different risks (A) KEGG enrichment analysis shows the top 20 pathways in high and low risk groups. (B) Dot plot shows enriched GO terms of upregulated 11 gene signature. (C) Functional access network shows transcriptome profiles of different risk groups. (D) GSEA enrichment analysis shows the 9 hallmarks gene sets in the high and low risk groups. (E) The protein–protein interaction network of the high and low risk groups.
To identify the robustness of the model, the same models and coefficients from the training cohorts were applied to the external cohorts. The risk scores of each sample were calculated according to their gene expression, and the distributions of the risk scores were analyzed. In the independent validation cohort GSE84437, the best cutoff point was employed for grouping. As shown in Figure 8A, the prognosis of high-risk patients (59 samples) was significantly worse than that of low-risk patients (374 samples) (p = 0.006). Meanwhile, the same analysis was conducted with the independent validation cohort GSE26253, and resulted in the same conclusion, i.e., the prognosis of the high-risk patients (349 samples) was significantly worse than that of low-risk patients (83 samples) (p = 0.0081; Figure 8B), thus, confirming the reliability of the model. The risk scores were then incorporated with the corresponding clinical characteristics, and the results from the univariate Cox regression analyses revealed a strong correlation between the risk scores and GC patient prognosis (Figure 8C). Multivariate Cox regression analysis further revealed that the risk score (p < 9.4e-13, HR = 2.8, 95%CI2.1–3.7) can serve as an independent risk factor for GC patient prognosis (Figure 8D). Interestingly, the multivariate analysis, in conjunction with the signature, showed that the originally meaningful TNM staging was no longer significant (p > 0.05). This suggests that the association between TNM staging and patient prognosis was influenced by metabolic signature, i.e., the effect of TNM staging on tumor prognosis may be acting through the metabolic signature. Apart from this, we also constructed a nomogram using the most essential variables in the multivariate analyses (Figure 8E). The nomogram showed that the risk score had the greatest impact on GC patient prognosis. This indicated that the risk model, based on 11 signature genes, was highly effective for prognostic prediction. Lastly, results from the calibration curve analyses showed that the calibration curve for prediction closely resembled the standard curves of survival at the 1-, 3-, and 5-year follow-ups, confirming the above conclusion (Figure 8F). Compared to nomograms for GC prognosis developed in previous studies, the present model was more accurate for prognosis prediction at the 1 and 3-year time points but, unfortunately, had worse predictive efficacy at the 5-year time point (Cai et al., 2020).
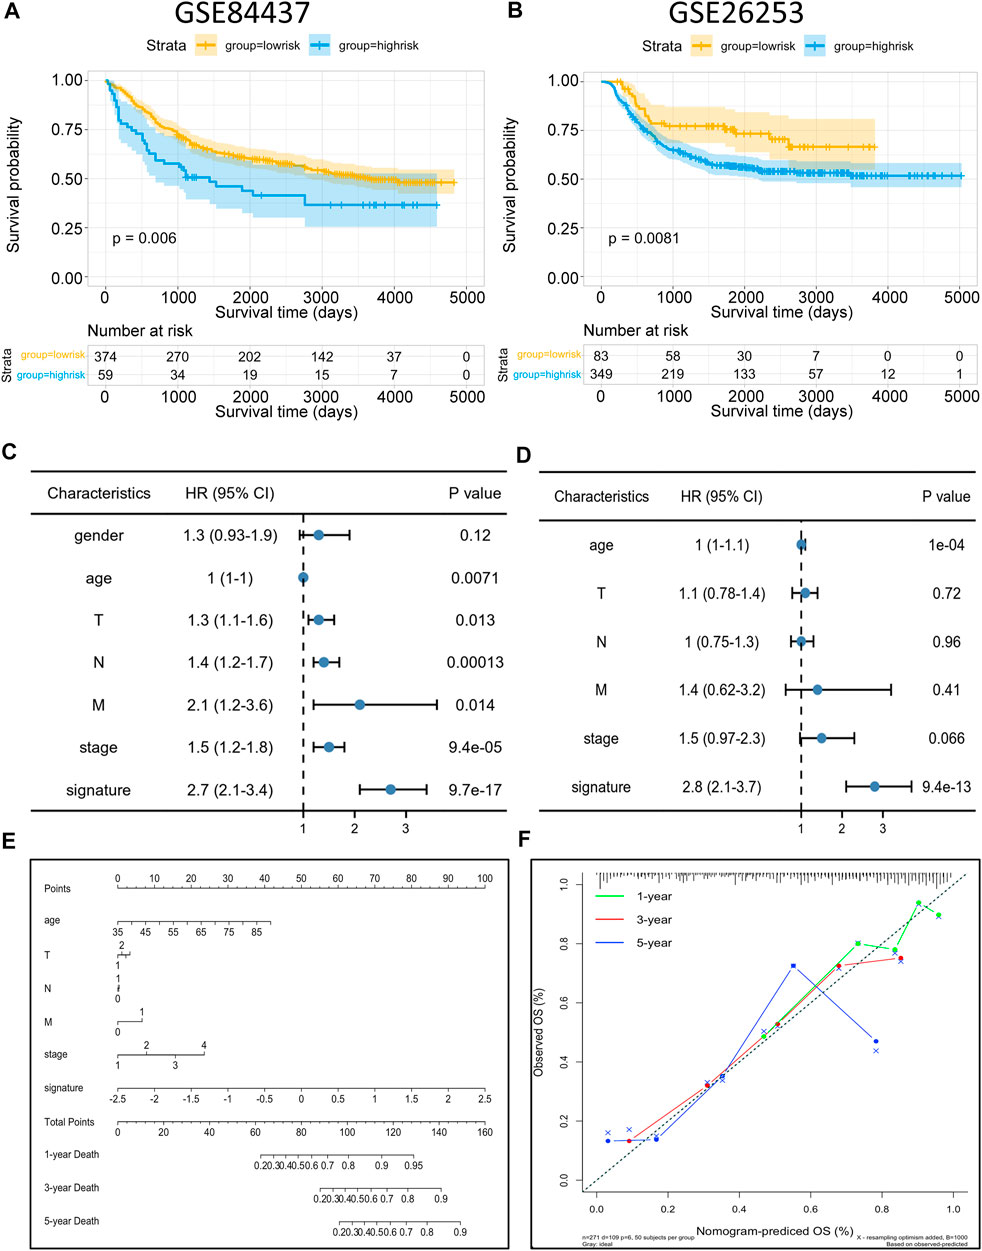
FIGURE 8. Risk model validation and nomogram construction (A,B) Kaplan–Meier OS curves with difference detection by log-rank test for patients from the validation datasets (GSE84437 and GSE26253). (C,D) Multivariate analysis of clinical and biological variables using Cox proportional hazards regression models, suggesting that 11 gene signature is the independent risk factors of prognosis of patients. (E) Composite nomogram prediction of 1-year, 3-year, and 5-year OS. (F) Calibration curves of observed and predicted probabilities for the nomogram.
Metabolic reprogramming promotes tumor occurrence and progression (Boroughs and DeBerardinis, 2015; Pavlova and Thompson, 2016). Metabolic phenotypes can aid in tumor imaging, prognosis determination, and cancer treatment (Vander Heiden and DeBerardinis, 2017). However, the application of tumor metabolism as one an indicator of clinical behavior requires clarification of the metabolic pathways that restrict cancer progression, as well as ascertaining the metabolic characteristics and heterogeneity of each patient with GC (Li et al., 2019).
While GC is known to be a highly heterogeneous disease, few studies have investigated its specific molecular subtypes. Zhang et al. (2016) reported 53 mutations in the microRNA-related molecular subtypes of GC but did not investigate the functional characteristics associated with these subtypes. Yang et al. (2021) described subtypes associated with high microsatellite instability but did not use multi-omics analysis, which is more meaningful for risk stratification of cancer patients. Jiang et al. reported ferroptosis-related molecular subtypes but did not further investigate the microenvironmental and genomic differences of these subtypes (Yang et al., 2021). Metabolism-related subtypes have been reported in other tumors, such as breast and colon cancer, but no metabolism-related molecular subtypes were previously reported in GC (Chong et al., 2021; Gong et al., 2021). In 2021, Gong et al. (2021) reported on the identification of metabolic subtypes of triple negative breast cancer, based on the core metabolic pathways of lipid metabolism, glycolysis, and nucleic acid metabolism. This demonstrated the metabolic heterogeneity of breast cancer.
Metabolic heterogeneity is one of the future trends in tumor research. However, there are reports on the metabolic heterogeneity of GC based on molecular typing (Kim and DeBerardinis, 2019; Martinez-Reyes and Chandel, 2021). In our study, we comprehensively analyzed core metabolic activities related to signature genes in GC samples. This helped broaden our insight into the metabolic characteristics and heterogeneity of each GC patient. Hence, it is essential to emphasize the distinctions between metabolic adaptations in individual GC patients. To begin our research, we clustered the patients into three subtypes, based on their expression of GSEA-signature genes related to various metabolic pathways, including glycolysis, lipid metabolism, amino acid metabolism, and nucleic acid metabolism. We observed that subtype-1 patients showed the best prognosis, while the other two subtypes had worse prognosis. Besides, we also discovered significant differences in genomic characteristics among the three subtypes and identified a new driver gene, CNBD1, that drove mutations in GC. The subtypes were ranked as NMF1 to NMF2 to NMF3 in terms of increasingly poor prognosis, and the evolutionary driver genes for the three subtypes also showed the same pattern of variation. This observation is very interesting and suggests that the worse the patient prognosis, the greater the evolutionary pressure and, therefore, the less the expression of evolutionary driver genes.
Most investigations into tumor metabolism have focused on a specific metabolic process in the patients (Huang et al., 2020; Xu et al., 2020), thus, ignoring the differences in combinations of metabolic preferences in each GC patient. For instance, a seven-gene signature was established, based only on glycolysis (Yu et al., 2020), and Zhou Zhu et al. identified six GC subtypes according to the cholesterol metabolism and glycolytic pathways (Zhu et al., 2021b). Apart from these, signatures based on lipid metabolism pathways have been shown to play important roles in the prognosis prediction of GC patients (Hu et al., 2020). In this study, we established three subtypes based on the distinct activity of core metabolic processes such as glycolysis, lipid metabolism, amino acid metabolism, and nucleic acid metabolism in GC samples. Of these three subtypes, subtype 1 was associated with good prognosis, while the remaining two subtypes were linked with poor prognosis. The differences between the poor-prognosis subtypes were apparent after two years, when it was clear that subtype 3 offered the worst outcome.
Tumors are complex regulatory systems, and the limitations of studies based on a single set of histological data are apparent. Thus, integrated analysis of high-throughput, multi-omics data, using multiple levels and sources, is imperative. Moreover, like other investigators, we also investigated the potential of the three metabolic subtypes in terms of genomics (Su et al., 2020). Our results were truly interesting in that they revealed that driver genes were more common in subtype 1 although subtype 1 was associated with the best prognosis. In contrast, subtype 3 patients experienced the worst prognosis, while having only one driver gene, CNBD1, with subtype 2 falling between subtypes 1 and 3 in both aspects. According to Li Qiangchun et al.’s work, CNBD1 drives a high incidence of mutations, including non-synonymous mutations, in genes, which is relevant to the prognosis of GC patients (Li et al., 2016). However, we demonstrated the role of CNBD1 in GC, where it functions as an evolutionary driver gene, resulting in metabolic changes leading to malignant changes and poor prognosis in GC patients. In addition, we also demonstrated that the patients with more mutations exhibited better prognosis while patients with fewer mutations had the opposite outcome, which is consistent with the results from JAMA Oncology (Li et al., 2018). PRIM1 may be associated with this mutation pattern (Zhu et al., 2021c). Furthermore, we examined the correlations between mutations in the somatic cells of the three subtypes. This showed that patients with more chain mutation and mutually exclusive mutations had a better prognosis, highlighting the relevance of the signatures in GC patient prognosis. Subsequently, we identified 412 prognosis-related DEGs in the different metabolic subtypes using gap analyses and univariate Cox regression. These genes were then incorporated into LASSO regression analysis and a random forest model, leading to the selection of 11 genes in the metabolism-related prognostic signature, including SERPINE1, MEF2B, S100Z, AXIN2, IGFBP1, GRP, ADH4, APOH, KRT15, ADTRP, and ADRA1B. The model based on these genes was found to be both effective and robust in different patient cohorts, and multivariate Cox regression showed that the model could serve as an independent predictor of prognosis in GC patients. Additionally, we constructed a nomogram for the prediction of patient OS, and the efficacy of the nomogram was further confirmed using calibration curve analyses. In terms of the KEGG enrichment analysis, the 11 signature genes were found to be mainly enriched in pathways associated with neuroactive ligand-receptor interaction, cAMP signaling, pancreatic secretion, olfactory transduction, and calcium signaling. Moreover, GO analysis showed enrichment in the regulation of membrane potential, collagen-containing extracellular matrix, receptor-ligand activity, and signaling receptor activator activity, amongst others (Kanehisa and Goto, 2000).
Furthermore, a variety of cells, cytokines, exosomes, and chemotactic factors are able to interact and communicate with cancer cells in the TME, especially TAICs which display anti-tumor functions (Gajewski et al., 2013; Hinshaw and Shevde, 2019; Zhang et al., 2021). TME fibroblasts are recognized as tumor targets and play an integral role in tumor growth and metastasis (Zhang et al., 2020b). In our study, we observed significant differences in the proportions of infiltrating immune cell types between patients with high and low-risk scores, specifically, type Ⅱ macrophages, resting mastocytes, monocytes, resting NK cells, follicular helper T cells, and regulatory T cells. This was consistent with the subsequent finding that the immune microenvironment differed in groups with different risk scores. High-risk groups showed greater concentrations of M2 macrophages and mastocytes, suggesting depletion of the immune microenvironment (Liu et al., 2011; Liao et al., 2018). We also explored the correlation between TAIC infiltration and the expression of risk model-related genes. The results showed that the proportion of resting NK cells was positively associated with genes such as MEF2B, APOH, ADTRP, and ADH4, while the Treg level was negatively correlated with SERPINE1, S100Z, ADRA1B, and ADH4. This is consistent with the findings of other studies (Feske et al., 2015; Chu et al., 2020; Huang et al., 2021). Furthermore, we investigated the relationships between the risk models and immune checkpoints, finding significant differences in the levels of CD274 (PD-L1) and HAVCR2 between high- and low-risk patients. Notably, the level of PD-L1 was lower in the high-risk patients, suggesting that high-risk patients should not be treated with PD-L1 inhibitors. Additional investigations into the precise mechanisms of tumor-associated immune cells and their association with GC prognosis are still required in the future.
Taken together, we identified three GC subtypes based on core metabolic pathways and constructed a prognostic model using 11 signature genes that were differentially expressed in the three metabolic subtypes. The model was found to be both effective and robust in different patient cohorts and was shown by multivariate Cox regression to be an independent predictor of GC patient prognosis. We also investigated the genomic characteristics of the three subtypes, as well as our models, observing an association between GC-associated immune cells and the 11 signature genes.
The datasets presented in this study can be found in online repositories. The names of the repository/repositories and accession number(s) can be found in the article/Supplementary Material.
This study received approval from the Institutional Ethics Committees of the First Affiliated Hospital of Wenzhou Medical University, and followed the guidelines of the Declaration of Helsinki. All participants were fully informed and signed informed consent forms prior to participating in this research.
LQ, TzC, XC, and JC conceived and designed the research. TC, LZ, JC, QH, GJ, MZ, RD, ZY, JC, MT, TkC, and WA performed the research. LQ, LW, XC, and XL coordinated the research and analyzed the data. TzC, LZ, JC, GJ, MZ, and WA drafted the manuscript. LZ, WA, MZ, and JC revised the manuscript. All authors read and approved the final manuscript.
This work was supported by the Basic Scientific Research Project of Wenzhou (Y20190055 and Y20190085); Basic Public Welfare Research Project of Zhejiang Province (grant number LGD20C060001 to LQ); Doctoral Fund of The Second Affiliated Hospital and Yuying Children’s Hospital of Wenzhou Medical University to LQ and Academician He Lin New Medical Cooperation Demonstration Base Research Fund Project (grant number 19331205 to LQ).
The authors declare that the research was conducted in the absence of any commercial or financial relationships that could be construed as a potential conflict of interest.
All claims expressed in this article are solely those of the authors and do not necessarily represent those of their affiliated organizations, or those of the publisher, the editors and the reviewers. Any product that may be evaluated in this article, or claim that may be made by its manufacturer, is not guaranteed or endorsed by the publisher.
The Supplementary Material for this article can be found online at: https://www.frontiersin.org/articles/10.3389/fgene.2023.1094838/full#supplementary-material
Ajani, J. A., D'Amico, T. A., Almhanna, K., Bentrem, D. J., Chao, J., Das, P., et al. (2016). Gastric cancer, version 3.2016, NCCN clinical practice guidelines in Oncology. J. Natl. Compr. Canc Netw. 14 (10), 1286–1312. doi:10.6004/jnccn.2016.0137
Barrett, T., Wilhite, S. E., Ledoux, P., Evangelista, C., Kim, I. F., Tomashevsky, M., et al. (2013). NCBI GEO: Archive for functional genomics data sets--update. Nucleic Acids Res. 41, D991–D995. doi:10.1093/nar/gks1193
Boroughs, L. K., and DeBerardinis, R. J. (2015). Metabolic pathways promoting cancer cell survival and growth. Nat. Cell Biol. 17 (4), 351–359. doi:10.1038/ncb3124
Brand, A., Singer, K., Koehl, G. E., Kolitzus, M., Schoenhammer, G., Thiel, A., et al. (2016). LDHA-associated lactic acid production blunts tumor immunosurveillance by T and NK cells. Cell Metab. 24 (5), 657–671. doi:10.1016/j.cmet.2016.08.011
Cai, W. Y., Dong, Z. N., Fu, X. T., Lin, L. Y., Wang, L., Ye, G. D., et al. (2020). Identification of a tumor microenvironment-relevant gene set-based prognostic signature and related therapy targets in gastric cancer. Theranostics 10 (19), 8633–8647. doi:10.7150/thno.47938
Chia, N. Y., and Tan, P. (2016). Molecular classification of gastric cancer. Ann. Oncol. 27 (5), 763–769. doi:10.1093/annonc/mdw040
Chong, W., Shang, L., Liu, J., Fang, Z., Du, F., Wu, H., et al. (2021). m(6 A regulator-based methylation modification patterns characterized by distinct tumor microenvironment immune profiles in colon cancer. Theranostics 11 (5), 2201–2217. doi:10.7150/thno.52717
Chu, C. S., Hellmuth, J. C., Singh, R., Ying, H. Y., Skrabanek, L., Teater, M. R., et al. (2020). Unique immune cell coactivators specify locus control region function and cell stage. Mol. Cell 80 (5), 845–861. doi:10.1016/j.molcel.2020.10.036
Daum, O., Daumova, M., and Svajdler, M. (2020). Comments on the 5th edition of WHO classification of digestive system tumors - Part 1. Gastrointestinal tract. Cesk Patol. 56 (4), 194–206.
Erratum (2020). Erratum: Global cancer statistics 2018: GLOBOCAN estimates of incidence and mortality worldwide for 36 cancers in 185 countries. CA Cancer J. Clin. 70 (4), 313. doi:10.3322/caac.21609
Feske, S., Wulff, H., and Skolnik, E. Y. (2015). Ion channels in innate and adaptive immunity. Annu. Rev. Immunol. 33, 291–353. doi:10.1146/annurev-immunol-032414-112212
Gajewski, T. F., Schreiber, H., and Fu, Y. X. (2013). Innate and adaptive immune cells in the tumor microenvironment. Nat. Immunol. 14 (10), 1014–1022. doi:10.1038/ni.2703
Gong, Y., Ji, P., Yang, Y. S., Xie, S., Yu, T. J., Xiao, Y., et al. (2021). Metabolic-pathway-based subtyping of triple-negative breast cancer reveals potential therapeutic targets. Cell Metab. 33 (1), 51–64.e9. doi:10.1016/j.cmet.2020.10.012
Hanzelmann, S., Castelo, R., and Guinney, J. G. S. V. A. (2013). Gsva: Gene set variation analysis for microarray and RNA-seq data. BMC Bioinforma. 14, 7. doi:10.1186/1471-2105-14-7
Hinshaw, D. C., and Shevde, L. A. (2019). The tumor microenvironment innately modulates cancer progression. Cancer Res. 79 (18), 4557–4566. doi:10.1158/0008-5472.CAN-18-3962
Hu, B., Yang, X. B., and Sang, X. T. (2020). Construction of a lipid metabolism-related and immune-associated prognostic signature for hepatocellular carcinoma. Cancer Med. 9 (20), 7646–7662. doi:10.1002/cam4.3353
Huang, R., Li, G., Wang, Z., Hu, H., Zeng, F., Zhang, K., et al. (2020). Identification of an ATP metabolism-related signature associated with prognosis and immune microenvironment in gliomas. Cancer Sci. 111 (7), 2325–2335. doi:10.1111/cas.14484
Huang, X., Zhang, F., He, D., Ji, X., Gao, J., Liu, W., et al. (2021). Immune-related gene SERPINE1 is a novel biomarker for diffuse lower-grade gliomas via large-scale analysis. Front. Oncol. 11, 646060. doi:10.3389/fonc.2021.646060
Ishwaran, H., Gerds, T. A., Kogalur, U. B., Moore, R. D., Gange, S. J., and Lau, B. M. (2014). Random survival forests for competing risks. Biostatistics 15 (4), 757–773. doi:10.1093/biostatistics/kxu010
Jiang, M., Wu, N., Xu, B., Chu, Y., Li, X., Su, S., et al. (2019). Fatty acid-induced CD36 expression via O-GlcNAcylation drives gastric cancer metastasis. Theranostics 9 (18), 5359–5373. doi:10.7150/thno.34024
Kanehisa, M., and Goto, S. (2000). Kegg: Kyoto encyclopedia of genes and genomes. Nucleic Acids Res. 28 (1), 27–30. doi:10.1093/nar/28.1.27
Kim, J., and DeBerardinis, R. J. (2019). Mechanisms and implications of metabolic heterogeneity in cancer. Cell Metab. 30 (3), 434–446. doi:10.1016/j.cmet.2019.08.013
Leone, R. D., Zhao, L., Englert, J. M., Sun, I. M., Oh, M. H., Sun, I. H., et al. (2019). Glutamine blockade induces divergent metabolic programs to overcome tumor immune evasion. Science 366 (6468), 1013–1021. doi:10.1126/science.aav2588
Li, X., Pasche, B., Zhang, W., and Chen, K. (2018). Association of MUC16 mutation with tumor mutation load and outcomes in patients with gastric cancer. JAMA Oncol. 4 (12), 1691–1698. doi:10.1001/jamaoncol.2018.2805
Li, X., Wenes, M., Romero, P., Huang, S. C., Fendt, S. M., and Ho, P. C. (2019). Navigating metabolic pathways to enhance antitumour immunity and immunotherapy. Nat. Rev. Clin. Oncol. 16 (7), 425–441. doi:10.1038/s41571-019-0203-7
Li, X., Wu, W. K., Xing, R., Wong, S. H., Liu, Y., Fang, X., et al. (2016). Distinct subtypes of gastric cancer defined by molecular characterization include novel mutational signatures with prognostic capability. Cancer Res. 76 (7), 1724–1732. doi:10.1158/0008-5472.CAN-15-2443
Liao, C. P., Booker, R. C., Brosseau, J. P., Chen, Z., Mo, J., Tchegnon, E., et al. (2018). Contributions of inflammation and tumor microenvironment to neurofibroma tumorigenesis. J. Clin. Invest. 128 (7), 2848–2861. doi:10.1172/JCI99424
Liu, J., Zhang, Y., Zhao, J., Yang, Z., Li, D., Katirai, F., et al. (2011). Mast cell: Insight into remodeling a tumor microenvironment. Cancer Metastasis Rev. 30 (2), 177–184. doi:10.1007/s10555-011-9276-1
Martinez-Reyes, I., and Chandel, N. S. (2021). Cancer metabolism: Looking forward. Nat. Rev. Cancer 21 (10), 669–680. doi:10.1038/s41568-021-00378-6
Newman, A. M., Liu, C. L., Green, M. R., Gentles, A. J., Feng, W., Xu, Y., et al. (2015). Robust enumeration of cell subsets from tissue expression profiles. Nat. Methods 12 (5), 453–457. doi:10.1038/nmeth.3337
Noh, S. H., Park, S. R., Yang, H. K., Chung, H. C., Chung, I. J., Kim, S. W., et al. (2014). Adjuvant capecitabine plus oxaliplatin for gastric cancer after D2 gastrectomy (CLASSIC): 5-year follow-up of an open-label, randomised phase 3 trial. Lancet Oncol. 15 (12), 1389–1396. doi:10.1016/S1470-2045(14)70473-5
Pavlova, N. N., and Thompson, C. B. (2016). The emerging hallmarks of cancer metabolism. Cell Metab. 23 (1), 27–47. doi:10.1016/j.cmet.2015.12.006
Ritchie, M. E., Phipson, B., Wu, D., Hu, Y., Law, C. W., Shi, W., et al. (2015). Limma powers differential expression analyses for RNA-sequencing and microarray studies. Nucleic Acids Res. 43 (7), e47. doi:10.1093/nar/gkv007
Sathe, A., Grimes, S. M., Lau, B. T., Chen, J., Suarez, C., Huang, R. J., et al. (2020). Single-cell genomic characterization reveals the cellular reprogramming of the gastric tumor microenvironment. Clin. Cancer Res. 26 (11), 2640–2653. doi:10.1158/1078-0432.CCR-19-3231
Sexton, R. E., Hallak, M. N. A., Uddin, M. H., Diab, M., and Azmi, A. S. (2020). Gastric cancer heterogeneity and clinical outcomes. Technol. Cancer Res. Treat. 19, 1533033820935477. doi:10.1177/1533033820935477
Shah, M. A., and Ajani, J. A. (2010). Gastric cancer--an enigmatic and heterogeneous disease. JAMA 303 (17), 1753–1754. doi:10.1001/jama.2010.553
Su, J., Song, Q., Qasem, S., O'Neill, S., Lee, J., Furdui, C. M., et al. (2020). Multi-omics analysis of brain metastasis outcomes following craniotomy. Front. Oncol. 10, 615472. doi:10.3389/fonc.2020.615472
Subramanian, A., Tamayo, P., Mootha, V. K., Mukherjee, S., Ebert, B. L., Gillette, M. A., et al. (2005). Gene set enrichment analysis: A knowledge-based approach for interpreting genome-wide expression profiles. Proc. Natl. Acad. Sci. U. S. A. 102 (43), 15545–15550. doi:10.1073/pnas.0506580102
Sullivan, L. M., Massaro, J. M., and D'Agostino, R. B. (2004). Presentation of multivariate data for clinical use: The Framingham Study risk score functions. Stat. Med. 23 (10), 1631–1660. doi:10.1002/sim.1742
Sun, L., Suo, C., Li, S. T., Zhang, H., and Gao, P. (2018). Metabolic reprogramming for cancer cells and their microenvironment: Beyond the Warburg Effect. Biochim. Biophys. Acta Rev. Cancer 1870 (1), 51–66. doi:10.1016/j.bbcan.2018.06.005
Tamborero, D., Gonzalez-Perez, A., and Lopez-Bigas, N. (2013). OncodriveCLUST: Exploiting the positional clustering of somatic mutations to identify cancer genes. Bioinformatics 29 (18), 2238–2244. doi:10.1093/bioinformatics/btt395
Vander Heiden, M. G., and DeBerardinis, R. J. (2017). Understanding the intersections between metabolism and cancer biology. Cell 168 (4), 657–669. doi:10.1016/j.cell.2016.12.039
Wang, Z., Jensen, M. A., and Zenklusen, J. C. (2016). A practical guide to the cancer genome Atlas (TCGA). Methods Mol. Biol. 1418, 111–141. doi:10.1007/978-1-4939-3578-9_6
Wu, Y., Yang, S., Ma, J., Chen, Z., Song, G., Rao, D., et al. (2022). Spatiotemporal immune landscape of colorectal cancer liver metastasis at single-cell level. Cancer Discov. 12 (1), 134–153. doi:10.1158/2159-8290.CD-21-0316
Xiang, Z., Li, J., Song, S., Wang, J., Cai, W., Hu, W., et al. (2019). A positive feedback between Ido1 metabolite and COL12A1 via MAPK pathway to promote gastric cancer metastasis. J. Exp. Clin. Cancer Res. 38 (1), 314. doi:10.1186/s13046-019-1318-5
Xu, F., Guan, Y., Xue, L., Huang, S., Gao, K., Yang, Z., et al. (2020). The effect of a novel glycolysis-related gene signature on progression, prognosis and immune microenvironment of renal cell carcinoma. BMC Cancer 20 (1), 1207. doi:10.1186/s12885-020-07702-7
Yang, Y., Shi, Z., Bai, R., and Hu, W. (2021). Heterogeneity of MSI-H gastric cancer identifies a subtype with worse survival. J. Med. Genet. 58 (1), 12–19. doi:10.1136/jmedgenet-2019-106609
Yu, G., Wang, L. G., Han, Y., and He, Q. Y. (2012). clusterProfiler: an R package for comparing biological themes among gene clusters. OMICS 16 (5), 284–287. doi:10.1089/omi.2011.0118
Yu, S., Hu, C., Cai, L., Du, X., Lin, F., Yu, Q., et al. (2020). Seven-gene signature based on glycolysis is closely related to the prognosis and tumor immune infiltration of patients with gastric cancer. Front. Oncol. 10, 1778. doi:10.3389/fonc.2020.01778
Zhang, H., Deng, T., Liu, R., Ning, T., Yang, H., Liu, D., et al. (2020). CAF secreted miR-522 suppresses ferroptosis and promotes acquired chemo-resistance in gastric cancer. Mol. Cancer 19 (1), 43. doi:10.1186/s12943-020-01168-8
Zhang, J., Gu, C., Song, Q., Zhu, M., Xu, Y., Xiao, M., et al. (2020). Identifying cancer-associated fibroblasts as emerging targets for hepatocellular carcinoma. Cell Biosci. 10 (1), 127. doi:10.1186/s13578-020-00488-y
Zhang, J., Song, Q., Wu, M., and Zheng, W. (2021). The emerging roles of exosomes in the chemoresistance of hepatocellular carcinoma. Curr. Med. Chem. 28 (1), 93–109. doi:10.2174/0929867327666200130103206
Zhang, Y., Hu, Y., Fang, J. Y., and Xu, J. (2016). Gain-of-function miRNA signature by mutant p53 associates with poor cancer outcome. Oncotarget 7 (10), 11056–11066. doi:10.18632/oncotarget.7090
Zhu, M., Wu, M., Bian, S., Song, Q., Xiao, M., Huang, H., et al. (2021). DNA primase subunit 1 deteriorated progression of hepatocellular carcinoma by activating AKT/mTOR signaling and UBE2C-mediated P53 ubiquitination. Cell Biosci. 11 (1), 42. doi:10.1186/s13578-021-00555-y
Zhu, T., Wang, Z., Zou, T., Xu, L., Zhang, S., Chen, Y., et al. (2021). SOAT1 promotes gastric cancer lymph node metastasis through lipid synthesis. Front. Pharmacol. 12, 769647. doi:10.3389/fphar.2021.769647
Keywords: gastric cancer, prognosis, metabolism, molecular subtypes, multi-omics
Citation: Chen T, zhao L, Chen J, Jin G, Huang Q, Zhu M, Dai R, Yuan Z, Chen J, Tang M, Chen T, Lin X, Ai W, Wu L, Chen X and Qin L (2023) Identification of three metabolic subtypes in gastric cancer and the construction of a metabolic pathway-based risk model that predicts the overall survival of GC patients. Front. Genet. 14:1094838. doi: 10.3389/fgene.2023.1094838
Received: 10 November 2022; Accepted: 31 January 2023;
Published: 10 February 2023.
Edited by:
Jinhui Liu, Nanjing Medical University, ChinaReviewed by:
Yingcheng Wu, Fudan University, ChinaCopyright © 2023 Chen, zhao, Chen, Jin, Huang, Zhu, Dai, Yuan, Chen, Tang, Chen, Lin, Ai, Wu, Chen and Qin. This is an open-access article distributed under the terms of the Creative Commons Attribution License (CC BY). The use, distribution or reproduction in other forums is permitted, provided the original author(s) and the copyright owner(s) are credited and that the original publication in this journal is cited, in accordance with accepted academic practice. No use, distribution or reproduction is permitted which does not comply with these terms.
*Correspondence: Le Qin, UWlubGU4MUB3bXUuZWR1LmNu; Xiangjian Chen, Y2hlbnhpYW5namlhbkB3bXUuZWR1LmNu; Liang Wu, d3VsaWFuZzk4MkBhbGl5dW4uY29t; Weiming Ai, eW91bWVhd21Ad211LmVkdS5jbg==
†These authors have contributed equally to this work
Disclaimer: All claims expressed in this article are solely those of the authors and do not necessarily represent those of their affiliated organizations, or those of the publisher, the editors and the reviewers. Any product that may be evaluated in this article or claim that may be made by its manufacturer is not guaranteed or endorsed by the publisher.
Research integrity at Frontiers
Learn more about the work of our research integrity team to safeguard the quality of each article we publish.