 Chao Tang
 Lingchen Deng2
- 1Department of Cardiology, The Third People’s Hospital of Chengdu, The Affiliated Hospital of Southwest Jiaotong University, Chengdu, China
- 2College of Basic Medicine, Chengdu University of Traditional Chinese Medicine, Chengdu, China
Atherosclerosis (AS) is the main cause of death in individuals with cardiovascular and cerebrovascular diseases. A growing body of evidence suggests that oxidative stress plays an essential role in Atherosclerosis pathology. The aim of this study was to determine genetic mechanisms associated with Atherosclerosis and oxidative stress, as well as to construct a diagnostic model and to investigate its immune microenvironment. Seventeen oxidative stress-related genes were identified. A four-gene diagnostic model was constructed using the least absolute shrinkage and selection operator (LASSO) algorithm based on these 17 genes. The area under the Receiver Operating Characteristic (ROC) curve (AUC) was 0.967. Based on the GO analysis, cell-substrate adherens junction and focal adhesion were the most enriched terms. KEGG analysis revealed that these overlapping genes were enriched in pathways associated with Alzheimer’s disease and Parkinson’s disease, as well as with prion disease pathways and ribosomes. Immune cell infiltration correlation analysis showed that the immune cells with significant differences were CD4 memory activated T cells and follicular helper T cells in the GSE43292 dataset and CD4 naïve T cells and CD4 memory resting T cells in the GSE57691 dataset. We identified 17 hub genes that were closely associated with oxidative stress in AS and constructed a four-gene (aldehyde dehydrogenase six family member A1 (ALDH6A1), eukaryotic elongation factor 2 kinase (EEF2K), glutaredoxin (GLRX) and l-lactate dehydrogenase B (LDHB)) diagnostic model with good accuracy. The four-gene diagnostic model was also found to have good discriminatory efficacy for the immune cell infiltration microenvironment of AS. Overall, these findings provide valuable information and directions for future research into Atherosclerosis diagnosis and aid in the discovery of biological mechanisms underlying AS with oxidative stress.
Introduction
Atherosclerosis (AS) is the main cause of death in individuals with cardiovascular and cerebrovascular diseases. Approximately 19 million deaths were estimated to be attributed to cardiovascular disease globally in 2020, with an increase of 18.7% from 2007 (Tsao et al., 2022). Several studies have demonstrated that oxidative stress plays a significant role in the pathophysiology of atherosclerosis (Kattoor et al., 2017; Khosravi et al., 2019; Yang et al., 2017). However, the biological mechanisms underlying AS with oxidative stress remain unclear.
Oxidative stress occurs when there is an imbalance favoring the increased generation of reactive oxygen species (ROS) or suppression of the antioxidant defense system in the body (Elahi et al., 2009). ROS are involved in inflammatory responses, apoptosis, cell growth, and alterations in the blood vessel tone. The production of ROS in vessel walls is increased under all conditions considered risk factors for atherosclerotic cardiovascular disease, including hypertension, diabetes, obesity and dyslipidemia (Bryk et al., 2017). Increasingly, research has shown that oxidative stress plays an important role in AS (Ridker et al., 2018; Tibaut et al., 2018; Libby, 2021). Atherosclerosis is now thought to be caused by inflammation in addition to dyslipidemia and other risk factors. As an example, C-reactive protein, a biomarker of inflammation, is demonstrated to be correlated with remnant lipoprotein concentrations (Ridker, 2016; Hansen et al., 2019). The role of inflammation in hypertension is also well established (Xiao and Harrison, 2020). However, the underlying mechanisms of genetic and epigenetics factors in the pathogenesis of atherosclerosis caused by oxidative stress is still unclear. As of now, genome-wide association studies have identified more than 50 independent loci associated with cardiovascular diseases that collectively account for 13.3% of their heritability (Nikpay et al., 2015). One study investigated the role of oxidative stress ROM O 1 gene polymorphism and showed that subjects carrying the C allele were at a more than three folds increased risk of developing cardiovascular diseases (Tibaut et al., 2020). Therefore, an in-depth exploration of oxidative stress will help us understand how this disease develops and will also provide new ideas for its prevention and treatment.
Currently, studies on oxidative stress and AS focus on two topics; the first is the role of oxidative stress in the pathological process of AS, analyzing how oxidative stress is involved in AS (Yin et al., 2022) and the second is whether oxidative stress can be effectively targeted as a treatment for AS, specifically to slow down its progression, through clinical trials (Smolyaninov et al., 2022; Xu et al., 2022; Zhao et al., 2022). The purpose of this study was to examine the association between oxidative stress-related genes and AS at the gene level, as well as to construct a diagnostic model and to investigate its immune microenvironment.
Materials and methods
Acquisition of data and analysis of variance
Two microarray datasets (GSE57691 (Biros et al., 2015) and GSE43292 (Ayari and Bricca, 2013) related to AS were obtained from the Gene Expression Omnibus (GEO) (http://www.ncbi.nlm.nih.gov/geo/). The GSE57691 and GSE43292 platforms were derived from GPL10558 and GPL6244, respectively. In total, 32 samples from patients with AS and 32 controls from GSE43292 and 58 samples from patients with AS and 10 controls from GSE57691 were analyzed in this study. The flow diagram of the study is shown in Figure 1.
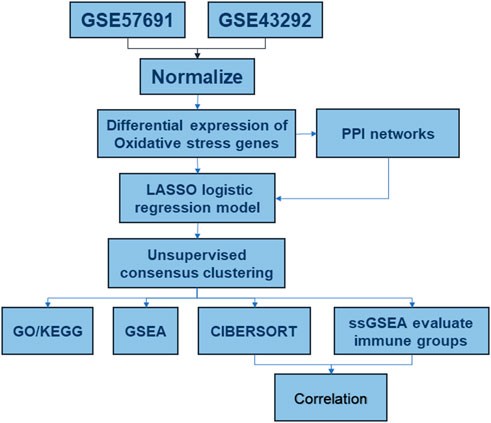
FIGURE 1. Analysis flow chart.
Acquisition of oxidative stress gene-related genes
The GeneCards database (Safran et al., 2010) provides comprehensive annotation information on human genes. We collected the oxidative stress genes from the GeneCards database (https://www.genecards.org/).
Analysis of DEGs of oxidative stress genes
We used the R package “limma” to perform differential gene analysis between normal and disease samples in the datasets. To analyze the expression of genes encoding oxidative stress-related genes in all samples, we first used the R package pheatmap to plot a heat map of the expression of these genes in all samples and then grouped box plots based on two samples, namely normal and those from patients with AS.
Correlation analysis between genes
To further dissect the correlation between the expression of related genes in all patients with AS, Pearson correlation values between two genes were calculated, and correlation coefficients with an absolute value greater than 0.5 and a p-value <0.05 were considered correlated. Scatter plots of correlations between eligible gene pairs were plotted, and correlation curves were fitted using the R package ggplot2.
Construction of the diagnostic model
LASSO regression (Vasquez et al., 2016) was used to select features, reduce dimensionality, and create disease profiles associated with genes related to oxidative stress. Columnar line plots were used to identify disease-associated risk factors. To validate the predictive efficacy of the diagnostic model, single-gene ROC curves were plotted using the R package pROC, and the AUC was calculated. To illustrate the validity of the nomogram, validation was performed using an in-house dataset and the decision curve analysis (DCA) curves.
Construction of PPI network
To analyze protein interactions, PPIs were established and hub genes were identified using an online tool (Search Tools for Retrieval of Interacting Genes, STRING) (Mering et al., 2003). The PPI network was visualized using Cytoscape (Shannon et al., 2003) software. CytoHubba (Rongbin et al., 2019) was utilized to calculate three indicators to evaluate the importance of each node, and the top 10 nodes were chosen. Hub genes served as the common nodes. We then conducted further prediction studies on hub nodes based on the TarBase (Wang et al., 2013), miRecords (Fornes et al., 2020), and miRTarBase (Huang et al., 2020) databases for miRNAs and transcription factors of hub nodes. We used the ENCODE database (Wang et al., 2013), JASPAR database (Fornes et al., 2020), and the ChEA database (Lachmann et al., 2010) for prediction.
Unsupervised clustering of samples
The R package “ConsensusClusterPlus” (Wilkerson and Hayes, 2010) was used to perform unsupervised clustering of samples based on oxidative stress gene regulators. The resampling method disrupts the original dataset such that each resampled sample is clustered, and then, the results of multiple clustering analyses are evaluated together to provide a consensus assessment.
Functional enrichment analysis
We conducted Kyoto Encyclopedia of Gene and Genome (KEGG) (Kanehisa and Goto, 2000)and gene ontology (GO) (Ashburner et al., 2000) analyses to understand the functions of these hub genes. To determine the biological activities of the genes and linked pathways, the clusterProfiler (Wilkerson and Hayes, 2010) R package was used to conduct an enrichment analysis. Using the reference gene set “c2. cp.kegg.v7.4. Entrez. gmt” from the MSigDB database (Liberzon et al., 2015), we compared the biological processes between the two samples and used the GSEA (Subramanian et al., 2005) and Gene Set Variation Analysis (GSVA) (Hänzelmann et al., 2013) methods included in the R package “clusterProfiler” for enrichment analysis and visualization of the dataset.
Immune infiltration analysis
To compare the levels of immune cell infiltration between the two groups of samples, immune cell infiltration was assessed using the R package GSVA based on ssGSEA (Subramanian et al., 2005). To maximize the accuracy of the results, the level of immune cell infiltration was assessed using the R package CIBERSORT (Steen et al., 2020).
Statistical analysis
All data processing and analyses were performed using R software (version 4.0.2). Student’s paired t-tests were used to analyze data when comparing the two groups, and p < 0.05 was considered statistically significant.
Results
Data preprocessing and identification of differentially expressed genes (DEGs)
In Figures 2A–D, the expression distribution characteristics of the two datasets before and after data pretreatment are presented. Almost all median values were on a straight line, proving that they were normalized. Among the DEGs, the upregulated and downregulated genes were identified with a False Discovery Rate <0.05 and a |log2FC| > 0.58. After data processing, 758 DEGs were identified, with 515 upregulated and 243 downregulated genes. The information summary of the two datasets was showed in Table 1.
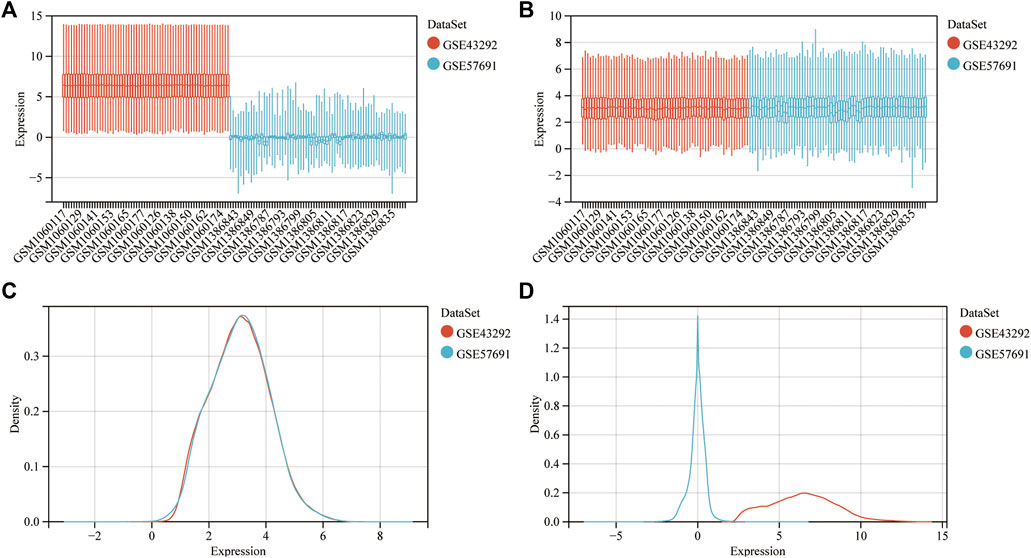
FIGURE 2. Dataset merging, standardization and normalization. (A) Box plots of the expression spectrum matrix of GSE57691 and GSE43292 data sets before calibration; (B) Box plots of the expression spectrum matrix of GSE57691 and GSE43292 data sets after calibration; (C) Density plots of the expression spectrum matrix of GSE57691 and GSE43292 data sets before calibration; (D) Density plots of the expression spectrum matrix of GSE57691 and GSE43292 data sets after calibration.
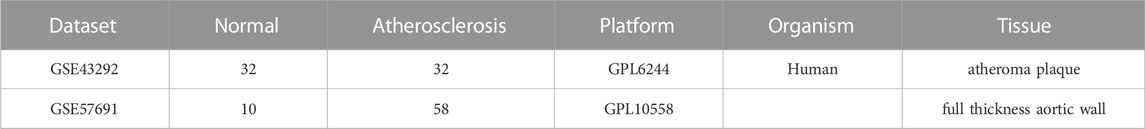
TABLE 1. Dataset information summary.
We analyzed the differences in the expression of oxidative stress-related genes between normal and diseased samples in the GSE43292 and GSE57691 datasets, which are presented as volcano plots (Figures 3A–C) and heat maps (Figures 3B–D). In GSE43292, the expression of 221 differential genes was upregulated and that of 181 was downregulated. The DEGs in GSE57691 included 231 upregulated and 1,219 downregulated genes. A Venn diagram showing DEGs in GSE57691 and GSE43292 is shown in Figure 3E. In total, 67 intersecting differential oxidative stress-related genes were obtained in the GSE57691 and GSE43292 datasets (Additional file 1).
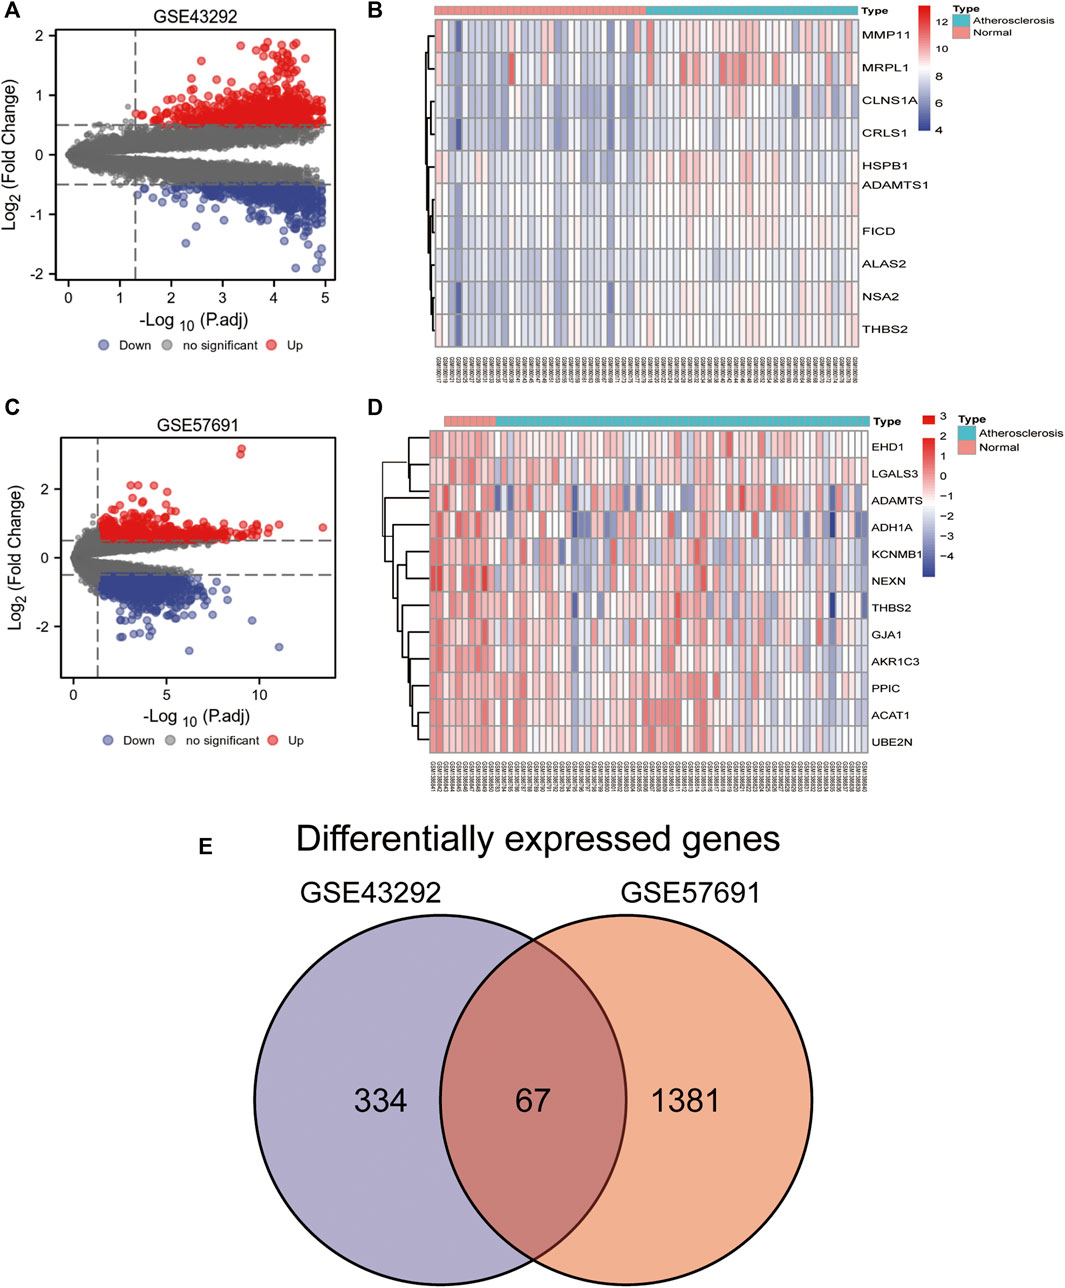
FIGURE 3. Differential expression of oxidative stress-related genes. (A,B) Volcano plot of DEGs in GSE43292 and GSE57691; (C,D) Heat map of DEGs in GSE43292 and GSE57691; (E) Venn diagram of DEGs in the two datasets.
Construction of protein–protein interaction (PPI) network
We first analyzed the interactions among 67 intersecting differentially expressed oxidative stress-related genes in the GSE57691 and GSE43292 datasets and constructed PPI networks of differentially expressed oxidative stress-related genes for the 67 intersecting genes using the STRING database. The highest confidence interaction score was set to 0.4 (Figure 4A). The top 20 closely linked genes were screened using the CytoHubba plugin (Figures 4B, C). The intersection of the two approaches was demonstrated using a Venn diagram to identify 17 closely related differential oxidative stress-related genes (Figure 4D), including acetyl-CoA acetyltransferase 1 (ACAT1), acetyl-coenzyme A carboxylase beta (ACACB), alcohol dehydrogenase 1A (ADH1A), aldehyde dehydrogenase six family member A1 (ALDH6A1), alcohol oxidase 1 (AOX1), eukaryotic elongation factor 2 kinase (EEF2), eukaryotic elongation factor 2 kinase (EEF2K), glutaredoxin (GLRX), heat shock protein family A member 9 (HSPA9), l-lactate dehydrogenase B (LDHB), mitochondrial ribosomal protein L1 (MRPL1), mitochondrial ribosomal protein S11 (MRPS11), mitochondrial Ribosomal Protein S18C (MRPS18C), NADH: ubiquinone oxidoreductase subunit B7 (NDUFB7), nop seven-associated 2 (NSA2), periodic tryptophan protein 1 (PWP1) and thioredoxin reductase 1 (TXNRD1). We predicted 17 closely related differential oxidative stress-related miRNAs or transcription factor (TF) -regulated genes targeted by the diagnostic model. In total, 179 associated TF-regulated genes and 285 miRNAs were obtained, and the network was constructed (Figure 4E).
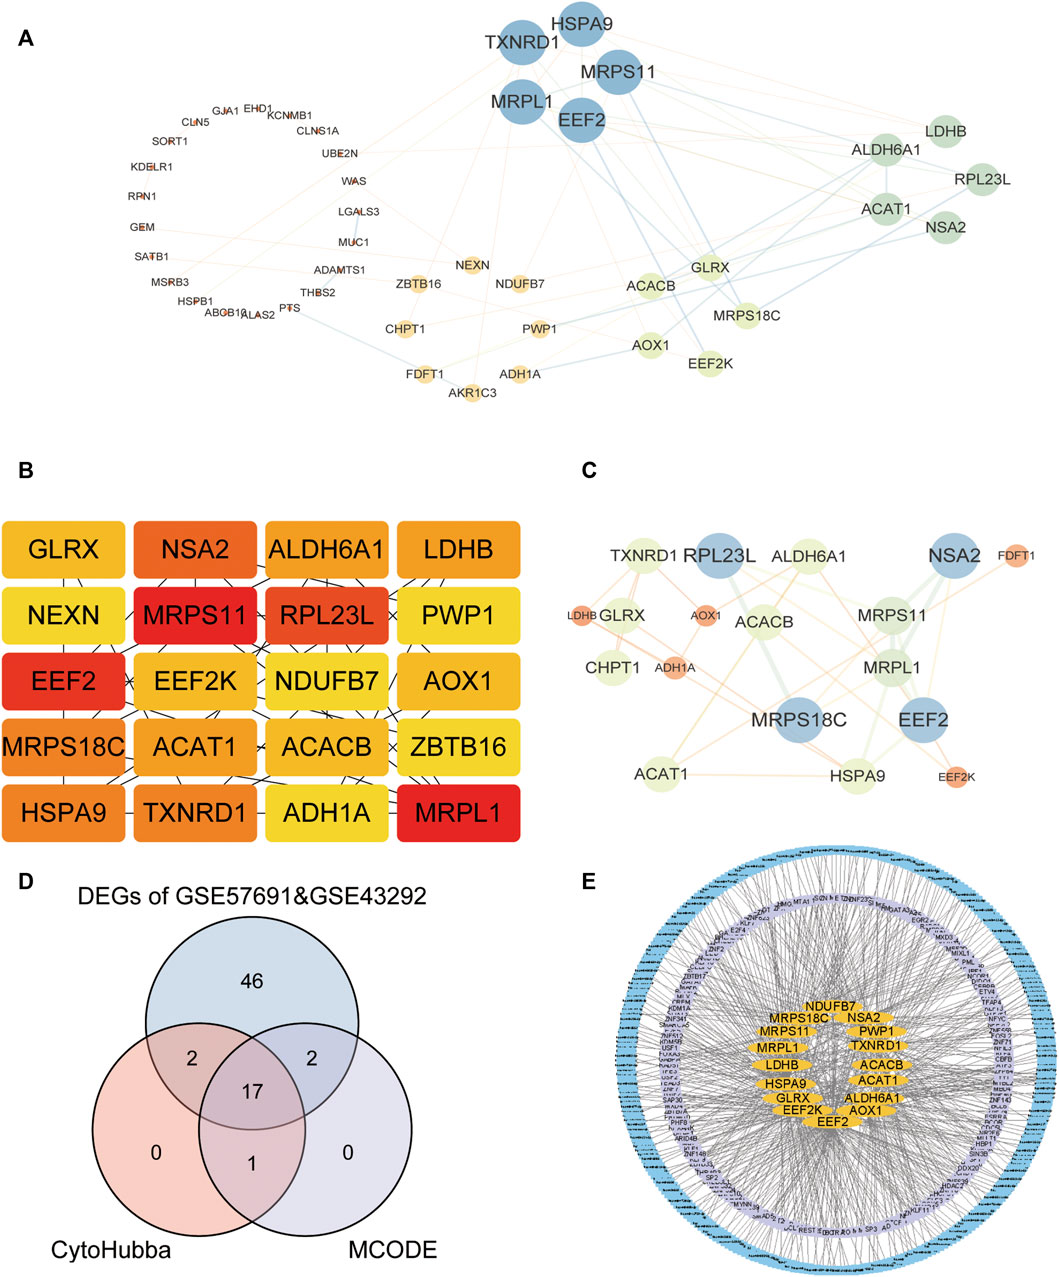
FIGURE 4. Construction of molecular interaction network of DEGs and screening of co-expressed hub gene. (A) STRING database for 67 intersection of DEGs; (B) CytoHubba plug-in screening of top-20 hub genes; (C) Cytoscape’s MCODE analysis of hub genes; (D) Venn diagram showing the intersection of two methods to obtain 17 closely related co-expressed genes; (E) TF and miRNA prediction of the 17-gene diagnostic model, the yellow color located in the middle represents the 17-gene oxidative stress-related diagnostic model, the middle purple layer represents its associated TF; the outer blue layer represents its targeted miRNA.
Molecular subtype construction and analysis based on oxidative stress
We used the least absolute shrinkage and selection operator (LASSO) algorithm for these 17 genes for further gene diagnostic model construction for closely related expression (Figures 5A, B).
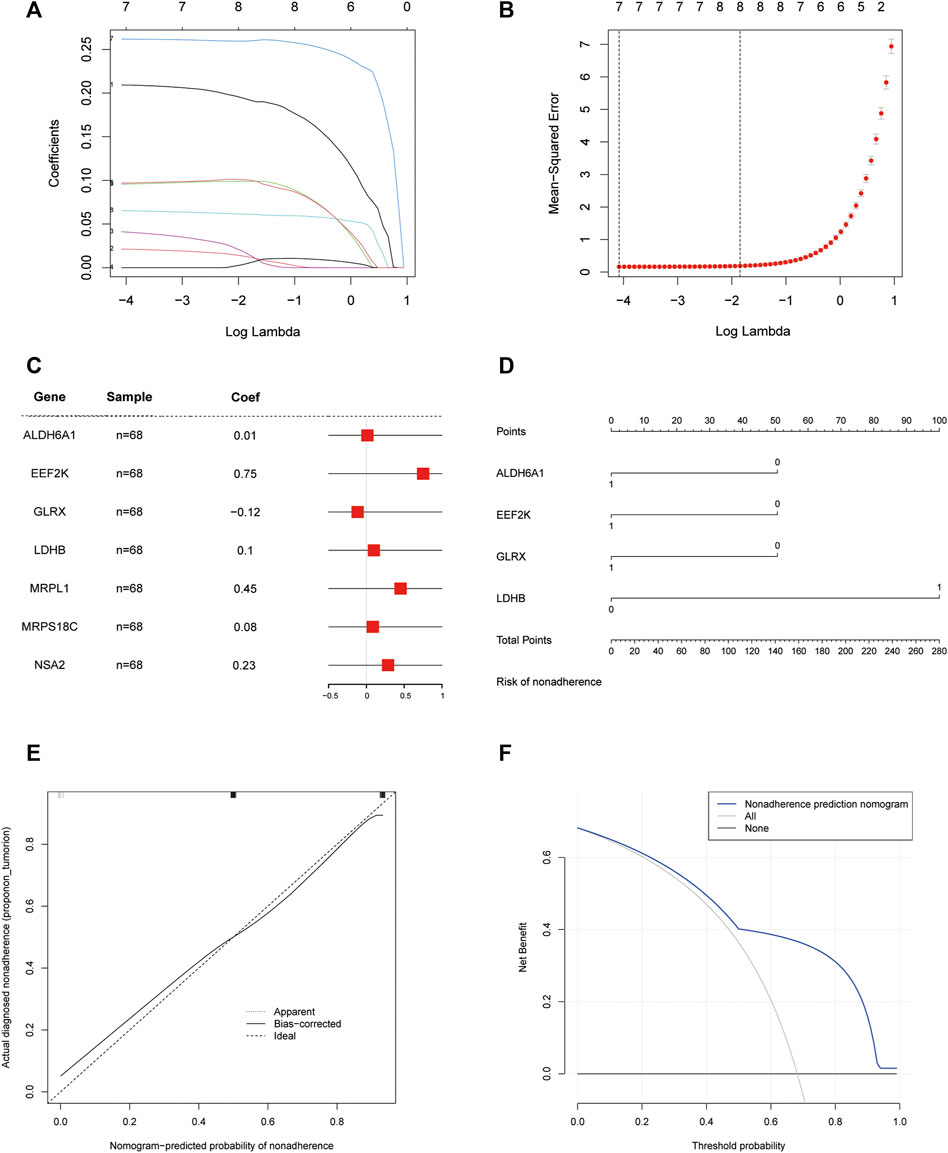
FIGURE 5. Diagnostic model. (A) LASSO logistic regression algorithm screening diagnostic marker lambda value visualization; (B) LASSO logistic regression algorithm screening diagnostic marker min value visualization; (C) Forest plot of seven meaningful oxidative stress-related arterial disease risk genes with significant biological significance; (D) Column line graph of a 4-gene diagnostic marker model composed of ALDH6A1, EEF2K, GLRX, and LDHB; (E) Calibration curve of non-correlated nomogram; (F) Decision curve analysis of the diagnostic model.
We identified seven genes, ALDH6A1, EEF2K, GLRX, LDHB, MRPL1, MRPS18C, and NSA2, which are biologically significant for oxidative stress, in the risk forest plot of 17 genes (Figure 5C). For validation, column line plots of the atherosclerosis diagnostic biomarkers (oxidative stress-related genes) screened in the dataset were plotted to demonstrate the discriminatory efficacy of these predictive diagnostic markers for AS (Figure 5D). The calibration curves of the non-correlated nomogram predictions were further analyzed and plotted in the cohort (Figure 5E). Calibration curves showed that four genes (aldehyde dehydrogenase six family member A1 (ALDH6A1), eukaryotic elongation factor 2 kinase (EEF2K), glutaredoxin (GLRX) and l-lactate dehydrogenase B (LDHB)) could serve as diagnostic markers for AS.
Validation of oxidative stress-related DEGs and diagnostic efficacy
The area under the curve (AUC) values of the ROC curves were used to reflect the discriminatory efficacy, and an AUC >0.7 indicated high diagnostic efficacy. Figures 6A–C showed the independent expression of ALDH6A1, EEF2K, GLRX, and LDHB in the GSE43292 and GSE57691 datasets. The results revealed that the AUC of ALDH6A1 equals 0.816, EEF2K equals 0.748, GLRX equals 0.766, and LDHB equals 0.818 in the GSE43292 dataset. The AUC values were also good in GSE57691 datasets. Figures 6B–D show the combined diagnostic efficacy of the expression of ALDH6A1, EEF2K, GLRX, and LDHB in GSE43292 and GSE57691 datasets (Figure 6B, AUC: 0.852, CI: 0.755–0.948 for the four-gene diagnostic model of the GSE43292 dataset; Figure 6D, AUC: 0.967, CI: 0.911–1.000 in GSE57691 datasets) based on the ROC curves.
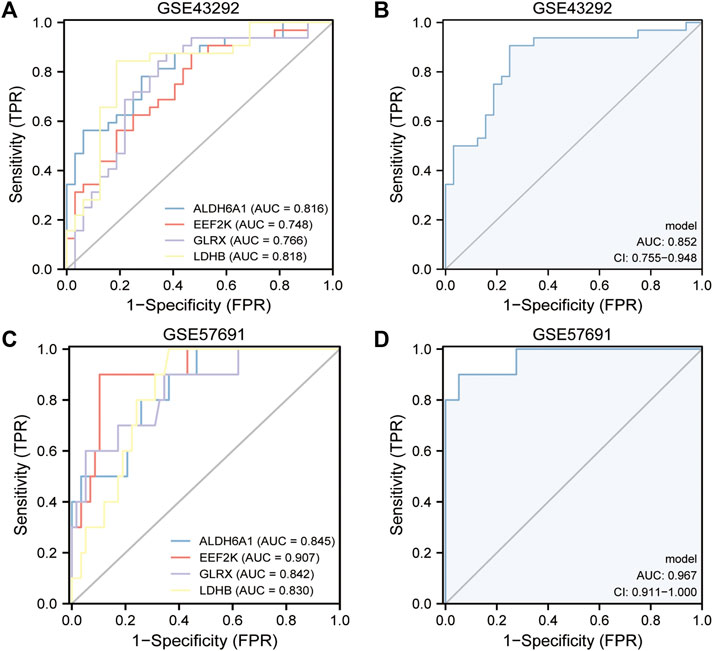
FIGURE 6. Validation of the diagnostic efficacy of 4-gene diagnostic model. (A) ROC curves of the diagnostic efficacy in the GSE43292 dataset (independent index); (B) ROC curves of the diagnostic efficacy in the GSE43292 dataset (joint index); (C) ROC curves of the diagnostic efficacy in the GSE57691 dataset (independent index); (D) ROC curves of the diagnostic efficacy in the GSE57691 dataset (joint index).
Subsequently, we analyzed the differences in the expression of diagnostic models in the GSE43292, GSE57691 dataset, presented as box plots (Figures 7A, B), and Figures 7C, D shows the correlation analysis for the expression of the four genes in the atherosclerosis group. Figures 7E, F shows the differentiation of oxidative stress-related genes in the mRNA expression profile matrix of the GSE43292, GSE57691 dataset by PCA clustering plot for atherosclerotic and normal samples.
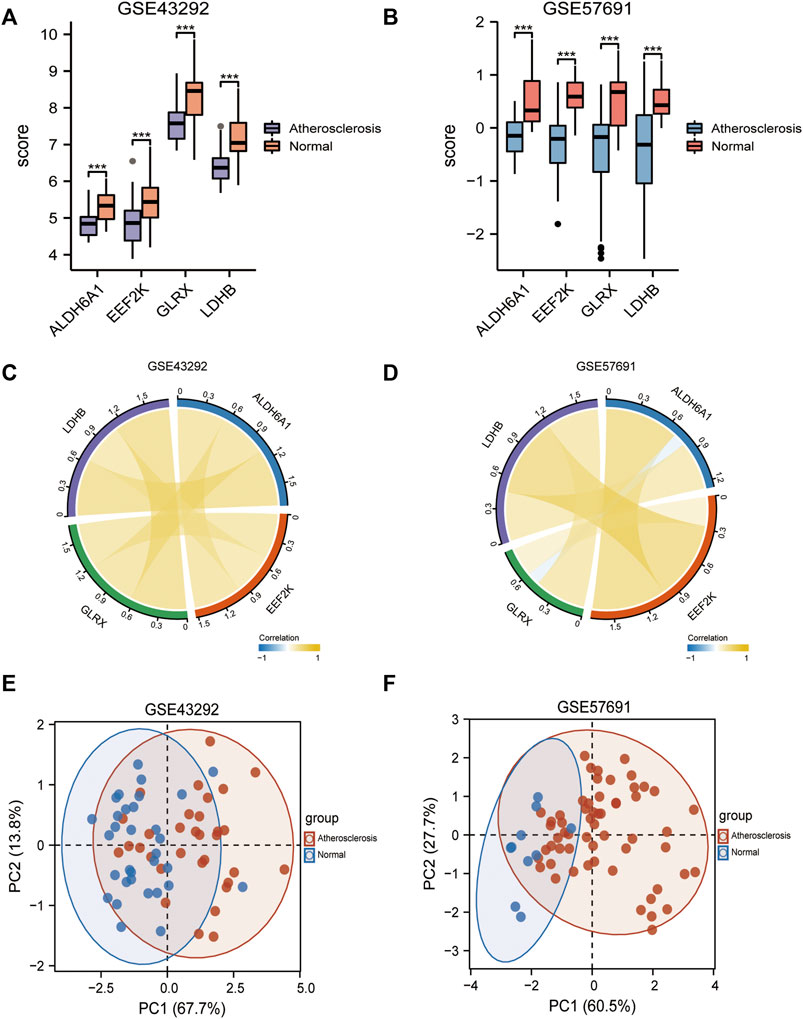
FIGURE 7. Differential expression in diagnostic models. (A) Box plots of differential expression of diagnostic models in the GSE43292; (B) Box plots of differential expression of diagnostic models in the GSE57691; (C) Correlation network plots between 4-gene diagnostic models in the GSE43292; (D) Correlation network plots between 4-gene diagnostic models in the GSE57691; (E) PCA clustering plot of differential oxidative stress genes between atherosclerosis and normal groups in the GSE43292 dataset; (F) PCA clustering plots. * is less than 0.05, ** is 0.01, *** is 0.001, **** is 0.0001, and no symbol means the difference is not significant.
Molecular typing analysis of four-gene diagnostic model
Unsupervised consensus clustering was performed on the four-gene diagnostic model with GSE57691 and GSE43292. The expression of these genes was further assessed by cluster analysis of the samples in the two sets according to the different subclasses. The resulting clustering of samples within a class was more stable relative to the sampling variance and could represent a true subclass structure. The best k value of two was selected based on the delta plot. The grouped cases contained atherosclerotic samples classified as A (n = 64) and B (n = 68) (Figures 8A–D). Furthermore, we explored oxidative stress-related gene diagnostic models obtained using the training set LASSO regression algorithm (Figures 8E, F).
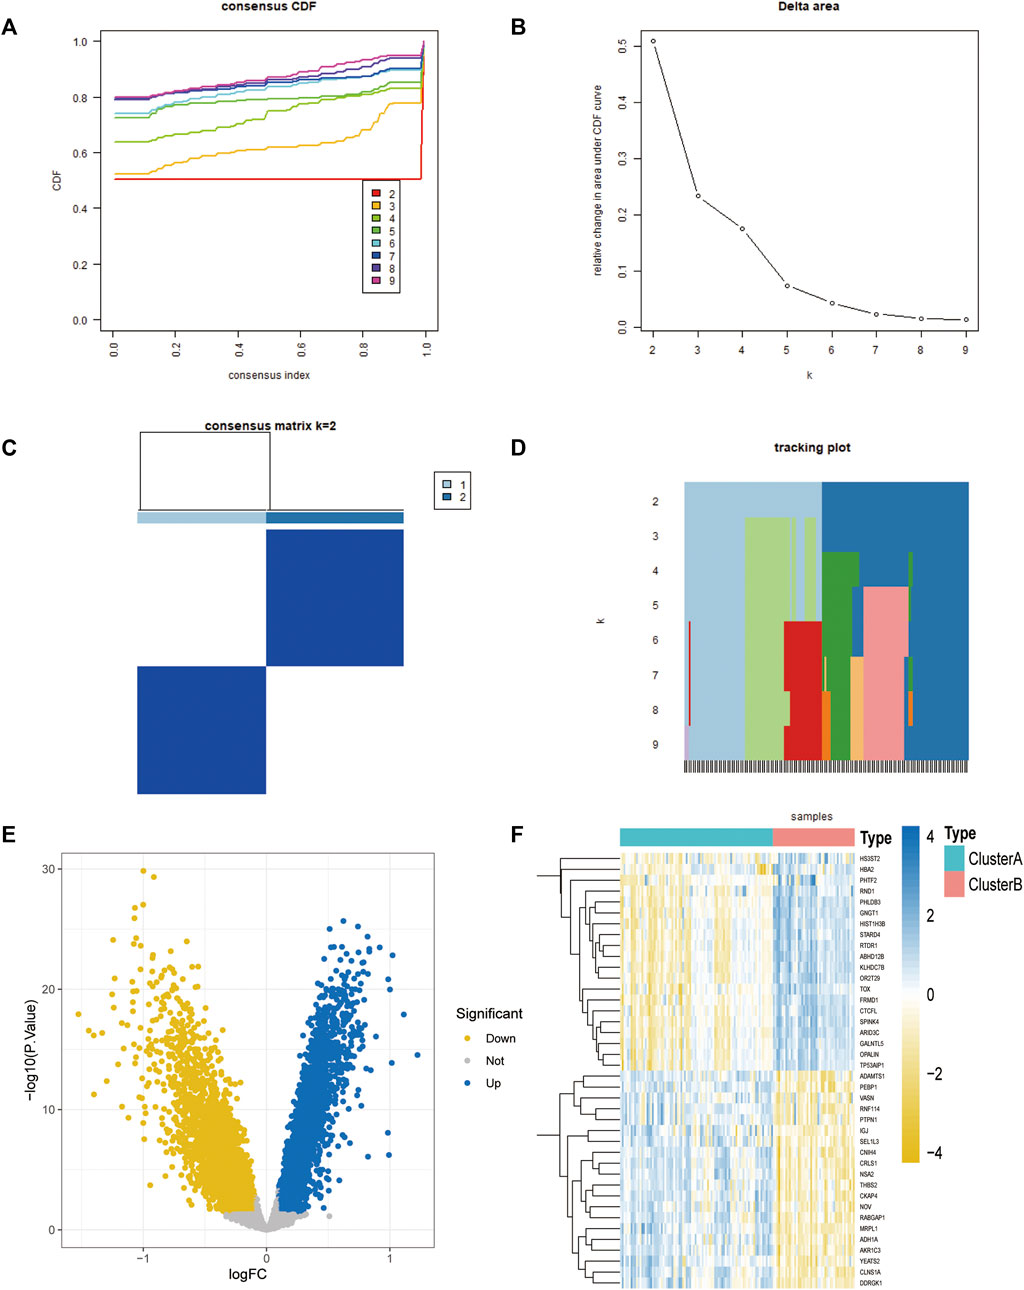
FIGURE 8. Molecular typing of the 4-gene diagnostic model of atherosclerosis associated with oxidative stress in GSE57691 vs. GSE43292. (A) CDF plot of consistent clustering; (B) Delta plot of consistent clustering, reflecting the optimal number of classifications; (C) Heat map of the difference between 2-classification clustering groups; (D) Fractal plot of consistent clustering samples (E,F) Consistent clustering grouping of 4-gene diagnostic model, Volcano plot and heat map.
Functional enrichment analysis
Gene ontology (GO) (Ashburner M et al., 2000) enrichment results demonstrated that focal adhesion, cell-substrate adherens junction, cell-substrate junction, cadherin binding, et al. were significantly enriched (Table 2). Alzheimer’s disease, Parkinson’s disease, prion disease, ribosome, and human T cell leukemia virus one infection pathways were significantly enriched based on KEGG analysis (Figure 9 and Table 3). The Gene Set Enrichment Analysis (GSEA) results suggested that there were no significant differences in JAK/STAT, BCR, PRC2, MTOR 4, TCR, TGF β, TP53, Notch, and NOD-like receptor signaling pathways, but that spliceosome-related pathways were significantly enriched (Figure 10).
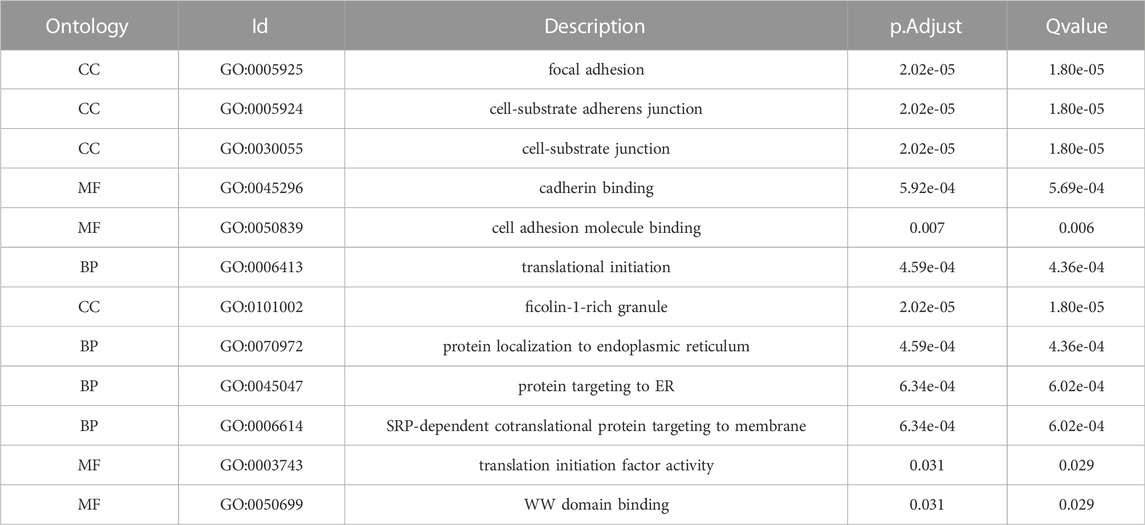
TABLE 2. Results of GO enrichment analysis of 106 co-expressed genes for 4-gene diagnostic marker model.
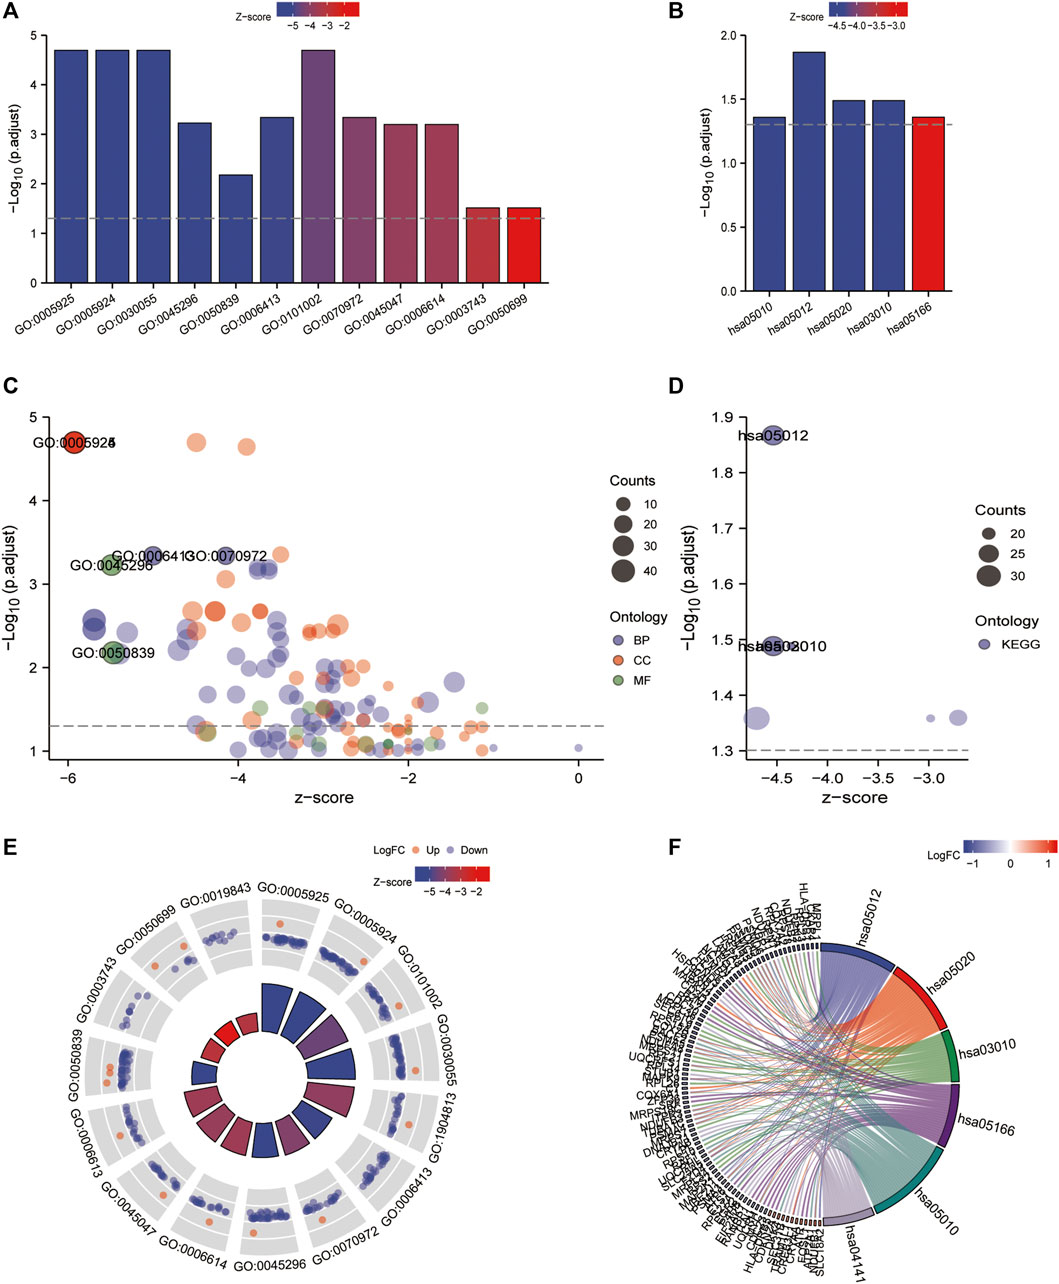
FIGURE 9. GO/KEGG enrichment analysis of the 4-gene diagnostic marker model in GSE57691 vs. GSE43292. (A,B) Bubble plot of GO/KEGG enrichment analysis; (C,D) Bar graph of GO/KEGG enrichment analysis; (E,F) String plot of GO enrichment analysis; circle plot of GO/KEGG enrichment analysis.
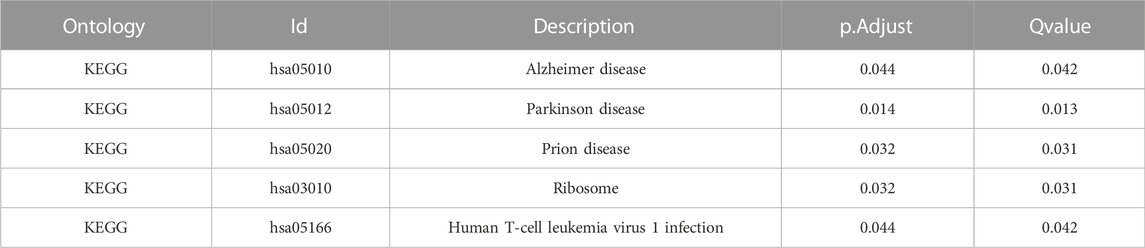
TABLE 3. Results of KEGG enrichment analysis of 106 co-expressed genes for 4-gene diagnostic marker model.
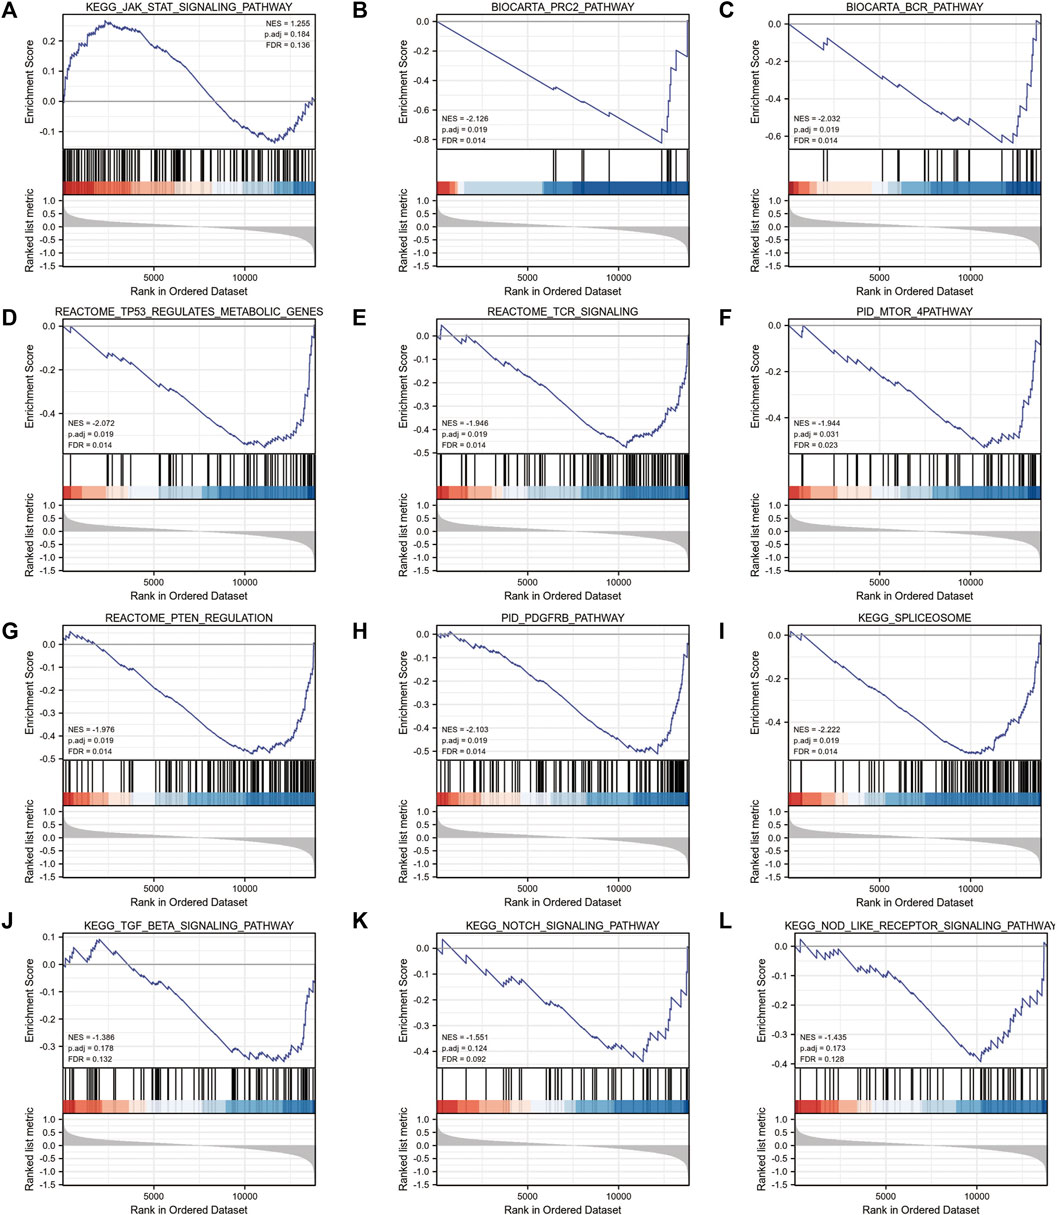
FIGURE 10. GSEA enrichment analysis of 4-gene diagnostic model. (A) KEGG_JAK_STAT_SIGNALING_PATHWAY; (B) BIOCARTA_PRC2_PATHWAY; (C) BIOCARTA_BCR_PATHWAY (D) REACTOME_TP53_REGULATES_METABOLIC_GENES; (E) REACTOME_TCR_SIGNALING; (F) PID_MTOR_4PATHWAY; (G) REACTOME_PTEN_REGULATION; (H) PID_PDGFRB_PATHWAY; (I) KEGG_SPLICEOSOME; (J) KEGG_TGF_BETA_SIGNALING_PATHWAY; (K) KEGG_NOTCH_SIGNALING_PATHWAY; (L) KEGG_NOD_LIKE_RECEPTOR_SIGNALING_PATHWAY.
The ssGSEA enrichment analysis for immune cell infiltration
The results of ssGSEA immune gene collection pathway enrichment analysis between the groups showed significant differences in the degree of infiltration (Figure 11A). The HALLMARK pooled clustering group showed significant differences between the two clustering groups in KRAS, TNFA/NFKB, P53, and TGFβ signaling pathways (Figure 11B). The KEGG pooled clustering group also showed significant differences between the two clustering groups in arrhythmia, ventricular cardiomyopathy, viral myocarditis, and other pathways (Figure 11C).
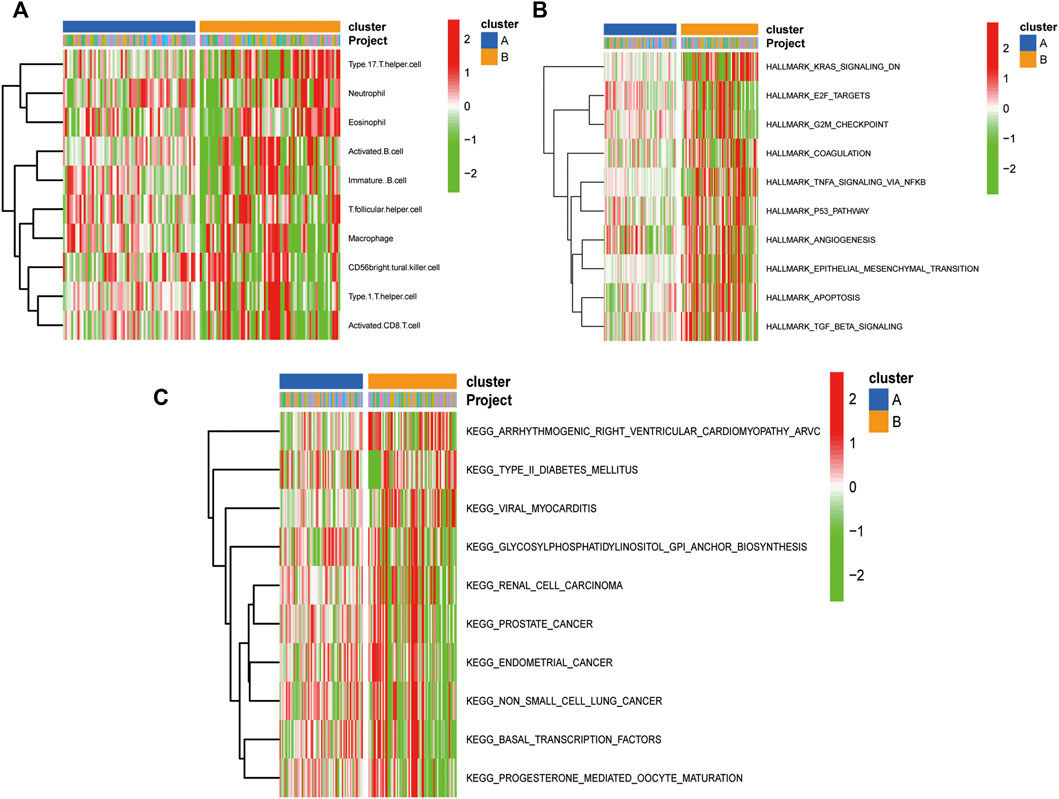
FIGURE 11. Molecular typing gsva enrichment analysis of consistent clustering of oxidative stress-related genes. (A) Heat map of inter-group differences in the ssGSEA immune gene set comparison between the consistent clustering subgroups; (B) Heat map of enrichment differences in the “h.all.v7.2. symbols.gmt” set; (C) Heat map of enrichment differences in the “c2. cp.v7.2. symbols.gmt” set between the consistent clustering subgroups.
Construction of immune signature subtypes and assessment of immune cell infiltration
The results of CIBERSORT deconvolution analysis of the two datasets revealed that the immune cells with significant differences in the GSE43292 dataset were CD4 memory activated T cells, follicular helper cells, M2 macrophages, activated dendritic cells, and neutrophils (Figure 12A). Immune cells with significant differences in the GSE57691 dataset were CD4 naïve T cells, CD4 memory resting T cells, regulatory T cells (Tregs), activated NK cells, and activated dendritic cells (Figure 12B). Subsequently, the ssGSEA results suggested that in the GSE43292 dataset, immune cell infiltration, based on the four-gene diagnostic model clustering of subgroups for oxidative stress-related AS, was significantly different in terms of activated CD4 T cells, activated CD8 T cells, activated dendritic cells, et al. (Figure 12C). Immune cells in the GSE57691 dataset showed significant differences in infiltration, based on the four-gene diagnostic model clustering of subgroups of oxidative stress-related AS, in terms of activated B cells, activated CD4 T cells, activated CD8 T cells, et al. (Figure 12D).
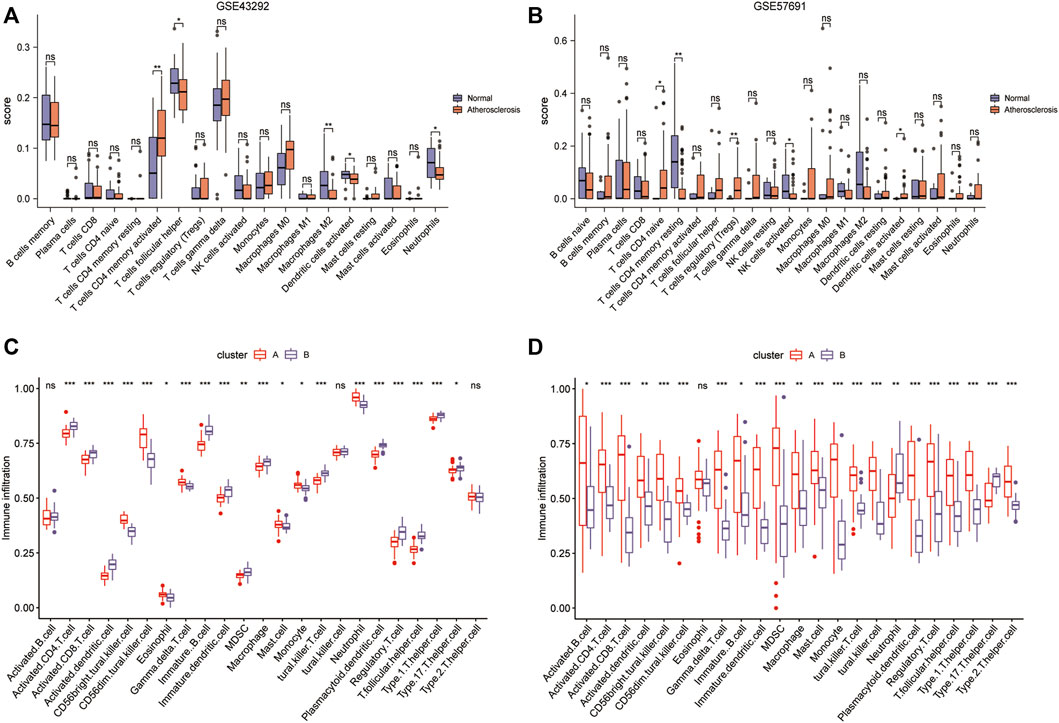
FIGURE 12. Construction of immune signature subtypes and analysis of immune cell infiltration assessment. (A) Box plots of differential immune cell infiltration between normal and atherosclerotic samples in the GSE43292 dataset by the CIBERSORT method; (B) box plots of immune cell infiltration in the GSE57691 dataset by the CIBERSORT method; (C) ssGSEA analysis box plots of the differential infiltration of immune cells in the 4-gene diagnostic model clustering subgroups among samples from the GSE43292 dataset; (D) ssGSEA analysis of the box plots of the differential infiltration of immune cells in the GSE57691 dataset.
Correlation analysis of the four genes in the oxidative stress-related AS diagnostic model
To further understand the degree of correlation among the four genes in the diagnostic model of oxidative stress-related AS and the differences in correlations in the four genes between the GSE43292 and GSE57691 datasets, we presented the results in the form of scatter plots with correlation coefficients |R| > 0.6, which were statistically significant in the GSE57691 dataset. The results with a correlation coefficient |R| > 0.6 in the GSE57691 and GSE43292 dataset with statistical significance are presented in the form of scatter plots (Table 4). The results of ALDH6A1 and EEF2K (r = 0.614, p = 2.56E-08), EEF2K and LDHB (r = 0.697, p = 4.21E-11), and GLRX and LDHB (r = 0.704, p = 2.07E-11) in the GSE57691 dataset were present in Figures 13A–C. The result of DALDH6A1 and GLRX (r = −0.453, p = 0.00017) was showed in Figure 13D.
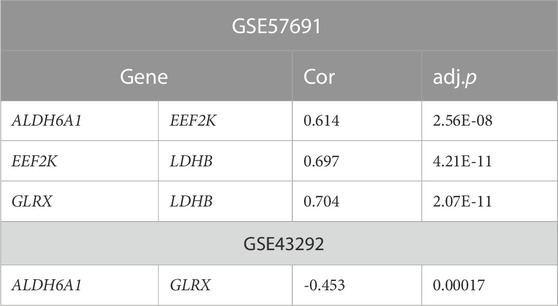
TABLE 4. Correlation analysis of the four genes in the diagnostic model
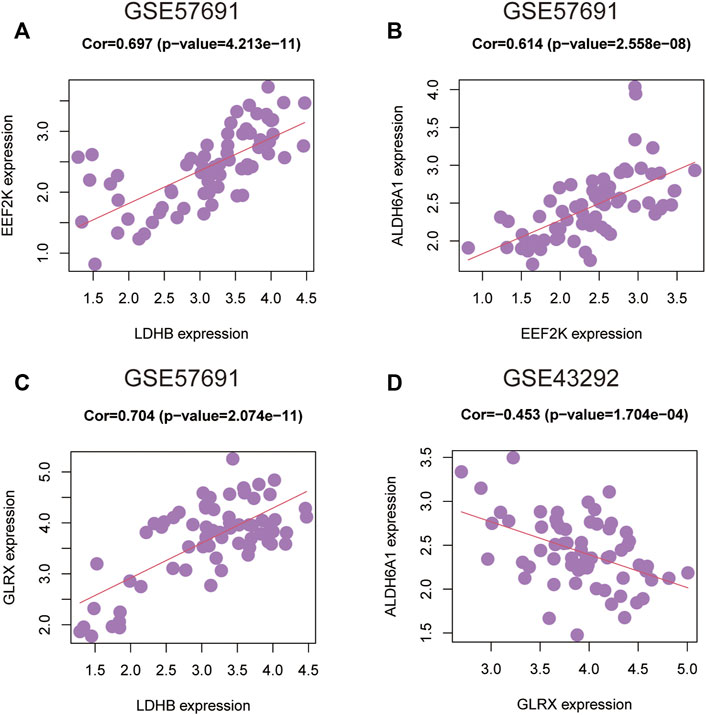
FIGURE 13. Correlation analysis between 4-gene diagnostic models of oxidative stress-related atherosclerosis in the GSE43292 and GSE57691 datasets (A–C) ALDH6A1 and EEF2K (r = 0.614, p = 2.56E-08); EEF2K and LDHB (r = 0.697, p = 4.21E-11); GLRX and LDHB (r = 0.704, p = 2.07E-11) in the GSE57691 dataset (D) ALDH6A1 and GLRX (r = -0.453, p = 0.00017) in the GSE43292 dataset.
Immune cell infiltration correlation analysis
The immune cell infiltration correlation analysis showed the results of our investigation of its immune microenvironment. The four-gene diagnostic models in the GSE57691 dataset correlated with infiltrating immune cells, including that LDHB was positively correlated with activated CD8 T cells (r = 0.601, p = 6.09E-08), CD56bright natural killer cells (r = 0.624, p = 1.35E-08), et al. EEF2K was positively correlated with monocytes (r = 0.651, p = 1.90E-09) and plasmacytoid dendritic cells (r = 0.653, p = 1.59E-09). GLRX was positively correlated with natural killer cells (r = 0.712, p = 1.01E-11) and plasmacytoid dendritic cells (r = 0.633, p = 7.16E-09) (Figure 14 and Table 5). In the other dataset GSE43292, the four genetic diagnostic markers correlated with many infiltrating immune cells, including LDHB with naïve B cells (r = 0.402, p = 0.000983), resting dendritic cells (r = 0.402, p = 0.000983) and CD4 memory resting T cells (r = 0.403, p = 0.000951) et al. (Figure 15 and Table 6).
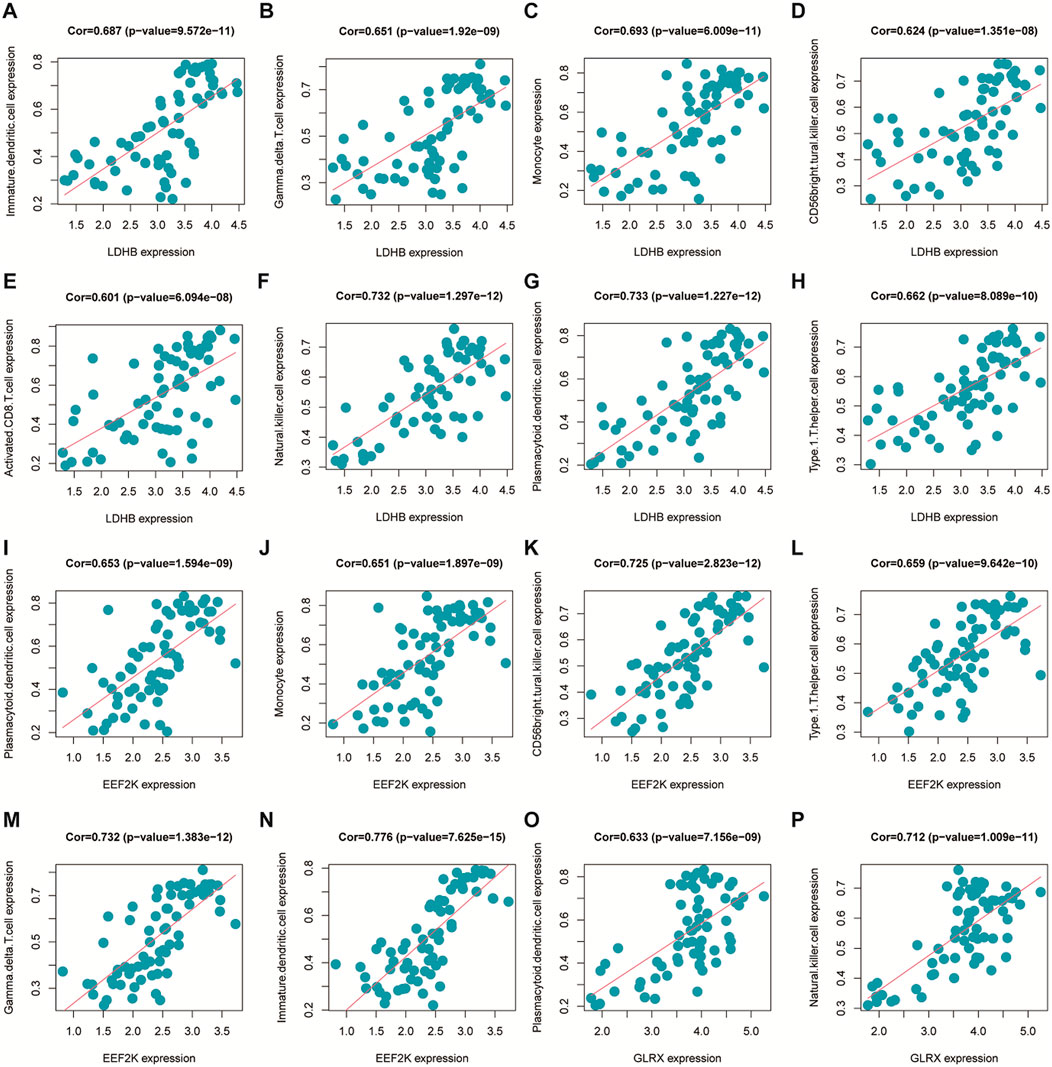
FIGURE 14. Scatter plot of the correlation between gene models and immune cell infiltration in the GSE57691 dataset.
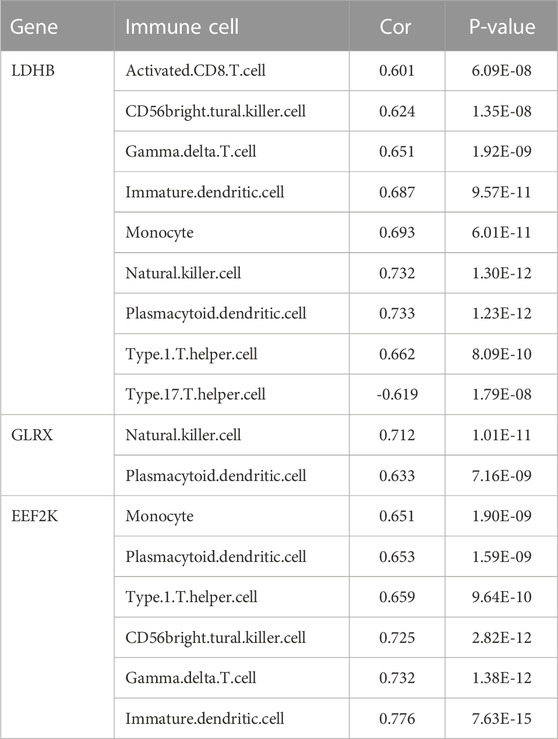
TABLE 5. Correlation analysis of genetic models and immune cell infiltration in the GSE57691 dataset.
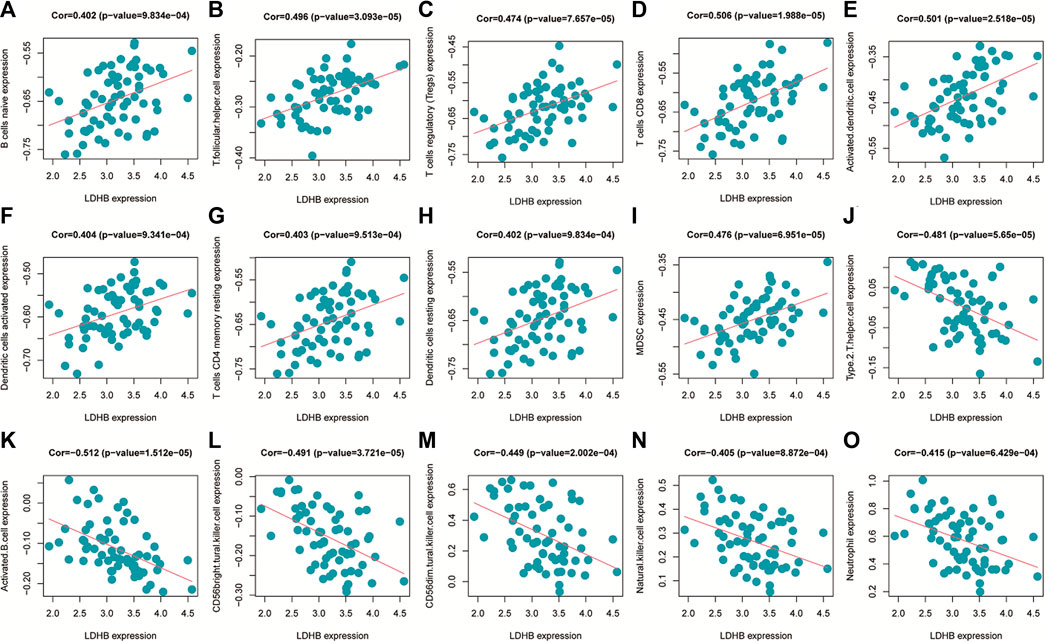
FIGURE 15. Scatter plot of the correlation between gene models and immune cell infiltration in the GSE43292 dataset.
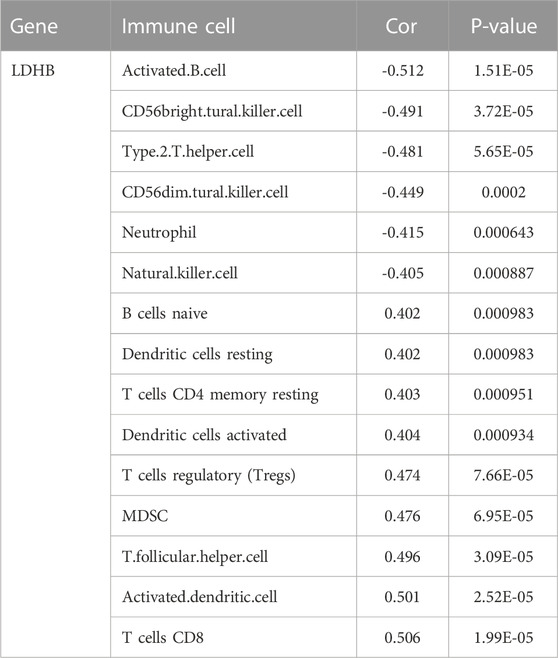
TABLE 6. Correlation analysis of genetic models and immune cell infiltration in the GSE43292 dataset.
Discussion
AS, which includes coronary heart disease and stroke, is the leading cause of death worldwide (Iso, 2021). Coronary heart disease is estimated to affect 126 million people (1,655 per 100,000), accounting for approximately 1.72% of the global population (Khan et al., 2020). Mounting evidence links oxidative stress to the pathophysiology of AS, which is a chronic inflammatory disease characterized by lipid accumulation and swelling of the walls of medium and large arteries (Elahi et al., 2009; Yuan et al., 2019; Yin et al., 2022). However, the biological mechanisms underlying AS with oxidative stress remain unclear.
In this study, a bioinformatics analysis of the GSE57691 and GSE43292 databases was carried out, key genes were identified, and a four gene diagnostic model was constructed. The common DEGs were included after the comparison between the extracted module and the other dataset. Then, 17 hub genes based on the degree of connectivity were selected for further analysis. After LASSO logistic regression was performed and ROC curve was calculated, four DEGs (ALDH6A1, EEF2K, GLRX, and LDHB) with potential diagnostic value were identified as diagnostic markers. Furthermore, our data showed that these four genes were enriched in the following functional pathways: focal adhesion, cell-substrate adherens junction, cell-substrate junction on GO analysis; Alzheimer’s disease, Parkinson’s disease, prion disease pathways on KEGG analysis. The four-gene diagnostic model constructed in the present study included ALDH6A1, EEF2K, GLRX, and LDHB.
ALDH6A1 is a member of the ALDH superfamily, which is highly involved in ROS production which increases dramatically in atherosclerosis (Ajoe et al., 2017; Yang et al., 2017). Studies (Calleja et al., 2021) have shown that aldehyde dehydrogenases (ALDHs) detoxify these aldehydes and protect cells from damage. And ALDH6A1 is found in the liver, kidneys, heart, brain, and muscle (Kedishvili et al., 1992) and its deficiency results in developmental delay, which might play a role in the process of AS (Roe et al., 1998). In addition, in the present study, we found that ALDH6A1 had relatively high diagnostic performance, with an AUC of 0.0.816 for AS in the GSE43292 analysis and an AUC of 0.845 for AS in the GSE57691 analysis.
EEF2K is also demonstrated to be responsible for atherosclerosis in one study (Beretta et al., 2020). Similarly, some tests had been performed to induce AS in mice with inactivating mutations in the EEF2K gene (Zhang et al., 2014). Usui et al. demonstrated that EEF2K controls the proliferation and migration of vascular smooth muscle cells, which mediate hypertension in tested rats via vascular inflammation (Usui et al., 2015). All these studies showed that EEF2K may be highly associated with inflammation and AS.
GLRX is another essential gene demonstrated in a previous study that its primary role is to control protein GSylation during oxidative stress (Burns et al., 2020). GLRX regulates GSylation of many proteins involved in signal transduction, such as phosphatases, kinases, and transcription factors, which contribute to the maintenance of cellular homeostasis. GLRX is associated with a wide variety of diseases such as Parkinson’s disease, non-alcoholic fatty liver disease, lung disease, and AS. There is evidence that GLRX expression increases in atherosclerotic coronary arteries (Okuda et al., 2001) and patients with type 2 diabetes (Du et al., 2014), suggesting that the upregulation of GLRX expression might contribute to inflammation and oxidative stress. Thus, GLRX plays an important role in oxidative stress associated AS.
LDHB, which catalyzes lactate conversion, is a glycolytic enzyme. LDHB deficiency plays an important role in diseases resulting from oxidative stress, as reported by Park et al. (Park et al., 2022). In addition, Wu et al. demonstrated that the knockout of LDHB significantly reduces H2O2 production, showing a direct correlation between LDHB and oxidative stress (Wu et al., 2021). Based on these findings, LDHB may be involved in the development of AS associated with oxidative stress.
Our study showed that the four-gene diagnostic model based on the combined expression of the four genes had good diagnostic performance based on GSE43292 and GSE57691 datasets. The AUC was 0.852 for GSE43292 and 0.967 for GSE57691. Therefore, this diagnostic model is likely to be used to evaluate patients with oxidative stress associated AS.
Besides construction of a diagnostic model, this study made an investigation the immune microenvironment of the four genes, considering that the immune microenvironment may further aggravate the progress of AS associated with oxidative stress. Based on our analysis by CIBERSORT and ssGSEA, it was found that the immune cells exhibiting significant differences in the two datasets included CD4 memory activated T cells, follicular helper cells, M2 macrophages, et al. The role and mechanism of T-cells, monocytes, and lymphocytes in AS are not clear, but the genes related to the immune system have become an potential target in the treating of AS. Emerging studies (Xu and Yang, 2020; Zhao et al., 2020) have revealed that immune cells participate in AS progression. Several experimental studies (Yin et al., 2021) have demonstrated that T cells play a key role in the immune response observed during atherogenesis. As cholesterol accumulates in the arteries and inflammation occurs, naïve CD4 T cells differentiate into adaptive cells, and the adaptive T cell response is induced. Atherogenesis increases memory CD4 T cell expansion and the generation of antigen-experienced T cells, which could be the result of re-exposure to antigens, and memory CD4 T cells will further elicit stronger and more sustained immune responses. Recent studies have demonstrated that immature dendritic cells are present in the endothelium of healthy arteries (Gao et al., 2016; Worbs et al., 2017). However, during the progression of atherosclerotic lesions, most dendritic cell populations appear to be activated and expand rapidly (Koltsova and Ley, 2011; Alberts-Grill et al., 2013). In the subendothelial space of the aorta, dendritic cells can accumulate lipids within the subendothelial space in the aorta and thus facilitate disease initiation and progression (Taghavie-Moghadam et al., 2014). Furthermore, activated dendritic cells are capable of producing proinflammatory molecules. As previous studies (Xu and Yang, 2020; Simões and Riley, 2022) have shown, CD8 T cells also contribute to the development of atherogenesis, as their numbers significantly increase as human lesions progress and become more vulnerable to ruptures.
This study has several limitations. First, the potential genes associated with oxidative stress identified in this study need further literature support and laboratory proof. Second, the genes associated with oxidative stress were derived from the GeneCards database, which is continuously being updated, and more genes need to be discovered. Third, to determine the diagnostic accuracy of the four-gene diagnostic model, larger sample sizes would be helpful for further external validation. Fourth, because AS is heterogeneous and clinical data are lacking, we were unable to evaluate the associations between risk indicators and the stratification of patients based on AS severity. Finally, experimental evidence, such as that obtained by real-time PCR, western blotting, and immunohistochemistry assays, is still required to fully understand the hub genes and underlying mechanisms of AS associated with oxidative stress.
Conclusion
We identified 17 hub genes that were closely associated with oxidative stress in AS and constructed a four-gene (ALDH6A1, EEF2K, GLRX, and LDHB) diagnostic model with good accuracy. This model was also found to have good discriminatory efficacy for the immune cell infiltration microenvironment of AS. Overall, these findings provide valuable information and directions for future research into AS diagnosis and could aid in the discovery of the biological mechanisms underlying AS with oxidative stress.
Data availability statement
The datasets presented in this study can be found in online repositories. The names of the repository/repositories and accession number(s) can be found in the article/Supplementary Material.
Author contributions
Conceptualization, CT; methodology, LD, QL, and GH; software, QL; validation, LD, QL, and GH; writing—original draft preparation, CT and GH; writing—review and editing, CT; visualization, LD and QL; supervision, CT. All authors have read and agreed to the published version of the manuscript.
Acknowledgments
We sincerely thank for the support from the Third People’s Hospital of Chengdu.
Conflict of interest
The authors declare that the research was conducted in the absence of any commercial or financial relationships that could be construed as a potential conflict of interest.
Publisher’s note
All claims expressed in this article are solely those of the authors and do not necessarily represent those of their affiliated organizations, or those of the publisher, the editors and the reviewers. Any product that may be evaluated in this article, or claim that may be made by its manufacturer, is not guaranteed or endorsed by the publisher.
Supplementary material
The Supplementary Material for this article can be found online at: https://www.frontiersin.org/articles/10.3389/fgene.2022.998954/full#supplementary-material
References
Ajoe, J. K., Naga, V. K., Deepak, P., and Mehta, J. L. (2017). Oxidative stress in atherosclerosis. Curr. Atheroscler. Rep. 19 (11), 42. doi:10.1007/s11883-017-0678-6
Alberts-Grill, N., Denning, T., Rezvan, A., and Jo, H. (2013). The role of the vascular dendritic cell network in atherosclerosis. Am. J. Physiol. Cell Physiol. 305 (1), 1–21. doi:10.1152/ajpcell.00017.2013
Ashburner, M., Ball, C., Blake, J., Botstein, D., Butler, H., Cherry, J., et al. (2000). Gene ontology: Tool for the unification of biology. The gene ontology consortium. Nat. Genet. 25 (1), 25–29. doi:10.1038/75556
Ayari, H., and Bricca, G. (2013). Identification of two genes potentially associated in iron-heme homeostasis in human carotid plaque using microarray analysis. J. Biosci. 38 (2), 311–315. doi:10.1007/s12038-013-9310-2
Beretta, S., Gritti, L., Verpelli, C., and Sala, C. (2020). Eukaryotic elongation factor 2 kinase a pharmacological target to regulate protein translation dysfunction in neurological diseases. Neuroscience 445, 42–49. doi:10.1016/j.neuroscience.2020.02.015
Biros, E., Gäbel, G., Moran, C., Schreurs, C., Lindeman, J., Walker, P., et al. (2015). Differential gene expression in human abdominal aortic aneurysm and aortic occlusive disease. Oncotarget 6 (15), 12984–12996. doi:10.18632/oncotarget.3848
Bryk, D., Olejarz, W., and Zapolska-Downar, D. (2017). The role of oxidative stress and NADPH oxidase in the pathogenesis of atherosclerosis. Postepy Hig. Med. Dosw. 71, 57–68. doi:10.5604/17322693.1229823
Burns, M., Rizvi, S. H. M., Tsukahara, Y., Pimentel, D. R., Luptak, I., Hamburg, N. M., et al. (2020). Role of glutaredoxin-1 and glutathionylation in cardiovascular diseases. Int. J. Mol. Sci. 21 (18), 6803. doi:10.3390/ijms21186803
Calleja, L., Yoval-Sánchez, B., Hernández-Esquivel, L., Gallardo-Pérez, J., Sosa-Garrocho, M., Marín-Hernández, Á., et al. (2021). Activation of ALDH1A1 by omeprazole reduces cell oxidative stress damage. FEBS J. 288 (13), 4064–4080. doi:10.1111/febs.15698
Du, Y., Zhang, H., Montano, S., Hegestam, J., Ekberg, N., Holmgren, A., et al. (2014). Plasma glutaredoxin activity in healthy subjects and patients with abnormal glucose levels or overt type 2 diabetes. Acta Diabetol. 51 (2), 225–232. doi:10.1007/s00592-013-0498-2
Elahi, M., Kong, Y., and Matata, B. (2009). Oxidative stress as a mediator of cardiovascular disease. Oxid. Med. Cell. Longev. 2 (5), 259–269. doi:10.4161/oxim.2.5.9441
Fornes, O., Castro-Mondragon, J., Khan, A., van der Lee, R., Zhang, X., Richmond, P., et al. (2020). Jaspar 2020: Update of the open-access database of transcription factor binding profiles. Nucleic Acids Res. 48 (D1), D87–D92. doi:10.1093/nar/gkz1001
Gao, W., Liu, H., Yuan, J., Wu, C., Huang, D., Ma, Y., et al. (2016). Exosomes derived from mature dendritic cells increase endothelial inflammation and atherosclerosis via membrane TNF-α mediated NF-κB pathway. J. Cell. Mol. Med. 20 (12), 2318–2327. doi:10.1111/jcmm.12923
Hansen, S., Madsen, C., Varbo, A., and Nordestgaard, B. (2019). Low-grade inflammation in the association between mild-to-moderate hypertriglyceridemia and risk of acute pancreatitis: A study of more than 115000 individuals from the general population. Clin. Chem. 65 (2), 321–332. doi:10.1373/clinchem.2018.294926
Hänzelmann, S., Castelo, R., and Guinney, J. (2013). Gsva: Gene set variation analysis for microarray and RNA-seq data. BMC Bioinforma. 14 (7), 7. doi:10.1186/1471-2105-14-7
Huang, H., Lin, Y., Li, J., Huang, K., Shrestha, S., Hong, H., et al. (2020). miRTarBase 2020: updates to the experimentally validated microRNA-target interaction database. Nucleic Acids Res. 48 (D1), D148–D154. doi:10.1093/nar/gkz896
Iso, H. (2021). Cardiovascular disease, a major global burden: Epidemiology of stroke and ischemic heart disease in Japan. Glob. Health Med. 3 (6), 358–364. doi:10.35772/ghm.2020.01113
Kanehisa, M., and Goto, S. (2000). Kegg: Kyoto encyclopedia of genes and genomes. Nucleic Acids Res. 28 (1), 27–30. doi:10.1093/nar/28.1.27
Kedishvili, N., Popov, K., Rougraff, P., Zhao, Y., Crabb, D., and Harris, R. (1992). CoA-dependent methylmalonate-semialdehyde dehydrogenase, a unique member of the aldehyde dehydrogenase superfamily. cDNA cloning, evolutionary relationships, and tissue distribution. J. Biol. Chem. 267 (27), 19724–19729. doi:10.1016/s0021-9258(18)41835-2
Khan, M., Hashim, M., Mustafa, H., Baniyas, My., Al, S. S., AlKatheeri, R., et al. (2020). Global epidemiology of ischemic heart disease: Results from the global burden of disease study. Cureus 12 (7), e9349. doi:10.7759/cureus.9349
Khosravi, M., Poursaleh, A., Ghasempour, G., Farhad, S., and Najafi, M. (2019). The effects of oxidative stress on the development of atherosclerosis. Biol. Chem. 400 (6), 711–732. doi:10.1515/hsz-2018-0397
Koltsova, E., and Ley, K. (2011). How dendritic cells shape atherosclerosis. Trends Immunol. 32 (11), 540–547. doi:10.1016/j.it.2011.07.001
Lachmann, A., Xu, H., Krishnan, J., Berger, S., Mazloom, A., and Ma’ayan, A. (2010). ChEA: Transcription factor regulation inferred from integrating genome-wide ChIP-X experiments. Bioinforma. Oxf. Engl. 26 (19), 2438–2444. doi:10.1093/bioinformatics/btq466
Libby, P. (2021). The changing nature of atherosclerosis: What we thought we knew, what we think we know, and what we have to learn. Eur. Heart J. 42 (47), 4781–4782. doi:10.1093/eurheartj/ehab438
Liberzon, A., Birger, C., Thorvaldsdóttir, H., Ghandi, M., Mesirov, J., and Tamayo, P. (2015). The Molecular Signatures Database (MSigDB) hallmark gene set collection. Cell Syst. 1 (6), 417–425. doi:10.1016/j.cels.2015.12.004
Mering, C., Huynen, M., Jaeggi, D., Schmidt, S., Bork, P., and Snel, B. (2003). String: A database of predicted functional associations between proteins. Nucleic Acids Res. 31 (1), 258–261. doi:10.1093/nar/gkg034
Nikpay, M., Goel, A., Won, H., Hall, L., Willenborg, C., Kanoni, S., et al. (2015). A comprehensive 1, 000 Genomes-based genome-wide association meta-analysis of coronary artery disease. Nat. Genet. 47 (10), 1121–1130. doi:10.1038/ng.3396
Okuda, M., Inoue, N., Azumi, H., Seno, T., Sumi, Y., Hirata, K. N., et al. (2001). Expression of glutaredoxin in human coronary arteries: Its potential role in antioxidant protection against atherosclerosis. Arterioscler. Thromb. Vasc. Biol. 21 (9), 1483–1487. doi:10.1161/hq0901.095550
Park, J., Saeed, K., Jo, M., Kim, M., Lee, H., Park, C., et al. (2022). LDHB deficiency promotes mitochondrial dysfunction mediated oxidative stress and neurodegeneration in adult mouse brain. Antioxidants 11 (2), 261. doi:10.3390/antiox11020261
Ridker, P. (2016). A test in context: High-sensitivity C-reactive protein. J. Am. Coll. Cardiol. 67 (6), 712–723. doi:10.1016/j.jacc.2015.11.037
Ridker, P., Koenig, W., Kastelein, J., Mach, F., and Lüscher, T. (2018). Has the time finally come to measure hsCRP universally in primary and secondary cardiovascular prevention? Eur. Heart J. 39 (46), 4109–4111. doi:10.1093/eurheartj/ehy723
Roe, C., Struys, E., Kok, R., Roe, D., Harris, R., and Jakobs, C. (1998). Methylmalonic semialdehyde dehydrogenase deficiency: Psychomotor delay and methylmalonic aciduria without metabolic decompensation. Mol. Genet. Metab. 65 (1), 35–43. doi:10.1006/mgme.1998.2737
Rongbin, Z., Changxin, W., Shenglin, M., Qian, Q., Qiu, W., Hanfei, S., et al. (2019). Cistrome data browser: Expanded datasets and new tools for gene regulatory analysis. Nucleic Acids Res. 47 (1), D729–D735. doi:10.1093/nar/gky1094
Safran, M., Dalah, I., Alexander, J., Rosen, N., Iny, S, T., Shmoish, M., et al. (2010). GeneCards version 3: The human gene integrator. Database 2010, baq020. doi:10.1093/database/baq020
Shannon, P., Markiel, A., Ozier, O., Baliga, N., Wang, J., Ramage, D., et al. (2003). Cytoscape: A software environment for integrated models of biomolecular interaction networks. Genome Res. 13 (11), 2498–2504. doi:10.1101/gr.1239303
Simões, F., and Riley, P. (2022). Immune cells in cardiac repair and regeneration. Dev. Camb. Engl. 149 (8), dev199906. doi:10.1242/dev.199906
Smolyaninov, I., Burmistrova, D., Arsenyev, M., Polovinkina, M., Pomortseva, N., Fukin, G., et al. (2022). Synthesis and antioxidant activity of new catechol thioethers with the methylene linker. Mol. (Basel, Switz. 27 (10), 3169. doi:10.3390/molecules27103169
Steen, C., Liu, C., Alizadeh, A., and Newman, A. (2020). Profiling cell type abundance and expression in bulk tissues with CIBERSORTx. Methods Mol. Biol. 2117, 135–157. doi:10.1007/978-1-0716-0301-7_7
Subramanian, A., Tamayo, P., Mootha, V., Mukherjee, S., Ebert, B., Gillette, M., et al. (2005). Gene set enrichment analysis: A knowledge-based approach for interpreting genome-wide expression profiles. Proc. Natl. Acad. Sci. U. S. A. 102 (43), 15545–15550. doi:10.1073/pnas.0506580102
Taghavie-Moghadam, P., Butcher, M., and Galkina, E. (2014). The dynamic lives of macrophage and dendritic cell subsets in atherosclerosis. Ann. N. Y. Acad. Sci. 1319 (1), 19–37. doi:10.1111/nyas.12392
Tibaut, M., Caprnda, M., Kubatka, P., Sinkovič, A., Valentova, V., Filipova, S., et al. (2018). Markers of atherosclerosis: Part 2 - genetic and imaging markers. Heart Lung Circ. 28 (5), 678–689. doi:10.1016/j.hlc.2018.09.006
Tibaut, M., Ramuš, S. M., and Petrovič, D. (2020). The C allele of the reactive oxygen species modulator 1 (ROMO1) polymorphism rs6060566 is a biomarker predicting coronary artery stenosis in Slovenian subjects with type 2 diabetes mellitus. BMC Med. Genomics 13 (1), 184. doi:10.1186/s12920-020-00845-3
Tsao, C. W., Aday, A. W., Almarzooq, Z. I., Alonso, A., Beaton, A. Z., Bittencourt, M. S., et al. (2022). Heart disease and stroke statistics—2022 update: A report from the American heart association. Circulation 145 (8), e153–e639. doi:10.1161/CIR.0000000000001052
Usui, T., Nijima, R., Sakatsume, T., Otani, K., Kameshima, S., Okada, M., et al. (2015). Eukaryotic elongation factor 2 kinase controls proliferation and migration of vascular smooth muscle cells. Acta Physiol. 213 (2), 472–480. doi:10.1111/apha.12354
Vasquez, M. M., Hu, C., Roe, D. J., Chen, Z., Halonen, M., and Guerra, S. (2016). Least absolute shrinkage and selection operator type methods for the identification of serum biomarkers of overweight and obesity: Simulation and application. BMC Med. Res. Methodol. 16 (1), 154. doi:10.1186/s12874-016-0254-8
Wang, S., Sun, H., Ma, J., Zang, C., Wang, C., Wang, J., et al. (2013). Target analysis by integration of transcriptome and ChIP-seq data with BETA. Nat. Protoc. 8 (12), 2502–2515. doi:10.1038/nprot.2013.150
Wilkerson, M., and Hayes, D. (2010). ConsensusClusterPlus: A class discovery tool with confidence assessments and item tracking. Bioinformatics 26 (12), 1572–1573. doi:10.1093/bioinformatics/btq170
Worbs, T., Hammerschmidt, S., and Förster, R. (2017). Dendritic cell migration in health and disease. Nat. Rev. Immunol. 17 (1), 30–48. doi:10.1038/nri.2016.116
Wu, H., Wang, Y., Ying, M., Jin, C., Li, J., and Hu, X. (2021). Lactate dehydrogenases amplify reactive oxygen species in cancer cells in response to oxidative stimuli. Signal Transduct. Target. Ther. 6 (1), 242. doi:10.1038/s41392-021-00595-3
Xiao, L., and Harrison, D. (2020). Inflammation in hypertension. Can. J. Cardiol. 36 (5), 635–647. doi:10.1016/j.cjca.2020.01.013
Xu, J., and Yang, Y. (2020). Potential genes and pathways along with immune cells infiltration in the progression of atherosclerosis identified via microarray gene expression dataset re-analysis. Vascular 28 (5), 643–654. doi:10.1177/1708538120922700
Xu, Y., Wei, Z., Xue, C., and Huang, Q. (2022). Covalent modification of zein with polyphenols: A feasible strategy to improve antioxidant activity and solubility. J. Food Sci. 87 (7), 2965–2979. doi:10.1111/1750-3841.16203
Yang, X., Li, Y., Li, Y., Ren, X., Zhang, X., Hu, D., et al. (2017). Oxidative stress-mediated atherosclerosis: Mechanisms and therapies. Front. Physiol. 8, 600. doi:10.3389/fphys.2017.00600
Yin, X., Wang, X., Wang, S., Xia, Y., Chen, H., Yin, L., et al. (2022). Screening for regulatory network of miRNA-inflammation, oxidative stress and prognosis-related mRNA in acute myocardial infarction: An in silico and validation study. Int. J. Gen. Med. 15, 1715–1731. doi:10.2147/IJGM.S354359
Yin, Y., Zou, Y., Xiao, Y., Wang, T., Wang, Y., Dong, Z., et al. (2021). Identification of potential hub genes of atherosclerosis through bioinformatic analysis. J. Comput. Biol. 28 (1), 60–78. doi:10.1089/cmb.2019.0334
Yuan, T., Yang, T., Chen, H., Fu, D., Hu, Y., Wang, J., et al. (2019). New insights into oxidative stress and inflammation during diabetes mellitus-accelerated atherosclerosis. Redox Biol. 20, 247–260. doi:10.1016/j.redox.2018.09.025
Zhang, P., Riazy, M., Gold, M., Tsai, S., McNagny, K., Proud, C., et al. (2014). Impairing eukaryotic elongation factor 2 kinase activity decreases atherosclerotic plaque formation. Can. J. Cardiol. 30 (12), 1684–1688. doi:10.1016/j.cjca.2014.09.019
Zhao, B., Wang, D., Liu, Y., Zhang, X., Wan, Z., Wang, J., et al. (2020). Six-gene signature associated with immune cells in the progression of atherosclerosis discovered by comprehensive bioinformatics analyses. Cardiovasc. Ther. 2020, 1230513. doi:10.1155/2020/1230513
Zhao, X., He, Y., Zhang, Y., Wan, H., Wan, H., and Yang, J. (2022). Inhibition of oxidative stress: An important molecular mechanism of Chinese herbal medicine (Astragalus membranaceus, Carthamus tinctorius L., radix salvia miltiorrhizae, etc.) in the treatment of ischemic stroke by regulating the antioxidant system. Oxid. Med. Cell. Longev. 2022, 1425369. doi:10.1155/2022/1425369
Keywords: oxidative stress, atherosclerosis, GEO, LASSO, immune
Citation: Tang C, Deng L, Luo Q and He G (2023) Identification of oxidative stress-related genes and potential mechanisms in atherosclerosis. Front. Genet. 13:998954. doi: 10.3389/fgene.2022.998954
Received: 20 July 2022; Accepted: 05 December 2022;
Published: 04 January 2023.
Edited by:
Loredana Bury, University of Perugia, ItalyReviewed by:
Daniel Petrovič, University of Ljubljana, SloveniaRahim Alhamzawi, University of Al-Qadisiyah, Iraq
Copyright © 2023 Tang, Deng, Luo and He. This is an open-access article distributed under the terms of the Creative Commons Attribution License (CC BY). The use, distribution or reproduction in other forums is permitted, provided the original author(s) and the copyright owner(s) are credited and that the original publication in this journal is cited, in accordance with accepted academic practice. No use, distribution or reproduction is permitted which does not comply with these terms.
*Correspondence: Chao Tang, MzExOTMwOEBxcS5jb20=