 Xia Liu
- Department of Medical Oncology, Guangzhou First People’s Hospital, South China University of Technology, Guangzhou, Guangdong, China
Background: Fatty acid metabolism (FAM), as a hallmark of caner, plays important roles in tumor initiation and carcinogenesis. However, the significance of fatty acid metabolism-related genes in colon adenocarcinoma (COAD) are largely unknown.
Methods: RNA sequencing data and clinical information were downloaded from the Cancer Genome Atlas (TCGA) cohort. Univariate and multivariate Cox regression analyses were utilized to construct a fatty acid metabolism-related gene signature. Kaplan-Meier survival and receiver operating characteristic (ROC) analyses were used to verify the performance of this signature. GEO datasets were applied to validate the signature. Maftools package was utilized to analyze the mutation profiles of this signature. Correlation between the risk signature and stemness scores was compared by RNA stemness score (RNAss). Gene Ontology (GO), Kyoto Encyclopedia of Genes and Genomes (KEGG) and gene set variation analysis (GSVA) were performed to explore the potential functions and signaling pathways. Immune landscape of the signature was explored by analyzing different immune cells infiltration, immune functions and microsatellite instability. A nomogram was constructed by combining the risk signature and multiple clinical factors. Expression levels and prognostic values of the risk genes were revealed in the cancer genome atlas and GEO databases. Moreover, the expression the risk genes were measured in cell lines using real time quantitative PCR (qRT-PCR).
Results: Eight fatty acid metabolism-related genes (CD36, ENO3, MORC2, PTGR1, SUCLG2, ELOVL3, ELOVL6 and CPT2) were used to construct a risk signature. This signature demonstrated better prognostic value than other clinicopathological parameters, with AUC value was 0.734 according to the cancer genome atlas database. There was negative correlation between the riskscore and RNA stemness score. The patients in the high-risk group demonstrated higher infiltration of M0 macrophages, and less infiltration of activated CD4 memory T cells and Eosinophils. There were more MSI patients in the high-risk group than those in the low-risk group (38% vs. 30%). The risk scores of patients in the MSI group were slightly higher than those in the microsatellite stability group. Gene ontology, kyoto encyclopedia of genes and genomes and gene set variation analysis enrichment analyses showed that several metabolism-related functions and signaling pathways were enriched. A nomogram showed good predictive capability of the signature. Moreover, qRT-PCR revealed upregulated expression of ENO3, MORC2, SUCLG2 and ELOVL6, and downregulated expression of CPT2 in all examined colon adenocarcinoma cell lines.
Conclusion: This study provided novel insights into a fatty acid metabolism-related signature in the prognosis an immune landscape of colon adenocarcinoma patients.
Introduction
Colorectal cancer is the third most common malignancy and second predominant cause of cancer-related death worldwide (Sung et al., 2021). Among all the histopathological types, colon adenocarcinoma (COAD) accounts for the major part. The incidence of COAD is increasing yearly in China. Recently, the development of targeted therapy and immune checkpoint inhibitors (ICIs) have gained advancements in COAD (Loupakis et al., 2014; Chen 2015; Yaghoubi et al., 2019). However, only partial patients could benefit from these treatments, which depending on the gene mutation state and microsatellite instability status of cancer patients (Ganesh et al., 2019; Yaghoubi et al., 2019; Ladabaum et al., 2020). Therefore, it is essential to identify novel diagnostic and prognostic biomarker, as well as treatment target for COAD patients.
Metabolism reprogramming, as a hallmark of cancer, contributes to the carcinogenesis and progression of malignancies (Navarro et al., 2022; Zhang et al., 2022). Most of the current studies were focused on glycolysis and mitochondrial oxidative phosphorylation (Song et al., 2021; Jones et al., 2022). Recently, the roles of fatty acid metabolism (FAM) in tumor development have gained a lot of attentions (Wang et al., 2022; Xiong et al., 2022). Fatty acid metabolism could provide nutrition to support the growth of tumor cells and help tumor cells to adapt to tumor microenvironment (Zhang et al., 2022). Numerous studies have shown that abnormal expression of FAM-related genes was capable of predicting the survival of colon adenocarcinoma (Geng et al., 2021; Mokhtari et al., 2022). And FAM-related genes were involved in cell proliferation, migration and invasion (Liu Y. et al., 2022). For example, EPHX2 was identified as a tumor suppressor in colorectal carcinoma (CRC), which repressed CRC progression by inducing fatty acid degradation (Zhou et al., 2022). HMG-CoA lyase (HMGCL), which converts HMG-CoA to acetyl-CoA and a ketone body, could activate MEK1, and promote the proliferation of BRAF-positive melanoma and colon cancer cells (Zhao et al., 2017). HMGCL was reported as a prognostic factor in colon adenocarcinoma (Zhao F. et al., 2021). Although the predictive capabilities and functions of some FAM-related genes have been revealed, limited studies have comprehensively revealed the FAM-related gene signature in COAD. Moreover, the biological function and immune profile of these FAM-related genes were not well explored in COAD.
This study was designed to construct a predictive signature by comprehensively screening fatty acid metabolism-related genes. Moreover, the predictive capability, association with immune microenvironment, and functional enrichment of this risk signature were further studied. All these results suggested that this FAM-related gene signature with promising predictive capability in colon cancer. And this study would help us to further understand the mechanisms of FAM in COAD.
Material and methods
Data acquisition and identification of fatty acid metabolism-related genes
RNA sequencing data and clinical data of colon adenocarcinoma patients were obtained from the TCGA or GEO databases. There were 39 cases of normal tissues and 404 cases of COAD tumor tissues in TCGA-COAD cohort. Other datasets, including GSE39582 and GSE110224, were downloaded from the GEO database. GSE39582, including 585 COAD cases, was used for survival analyses. And GSE110224, including 17 pairs of normal tissues and tumor tissues, was utilized for differential expression analyses. A list of 309 FAM-related genes was acquired by literatures searching. Differentially expressed FAM-related genes were identified using “limma” package based on the following criteria |log2FC| > 1 and false discovery rate (FDR) < 0.05, and the results were visualized by a heatmap in R software (version 4.2.0).
Univariate and multivariate cox regression analyses
FAM-related genes with prognostic values were identified using “survival” and “survminer” packages in R software. Firstly, univariate cox regression was utilized to retrieve prognostic FAM-related genes. Moreover, multivariate cox regression was performed to screen genes to construct a risk signature.
The least absolute shrinkage and selection operator (LASSO) analysis
LASSO analysis was performed using “glmnet” and “survival” packages based on the survival data and expression data of the genes in the risk signature by using R software.
Validation of the predictive capability of the risk signature in the cancer genome atlas-colon adenocarcinoma cohort
Risk score was calculated using the following formula: risk score = (coefficient1* mRNA expression level of gene1) + (coefficient2* mRNA expression level of gene2) +…… + (coefficientN* mRNA expression level of geneN). Patients were divided into high-risk group and low-risk group based on the median risk score. Firstly, Kaplan-Meier survival analysis was used to verify the performance of the risk signature in predicting the overall survival (OS) of cancer patients using “survival” package. ROC was conducted using “survivalROC” package. Risk score distribution and survival status distribution were visualized using R software.
Validation of prognostic significance of risk model in GEO database
To validate the prominent prognostic value of the risk score, the gene expression microarray database GSE39582 was selected to perform further analysis. The risk score was calculated based on the expression of 8 FAM-related genes, followed by the Kaplan-Meier survival analysis and ROC analysis. Risk score and survival status distribution were also visualized by the “survival” package of R software.
Mutation profiles of the risk signature
Somatic variation of the risk signature was profiled using “maftools” package in R software.
Correlation with RNA stemness score (RNAss)
The correlation between the risk scores and RNA stemness score were compared in R software based on “StemnessScores_RNAexp_20170127.2. tsv”.
Immune correlations
The immune cells infiltration data was retrieved from CIBERSORT tool. Immune cells infiltration data was retrieved using “e1071”, “parallel”, and “preprocessCore'” packages. The correlations between the risk signature and immune cells infiltration were assessed using “limma”, “reshape2” and “ggpubr” packages in R software. The differences in various immune functions between high-risk group and low-risk group were compared using “limma”, “GSVA”, “GSEABase”, “ggpubr” and “reshape2” packages in R software.
Association between the risk score and microsatellite instability status
The correlations between risk score and MSI status were analyzed using “plyr”, “ggplot2” and “ggpubr” packages in R software.
Functional enrichment analysis
The Gene Ontology (GO) and Kyoto Encyclopedia of Genes and Genomes (KEGG) functional enrichment analyses were used to explore potential biological functions and signal pathways using “clusterProfiler”, “org.Hs.eg.db”, “enrichplot”, and “ggplot2d” packages in R software.
Gene set variation analysis (GSVA)
To explore pathways differentially enriched in high-risk and low-risk groups, GSVA was performed using “limma”, “GSEABase” and “GSVA” packages by using “c2. cp.kegg.v7.4. symbols.gmt” as a reference gene set. The results were visualized by a heatmap.
Prognostic values of the risk signature
Univariate and multivariate cox regression analyses were utilized to determine the predictive capabilities of the FAM-related gene signature and various clinicopathological parameters using “survival” package in R software. Moreover, ROC of FAM-related gene signature and various clinicopathological parameters were compared using “survial”, “survminer” and “time ROC” packages.
Construction of a nomogram
A nomogram including the risk signature and various clinical factors (age, gender and stage) was constructed using “survival”, “survminer”, and “timeROC” packages. The predictive capability of the nomogram was assessed by ROC curves. Univariate cox regression was utilized to explore the prognostic roles of the nomogram and various clinical parameters.
Differential expression of the fatty acid metabolism-related genes in public database
RNA expression data of the 8 FAM-related genes were retrieved from the TCGA database and GEO dataset GSE110224. Firstly, the differential expression of these genes in colon tumor tissues and normal tissues were compared using unpaired t test according to data retrieved from the TCGA database. The differential expression of candidate genes retrieved from GEO database was identified using the “limma” and “ggpubr“ packages of R software (version 4.2.0).
Cell line and cell culture
Human colonic epithelial cell line NCM460 and colon adenocarcinoma cells lines (HCT116, CT26 and SW480) were purchased from the Culture Collection of Chinese Academy of Sciences (Shanghai, China). And culture in medium. NCM460 was culture in DMEM medium. While HCT116, CT26 and SW480 were maintained in RPMI 1640 medium. All the culture medium was supplemented with 10% fetal bovine serum.
Real time quantitative PCR (qRT-PCR)
Total RNA was extracted from various cell lines using TRIzol reagent (Thermo Fisher Scientific) as previously described (Lu et al., 2022). cDNA was synthesized and subjected to qRT-PCR. Gene expression was measured using ChamQ universal SYBR qPCR Master Mix. Relative gene expression was calculated using 2-△△Ct method. Relative expression of each gene was normalized to internal control GAPDH. The primer sequences were as follows: GAPDH Forward: CTCCTCCTGTTCGACAGTCAGC, Reverse: CCCAATACGACCAAATCCGTT; CD36 Forward: CTTTGGCTTAATGAGACTGGGAC, Reverse: GCAACAAACATCACCACACCA; ENO3 Forward: TATCGCAATGGGAAGTACGATCT, Reverse: AAGCTCTTATACAGCTCTCCGA; MORC2 Forward: CACGTCAAGCCGTTTCAAGAC, Reverse: AGGCGTACTTCTAATGTCCGA; PTGR1 Forward: AGCACTTTGTTGGCTATCCTAC, Reverse: CCCCATCATTGTATCACCTTCC; SUCLG2 Forward: CAAAAGACCCTAATGTTGTGGGA, Reverse: TTCAGCAACCATCACCTTGTT; ELOVL3 Forward: GGAAGCTGACATCCGGGTAG, Reverse: TCCAGTTCAAGACACACCACC; ELOVL6 Forward: GCACCCGAACTAGGAGATACA, Reverse: CCCCGGCAACCATGTCTTT; CPT2 Forward: CTGGAGCCAGAAGTGTTCCAC, Reverse: AGGCACAAAGCGTATGAGTCT.
Survival analysis of the risk genes
Kaplan Meier survival analysis was utilized to explore the roles of the risk genes in predicting the overall survival of COAD patients. Survival data were retrieved from both TCGA-COAD cohort and GEO dataset GSE39582.
Statistical analysis
All data analyses based on bioinformatic data were performed using R software (Version 4.0.2) or Perl software. Differential expression of the risk genes in various cell lines were compared using student t test in GraphPad Prism. A two-tailed p < 0.05 was statistical significance.
Results
Identification of prognostic fatty acid metabolism (FAM)-related gene signature in COAD
A list of 309 fatty acid metabolism (FAM)-related genes were acquired from literatures screening (Chang and Xing 2022; Li et al., 2022; Tang et al., 2022). RNA-sequencing data of COAD patients were downloaded from the TCGA-COAD cohort. Differentially expressed FAM-related genes were retrieved and displayed in a heatmap (Supplementary Figure S1). Univariate Cox regression analysis identified 18 FAM-related genes with prognostic values (Table 1). Lasso regression analysis was utilized to assess the 18 pronostic related genes (Figures 1A,B). Moreover, multivariate Cox regression analysis identified 8 genes to construct a risk model, which including CD36, ENO3, MORC2, PTGR1, SUCLG2, ELOVL3, ELOVL6 and CPT2 (Table 2).
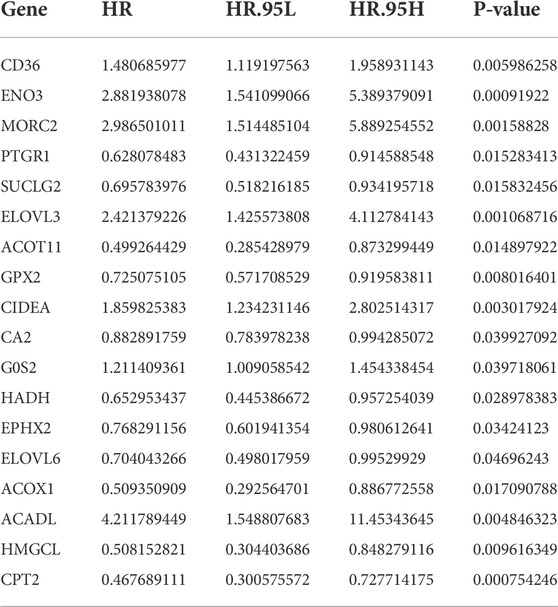
TABLE 1. Univariate Cox regression analysis of FAM-related genes in COAD.
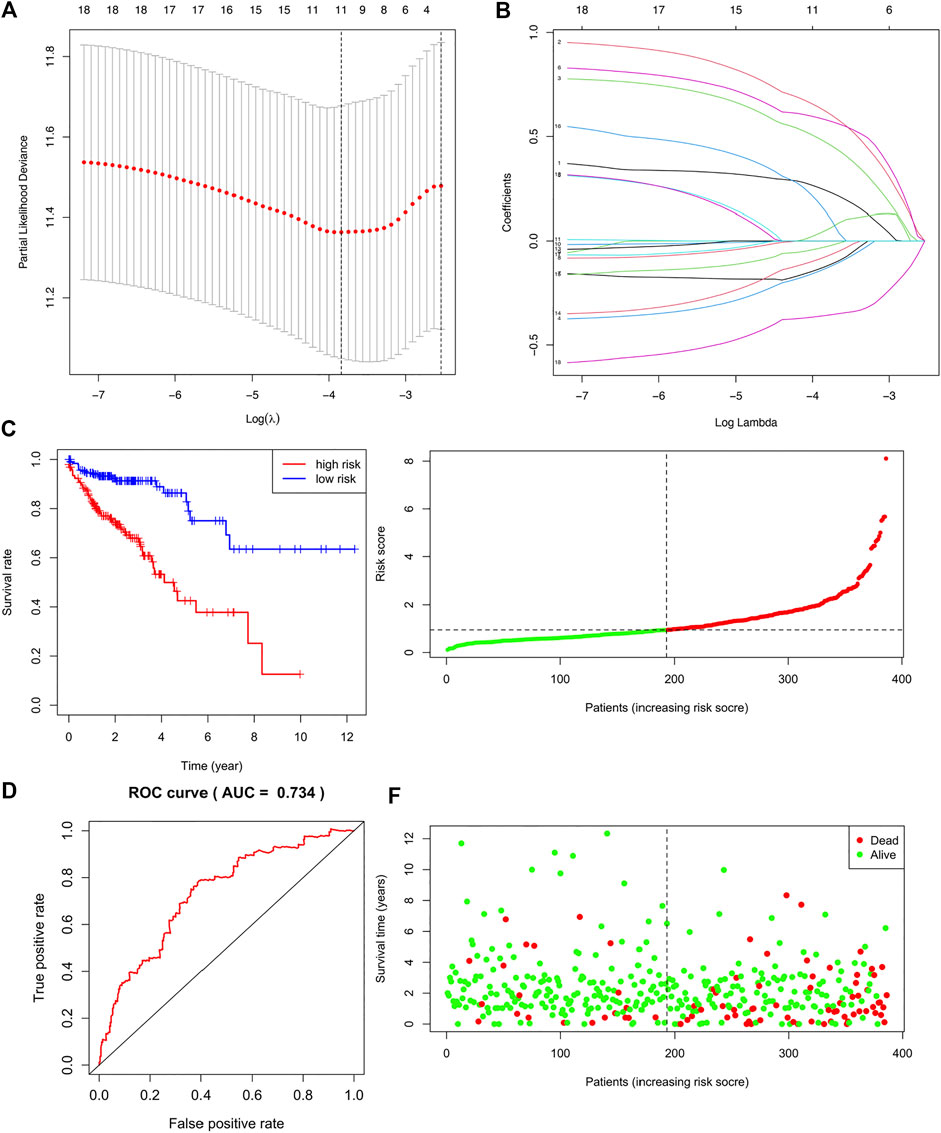
FIGURE 1. Construction and Validation of a fatty acid metabolism-related gene signature in COAD. (A,B) The LASSO coefficient profiles of the 18 FAM-related genes signature. (C) Kaplan-Meier (KM) analysis of OS based on the 8 FAM-related signature. (D) ROC analysis of the risk signature in predicting the OS. (E) Survival status distribution in high-risk group and low-risk group. (F) Risk score distribution of the high-risk group and low-risk group.
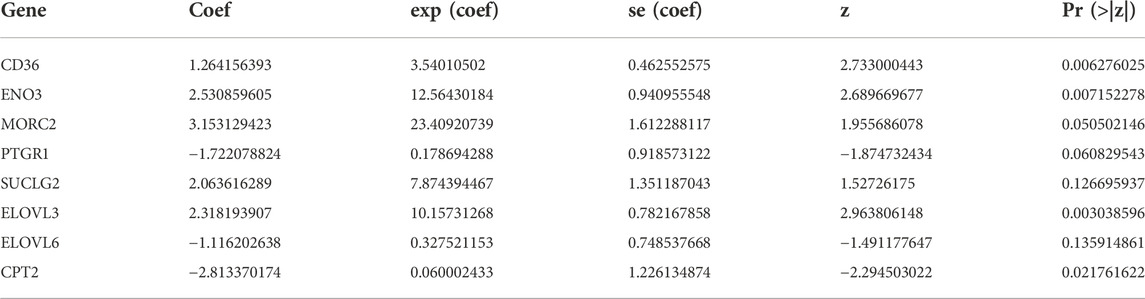
TABLE 2. Multivariate Cox regression analysis of FAM-related genes in COAD.
Validation of the fatty acid metabolism-related genes risk signature
Risk score was calculated based on the coefficient values and mRNA expression data of these eight risk genes. The patients were divided into high-risk and low-risk groups based on the median risk score. We firstly validated the performance of the risk signature in predicting the OS of colon adenocarcinoma patients. KM curve revealed that COAD patients in high-risk group demonstrated worse survival than patients in low-risk group (Figure 1C, p = 0.243e-08). The AUC of the ROC analysis was 0.734, which indicating that the signature was with good prognostic accuracy (Figure 1D). The survival status and risk sore distribution showed that the risk signature could well differentiate the high-risk and low-risk groups (Figures 1E,F). Moreover, we validated the risk signature using GEO database (Supplementary Figure S2).
Mutation profiles and relationships with stemess scores of the risk model
The mutation frequencies of these risk genes were analyzed and displayed by a “maftools” package. As shown in Figure 2A, the mutation rates of these genes were very low. Moreover, there was negative correlation between the risk core and RNA stemness score (RNAss) (R = −0.33, p = 3.8e-11, Figure 2B).
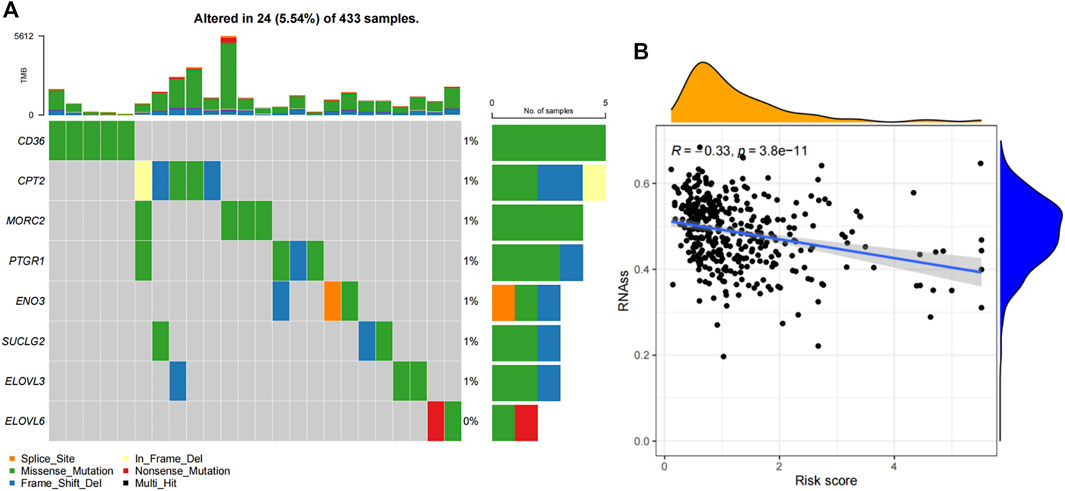
FIGURE 2. Mutation profiles and stemness correlation of the FAM-related signature. (A) The mutation profiles of these 8 genes. (B) The association between the risk score and RNAss.
Immune landscape of the risk signature
Given the immunotherapies have changed the treatment strategies of colon cancer, as well as there are limited effective biomarkers in predicting the treatment efficacy of immunotherapy, we further investigated the immune landscape of the risk signature. We firstly studied the associations between the risk signature and immune cells infiltration. High-risk group demonstrated more infiltration of M0 macrophages, and less infiltration of activated CD4+memory T cells and Eosinophils (Figure 3A, p < 0.05). Correlations between the risk signature and immune functions showed that high-risk group demonstrated upregulated HLA function (Figure 3B, p < 0.001). Microsatellite stability status was compared between high-risk and low-risk groups. As shown in Figure 3C, there were 70% patients with microsatellite stability (MSS), 15% patients with microsatellite instability-low (MSI-L) and 15% patients with microsatellite instability-high (MSI-H) in the low-risk group. While, 62% patients were MSS, 22% patients were MSI-L and 16% patients were MSI-H in the high-risk group. Moreover, the correlations between the risk score and microsatellite instability status were compared. We can see that the risk score of MSI-L were much higher than MSS (p = 0.021, Figure 3D).
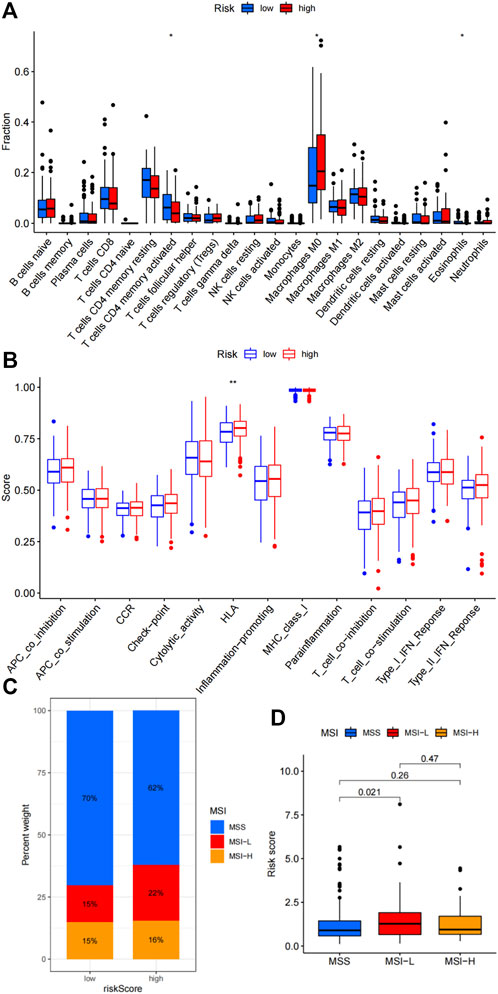
FIGURE 3. Association of the risk signature with immune microenvironment. (A) Differences in immune cells infiltration between high-risk and low-risk groups. (B) Correlations between the risk signature and various immune functions. (C) Percent weight of MSI status between high-risk and low-risk groups. (D) Comparison of risk scores among MSS, MSI-L and MSI-H subpopulation.
Functional enrichment analyses of the risk model
We further clarified the potential functions and mechanisms of the risk signature. GO enrichment analysis showed that the biological process (BP) was mainly enriched in “ossification”, “regulation of angiogenesis”, “regulation of vasculature development”, “muscle cell differentiation”, “cartilage development” etc. (Figure 4A). In the cellular components (CC), the risk signature was mainly enriched in “collagen-containing extracellular matrix”, “endoplasmic reticulum lumen”, “neuronal cell body”, “basement membrane”. As for molecular functions (MF), the risk model was mainly enriched in “heparin binding”, “glycosaminoglycan binding”, “sulfur compound binding”, “extracellular matrix structural constituent” (Figure 4A). GOcircos showed differentially expressed genes enriched in various GO terms (Figure 4B).
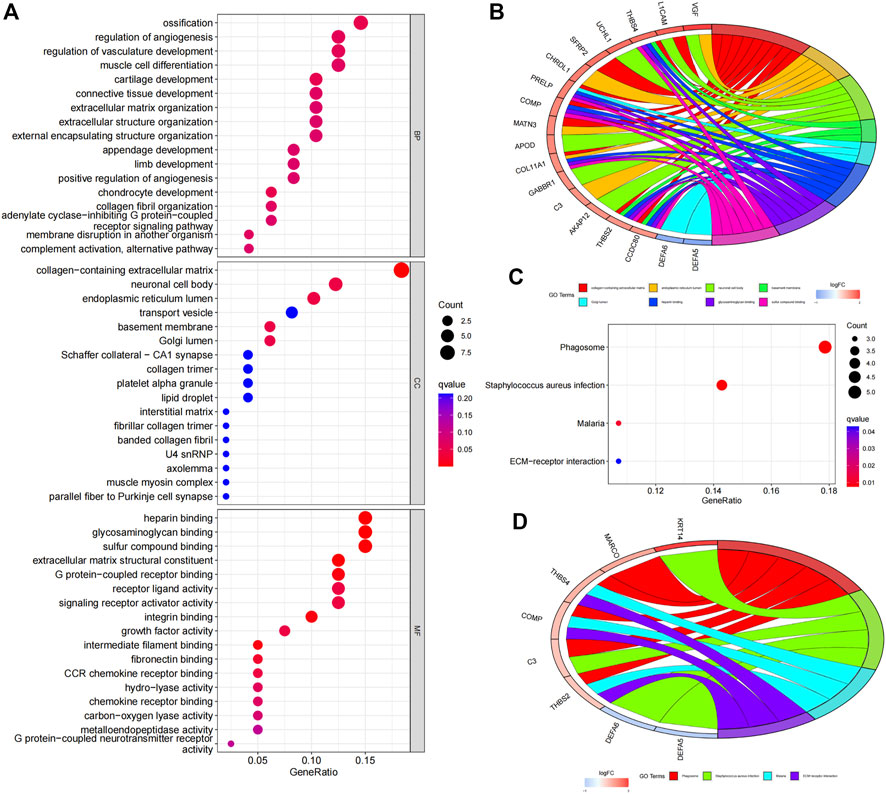
FIGURE 4. Functional enrichment analyses of the FAM-related gene signature. (A) GO analysis reveals biological process (BP), cellular components (CC), and molecular function (MF). (B) GOcircos of the genes enriched in different GO terms. (C) KEGG enrichment analysis of the risk signature. (D) KEGGcircos of the genes enriched in various KEGG pathways.
KEGG enrichment analysis showed that the underlying signal pathways were mainly enriched in “Phagosome”, “Staphylococcus aureus infection”, “Malaria” and “ECM-receptor interaction” (Figure 4C). KEGGcircos revealed differentially expressed genes enriched in different KEGG signaling pathway (Figure 4D).
Moreover, a gene set variation analysis (GSVA) was performed to estimate underlying pathways. As shown in Figure 5, pathways, such as circadian rhythm mammal, basal cell carcinoma, Hedgehog signaling pathway, glycosaminoglycan biosynthesis chondroitin sulfate and ECM receptor interaction, were enriched in high-risk group. Signaling pathways, such as starch and sucrose metabolism, porphyrin and chlorophyll metabolism, drug metabolism other enzymes and retinol metabolism, were activated in low-risk group.
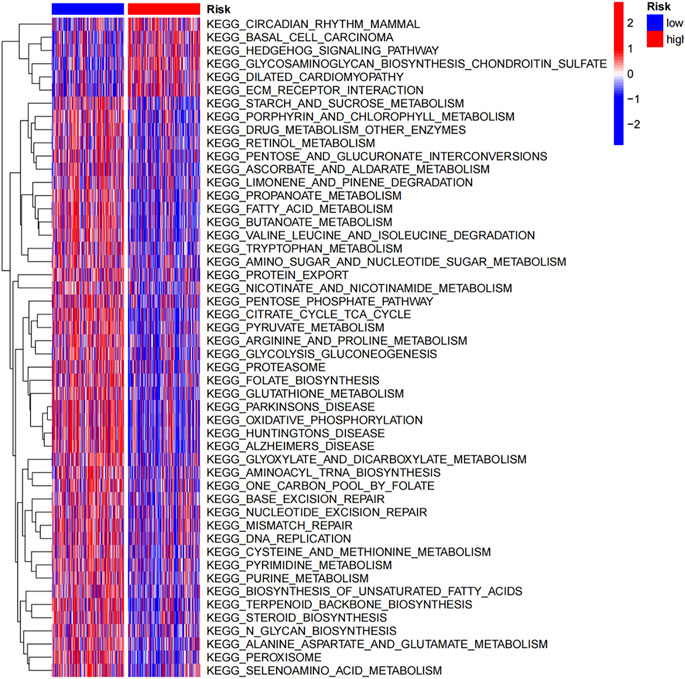
FIGURE 5. GSVA shows the potential signaling pathways enriched in high-risk and low-risk groups.
Independent prognostic value of the risk signature
We further assessed the significances of the risk signature and common clinical factors. Univariate cox regression analysis indicated that age (p = 0.006, HR = 1.029, 95% CI:1.008-1.050), stage (p < 0.001, HR = 2.199 95% CI:1.680-2.822) and riskScore (p < 0.001, HR = 1.604, 95% CI:1.394-1.847) were prognostic factors for colon adenocarcinoma patients (Figure 6A). Further multivariate cox regression analysis demonstrated the independent predictive roles of age (p = 0.001, HR = 1.035, 95% CI:1.014-1.057), stage (p < 0.001, HR = 2.261 95% CI:1.713-2.985) and riskScore (p < 0.001, HR = 1.452, 95% CI:1.257-1.677) (Figure 6B). Time-dependent ROC curves showed that the AUC values of the signature in predicting 1 year, 3 years and 5 years survival were 0.692, 0.741 and 0.774, respectively (Figure 6C). Multi ROC curves comparing the Risk, age, gender and stage showed that the risk signature was better than other clinical parameters (AUC of risk: 0.774, Figure 6D).
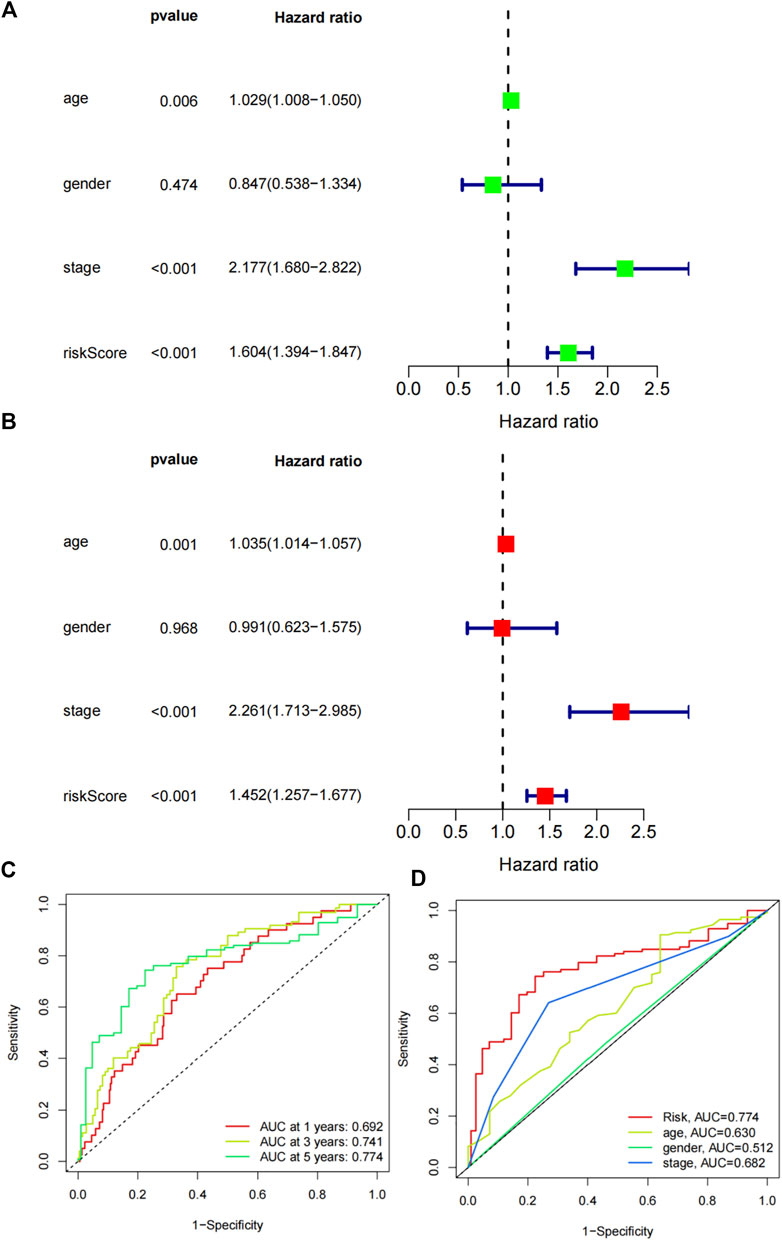
FIGURE 6. Predictive capabilities of the risk signature. (A) Univariate Cox regression analysis of the riskscore and various clinical factors. (B) Multivariate Cox regression analysis of the clinical factors and riskscore. (C) Time-dependent ROC curvesof the risk signature in predicting the survival. (D) Multi ROC curves of the risk signature and clinical parameters.
Establishment of a nomogram
The FAM-related gene signature and clinicopathological parameters (age, gender and stage) were combined to construct a prognostic nomogram. Age, stage and risk signature demonstrated prognostic values in the nomogram (Figure 7A). Univariate cox regression analysis further verified the predictive capabilities of age (p = 0.006, HR = 1.029 95% CI:1.008-1.050), stage (p < 0.001, HR = 2.177 95% CI:1.680-2.822) and nomogram (p < 0.001, HR = 2.177 95% CI:1.680-2.822) (Figure 7 B). Multi ROC curves comparing the nomogram and clinical factors showed that the AUC of nomogram was 0.63 (Figure 7C).
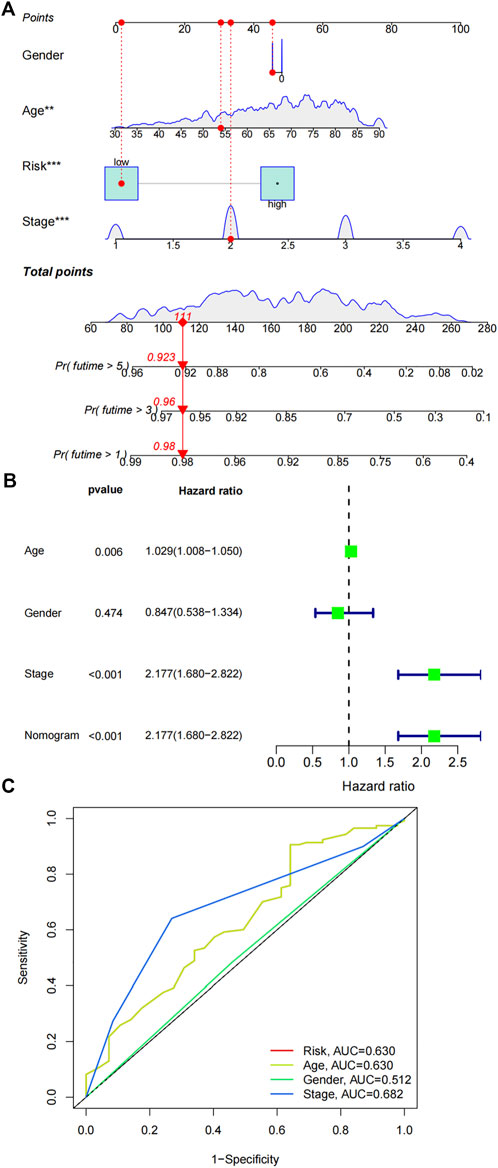
FIGURE 7. Construction of a nomogram. (A) A prognostic nomogram was constructed by combining risk signature, age, gender and stage. (B) Univariate cox regression analysis of the nomogram and various clinical parameters. (C) ROC results of the nomogram and various clinical parameters in predicting the survival of COAD patients.
Expression levels of the risk genes
Firstly, differential expression of these eight FAM-related genes were compared between colon adenocarcinoma tumor tissues and normal tissues in TCGA. As shown in Figures 8A–H, the expression of CD36, PTGR1, SUCLG2, CPT2 and ELOVL6 were downregulated in tumor tissues. While the expression of MORC2, ELOVL3 and ENO3 were upregulated in colon adenocarcinoma tumor tissues (Figures 8A–H, p < 0.001). Moreover, differential exression of these genes between normal tissues and cancer tissues were verified by GEO dataset. As shown in Figures 8I–L, the expression levels of CD36, PTGR1, SUCLG2 and CPT2 were significantly decreased in tumor tissues. And the expression levels of MORC2, ELOVL3 and ENO3 were significantly increased in tumor tissues (Figures 8M–O). However, there was no significant difference in the expression of ELOVL6 between normal tissues and tumor tissues (Figure 8P).
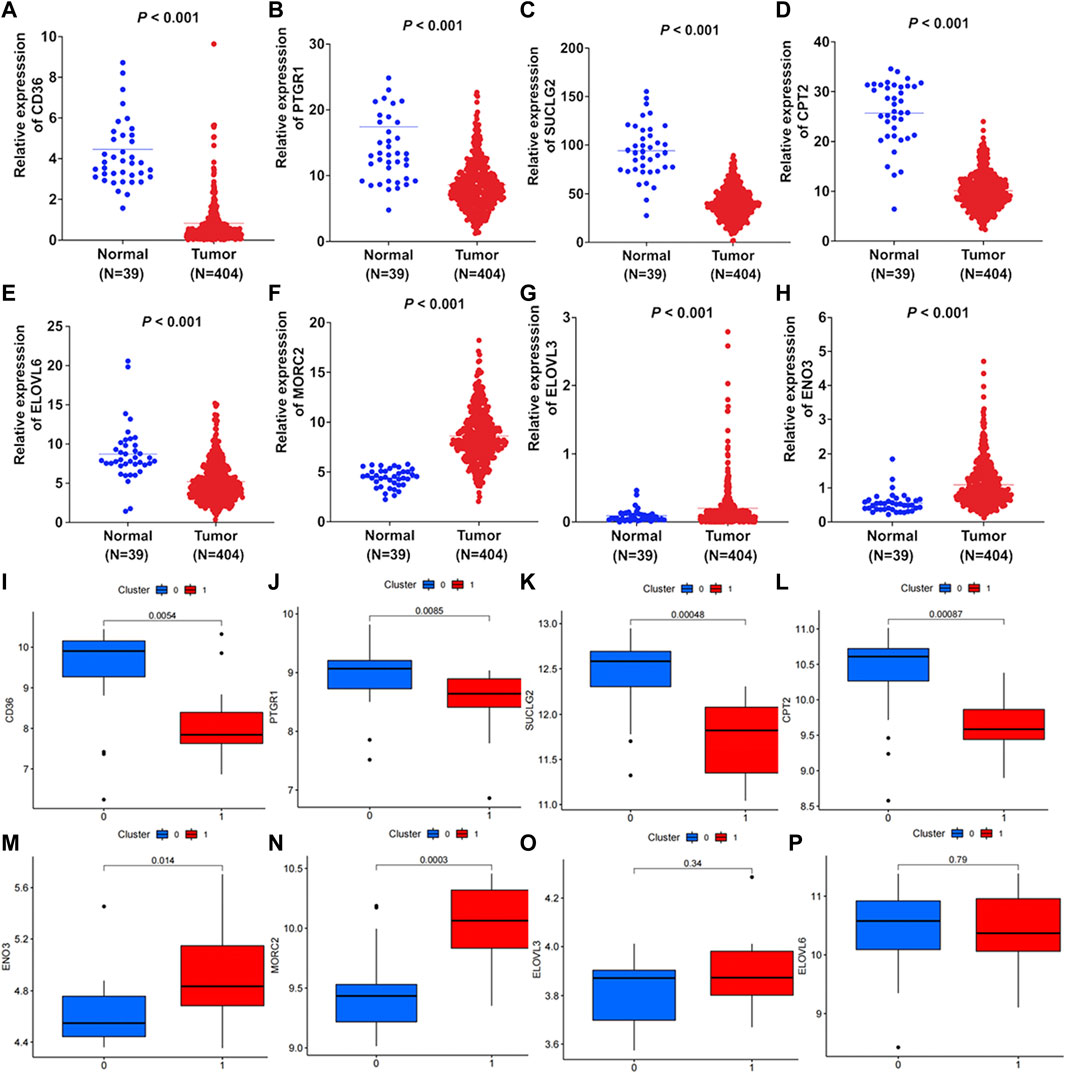
FIGURE 8. Differential expression of the FAM-related genes. Differential expression of (A) CD36, (B) PTGR1, (C) SUCLG2, (D) CPT2, (E) ELOVL6, (F) MORC2, (G) ELOVL3 and (H) ENO3 between colon adenocarcinoma tissues and normal tissues were compared according to TCGA-COAD cohort. GEO dataset validated the differential expression of (I) CD36, (J) PTGR1, (K) SUCLG2, (L) CPT2, (M) ENO3, (N) MORC2, (O) ELOVL3 and (P) ELOVL6 between tumor tissues and normal tissues. There were 17 pairs of normal tissues and tumor tissues in the GEO dataset.
Validation of the expression of the risk fatty acid metabolism-related genes in colon adenocarcinoma cell lines
Moreover, expression levels of these 8 genes in colon adenocarcinoma cell lines were compared with human colon epithelial cell line by using real time quantitative PCR (qRT-PCR). Results showed increased expression of ENO3 (Figure 9A), MORC2 (Figure 9B), SUCLG2 (Figure 9C) and ELOVL6 (Figure 9D), and decreased expression of CPT2 (Figure 9E) in all examined colon adenocarcinoma cell lines. Compared to normal cell line NCM460, downregulated expression of CD36 was detected in SW480 and HCT116 (Figure 9F). The expression PTGR1 was upregulated in SW480 and HCT116, and downregulated in CT26 (Figure 9G). The expression of ELOVL3 was decreased in SW480 and CT26, and upregulated in HCT116 (Figure 9H).
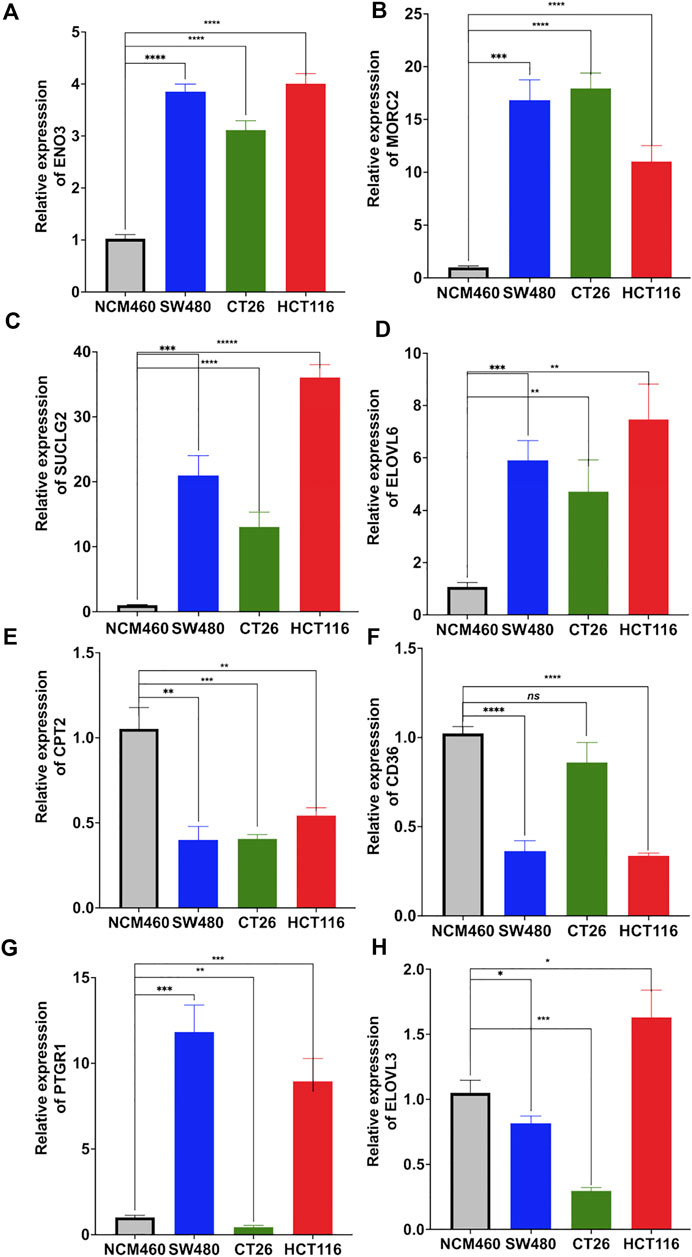
FIGURE 9. Relative mRNA expression of the risk signature genes. Real time quantitative PCR was utilized to compare the expression of ENO3 (A), MORC2 (B), SUCLG2 (C), ELOVL6 (D), CPT2 (E), CD36 (F), PTGR1 (G) and ELOVL3 (H) between human colon mucosal cell line (NCM460) and colon adenocarcinoma cell lines (SW480, CT26 and HCT116).
Survival analysis of the fatty acid metabolism-related risk genes
The Kaplan-Meier survival curves of these eight FAM-related genes were displayed in Figure 10. High expression of CD36 (Figure 10A, p = 0.001), ENO3 (Figure 10B, p < 0.001), MORC2 (Figure 10C, p < 0.001) and ELOVL3 (Figure 10D, p = 0.007) predicted poor overall survival in COAD patients. While low expression of SUCLG2 (Figure 10E, p < 0.001), PTGR1 (Figure 10F, p = 0.001), ELOVL6 (Figure 10G, p = 0.013) and CPT2 (Figure 10H, p < 0.001) were correlated with poor overall survival of colon adenocarcinoma patients. Moreover, the prognostic values of these genes were verified using GEO dataset. High expression of CD36 (Figure 10I, p = 8.298e-03) and ELOVL3 (Figure 10J, p = 4.147e-02) predicted poor OS, while high expression of SUCLG2 (Figure 10K, p = 3.072e-02) predicted better OS. There were no statistical significances of SUCLG2, ENO3, MORC2, PTGR1 and CPT2 in predicitng the OS of COAD patients (Figures 10L–P).
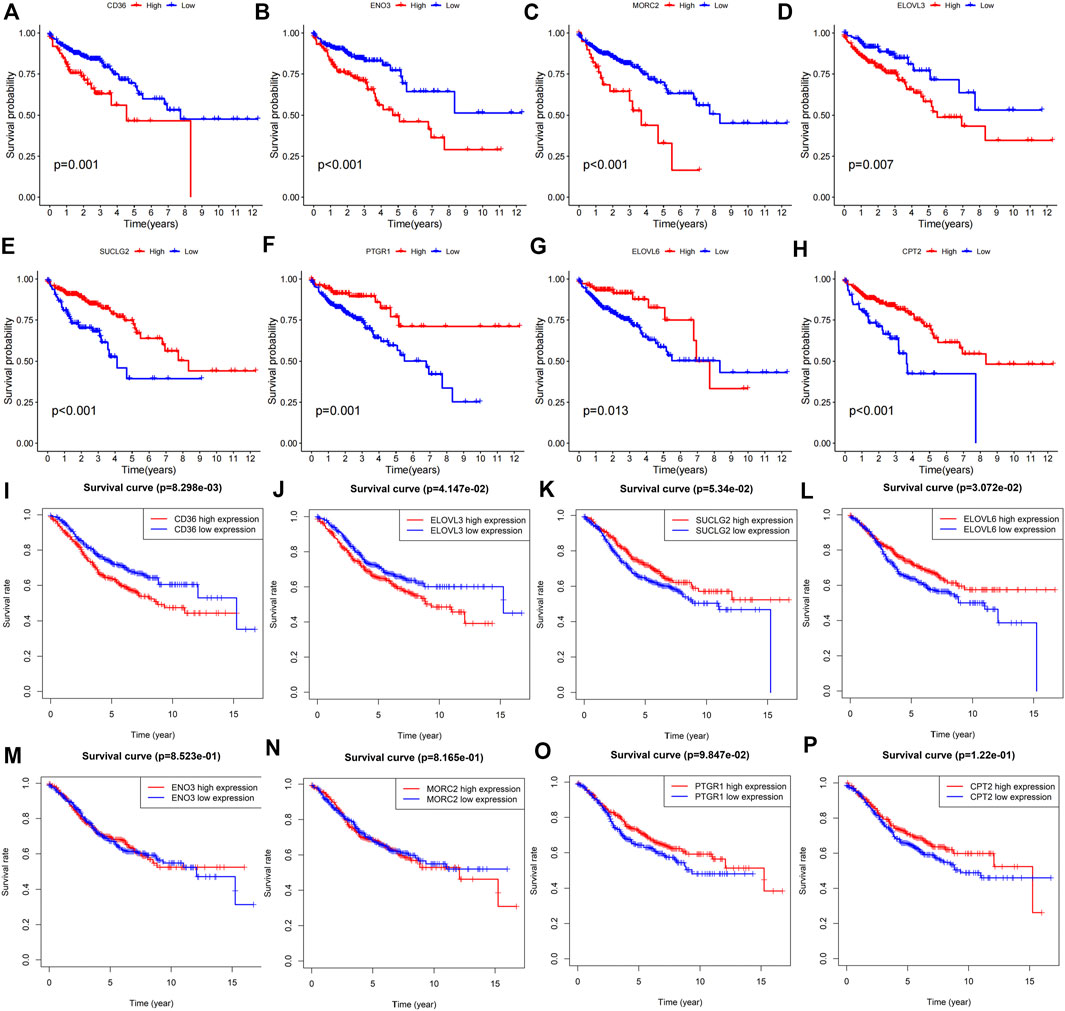
FIGURE 10. Prognostic roles of the risk FAM-related genes in COAD. Kaplan-Meier survival analyses were utilized to study the predictive roles of (A) CD36, (B) ENO3, (C) MORC2, (D) ELOVL3, (E) SUCLG2, (F) PTGR1, (G) ELOVL6 and (H) CPT2 according to TCGA-COAD cohort. GEO dataset validated the prognostic values of (I) CD36, (J) ELOVL3, (K) ELOVL6, (L) SUCLG2, (M) ENO3, (N) MORC2, (O) PTGR1 and (P) CPT2 in colon adenocarcinoma.
Discussion
Fatty acid metabolism has been proven to contribute to multiple processes of cancer development, including tumor initiation, distant metastasis, recurrence and treatment failure (Cheng et al., 2022; Shueng et al., 2022; Tao et al., 2022; Wilcock et al., 2022). Dysregulated expression of FA-related genes were major contributors to the obstacle of fatty acid metabolism (Zhao et al., 2017; Liu et al., 2019; Park et al., 2019; Zhao F. et al., 2021; Zhou et al., 2022). Although there is lack of fatty acid metabolism therapy for the treatment of cancer patients, targeting FAM-related genes demonstrated promising roles in cancer treatment. Numerous studies have identified FAM-related signatures in various tumors (Liu et al., 2019; Park et al., 2019; Zhao F. et al., 2021). However, FAM-related gene signature in colon adenocarcinoma still remains explored thoroughly.
Prognostic signatures based on gene sets with various biological traits demonstrate better sensitivity and specificity than one single biomarker (Zhao F. et al., 2021). Thus, in this study, we comprehensively explored 309 FAM-related genes and selected genes with different expression and prognostic values to construct a risk signature. In this study, FAM-related genes (CD36, ENO3, MORC2, PTGR1, SUCLG2, ELOVL3, ELOVL6 and CPT2) were selected to construct a risk signature. Moreover, the expression, prognostic roles, potential functions and immune landscape of the FAM-related signature were comprehensively andsystemically verified.
The identified FAM-related risk signature in predicting the prognosis and TNM stage were validated, which displayed better capability. Aberrant expression of FA-related genes could predict the survival of colorectal cancer patients. Numerous studies have displayed the prognostic roles of CD36 in colorectal cancer (Pang et al., 2019; Wang XQ. et al., 2021; Zhao J. et al., 2021). CD36 demonstrated multiple signatures in CRC, such as immune-related and DNA damage and repair-related (Wang XQ. et al., 2021). Li et al. found that COMP phosphorylated ERK and Akt to upregulate EMT markers through CD36 signaling (Li et al., 2018). Inhibition of CD36 might prove beneficial in repressing metastasis spread, which demonstrated clinical practice potential (Enciu et al., 2018). ENO3, as a glycolysis and hypoxia-related gene, could predict the prognosis and immune landscape of colon cancer patients (Cui et al., 2021; He et al., 2021; Mao et al., 2022). ENO3 could promote CRC cell proliferation and migration by promoting glycolysis metabolism (Chen et al., 2022). Park et al. found that knockdown of ENO3 could selectively target mutant lung cancer (Park et al., 2019). MORC2 expression was widely upregulated in most cancer types, and aberrant MORC2 expression predicted the survival of cancer patients (Ding et al., 2018). Liu et al. revealed that MORC2 promoted the migration, invasion and metastasis of CRC by repressing NDRG1 (Liu et al., 2019). PTGR1, as an inducible enzyme with enone reductase activity, demonstrated therapeutical potential for cancer treatment (Yu et al., 2012; Wang X. et al., 2021). Upregulated expression of PTGR1 promoted cell proliferation and resistance to oxidative stress in hepatocellular carcinoma (Sánchez-Rodríguez et al., 2017). Upregulated expression of ELOVL3 was identified in hepatocellular carcinoma and colorectal cancer, which was a risk factor for these cancer patients (Alnabulsi et al., 2019; Yuan et al., 2021). CPT2 was once reported to predict the survival of CRC patients (Liu F. et al., 2022; Su et al., 2022). Liu et al. revealed that knockdown of CPT2 promoted proliferation of CRC cells (Liu F. et al., 2022). Although most of the risk genes demonstrated prognostic values, in this study the risk signature demonstrated better predictive capability than other clinical factors.
Moreover, a nomogram was established based on the FAM-related risk score and other clinical factors. The nomogram also indicated good performance in predicting the prognosis of colon adenocarcinoma patients. These risk signature offers a novel method to predict the survival of colon adenocarcinoma patients. Additionally, the functional enrichment analyses showed that the risk signature demonstrated multiple biological functions and signaling pathways, which needed further explored.
Immune landscape, as major components of tumor microenvironment, determines the survival and response to immunotherapy. Analysis of the correlations between the riskscore and immune cells infiltration showed that activated CD4 memory T cells and eosinophils were less infiltrated in high-risk group, while M0 macrophages infiltrated more in high-risk group. And the HLA function was enhanced in the high-risk group. These data indicated the high-risk group demonstrating immunosuppressive phenotype. Moreover, we found that patients in the high-risk group were with more microsatellite instability status. Microsatellite instability status is known as a molecular fingerprint that changes the treatment strategies for colon cancer patients (Dekker et al., 2019). MSI colon cancers were characterized by a better prognosis, less sensitivity to chemotherapy and better response to immune checkpoint inhibitors (Boland and Goel 2010). Approximately 10–25% colon patients are MSI(Cohen et al., 2017). These data indicated that the risk signature might partially predict potential response to chemotherapy or immunotherapy.
Furthermore, we verified the expression of the 8 prognostic FAM-related genes in pubic databases and colon cancer cell lines. Some risk genes didn’t demonstrate statistical differences in the expression and prognosis in GEO datasets. These discrepancies might be due to the different clinical samples. By analyzing TCGA database, we found that CPT2, ENO3 and MORC2 showed consisted results in tissue expression, cell line expression and survival analysis. However, it is noted that there are some limitations of this study. The expression and predictive capability of this risk model needed to be validated in clinical specimens. Moreover, the concrete roles and mechanisms of FAM-related genes, such as MORC2, ENO3 and CPT2, need to be further clarified.
In conclusion, our research provided novel insights into a FAM-related gene signature in predicting the survival and immune landscape of colon adenocarcinoma.
Data availability statement
Publicly available datasets were analyzed in this study. This data can be found at TCGA project (“https://portal.gdc.cancer.gov/”). Further inquiries of the analyzed data can be directed to the corresponding authors.
Author contributions
GL and LL designed this study. XL analyzed the data and wrote the manuscript. XF and LL revised the manuscript. XL performed cellular experiment. All the authors approved the final version of the manuscript.
Funding
This research was funded by the Science Foundation of Guangzhou First People’s Hospital (M2019006), Guangdong Medical Science and Research Foundation (No. 2021B2021023), Guangzhou Planned Project of Science and Technology (No. 202102080609), the Natural Science Foundation of Guangdong Province, China (No. 2021A1515011113).
Conflict of interest
The authors declare that the research was conducted in the absence of any commercial or financial relationships that could be construed as a potential conflict of interest.
Publisher’s note
All claims expressed in this article are solely those of the authors and do not necessarily represent those of their affiliated organizations, or those of the publisher, the editors and the reviewers. Any product that may be evaluated in this article, or claim that may be made by its manufacturer, is not guaranteed or endorsed by the publisher.
Supplementary material
The Supplementary Material for this article can be found online at: https://www.frontiersin.org/articles/10.3389/fgene.2022.996625/full#supplementary-material
References
Alnabulsi, A., Cash, B., Hu, Y., Silina, L., Alnabulsi, A., and Murray, G. I. (2019). The expression of Brown fat-associated proteins in colorectal cancer and the relationship of uncoupling protein 1 with prognosis. Int. J. Cancer 145 (4), 1138–1147. doi:10.1002/ijc.32198
Boland, C. R., and Goel, A. (2010). Microsatellite instability in colorectal cancer. Gastroenterology 138 (6), 2073–2087. e3. doi:10.1053/j.gastro.2009.12.064
Chang, X., and Xing, P. (2022). Identification of a novel lipid metabolism-related gene signature within the tumour immune microenvironment for breast cancer. Lipids Health Dis. 21 (1), 43. doi:10.1186/s12944-022-01651-9
Chen, J., Zhang, Z., Ni, J., Sun, J., Ju, F., Wang, Z., et al. (2022). ENO3 promotes colorectal cancer progression by enhancing cell glycolysis. Med. Oncol. 39 (5), 80. doi:10.1007/s12032-022-01676-1
Chen, T. T. (2015). Milestone survival: A potential intermediate endpoint for immune checkpoint inhibitors. J. Natl. Cancer Inst. 107 (9), djv156. doi:10.1093/jnci/djv156
Cheng, Y. H., Ko, Y. C., Ku, H. J., Huang, C. C., Yao, Y. C., Liao, Y. T., et al. (2022). Novel paired cell lines for the study of lipid metabolism and cancer stemness of hepatocellular carcinoma. Front. Cell Dev. Biol. 10, 821224. doi:10.3389/fcell.2022.821224
Cohen, R., Buhard, O., Cervera, P., Hain, E., Dumont, S., Bardier, A., et al. (2017). Clinical and molecular characterisation of hereditary and sporadic metastatic colorectal cancers harbouring microsatellite instability/DNA mismatch repair deficiency. Eur. J. Cancer 86, 266–274. doi:10.1016/j.ejca.2017.09.022
Cui, Z., Sun, G., Bhandari, R., Lu, J., Zhang, M., Bhandari, R., et al. (2021). Comprehensive analysis of glycolysis-related genes for prognosis, immune features, and candidate drug development in colon cancer. Front. Cell Dev. Biol. 9, 684322. doi:10.3389/fcell.2021.684322
Dekker, E., Tanis, P. J., Vleugels, J. L. A., Kasi, P. M., and Wallace, M. B. (2019). Colorectal cancer. Lancet 394 (10207), 1467–1480. doi:10.1016/s0140-6736(19)32319-0
Ding, Q. S., Zhang, L., Wang, B. C., Zeng, Z., Zou, X. Q., Cao, P. B., et al. (2018). Aberrant high expression level of MORC2 is a common character in multiple cancers. Hum. Pathol. 76, 58–67. doi:10.1016/j.humpath.2018.03.011
Enciu, A. M., Radu, E., Popescu, I. D., Hinescu, M. E., and Ceafalan, L. C. (2018). Targeting CD36 as biomarker for metastasis prognostic: How far from translation into clinical practice? Biomed. Res. Int. 2018, 7801202. doi:10.1155/2018/7801202
Ganesh, K., Stadler, Z. K., Cercek, A., Mendelsohn, R. B., Shia, J., Segal, N. H., et al. (2019). Immunotherapy in colorectal cancer: Rationale, challenges and potential. Nat. Rev. Gastroenterol. Hepatol. 16 (6), 361–375. doi:10.1038/s41575-019-0126-x
Geng, Q. S., Yang, M. J., Li, L. F., Shen, Z. B., Wang, L. H., Zheng, Y. Y., et al. (2021). Over-expression and prognostic significance of FATP5, as a new biomarker, in colorectal carcinoma. Front. Mol. Biosci. 8, 770624. doi:10.3389/fmolb.2021.770624
He, X., Ding, J., Cheng, X., and Xiong, M. (2021). Hypoxia-related gene-based signature can evaluate the tumor immune microenvironment and predict the prognosis of colon adenocarcinoma patients. Int. J. Gen. Med. 14, 9853–9862. doi:10.2147/ijgm.S343216
Jones, B. C., Pohlmann, P. R., Clarke, R., and Sengupta, S. (2022). Treatment against glucose-dependent cancers through metabolic PFKFB3 targeting of glycolytic flux. Cancer Metastasis Rev. 41, 447–458. doi:10.1007/s10555-022-10027-5
Ladabaum, U., Dominitz, J. A., Kahi, C., and Schoen, R. E. (2020). Strategies for colorectal cancer screening. Gastroenterology 158 (2), 418–432. doi:10.1053/j.gastro.2019.06.043
Li, H., Song, J., He, Y., Liu, Y., Liu, Z., Sun, W., et al. (2022). CRISPR/Cas9 screens reveal that hexokinase 2 enhances cancer stemness and tumorigenicity by activating the ACSL4-fatty acid β-oxidation pathway advanced science. WeinheimGermany Wurttemb., e2105126. doi:10.1002/advs.202105126
Li, Q., Wang, C., Wang, Y., Sun, L., Liu, Z., Wang, L., et al. (2018). HSCs-derived COMP drives hepatocellular carcinoma progression by activating MEK/ERK and PI3K/AKT signaling pathways. J. Exp. Clin. Cancer Res. 37 (1), 231. doi:10.1186/s13046-018-0908-y
Liu, F., Li, X., Yan, H., Wu, J., Yang, Y., He, J., et al. (2022a). Downregulation of CPT2 promotes proliferation and inhibits apoptosis through p53 pathway in colorectal cancer. Cell. Signal. 92, 110267. doi:10.1016/j.cellsig.2022.110267
Liu, J., Shao, Y., He, Y., Ning, K., Cui, X., Liu, F., et al. (2019). MORC2 promotes development of an aggressive colorectal cancer phenotype through inhibition of NDRG1. Cancer Sci. 110 (1), 135–146. doi:10.1111/cas.13863
Liu, Y., Li, C., Fang, L., Wang, L., Liu, H., Tian, H., et al. (2022b). Lipid metabolism-related lncRNA SLC25A21-AS1 promotes the progression of oesophageal squamous cell carcinoma by regulating the NPM1/c-Myc axis and SLC25A21 expression. Clin. Transl. Med. 12 (6), e944. doi:10.1002/ctm2.944
Loupakis, F., Cremolini, C., Masi, G., Lonardi, S., Zagonel, V., Salvatore, L., et al. (2014). Initial therapy with FOLFOXIRI and bevacizumab for metastatic colorectal cancer. N. Engl. J. Med. 371 (17), 1609–1618. doi:10.1056/NEJMoa1403108
Lu, L., Zha, Z., Zhang, P., Wang, P., Liu, X., Fang, X., et al. (2022). Neuron-specific enolase promotes stem cell-like characteristics of small-cell lung cancer by downregulating NBL1 and activating the BMP2/Smad/ID1 pathway. Oncogenesis 11 (1), 21. doi:10.1038/s41389-022-00396-5
Mao, G., Wu, J., Cui, H., Dai, L., Ma, L., Zhou, Z., et al. (2022). A novel glycolysis and hypoxia combined gene signature predicts the prognosis and affects immune infiltration of patients with colon cancer. Int. J. Gen. Med. 15, 1413–1427. doi:10.2147/ijgm.S351831
Mokhtari, K., Mahdevar, M., Hajipour, M., Esmaeili, M., Peymani, M., Mirzaei, S., et al. (2022). Title: Involvement of unsaturated fatty acid biosynthesis in CRC progression based on in vitro and in silico studies. Biomed. Pharmacother. = Biomedecine Pharmacother. 153, 113338. doi:10.1016/j.biopha.2022.113338
Navarro, C., Á Ortega, R. S., Garrido, B., Chacín, M., Galban, N., Vera, I., et al. (2022). Metabolic reprogramming in cancer cells: Emerging molecular mechanisms and novel therapeutic approaches. Pharmaceutics 14 (6), 1303. doi:10.3390/pharmaceutics14061303
Pang, B., Xu, X., Lu, Y., Jin, H., Yang, R., Jiang, C., et al. (2019). Prediction of new targets and mechanisms for quercetin in the treatment of pancreatic cancer, colon cancer, and rectal cancer. Food Funct. 10 (9), 5339–5349. doi:10.1039/c9fo01168d
Park, C., Lee, Y., Je, S., Chang, S., Kim, N., Jeong, E., et al. (2019). Overexpression and selective anticancer efficacy of ENO3 in STK11 mutant lung cancers. Mol. Cells 42 (11), 804–809. doi:10.14348/molcells.2019.0099
Sánchez-Rodríguez, R., Torres-Mena, J. E., Quintanar-Jurado, V., Chagoya-Hazas, V., Rojas Del Castillo, E., Del Pozo Yauner, L., et al. (2017). Ptgr1 expression is regulated by NRF2 in rat hepatocarcinogenesis and promotes cell proliferation and resistance to oxidative stress. Free Radic. Biol. Med. 102, 87–99. doi:10.1016/j.freeradbiomed.2016.11.027
Shueng, P. W., Chan, H. W., Lin, W. C., Kuo, D. Y., and Chuang, H. Y. (2022). Orlistat resensitizes sorafenib-resistance in hepatocellular carcinoma cells through modulating metabolism. Int. J. Mol. Sci. 23 (12), 6501. doi:10.3390/ijms23126501
Song, I. S., Jeong, Y. J., Jung, Y., Park, Y. H., Shim, S., Kim, S. J., et al. (2021). The sulfiredoxin-peroxiredoxin redox system regulates the stemness and survival of colon cancer stem cells. Redox Biol. 48, 102190. doi:10.1016/j.redox.2021.102190
Su, Y., Tian, X., Gao, R., Guo, W., Chen, C., Chen, C., et al. (2022). Colon cancer diagnosis and staging classification based on machine learning and bioinformatics analysis. Comput. Biol. Med. 145, 105409. doi:10.1016/j.compbiomed.2022.105409
Sung, H., Ferlay, J., Siegel, R. L., Laversanne, M., Soerjomataram, I., Jemal, A., et al. (2021). Global cancer statistics 2020: GLOBOCAN estimates of incidence and mortality worldwide for 36 cancers in 185 countries. Ca. Cancer J. Clin. 71 (3), 209–249. doi:10.3322/caac.21660
Tang, Y., Zou, Y., Wang, Z., Li, N., Zeng, Y., Wu, L., et al. (2022). Prognosis and dissection of immunosuppressive microenvironment in breast cancer based on fatty acid metabolism-related signature. Front. Immunol. 13, 843515. doi:10.3389/fimmu.2022.843515
Tao, L., Ma, M., Milazzo, G., Moreno-Smith, M., Patel, T. D., Zorman, B., et al. (2022). MYCN-driven fatty acid uptake is a metabolic vulnerability in neuroblastoma. Nat. Commun. 13 (1), 3728. doi:10.1038/s41467-022-31331-2
Wang, L., Shannar, A. A. F., Wu, R., Chou, P., Sarwar, M. S., Kuo, H. C., et al. (2022). Butyrate drives metabolic rewiring and epigenetic reprogramming in human colon cancer cells. Mol. Nutr. Food Res. 66 (12), e2200028. doi:10.1002/mnfr.202200028
Wang, X., Yin, G., Zhang, W., Song, K., Zhang, L., and Guo, Z. (2021a). Prostaglandin reductase 1 as a potential therapeutic target for cancer therapy. Front. Pharmacol. 12, 717730. doi:10.3389/fphar.2021.717730
Wang, X. Q., Xu, S. W., Wang, W., Piao, S. Z., Mao, X. L., Zhou, X. B., et al. (2021b). Identification and validation of a novel DNA damage and DNA repair related genes based signature for colon cancer prognosis. Front. Genet. 12, 635863. doi:10.3389/fgene.2021.635863
Wilcock, D. J., Badrock, A. P., Wong, C. W., Owen, R., Guerin, M., Southam, A. D., et al. (2022). Oxidative stress from DGAT1 oncoprotein inhibition in melanoma suppresses tumor growth when ROS defenses are also breached. Cell Rep. 39 (12), 110995. doi:10.1016/j.celrep.2022.110995
Xiong, X., Hasani, S., Young, L. E. A., Rivas, D. R., Skaggs, A. T., Martinez, R., et al. (2022). Activation of Drp1 promotes fatty acids-induced metabolic reprograming to potentiate Wnt signaling in colon cancer. Cell Death Differ. 29, 1913–1927. doi:10.1038/s41418-022-00974-5
Yaghoubi, N., Soltani, A., Ghazvini, K., Hassanian, S. M., and Hashemy, S. I. (2019). PD-1/PD-L1 blockade as a novel treatment for colorectal cancer. Biomed. Pharmacother. 110, 312–318. doi:10.1016/j.biopha.2018.11.105
Yu, X., Erzinger, M. M., Pietsch, K. E., Cervoni-Curet, F. N., Whang, J., Niederhuber, J., et al. (2012). Up-regulation of human prostaglandin reductase 1 improves the efficacy of hydroxymethylacylfulvene, an antitumor chemotherapeutic agent. J. Pharmacol. Exp. Ther. 343 (2), 426–433. doi:10.1124/jpet.112.195768
Yuan, C., Yuan, M., Chen, M., Ouyang, J., Tan, W., Dai, F., et al. (2021). Prognostic implication of a novel metabolism-related gene signature in hepatocellular carcinoma. Front. Oncol. 11, 666199. doi:10.3389/fonc.2021.666199
Zhang, C., Zhu, N. L., Gong, Y., Gu, J., Shi, Y., Liao, D., et al. (2022). New dawn for cancer cell death: Emerging role of lipid metabolism. Mol. Metab. 63, 101529. doi:10.1016/j.molmet.2022.101529
Zhao, F., Liu, Y., Gu, X., Zhang, B., Song, C., and Cui, B. (2021a). Identification of sixteen metabolic genes as potential biomarkers for colon adenocarcinoma. J. B.U.ON, official J. Balkan Union Oncol. 26 (4), 1252–1259.
Zhao, J., Wang, Y., Gao, J., Wang, Y., Zhong, X., Wu, X., et al. (2021b). A nine-gene signature to improve prognosis prediction of colon carcinoma. Cell cycleGeorget. Tex.) 20 (10), 1021–1032. doi:10.1080/15384101.2021.1919827
Zhao, L., Fan, J., Xia, S., Pan, Y., Liu, S., Qian, G., et al. (2017). HMG-CoA synthase 1 is a synthetic lethal partner of BRAFV600E in human cancers. J. Biol. Chem. 292 (24), 10142–10152. doi:10.1074/jbc.M117.788778
Keywords: colon adenocarcinoma, fatty acid metabolism gene, prognosis, risk signature, immune microenvironment
Citation: Liu X, Fang X, Lu L and Liu G (2022) Prognostic significance and immune landscape of a fatty acid metabolism-related gene signature in colon adenocarcinoma. Front. Genet. 13:996625. doi: 10.3389/fgene.2022.996625
Received: 18 July 2022; Accepted: 21 November 2022;
Published: 09 December 2022.
Edited by:
Shengtao Zhu, Capital Medical University, ChinaReviewed by:
Xiaoteng Cui, Tianjin Medical University General Hospital, ChinaYandong Miao, Yantai Affiliated Hospital of Binzhou Medical University, China
Copyright © 2022 Liu, Fang, Lu and Liu. This is an open-access article distributed under the terms of the Creative Commons Attribution License (CC BY). The use, distribution or reproduction in other forums is permitted, provided the original author(s) and the copyright owner(s) are credited and that the original publication in this journal is cited, in accordance with accepted academic practice. No use, distribution or reproduction is permitted which does not comply with these terms.
*Correspondence: Guolong Liu, eyglliu@scut.edu.cn; Lin Lu, eylinlv@scut.edu.cn
†These authors have contributed equally to this work