
95% of researchers rate our articles as excellent or good
Learn more about the work of our research integrity team to safeguard the quality of each article we publish.
Find out more
ORIGINAL RESEARCH article
Front. Genet. , 25 November 2022
Sec. Cancer Genetics and Oncogenomics
Volume 13 - 2022 | https://doi.org/10.3389/fgene.2022.968376
 Jinke Zhuge1†
 Xiuqing Wang1†Jingtai Li2†Tongyuan Wang1Hongkang Wang1Mingxing Yang1Wen Dong1*Yong Gao3*
Background: Previous studies have suggested that patients with lung adenocarcinoma (LUAD) will significantly benefit from epidermal growth factor receptor tyrosine kinase inhibitors (EGFR-TKI). However, many LUAD patients will develop resistance to EGFR-TKI. Thus, our study aims to develop models to predict EGFR-TKI resistance and the LUAD prognosis.
Methods: Two Gene Expression Omnibus (GEO) datasets (GSE31625 and GSE34228) were used as the discovery datasets to find the common differentially expressed genes (DEGs) in EGFR-TKI resistant LUAD profiles. The association of these common DEGs with LUAD prognosis was investigated in The Cancer Genome Atlas (TCGA) database. Moreover, we constructed the risk score for prognosis prediction of LUAD by LASSO analysis. The performance of the risk score for predicting LUAD prognosis was calculated using an independent dataset (GSE37745). A random forest model by risk score genes was trained in the training dataset, and the diagnostic ability for distinguishing sensitive and EGFR-TKI resistant samples was validated in the internal testing dataset and external testing datasets (GSE122005, GSE80344, and GSE123066).
Results: From the discovery datasets, 267 common upregulated genes and 374 common downregulated genes were identified. Among these common DEGs, there were 59 genes negatively associated with prognosis, while 21 genes exhibited positive correlations with prognosis. Eight genes (ABCC2, ARL2BP, DKK1, FUT1, LRFN4, PYGL, SMNDC1, and SNAI2) were selected to construct the risk score signature. In both the discovery and independent validation datasets, LUAD patients with the higher risk score had a poorer prognosis. The nomogram based on risk score showed good performance in prognosis prediction with a C-index of 0.77. The expression levels of ABCC2, ARL2BP, DKK1, LRFN4, PYGL, SMNDC1, and SNAI2 were positively related to the resistance of EGFR-TKI. However, the expression level of FUT1 was favorably correlated with EGFR-TKI responsiveness. The RF model worked wonderfully for distinguishing sensitive and resistant EGFR-TKI samples in the internal and external testing datasets, with predictive area under the curves (AUC) of 0.973 and 0.817, respectively.
Conclusion: Our investigation revealed eight genes associated with EGFR-TKI resistance and provided models for EGFR-TKI resistance and prognosis prediction in LUAD patients.
Lung cancer is one of the most common diseases since more than 2 million new cases are detected globally every year (Ren et al., 2021; Sung et al., 2021). Based on cell type, lung cancer could be split into small-cell (15%) and non-small-cell (NSCLC, 75%) (Li et al., 2021). According to histological categorization, NSCLC is often separated into lung adenocarcinoma (LUAD), lung squamous cell carcinoma (LUSC), and large cell carcinoma (Nasim et al., 2019). LUAD comprises about 50% of all lung cancer cases (Ren et al., 2022), and the majority of LUAD cases are diagnosed in the late stages of cancer (Al-Dherasi et al., 2021). Despite advances in cancer treatment, including the use of PD1 antibodies, only 15% of LUAD patients could survive more than 5 years (Ma et al., 2020).
Despite the fact that the efficiency of therapy for advanced LUAD is still unsatisfactory, the prognosis of LUAD is starting to improve due to the emergence of novel molecular targeting therapies. The effective treatment of EGFR-TKI for EGFR mutation patients is virtually a breakthrough in personalized medicine (Wang et al., 2022). EGFR-TKI has been regarded as the first-line therapy for LUAD individuals with EGFR mutations. According to the findings of a meta-analysis, first-line EGFR-TKI substantially increased progression-free survival (PFS) when compared with chemotherapy (Lee et al., 2017). Most LUAD patients treated with EGFR-TKI will develop disease progression and resistance within a year (Wu et al., 2018). The mechanisms of EGFR-TKI resistance have not been fully investigated, and a lack of resistance-related biomarkers exists. As a result, novel indicators and models for predicting EGFR-TKI resistance are urgently required.
Here, we acquired EGFR-TKI resistance and sensitive data from online databases, and multiple datasets were analyzed to identify common genes related to EGFR-TKI resistance. Moreover, we constructed the risk score for prognosis prediction of LUAD by LASSO and Cox analysis. The associations of the risk score with clinical features and tumor microenvironment (TME) compositions were investigated. The capabilities of the risk score for the prediction of EGFR-TKI resistance and prognosis were validated in the independent datasets. Our study provides possible targets for EGFR-TKI resistance as well as models for predicting EGFR-TKI resistance and LUAD prognosis.
GEO, one of the largest public gene expression data resources, contains the gene expression data of resistant and sensitive cells to EGFR-TKI, such as gefitinib, erlotinib, and afatinib. We searched the potential datasets on GEO by keywords (gefitinib, erlotinib, afatinib, and epidermal growth factor receptor tyrosine kinase). The potential datasets were then filtered by the following requirements: 1) the expression data should come from human NSCLC cells or samples; 2) the dataset should contain at least 3 sensitive and 3 resistant NSCLC cells/samples without genetic manipulation such as knockdown of a specific gene; 3) the mRNA expression matrix should be available on the GEO platform. Among the 34 available datasets from search results for “gefitinib”, GSE34228 and GSE123066 were selected by the criteria. Among the 39 available datasets from search results for “erlotinib”, GSE80344 was selected by the criteria. Among the 8 available datasets from search results for “afatinib”, none were selected. Among the 4 available datasets from search results for “epidermal growth factor receptor tyrosine kinase”, GSE122005 and GSE31625 were selected by the criteria. The searching and filtering results were provided in Supplementary Table S1.
Among these five datasets, the discovery datasets were GSE31625 (28 erlotinib-resistant and 18 erlotinib-sensitive samples) (Balko et al., 2006) and GSE34228 (26 gefitinib-resistant and 26 gefitinib-sensitive samples) (Nakata et al., 2015). The discovery datasets were used for identifying resistance-related genes and constructing the model for predicting the resistance of a sample by expression data. Three independent datasets (GSE122005, GSE80344, and GSE123066) were used to validate the diagnosis abilities of selected genes and the model for predicting the resistance. GSE122005 contains 3 gefitinib-sensitive and 3 gefitinib-resistant lung cancer cell samples (Wu et al., 2019). GSE80344 contains 4 erlotinib-sensitive and 12 erlotinib-resistant lung cancer cell lines (Fustaino et al., 2017). GSE123066 contains 3 gefitinib-sensitive samples and 3 gefitinib-resistant cells.
In order to construct the risk score model for predicting the prognosis of LUAD patients, RNA-seq expression values (level 3, raw count) and clinical records were retrieved from the TCGA-LUAD database by the TCGAbiolinks package (Colaprico et al., 2016). An independent dataset (GSE37745) was randomly selected as the testing dataset for validating the risk score model. GSE37745 contained 226 lung cancer samples with expression values and clinical records (Botling et al., 2013).
The expression data of discovery datasets (GSE31625 and GSE34228) was downloaded by “GSE31625_series_matrix.txt.gz” and “GSE34228_series_matrix.txt.gz” from the package of GEOquery (Davis et al., 2007). Then, the expression data from these two datasets was annotated with ‘GPL96. soft’ and ‘GPL4133. soft’, respectively. The gene expression value was retained by the probe with the highest expression. DEGs were determined by analyzing the sensitive and resistant gene expression patterns using the edgeR (Robinson et al., 2010). The cut-off values for DEGs were set to p-values<0.05 and |log2FC|>0.5. DEGs with log2FC>0.5 were defined as upregulated DEGs, and genes with log2FC<-0.5 were defined as downregulated DEGs in resistant profiles. The important DEGs were shown as a heatmap and a volcano plot, respectively. The shared DEGs in these two discovery datasets were obtained by Wayne analysis.
Gene ontology (GO) analysis is a common technique for studying the biological function of genetic data. It usually contains biological process (BP), cellular component (CC), and molecular function (MF). KEGG and Hallmark include a large number of well-defined pathways and their correspondent genes. To obtain functional annotations, we subsequently uploaded the common upregulated and downregulated DEGs (dDEGs) to Enrichr (https://maayanlab.cloud/Enrichr/) to process the GO, KEGG, and Hallmark signal pathway analysis (Kuleshov et al., 2016). As a result, p-value< 0.05 was considered statistically significant.
Based on the survival data and expression profiles from the TCGA-LUAD dataset, we calculated the p-value for common DEGs and selected the significant survival-related DEGs (p-value<0.05). In previous studies, the optimal prognostic biomarkers were selected by multivariate Cox proportional hazard models (Chen et al., 2019; Yuan, Ren, & Wang et al., 2021) or stepwise regression with backward selection (Wang et al., 2020). To minimize the possibility of overfitting as much as possible, we used LASSO Cox regression analysis to identify the appropriate genes. LASSO is a compression estimation method that can compress the regression coefficients by constructing a penalty function for selecting variables (Z. Yu et al., 2022). By LASSO, the genes with the non-zero coefficient after the shrinking process were selected to construct the prognostic model. The advantages of LASSO include avoiding overfitting, automatic feature selection, and short processing time. A previous study, containing the comparison of models, showed the performance of LASSO is better than stepwise regression (Kumar et al., 2019). Using the glmnet package (Friedman et al., 2010), the LASSO has been successfully applied for survival prognosis in many application areas, including oncology (Yuan, Ren, & Li et al., 2021; Zhang et al., 2020).
Risk scores of TCGA-LUAD samples were generated by the expression of genes and the corresponding coefficient, which was calculated by univariate Cox analysis. Relying on the median value, TCGA-LUAD individuals were then split evenly into high- and low-risk groups. Additionally, we built the risk score to anticipate the prognosis of TCGA-LUAD. In addition, in order to test the accuracy, we constructed calibration curves and calculated the AUC. Calculations were made to determine the degree of connection between risk score and clinicopathological characteristics. Following that, univariate and multivariate Cox regression analyses were carried out with the goal of determining whether or not the risk score was an independent risk factor. An independent dataset (GSE37745) was randomly selected as the testing dataset for validating the risk score model.
A nomogram was created relying on the risk score and the clinicopathological features, including age, AJCC tumor stage (I, II, III, IV), and gender. The calibration curve was plotted to estimate the model’s effectiveness. The discrimination capacity was then computed using the concordance index (C-index). The C-index runs between 0.5 and 1.0, with 0.5 suggesting a useless model whatsoever and 1.0 suggesting an excellent model.
In order to combine the expression data of discovery datasets (GSE31625 and GSE34228) and three independent datasets (GSE122005, GSE80344, and GSE123066) and remove the batch effect, the following steps were adopted. 1) the expression data profiles of these five datasets were normalized by the method of “min-max normalization” which scaled data in the range (0, 1). 2) The expression data profiles of these five datasets were combined, and then we used “ComBat” function from the “sva” package to remove the batch effect (Leek et al., 2012). The ‘sva’ package and “ComBat” function were used in multiple studies to eliminate the batch effects (Li et al., 2020; Tang et al., 2020; J. Yu et al., 2022). We evaluated the batch effect by the principal component analysis (PCA) before and after using the “sva” package. In the expression data after the batch effect correction, the expression values of eight risk score genes were used in model construction and evaluation.
Firstly, the expression data of samples from discovery datasets (GSE31625 and GSE34228) was used in model construction. This data was then randomly and evenly divided into the training dataset (50%) and the internal testing dataset (50%). The expression data of three independent datasets (GSE122005, GSE80344, and GSE123066) were used as the external testing dataset. Then, based on the eight genes, we constructed a random forest model by the “caret” R package (Kuhn, 2008) to distinguish sensitive and resistant EGFR-TKI patients on the training dataset. The model was trained with 3-fold cross-validation, which is adopted by studies to get the optimal characteristics (Zhang et al., 2020). ROC plots and AUC values were obtained to evaluate the performance of the constructed model in the internal and external testing datasets.
ESTIMATE was utilized to estimate the status of immune and stromal cell infiltration in each cancer tissue (Yoshihara et al., 2013). The relative abundance of immune cells in each LUAD patient was determined by converting the expression levels of genes into the fraction of immune cells. This was accomplished using the R package ‘CIBERSORT’ and the deconvolution-based CIBERSORT method (Chen et al., 2018). The link between risk score and immune cells in LUAD patients was studied in the TCGA dataset. The expression levels of immune checkpoint genes were extracted, including PD-L1 (CD274), PD1 (PDCD1), CTLA-4 (CTLA4), TIM3 (HAVCR2), LAG3, and TIGIT. The comparison analysis was conducted on the LUAD patients from the TCGA dataset.
GSE31625 (erlotinib) and GSE34228 (gefitinib) datasets were selected for detection of EGFR-TKI resistance-related DEGs. A volcano and a heatmap plot from GSE31625 were shown in Supplementary Figure S1A,B. Among 3579 DEGs from GSE31625, there were 1703 highly elevated DEGs and 1876 significantly dDEGs. Similarly, a volcano and a heatmap plot from GSE34228 were shown in Supplementary Figure S2A,B. Among 4144 DEGs from GSE34228, there were 2026 highly elevated DEGs and 2118 significantly dDEGs. In total, 267 shared upregulated genes (Figure 1A) and 374 shared downregulated genes (Figure 1B) were discovered by Wayne analysis of the two datasets.
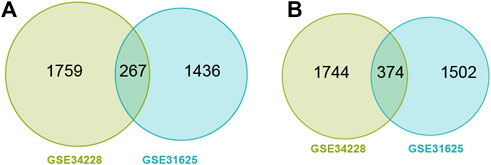
FIGURE 1. Wayne diagram showing common upregulated DEGs (uDEGs) (A) and common downregulated DEGs (dDEGs) (B) in the EGFR-TKI resistant LUAD cells.
These DEGs were then used for GO, KEGG, and Hallmark enrichment analyses, and the top 10 enrichment terms were shown in Supplementary Table S2–6. In the BP (Supplementary Table S2), uDEGs were enriched in cold-induced thermogenesis (GO:0120162), bone resorption (GO:0045780), and neuromuscular junction development (GO:0007528). In the CC (Supplementary Table S3), the uDEGs were mainly enriched in the mitochondrial matrix (GO:0005759), neuromuscular junction (GO:0031594), and mitochondrial inner membrane (GO:0005743). In the MF category (Supplementary Table S4), the uDEGs were enriched in NADPH binding (GO:0070402), oxidoreductase activity (GO:0016628), and ribose phosphate diphosphokinase activity (GO:0004749). In the KEGG analysis (Supplementary Table S5), uDEGs were primarily involved in oxytocin, apelin, and GnRH signaling pathways. In the Hallmark enrichment analysis (Supplementary Table S6), uDEGs were primarily involved in epithelial mesenchymal transition (EMT), fatty acid metabolism, and adipogenesis.
Similarly, in the BP (Supplementary Table S2), dDEGs were enriched in defense responses to symbiont (GO:0140546), defense responses to virus (GO:0051607), and cytokine-mediated signaling pathways (GO:0019221). In the CC (Supplementary Table S3), the dDEGs were mainly enriched in bounding membrane of organelle (GO:0098588), cytoplasmic vesicle membrane (GO:0030659), and cornified envelope (GO:0001533). In the MF (Supplementary Table S4), the dDEGs were enriched in hydrolase activity (GO:0016813), protein-arginine deiminase activity (GO:0004668), and arachidonic acid binding (GO:0050544). In the KEGG (Supplementary Table S5), dDEGs were primarily involved in coronavirus disease, Hepatitis C, and estrogen signaling pathways. In the Hallmark enrichment analysis (Supplementary Table S6), dDEGs were primarily involved in interferon gamma response and interferon alpha response.
Among the 267 common uDEGs, 59 genes with HR>1 and p-value<0.05 were defined as risky genes. Similarly, among 374 common dDEGs, 21 genes with HR<1 and p-value<0.05 were defined as the protective genes. The LASSO Cox regression algorithm was used to additionally pick these 80 genes in order to create a prognosis signature. Consequently, we identified an 8-gene signature according to the optimal λ value (Figures 2A,B). Furthermore, we used the following equation to compute the risk scores of TCGA-LUAD patients: score= (0.16683) * expressionABCC2 + (0.6072) * expression ARL2BP + (0.19634) * expressionDKK1 + (-0.5254) * expressionFUT1 + (0.36419) * expressionLRFN4 + (0.35000) * expressionPYGL + (0.7995) * expressionSMNDC1 + (0.34562) * expressionSNAI2. Following the median risk score, all LUAD individuals were further separated into low-risk and high-risk groups (Figure 2C). In the TCGA-LUAD dataset, the high-risk group experienced higher fatalities (Figure 2C). The mRNA expression of these eight genes in high- and low-risk individuals was compared in Figure 2D. Furthermore, AUC values showed that this risk score predicts prognosis with satisfactory accuracy (3-year: 0.70; 5-year: 0.71; 10-year: 0.69) (Figure 2E). Consistently, the high-risk group of LUAD patients had a lower survival rate than the low-risk (Figure 2F, p-value<0.001).
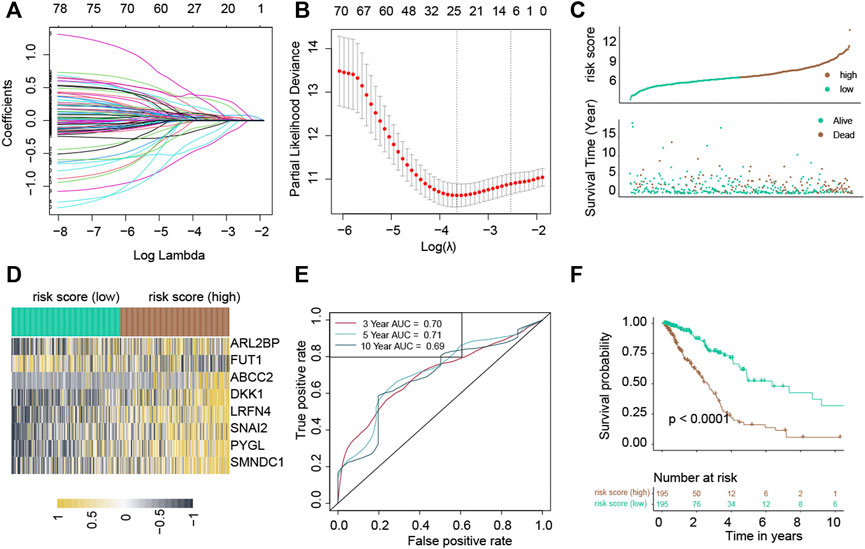
FIGURE 2. Construction of a risk score in the TCGA-LUAD cohort. The LASSO Cox regression analysis. (A) Coefficient values of genes. (B) The coefficient plot was plotted against the log(lambda) values. (C) Distribution of risk scores and survival summary. (D) Heatmap illustrating the expression of the genes in groups with low and high risk. (E) The risk score for predicting survival was assessed by AUC values. (F) There was a reduced overall survival among individuals in the high-risk group compared to patients in the low-risk group.
Following the median risk score, all LUAD individuals from GSE37745 were further separated into low-risk and high-risk groups (Figure 3A). The high-risk group experienced higher fatalities (Figure 3A). The mRNA expression of these eight genes in high- and low-risk individuals was compared in Figure 3B. Furthermore, AUC values showed that this risk score predicts prognosis with satisfactory accuracy (3-year: 0.67; 5-year: 0.63; 10-year: 0.62) (Figure 3C). Consistently, the high-risk group of LUAD patients had a lower survival rate than the low-risk cohort (Figure 3D, p-value = 0.039).
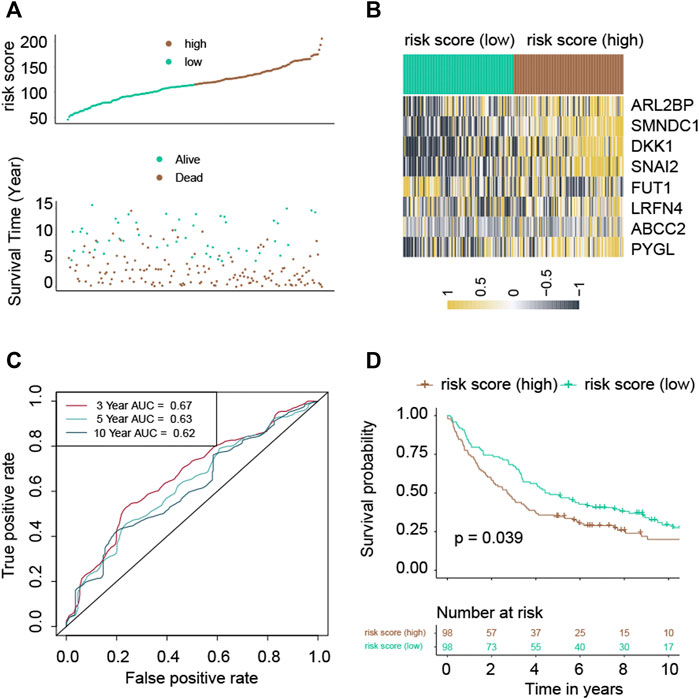
FIGURE 3. Validation of the risk score in the GSE37745 cohort. (A) Distribution of risk scores and survival summary. (B) Heatmap illustrating the expression of the genes in groups with low and high risk. (C) The risk score for predicting survival was assessed by AUC values. (D) There was a reduced overall survival among individuals in the high-risk group compared to patients in the low-risk group.
Subsequently, the correlation between clinical features and risk score was determined. The risk score did not correlate substantially with the age of LUAD patients (Supplementary Figure S3A). Positive correlations between risk score and AJCC stages (Supplementary Figure S3B), T (Supplementary Figure S3C), N (Supplementary Figure S3D). Male patients were found to be correlated with increased risk score (Supplementary Figure S3F). In contrast, the correlation of the risk score with M (Supplementary Figure S3E) was not significant.
Univariate Cox revealed that a higher risk score was strongly connected with poorer survivability (Figure 4A, HR = 1.6, 95% CI: 1.4–1.7) dataset. Similarly, the multivariate Cox indicated that the risk score is an independent predictor of survival when utilizing the TCGA-LUAD (Figure 4B, HR = 1.5, 95% CI: 1.3–1.7) dataset. These findings imply that the risk score has a predictive impact independent of other variables.
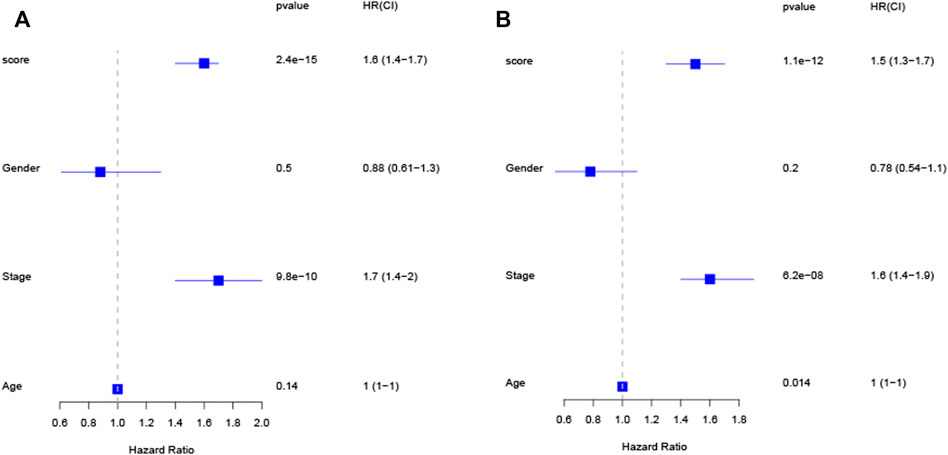
FIGURE 4. The risk score is an independent predictive factor for LUAD patients in the TCGA cohort, as shown by univariate and multivariate Cox regression analysis (A,B).
In the TCGA-LUAD cohort, 1-, 3-, and 5-year OS were predicted using a nomogram that was constructed by variables: risk score, age, gender, AJCC stages, T, N, and M (Figure 5A). The C-index of the nomogram was 0.77. The calibration plot for the chance of surviving one, three, or five years demonstrated a strong connection between the nomogram’s forecast and actual observation (Figures 5B–D).
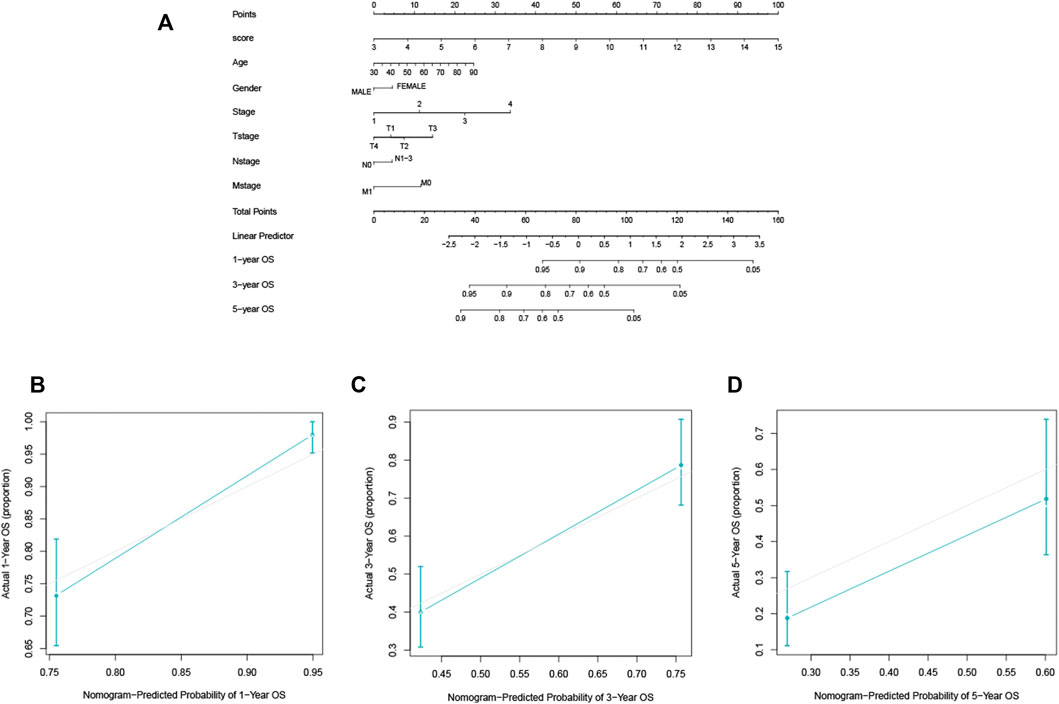
FIGURE 5. The construction and validation of the nomogram for OS. (A) The designed nomogram was used to assess OS. (B–D) The calibration curves demonstrated good congruence between the observed likelihood of 1-, 3-, and 5-year survival and the forecast of the nomogram.
As described in the method section, the expression data from the discovery datasets (GSE31625 and GSE34228) and three independent datasets (GSE122005, GSE80344 and GSE123066) were normalized and combined, and then their batch effects were eliminated. Before the batch effect elimination, the heterogeneity of responsive and resistant samples was not found (Supplementary Figure S4A). However, clear batch effects were found among datasets (Supplementary Figure S4B). After the batch effect elimination, responsive samples were separated from resistant samples (Supplementary Figure S4C), and the batch effects among datasets were significantly eliminated (Supplementary Figure S4D). Based on the expression data after the batch effect elimination, training, internal testing, and external testing datasets were defined, respectively.
Random forest (RF) was used to construct the prediction model with data from the training dataset, using mRNA expression data of eight genes (ABCC2, ARL2BP, DKK1, FUT1, LRFN4, PYGL, SMNDC1, and SNAI2). In the internal testing dataset, RF model reached an overall predictive AUC of 0.973 (Figure 6A). In the external testing dataset (GSE122005, GSE80344 and GSE123066), the RF model worked wonderfully, with an overall predictive AUC of 0.817 (Figure 6B).
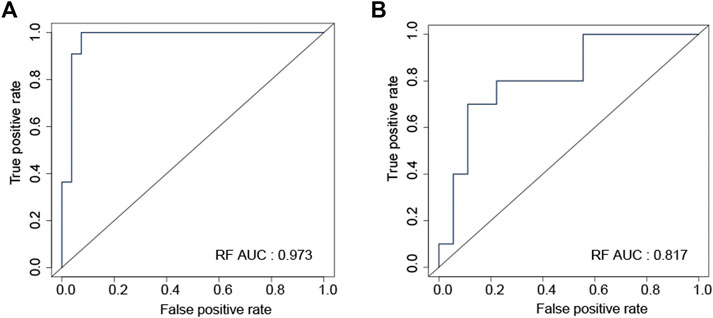
FIGURE 6. ROC curve validated the sensitivity and specificity of random forest model for distinguishing EGFR-TKI resistant and sensitive samples in the internal testing (A) and the external testing (B) datasets.
In order to assess the immunity status of LUAD patients in the low- and high-risk classes, two distinct techniques were used. According to the ESTIMATE methodology, the stromal score was considerably greater in the high-risk instances (Figure 7A). However, the immune score did not show a significant difference between two groups (Figure 7A; p = 0.679). To further investigate the link between risk score and various immune cells, we measured the number of immune cells by CIBERSORT. The low-risk group had considerably more naive B cells, plasma cells, Tregs, activated NK cells, and resting dendritic cells (Figure 7B). On the other hand, more activated CD4 memory cells and macrophages (M0, M1, M2) were present in the high-risk group (Figure 7B). Besides, higher immune checkpoint genes, including PD-L1 (CD274), PD1 (PDCD1), CTLA-4 (CTLA4), TIM3 (HAVCR2), LAG3, and TIGIT were present in the high-risk group (Supplementary Figure S5).
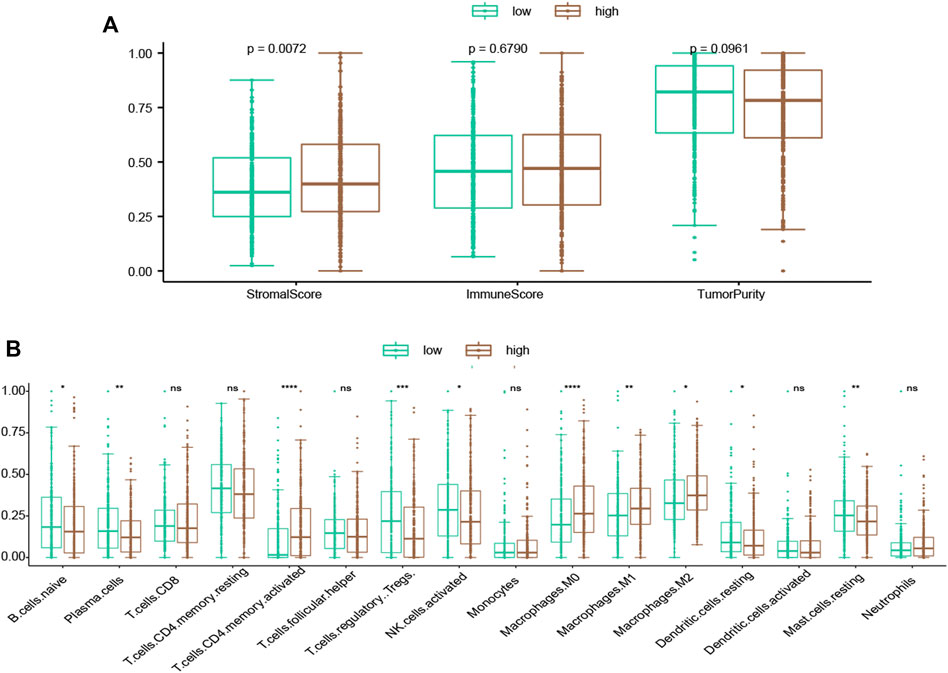
FIGURE 7. Evaluation of the association of TME compositions with the risk score. (A) Inside the high-risk group, the stromal score was greater. (B) Inflammatory cells infiltrating ratios in risk groups. */**/****: statistically significant.
Six of the eight genes (ABCC2, ARL2BP, DKK1, LRFN4, PYGL, and SMNDC1) were related to worse overall survival (Figures 8A–H). Conversely, FUT1 was related to improved overall survival (Figure 8D). We also evaluated the expression values of these genes between two EGFR-TKI groups. In GSE31625, five (ABCC2, ARL2BP, PYGL, SMNDC1, SNAI2) of eight genes were significantly higher in the EGFR-TKI resistant group (Supplementary Figure S6A). In GSE34228, seven (ABCC2, ARL2BP, DKK1, LRFN4, PYGL, SMNDC1, SNAI2) of eight genes were significantly higher in the EGFR-TKI resistant group (Supplementary Figure S6B). It should be noted that FUT1 was significantly higher in the EGFR-TKI sensitive group by expression from GSE31625 and GSE34228.
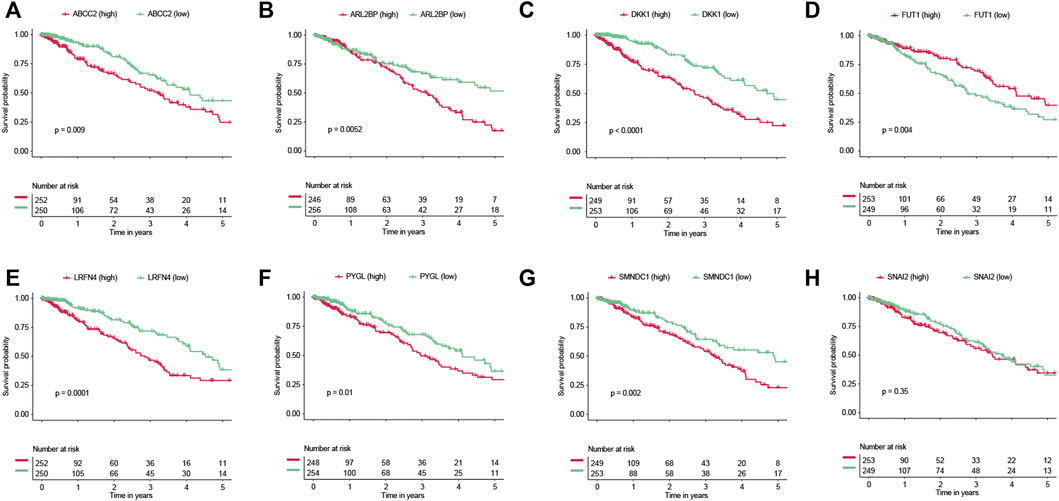
FIGURE 8. Survival analyses of genes. Prognostic values of (A) ABCC2, (B) ARL2BP, (C) DKK1, (D) FUT1, (E) LRFN4, (F) PYGL, (G) SMNDC1, and (H) SNAI2.
LUAD is the most prevalent subtype of NSCLC, accounting for nearly fifty percent of lung malignancies (Jordan et al., 2017). Current therapy for LUAD consists of surgery and pharmaceutical drugs. Currently, three generations of EGFR-TKI have been approved for use. These three generations of EGFR-TKI include erlotinib/gefitinib (first generation), afatinib/dacomitinib (second generation), and osimertinib (third generation). Compared with standard chemotherapy, the EGFR-TKI significantly improved clinical outcomes (Del et al., 2019). Most patients treated with EGFR-TKI will acquire resistance, which significantly restricts the clinical use of EGFR-TKI.
The main purposes of this study include: 1) identifying potential EGFR-TKI resistance-related biomarkers; 2) providing models to distinguish sensitive from resistant EGFR-TKI samples; 3) providing models to predict the prognosis of LUAD. Eight genes (ABCC2, ARL2BP, DKK1, FUT1, LRFN4, PYGL, SMNDC1, and SNAI2) were identified by bioinformatics analysis. We constructed a RF model by these genes to distinguish sensitive and resistant EGFR-TKI samples, and the model reached predictive AUCs of 0.973 and 0.817 in the internal and external testing dataset. We also constructed a risk score model by these genes to predict the LUAD prognosis, and it performed with satisfactory accuracy with an AUC of 0.67 on 3-year prognosis prediction in the independent dataset (GSE37745). Recently, constructing prognostic models by mRNA expression data has become prevalent in many cancer studies. Using 16 metabolic genes, a previous study constructed a prognostic model for LUAD and it reached an AUC value of 0.638 on 3-year prognosis prediction in the independent dataset (GSE37745) (He et al., 2020). Another study provided a risk score model for LUAD by six genes, and it reached an AUC value of 0.66 on 3-year prognosis prediction in GSE37745 (Jiang et al., 2022). In a LUAD prognosis model constructed by 27 hypoxia-related genes, it showed AUC values of 0.65 and 0.66 in the validation datasets (Ouyang et al., 2021). Together, these findings imply that our risk model is more accurate, stable, and capable of accurately reflecting the prognosis of LUAD patients.
The data in GSE31625 and GSE34228 datasets were extracted to compare gene expression between EGFR-TKI sensitive and resistant cell samples, and the common DEGs were screened out. Enrichment analysis indicated that the majority of commonly up-regulated DEGs were enriched in pathways associated with EMT, fatty acid metabolism, and adipogenesis. During EMT, epithelial cells transform into mesenchymal cells. Studies have been developed to show that EMT is engaged in the metastasis, related with the growth of many different types of malignancies, and connected with chemoresistance (Xiao et al., 2010), such as resistance to EGFR-TKI (Clement et al., 2020; Thomson et al., 2005). There is a correlation between the expression of mesenchymal markers and a poor prognosis as well as a suboptimal response to EGFR-TKIs in NSCLC. This is because mesenchymal markers contribute to a resistant phenotype (Jakobsen et al., 2016).
According to the findings of this investigation, the levels of expression of seven genes—ABCC2, ARL2BP, DKK1, LRFN4, PYGL, SMNDC1, and SNAI2—were higher in resistant samples than in sensitive ones. Previous research indicated that EGFR-TKI-resistant cells had higher levels of ABCC2 expression. (Hamamoto et al., 2017). One of the studied inhibitors of canonical Wnt signaling is a protein called DKK1 (Chu et al., 2021). DKK1 is found to be substantially more expressed in lung cancer tissues than normal controls. In addition, a number of recent studies have shown that DKK1 is positively correlated with lung cancer stage and tumor metastasis, and that it may promote lung cancer invasion and proliferation (Song et al., 2019).
The limitations of the present study should be mentioned. 1) The available public expression datasets are quite limited. We have combined the gene expression data from three independent datasets to validate the performance of the model on distinguishing EGFR-TKI resistant and sensitive samples. However, the sample size is still limited and a new cohort with more samples should be used to validate the model. 2) These eight genes have a high association with EGFR-TKI resistance in different datasets. However, the mechanism of these eight genes affecting EGFR-TKI resistance should be investigated by further experiments.
In conclusion, the eight genes linked to EGFR-TKI resistance were significantly connected with the prognosis of LUAD. The machine learning model based on these eight genes showed high accuracy in distinguishing EGFR-TKI resistant and sensitive samples. The risk score and the nomogram based on these eight genes showed high accuracy in predicting the survival outcome. Through our research, we were able to find eight genes that are linked to EGFR-TKI resistance and provide models that can predict EGFR-TKI resistance and the prognosis for LUAD patients(Yu and Ouyang, 2022).
The datasets presented in this study can be found in online repositories. The names of the repository/repositories and accession number(s) can be found in the article/Supplementary Material.
All authors listed have made a substantial, direct, and intellectual contribution to the work and approved it for publication.
The authors declare that the research was conducted in the absence of any commercial or financial relationships that could be construed as a potential conflict of interest.
All claims expressed in this article are solely those of the authors and do not necessarily represent those of their affiliated organizations, or those of the publisher, the editors and the reviewers. Any product that may be evaluated in this article, or claim that may be made by its manufacturer, is not guaranteed or endorsed by the publisher.
The Supplementary Material for this article can be found online at: https://www.frontiersin.org/articles/10.3389/fgene.2022.968376/full#supplementary-material
Al-Dherasi, A., Huang, Q. T., Liao, Y., Al-Mosaib, S., Hua, R., Wang, Y., et al. (2021). A seven-gene prognostic signature predicts overall survival of patients with lung adenocarcinoma (LUAD). Cancer Cell Int. 21 (1), 294. doi:10.1186/s12935-021-01975-z
Balko, J. M., Potti, A., Saunders, C., Stromberg, A., Haura, E. B., and Black, E. P. (2006). Gene expression patterns that predict sensitivity to epidermal growth factor receptor tyrosine kinase inhibitors in lung cancer cell lines and human lung tumors. BMC Genomics 7, 289. doi:10.1186/1471-2164-7-289
Botling, J., Edlund, K., Lohr, M., Hellwig, B., Holmberg, L., Lambe, M., et al. (2013). Biomarker discovery in non-small cell lung cancer: Integrating gene expression profiling, meta-analysis, and tissue microarray validation. Clin. Cancer Res. 19 (1), 194–204. doi:10.1158/1078-0432.CCR-12-1139
Chen, B., Khodadoust, M. S., Liu, C. L., Newman, A. M., and Alizadeh, A. A. (2018). Profiling tumor infiltrating immune cells with CIBERSORT. Methods Mol. Biol. 1711, 243–259. doi:10.1007/978-1-4939-7493-1_12
Chen, Z., Liu, G., Hossain, A., Danilova, I. G., Bolkov, M. A., Liu, G., et al. (2019). A co-expression network for differentially expressed genes in bladder cancer and a risk score model for predicting survival. Hereditas 156, 24. doi:10.1186/s41065-019-0100-1
Chu, H. Y., Chen, Z., Wang, L., Zhang, Z. K., Tan, X., Liu, S., et al. (2021). Dickkopf-1: A promising target for cancer immunotherapy. Front. Immunol. 12, 658097. doi:10.3389/fimmu.2021.658097
Clement, M. S., Gammelgaard, K. R., Nielsen, A. L., and Sorensen, B. S. (2020). Epithelial-to-mesenchymal transition is a resistance mechanism to sequential MET-TKI treatment of MET-amplified EGFR-TKI resistant non-small cell lung cancer cells. Transl. Lung Cancer Res. 9 (5), 1904–1914. doi:10.21037/tlcr-20-522
Colaprico, A., Silva, T. C., Olsen, C., Garofano, L., Cava, C., Garolini, D., et al. (2016). TCGAbiolinks: An R/Bioconductor package for integrative analysis of TCGA data. Nucleic Acids Res. 44 (8), e71. doi:10.1093/nar/gkv1507
Davis, S., and Meltzer, P. S. (2007). GEOquery: A bridge between the gene expression Omnibus (GEO) and BioConductor. Bioinformatics 23 (14), 1846–1847. doi:10.1093/bioinformatics/btm254
Del, R. M., Crucitta, S., Gianfilippo, G., Passaro, A., Petrini, I., Restante, G., et al. (2019). Understanding the mechanisms of resistance in EGFR-Positive NSCLC: From tissue to liquid biopsy to guide treatment strategy. Int. J. Mol. Sci. 20 (16), E3951. doi:10.3390/ijms20163951
Friedman, J., Hastie, T., and Tibshirani, R. (2010). Regularization paths for generalized linear models via coordinate descent. J. Stat. Softw. 33 (1), 1–22. doi:10.18637/jss.v033.i01
Fustaino, V., Presutti, D., Colombo, T., Cardinali, B., Papoff, G., Brandi, R., et al. (2017). Characterization of epithelial-mesenchymal transition intermediate/hybrid phenotypes associated to resistance to EGFR inhibitors in non-small cell lung cancer cell lines. Oncotarget 8 (61), 103340–103363. doi:10.18632/oncotarget.21132
Hamamoto, J., Yasuda, H., Aizawa, K., Nishino, M., Nukaga, S., Hirano, T., et al. (2017). Non-small cell lung cancer PC-9 cells exhibit increased sensitivity to gemcitabine and vinorelbine upon acquiring resistance to EGFR-tyrosine kinase inhibitors. Oncol. Lett. 14 (3), 3559–3565. doi:10.3892/ol.2017.6591
He, J., Li, W., Li, Y., and Liu, G. (2020). Construction of a prognostic model for lung adenocarcinoma based on bioinformatics analysis of metabolic genes. Transl. Cancer Res. 9 (5), 3518–3538. doi:10.21037/tcr-20-1571
Jakobsen, K. R., Demuth, C., Sorensen, B. S., and Nielsen, A. L. (2016). The role of epithelial to mesenchymal transition in resistance to epidermal growth factor receptor tyrosine kinase inhibitors in non-small cell lung cancer. Transl. Lung Cancer Res. 5 (2), 172–182. doi:10.21037/tlcr.2016.04.07
Jiang, Z., Luo, Y., Zhang, L., Li, H., Pan, C., Yang, H., et al. (2022). A novel risk score model of lactate metabolism for predicting over survival and immune signature in lung adenocarcinoma. Cancers (Basel) 14 (15), 3727. doi:10.3390/cancers14153727
Jordan, E. J., Kim, H. R., Arcila, M. E., Barron, D., Chakravarty, D., Gao, J., et al. (2017). Prospective comprehensive molecular characterization of lung adenocarcinomas for efficient patient matching to approved and emerging therapies. Cancer Discov. 7 (6), 596–609. doi:10.1158/2159-8290.CD-16-1337
Kuhn, M. (2008). Building predictive models in R using the caret package. J. Stat. Softw. 28 (5). doi:10.18637/jss.v028.i05
Kuleshov, M. V., Jones, M. R., Rouillard, A. D., Fernandez, N. F., Duan, Q., Wang, Z., et al. (2016). Enrichr: A comprehensive gene set enrichment analysis web server 2016 update. Nucleic Acids Res. 44 (W1), W90–W97. doi:10.1093/nar/gkw377
Kumar, S., Attri, S. D., and Singh, K. K. (2019). Comparison of Lasso and stepwise regression technique for wheat yield prediction. J. Agrometeorol. 21 (2), 188–192.
Lee, C. K., Davies, L., Wu, Y. L., Mitsudomi, T., Inoue, A., Rosell, R., et al. (2017). Gefitinib or erlotinib vs chemotherapy for EGFR mutation-positive lung cancer: Individual patient data meta-analysis of overall survival. J. Natl. Cancer Inst. 109 (6). doi:10.1093/jnci/djw279
Leek, J. T., Johnson, W. E., Parker, H. S., Jaffe, A. E., and Storey, J. D. (2012). The sva package for removing batch effects and other unwanted variation in high-throughput experiments. Bioinformatics 28 (6), 882–883. doi:10.1093/bioinformatics/bts034
Li, H., Lu, H., Cui, W., Huang, Y., and Jin, X. (2020). A TP53-based immune prognostic model for muscle-invasive bladder cancer. Aging (Albany NY) 13 (2), 1929–1946. doi:10.18632/aging.202150
Li, N., Wang, J., and Zhan, X. (2021). Identification of Immune-Related gene signatures in lung adenocarcinoma and lung squamous cell carcinoma. Front. Immunol. 12, 752643. doi:10.3389/fimmu.2021.752643
Ma, B., Geng, Y., Meng, F., Yan, G., and Song, F. (2020). Identification of a sixteen-gene prognostic biomarker for lung adenocarcinoma using a machine learning method. J. Cancer 11 (5), 1288–1298. doi:10.7150/jca.34585
Nakata, A., Yoshida, R., Yamaguchi, R., Yamauchi, M., Tamada, Y., Fujita, A., et al. (2015). Elevated beta-catenin pathway as a novel target for patients with resistance to EGF receptor targeting drugs. Sci. Rep. 5, 13076. doi:10.1038/srep13076
Nasim, F., Sabath, B. F., and Eapen, G. A. (2019). Lung cancer. Med. Clin. North Am. 103 (3), 463–473. doi:10.1016/j.mcna.2018.12.006
Ouyang, W., Jiang, Y., Bu, S., Tang, T., Huang, L., Chen, M., et al. (2021). A prognostic risk score based on hypoxia-immunity-and Epithelialto-Mesenchymal Transition-Related genes for the prognosis and immunotherapy response of lung adenocarcinoma. Front. Cell Dev. Biol. 9, 758777. doi:10.3389/fcell.2021.758777
Ren, J., Wang, A., Liu, J., and Yuan, Q. (2021). Identification and validation of a novel redox-related lncRNA prognostic signature in lung adenocarcinoma. Bioengineered 12 (1), 4331–4348. doi:10.1080/21655979.2021.1951522
Ren, J., Zhang, H., Wang, J., Xu, Y., Zhao, L., and Yuan, Q. (2022). Transcriptome analysis of adipocytokines and their-related LncRNAs in lung adenocarcinoma revealing the association with prognosis, immune infiltration, and metabolic characteristics. Adipocyte 11 (1), 250–265. doi:10.1080/21623945.2022.2064956
Robinson, M. D., McCarthy, D. J., and Smyth, G. K. (2010). EdgeR: A bioconductor package for differential expression analysis of digital gene expression data. Bioinformatics 26 (1), 139–140. doi:10.1093/bioinformatics/btp616
Song, Z., Wang, H., and Zhang, S. (2019). Negative regulators of Wnt signaling in non-small cell lung cancer: Theoretical basis and therapeutic potency. Biomed. Pharmacother. 118, 109336. doi:10.1016/j.biopha.2019.109336
Sung, H., Ferlay, J., Siegel, R. L., Laversanne, M., Soerjomataram, I., Jemal, A., et al. (2021). Global cancer statistics 2020: GLOBOCAN estimates of incidence and mortality worldwide for 36 cancers in 185 countries. Ca. Cancer J. Clin. 71 (3), 209–249. doi:10.3322/caac.21660
Tang, C., Ma, J., Liu, X., and Liu, Z. (2020). Identification of four immune subtypes in bladder cancer based on immune gene sets. Front. Oncol. 10, 544610. doi:10.3389/fonc.2020.544610
Thomson, S., Buck, E., Petti, F., Griffin, G., Brown, E., Ramnarine, N., et al. (2005). Epithelial to mesenchymal transition is a determinant of sensitivity of non-small-cell lung carcinoma cell lines and xenografts to epidermal growth factor receptor inhibition. Cancer Res. 65 (20), 9455–9462. doi:10.1158/0008-5472.CAN-05-1058
Wang, F., Tang, C., Gao, X., and Xu, J. (2020). Identification of a six-gene signature associated with tumor mutation burden for predicting prognosis in patients with invasive breast carcinoma. Ann. Transl. Med. 8 (7), 453. doi:10.21037/atm.2020.04.02
Wang, Z., Zhang, L., Xu, W., Li, J., Liu, Y., Zeng, X., et al. (2022). The Multi-Omics analysis of key genes regulating EGFR-TKI resistance, immune infiltration, SCLC transformation in EGFR-Mutant NSCLC. J. Inflamm. Res. 15, 649–667. doi:10.2147/JIR.S341001
Wu, S. G., Chang, T. H., Tsai, M. F., Liu, Y. N., Hsu, C. L., Chang, Y. L., et al. (2019). IGFBP7 drives resistance to epidermal growth factor receptor tyrosine kinase inhibition in lung cancer. Cancers (Basel) 11 (1), E36. doi:10.3390/cancers11010036
Wu, S. G., and Shih, J. Y. (2018). Management of acquired resistance to EGFR TKI-targeted therapy in advanced non-small cell lung cancer. Mol. Cancer 17 (1), 38. doi:10.1186/s12943-018-0777-1
Xiao, D., and He, J. (2010). Epithelial mesenchymal transition and lung cancer. J. Thorac. Dis. 2 (3), 154–159. doi:10.3978/j.issn.2072-1439.2010.02.03.7
Yoshihara, K., Shahmoradgoli, M., Martinez, E., Vegesna, R., Kim, H., Torres-Garcia, W., et al. (2013). Inferring tumour purity and stromal and immune cell admixture from expression data. Nat. Commun. 4, 2612. doi:10.1038/ncomms3612
Yu, J., Mao, W., Sun, S., Hu, Q., Wang, C., Xu, Z., et al. (2022). Characterization of an Autophagy-Immune related genes score signature and prognostic model and its correlation with immune response for bladder cancer. Cancer Manag. Res. 14, 67–88. doi:10.2147/CMAR.S346240
Yu, Z., and Ouyang, L. (2022). Identification of key prognostic genes in ovarian cancer using WGCNA and LASSO analysis. All life (Online) 15 (1), 728–744. doi:10.1080/26895293.2022.2087107
Yuan, Q., Ren, J., Li, L., Li, S., Xiang, K., and Shang, D. (2021). Development and validation of a novel N6-methyladenosine (m6A)-related multi- long non-coding RNA (lncRNA) prognostic signature in pancreatic adenocarcinoma. Bioengineered 12 (1), 2432–2448. doi:10.1080/21655979.2021.1933868
Yuan, Q., Ren, J., Wang, Z., Ji, L., Deng, D., and Shang, D. (2021). Identification of the real hub gene and construction of a novel prognostic signature for pancreatic adenocarcinoma based on the weighted gene co-expression network analysis and least absolute shrinkage and selection operator algorithms. Front. Genet. 12, 692953. doi:10.3389/fgene.2021.692953
Keywords: drug resistance, EGFR-TKI, LUAD, nomogram, prognosis prediction
Citation: Zhuge J, Wang X, Li J, Wang T, Wang H, Yang M, Dong W and Gao Y (2022) Construction of the model for predicting prognosis by key genes regulating EGFR-TKI resistance. Front. Genet. 13:968376. doi: 10.3389/fgene.2022.968376
Received: 16 June 2022; Accepted: 16 November 2022;
Published: 25 November 2022.
Edited by:
Chang Zou, Jinan University, ChinaReviewed by:
Eskezeia Dessie, Cincinnati Children’s Hospital Medical Center, United StatesCopyright © 2022 Zhuge, Wang, Li, Wang, Wang, Yang, Dong and Gao. This is an open-access article distributed under the terms of the Creative Commons Attribution License (CC BY). The use, distribution or reproduction in other forums is permitted, provided the original author(s) and the copyright owner(s) are credited and that the original publication in this journal is cited, in accordance with accepted academic practice. No use, distribution or reproduction is permitted which does not comply with these terms.
*Correspondence: Wen Dong, ZHdobnN6bHl5QDEyNi5jb20=; Yong Gao, Znllcnl1YW5neThAMTI2LmNvbQ==
†These authors have contributed equally to this work
Disclaimer: All claims expressed in this article are solely those of the authors and do not necessarily represent those of their affiliated organizations, or those of the publisher, the editors and the reviewers. Any product that may be evaluated in this article or claim that may be made by its manufacturer is not guaranteed or endorsed by the publisher.
Research integrity at Frontiers
Learn more about the work of our research integrity team to safeguard the quality of each article we publish.