
94% of researchers rate our articles as excellent or good
Learn more about the work of our research integrity team to safeguard the quality of each article we publish.
Find out more
ORIGINAL RESEARCH article
Front. Genet. , 10 October 2022
Sec. Computational Genomics
Volume 13 - 2022 | https://doi.org/10.3389/fgene.2022.967363
Parts of this article's content have been modified or rectified in:
Erratum: Integration of RNA molecules data with prior-knowledge driven Joint Deep Semi-Negative Matrix Factorization for heart failure study
Heart failure (HF) is the main manifestation of cardiovascular disease. Recent studies have shown that various RNA molecules and their complex connections play an essential role in HF’s pathogenesis and pathological progression. This paper aims to mine key RNA molecules associated with HF. We proposed a Prior-knowledge Driven Joint Deep Semi-Negative Matrix Factorization (PD-JDSNMF) model that uses a hierarchical nonlinear feature extraction method that integrates three types of data: mRNA, lncRNA, and miRNA. The PPI information is added to the model as prior knowledge, and the Laplacian constraint is used to help the model resist the noise in the genetic data. We used the PD-JDSNMF algorithm to identify significant co-expression modules. The elements in the module are then subjected to bioinformatics analysis and algorithm performance analysis. The results show that the PD-JDSNMF algorithm can robustly select biomarkers associated with HF. Finally, we built a heart failure diagnostic model based on multiple classifiers and using the Top 13 genes in the significant module, the AUC of the internal test set was up to 0.8714, and the AUC of the external validation set was up to 0.8329, which further confirmed the effectiveness of the PD-JDSNMF algorithm.
Heart failure (HF) is a common type of cardiovascular disease, and its morbidity and mortality are increasing yearly (Castiglione et al., 2022). The pathogenesis of HF involves multiple risk factors, especially diabetes, acute myocardial infarction, hypertension, and coronary heart disease (Fan and Hu, 2022). Despite significant improvements in disease diagnosis and treatment, the prognosis of patients with HF remains poor (Gomes et al., 2020). Various methods have been used to diagnose HF, such as echocardiography, clinical signs, and NT-proBNP/BNP. However, these methods have certain limitations. For example, echocardiography relies on experts’ operation ability and rich experience. NT-proBNP/BNP is an invasive diagnosis and may harm HF patients. Therefore, genes or other genetic material have emerged as an alternative non-invasive method for disease diagnosis (Chair et al., 2021). In addition, genotypic biomarkers also provide potential targets for drug development. The search for new biomarkers is of great significance for improving the diagnosis and treatment of HF.
With the development of RNA sequencing data, researchers can effectively identify and mine disease-related RNA molecular biomarkers. In addition to messenger RNA (mRNA), long non-coding RNA (lncRNA) and microRNA (miRNA) have also been shown to be extensively involved in the pathological progression of HF (Fan et al., 2018). MiRNAs can alter cardiac differentiation, proliferation, maturation, and pathological remodeling responses (Yan et al., 2017). Sala et al., 2016 reviewed several miRNAs that play an essential role in HF, such as miR-18a-5p, miR-652–3p, and miR-126 (Wang and Cai, 2017). LncRNAs are essential regulators during cardiovascular development (Fan et al., 2018). Researchers found that lncRNA-Cancer Susceptibility Candidate 7 (CASC7) is involved in the progression of HF by regulating the expression of miR-30c, which is also a promising diagnostic-related gene for HF (Xu et al., 2020). In addition, the three RNA molecules are complexly interconnected (Song et al., 2016). Therefore, identifying HF-related RNA molecules may provide new insights into the pathogenesis and progression of HF.
Due to their complementary information, multi-omics data can capture and mine disease-related and biologically meaningful biomarkers. Exploring multi-omics integration algorithms is a hot topic in bioinformatics research. Joint non-negative matrix factorization (JNMF) has attracted the attention of researchers due to its low time complexity and strong clustering performance. Zhang et al. first proposed this algorithm, applied it to cancer genomics (Zhang et al., 2012), and identified multiple biologically meaningful co-expression modules. Deng et al. used this algorithm to construct a ceRNA network closely related to lung cancer (Deng et al., 2018). Further, they added orthogonal constraints to the algorithm and proposed a Multi-Constrained Joint Non-negative Matrix Factorization (MCJNMF) algorithm. The algorithm integrates PET image data and DNA methylation data of patients with soft tissue sarcoma and mines biomarkers and significant imaging features related to soft tissue sarcoma lung metastasis (Deng et al., 2019). Recently, to integrate pathological images of soft tissue sarcomas with two genetic data (DNA methylation and copy number variation), they proposed a Multi-Dimensional Joint Non-negative Matrix Factorization (MDJNMF) algorithm that integrates multiple biological empirical knowledge, the potential association pattern with the three kinds of data was found through multi-level analysis. The comprehensive prediction index AUC of the identified relevant biomarkers reached 0.8 (Deng et al., 2021). The above matrix factorization correlation algorithms are based on linear assumptions and cannot consider the complex relationship between multi-omics data from a nonlinear perspective. To this end, Sehwan Moon et al. proposed a Joint Deep Semi-Negative Matrix Factorization (JDSNMF) algorithm, which applies a deep neural network (DNN) to the JNMF algorithm to identify disease-related significant nonlinear features. However, the JDSNMF algorithm does not consider the rich prior knowledge in multi-omics data, which can induce the algorithm to select biologically meaningful modules (Wei et al., 2022).
To this end, this paper proposed a prior knowledge-driven joint, semi-nonnegative matrix factorization algorithm (PD-JDSNMF) to integrate miRNA, mRNA, and lncRNA. The algorithm adds PPI interaction information based on the JDSNMF algorithm. The aim is to drive the algorithm to obtain more biologically meaningful co-expression modules. Since the algorithm based on matrix factorization is more sensitive to noise, we add Laplacian matrix constraints on the three kinds of data to enhance the anti-noise performance of the algorithm. We used the PD-JDSNMF algorithm to obtain multiple biologically significant co-expression modules. For the modules with strong correlation, we performed correlation analysis on the three types of data and mined multiple pathways significantly related to the disease. In addition, we constructed a heart failure diagnosis model using multiple classifiers for the top 13 features with high importance in this module, and its AUC in the test set reached the highest of 0.8714. We use an independent external validation set for diagnostic model validation, which achieves the highest AUC of 0.8329. It suggests that the selected features have diagnostic significance for heart failure.
This section describes the framework of the PD-JDSNMF algorithm, which combines three types of RNA-seq data to identify co-expression modules. Figure 1 below presents the overall experimental framework of this paper. First, the objective function and its iterative update rule are given. The input of the whole framework consists of three parts, one is the expression profile of miRNA, mRNA, and lncRNA of the same set of samples (represented as matrix
Then, the three RNA expression matrices are decomposed into a common basis matrix
Let
JDSNMF adopts the principle of multilayer NMF and nonlinear activation functions to represent nonlinear manifolds. Also, it uses regularization to prevent overfitting. Its objective function is as follows:
Among them,
This section proposed a prior knowledge-driven Joint Deep Semi-Non-Negative Matrix Factorization. Specifically, we added PPI interaction information to the feature latent matrix
Among them,
Here,
The STRING (http://string-db.org) database was used to predict the PPI network in the module and analyze the interactions between proteins. Pairs of nodes in the PPI network were screened, and interactions with a combined score >0.4 were considered statistically significant. Molecular interaction networks were visualized using Cytoscape. Next, we identified core genes from the PPI network using the MCC method in cytoHubba (Cytoscape plugin).
To explore the biological functions of genes in modules in HF, we performed Disease ontology (DO) enrichment analysis and Kyoto Encyclopedia of Genes and Genomes (KEGG) enrichment analysis in selected modules. The DO enrichment analysis as well as the KEGG enrichment analysis were performed by the “clusterProfiler” package. The “ggplot” package is used to draw bubble plots. In DO analysis, q-values less than 0.05 were considered statistically significant. Pathways with p-values less than 0.05 were considered significant in the KEGG analysis.
We downloaded RNA-seq data (GSE141910) containing 200 HF samples and 166 normal samples from the GEO database (https://www.ncbi.nlm.nih.gov/geo/). This paper used the human genome assembly GRCh38 file to convert the ensemble ID of GSE141910 data into gene name and genotype annotation and extracted 14914 mRNAs, 3,134 lncRNAs, and 30 miRNAs. Moreover, we downloaded the GSE116250 data from the GEO database as a validation dataset for ROC analysis. 14 normal samples and 50 HF samples were included in the GSE116250 data. Then randomly select 80% of the samples as the training set and 20% as the test set. Finally, 292 training samples and 74 testing samples are obtained.
We normalized the three RNA expression data using the R package “limma” and performed differential expression analysis on the expression data of mRNA and lncRNA. mRNAs or lncRNAs whose absolute value of logFC was less than 1 and p-value less than 0.05 were regarded as differentially expressed genes. The “pheatmap” package draws volcano plot and heatmaps. Finally, this study obtained 727 differentially expressed mRNAs (DEmRNAs) (Figures 2A,B) and 162 differentially expressed lncRNAs (DElncRNAs) (Figures 2C,D).
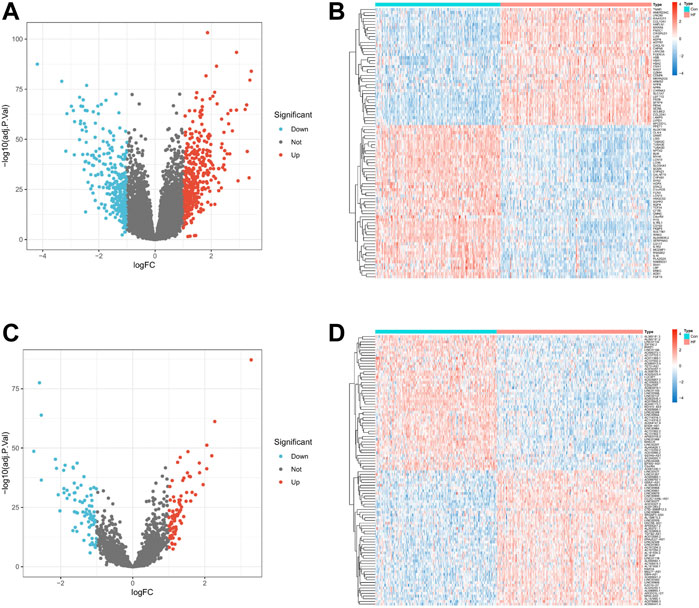
FIGURE 2. Differential expression levels of mRNA and lncRNA in HF. (A,C). Volcano plot of 727 DEmRNAs and 162 DElncRNAs. Up-regulated genes are indicated in red, and down-regulated genes are indicated in blue. Genes with no significant change are marked as grey dots. (B,D). Expression heat map of Top 100 DEmRNA and Top 100 DElncRNA. Red means genes are up-regulated, blue means genes are down-regulated.
In this paper, the sigmoid function is used as the activation function so that the decomposed feature latent matrix has non-negative nonlinearity. Furthermore, for the initialization of the basis and coefficient matrices, we use the singular value decomposition (SVD) algorithm, which has been shown to produce better local optima for matrix classification algorithms.
Furthermore, this section will introduce the hyperparameter settings of PD-JDSNMF and classification models. PD-JDSNMF model has four key hyperparameters: number of layers, dimensionality reduction
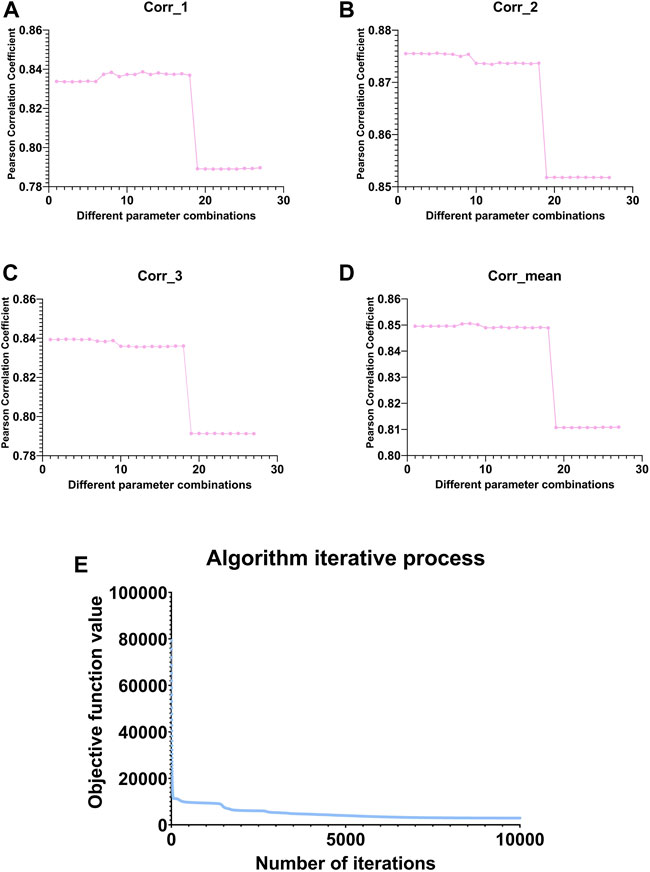
FIGURE 3. Line graph of the change in Pearson correlation coefficient between the original and reconstructed matrices under different parameter combinations. (A–C) represent the variation of the Pearson correlation coefficient between
We selected the parameters based on the mean value in subgraph D of Figure 3 and finally select the eighth group of parameters, whose corresponding parameters are
In all matrix factorization models, dimensionality reduction

TABLE 1. Reconstruction performance of the algorithm under different k values in the neural network layer.
It can be seen from the above table that there are three sets of
After performing the PD-JNMF algorithm on the HF RNA-seq dataset with the optimal parameter combination, we obtained 30 co-expression modules, each of which contained an average of 5.47 miRNAs, 118.33 mRNAs, and 28.73 lncRNAs. The mean correlations of the reconstructed mRNA expression data, lncRNA expression data, and miRNA expression data with the original data were 0.8362, 0.8758, and 0.8383, respectively.
We counted the Pearson correlation coefficients of the original and reconstructed matrices in all modules, and the Table 2 gives the details of the modules with the Top 3 Pearson correlation coefficients.
To meet the needs of subsequent analysis, we draw Venn diagrams for the three elements in these modules, as shown in Figure 4.

FIGURE 4. Three kinds of members Venn diagrams of the top 3 modules. The intersection of miRNAs (A), mRNAs (B) and lncRNAs (C) in module 1, module 12 and module 30.
As shown from the Figure 4, miRNAs and mRNAs in module 12 have more intersections with the other two modules, suggesting that this module is more likely to be involved in complex mechanisms related to HF. Therefore, further analysis of module 12 will be carried out subsequently. In addition, this paper also draws a heat map of the expression levels of the three RNAs in module 12 on the training and test sets (Supplementary Figure S1).
Subsequently, to explore the biological functions of genes in module 12, we perform DO enrichment analysis and KEGG enrichment analysis on module 12. The results of DO enrichment analysis show that the genes in module 12 are mainly associated with cardiovascular diseases, such as atherosclerosis, arteriosclerotic cardiovascular disease, arteriosclerosis, myocardial infarction, and coronary artery disease (Figure 5A). These diseases are risk factors for heart failure. KEGG enrichment analysis showed that the genes in module 12 were mainly involved in Complement and coagulation cascades, Cytokine-cytokine receptor interaction, Arachidonic acid metabolism, and Leishmaniasis, Phagosome and Hematopoietic cell lineage (Figure 5B). These pathways are closely related to HF. Studies have shown that Complement and coagulation cascades are involved in the post-MI response (Yin et al., 2022). Many studies have found that Cytokine-cytokine receptor interaction plays an essential role in the occurrence and development of acute myocardial infarction and HF (). Danqi Pill can prevent heart failure by regulating the pathway of Arachidonic acid metabolism (Wang et al., 2014). The above results suggest that the genes in module 12 may play an essential role in the pathological progression of HF.
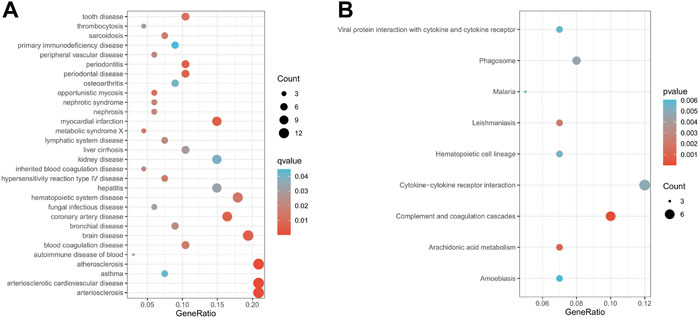
FIGURE 5. Enrichment analysis results of module 12 (A). The results of DO enrichment analysis. (B) The results of KEGG enrichment analysis. The size of circles represented the number of genes enriched.
Next, we constructed a PPI network for the genes in module 12 and evaluated the network using the NetworkAnalyzer plugin in Cytoscape (Figure 6A). Next, we used the MCC method in cytoHubba to identify important genes in the PPI network, and the top 10 scoring genes were identified as core genes of module 12 (Figure 6B). They are VSIG4, IL10, FPR1, FCGR3A, TLR2, ARG1, CLEC7A, CCR1, S100A9, CD163.
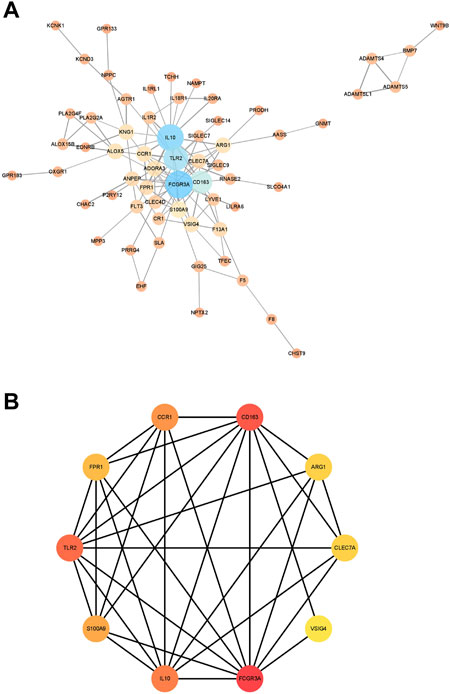
FIGURE 6. The results of PPI network. (A). The PPI network were analyzed using NetworkAnalyzer plugin. (B). The hub genes with the top 10 scores. The size and color of the nodes represent the importance of genes in the interaction network. The larger the node or the darker the color, the more important the corresponding gene is in the network. The connection between the nodes represents the interaction between the two genes, and the wider the connection line, the stronger the interaction between the two genes.
Figure 7 presents the reconstruction capability comparison between the proposed PD-JDSNMF algorithm and the other three NMF-based algorithms.
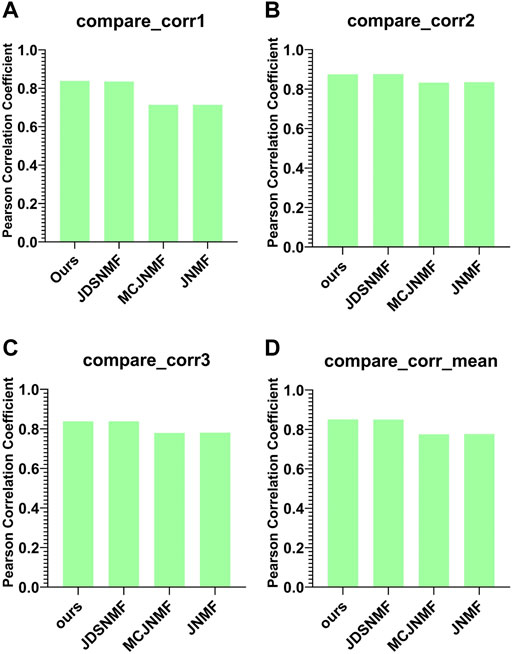
FIGURE 7. Comparison of reconstruction capabilities of the four algorithms. (A–C) are histograms of the Pearson correlation coefficients of the four algorithms between
As can be seen from Figure 7, the two NMF algorithms based on nonlinear decomposition strategies achieve more robust matrix reconstruction performance. The average Pearson correlation coefficient of the proposed PD-JDSNMF algorithm is more significant than that of the other three algorithms, which verifies the effectiveness of the proposed algorithm to a certain extent.
In order to evaluate the genes in module 12 as having diagnostic significance for HF, we first used the RF algorithm to rank the feature importance in this module. Figure 8 shows the top 50 elements with solid importance in this module.
Next, based on four classifiers (RF, SVM, LR, and DNN), we used Top 1 to Top 50 genes in module 12 to classify whether there was HF or not and compared the changes in AUC as shown in Figure 9.
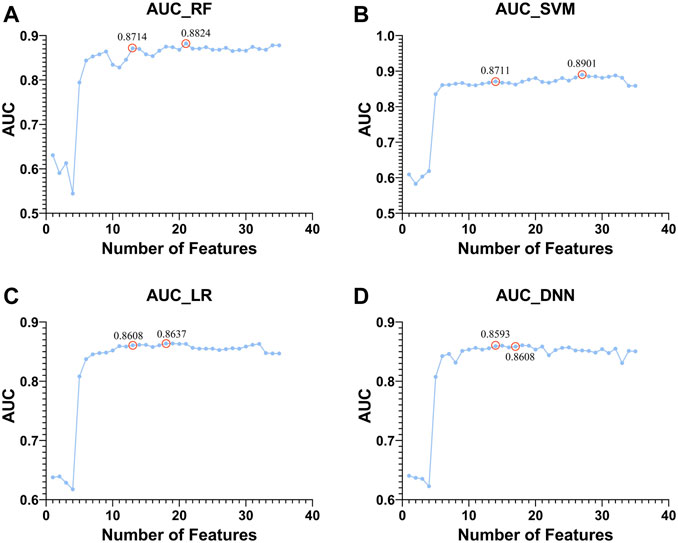
FIGURE 9. Top 1 to Top 50 features to classify whether subjects are sick or not and shows the trend of increasing AUC with the features used. The classifiers used by (A–D). RF, SVM, LR, and DNN, respectively.
There are two points marked in each subplot in Figure 9. The first point of each subgraph represents the case where the classifier is used to select as few features as possible to guarantee a high AUC. The second point represents where the AUC is maximized using this classifier. As can be seen from the figure, the maximum AUC is achieved with the RF classifier, which is 0.8824. In addition, when using this classifier to select the Top 13 features, the AUC can reach 0.8714. Therefore, RF has a better classification effect on this dataset than the other three classifiers. For the first point of the four classifiers, we plotted its ROC curve in detail, as shown in Figure 10.
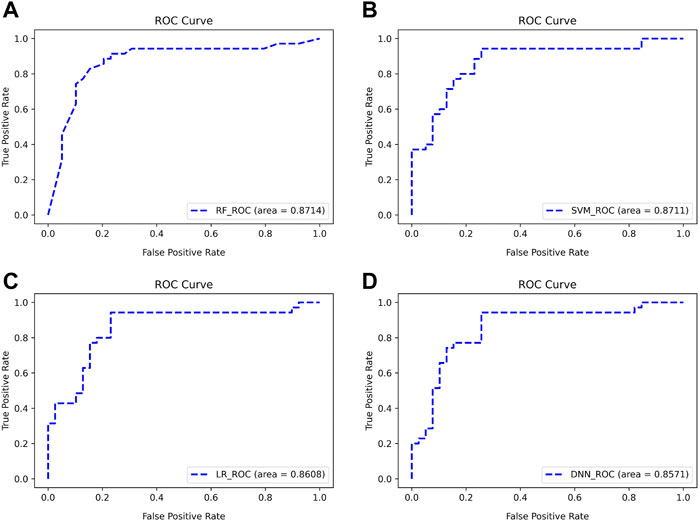
FIGURE 10. ROC curves for classifying subjects using Top features (A–D). The classifiers used are RF, SVM, LR, and DNN, respectively.
As can be seen from Figure 10, the four classifiers all have high classification accuracy at their respective first points. To further validate that the Top 13 genes have diagnostic significance for HF, we performed validation using the Top 13 genes in an external validation set. Figure 11 shows the ROC curve for this external validation set based on the four classifiers using Top 13 features.
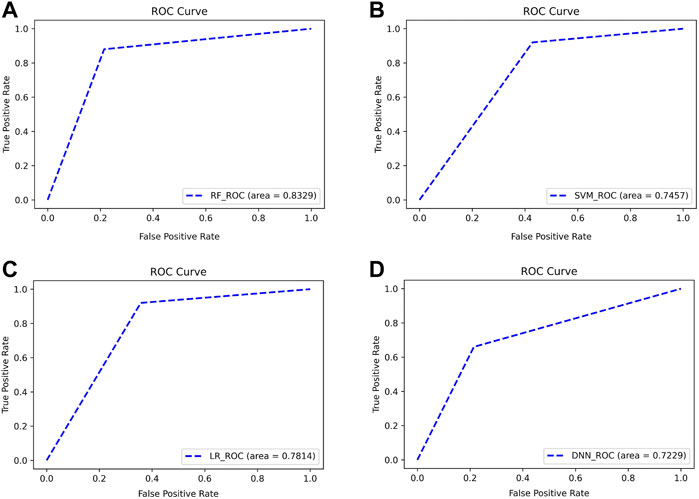
FIGURE 11. ROC curves for classifying subjects on external validation set using Top 13 features. The classifiers used by (A–D) are RF, SVM, LR, and DNN, respectively.
As can be seen from Figure 11, using the Top 13 genes also obtained better classification accuracy on the external validation set. Among them, the AUC using the RF classifier reached 0.8329. This confirms that the Top 13 genes have a robust diagnostic ability for HF.
This study identified 13 genes (MIR570, MIR590, MIR4506, MIR4786, IL1RL1, RNASE2, CD163, ST6GALNAC3, SIGLEC9, VSIG4, NPTX2, BLM, TUBA3E) that were closely related to HF. Myocardial infarction leads to the death of cardiomyocytes, leading to cardiac fibrosis, cardiac remodeling, and heart failure. In a human fibroblast model, researchers found that MIR590 inhibits cardiac fibrosis after myocardial infarction (Yuan et al., 2020). Chronic inflammation and fibrosis in the heart muscle eventually lead to heart failure. Studies have confirmed that MIR590 is closely related to myocarditis (Oh et al., 2022). CircRNA-0068481 can promote the pathological progression of right ventricular hypertrophy (VH) by regulating the expression of MIR570 (Guo and Liu, 2021). MiRNA-induced regulation can be propagated through transcription factors (TFs) (Naeem et al., 2011). STAT1 is one of the transcription factors of MIR4506. STAT1 can lead to the loss of cardiomyocytes by increasing apoptosis and reducing cardioprotective autophagy (Knight et al., 2012). CEBPB is one of the transcription factors of MIR4786. CEBPB inhibits cardiomyocyte growth and proliferation in the mammalian heart, and the reduction of CEBPB is a core signal of physiological hypertrophy and proliferation (Boström et al., 2010). Broch et al. (2012) found that L1RL1 can reflect the activity of the interplay of inflammation and hemodynamic stress in heart failure and may be a potential therapeutic target for heart failure. Idiopathic pulmonary arterial hypertension (IPAH) can lead to heart failure. In the experiment between IPAH and the control group, the researchers found that RNASE2 is involved in the pathogenesis of IPAH (Zeng et al., 2021). It has been reported that CD163 concentrations are elevated in heart failure patients compared with healthy controls (Ptaszynska-Kopczynska et al., 2016). A previous study identified VSIG4 as a right ventricle-specific myocardial biomarker (di Salvo et al., 2015). SIGLEC9 negatively regulates inflammatory responses. Inflammation is an essential factor in the development and progression of HF (Chaikijurajai and Tang, 2020). NPTX2 encodes a synaptic protein associated with C-reactive protein. Several studies have confirmed that C-reactive protein can effectively predict the occurrence of HF (Maio et al., 2021). Deletion or mutation of BLM may result in telomere defects and accelerated telomere shortening (Callén and Surrallés, 2004). Studies have shown that cardiomyocyte-specific telomere shortening is a striking feature of HF (Sharifi-Sanjani et al., 2017). TUBA3E encodes α-tubulin and is closely associated with cytoskeletal remodeling. Microtubule accumulation was found in HF patients, thereby increasing the load on myocytes and promoting cardiac dysfunction (Hein et al., 20001072). The above results suggest that these 13 genes may play essential roles in the occurrence and progression of HF.
In order to verify the ability of the proposed algorithm to reconstruct the original matrix, we use the features selected by the proposed PD-JDSNMF and the three algorithms of JDSNMF, MCJNMF, and JNMF, and use four classifiers to compare the classification accuracy. To fairly compare the feature selection ability of several algorithms, we first select the module with the most robust reconstruction performance from all co-expression modules of several algorithms. Then, 50 features were randomly selected from the saliency module and repeated ten times to calculate the AUC for classification using the four classifiers, respectively, and the following violin plot was drawn as shown in Figure 12.
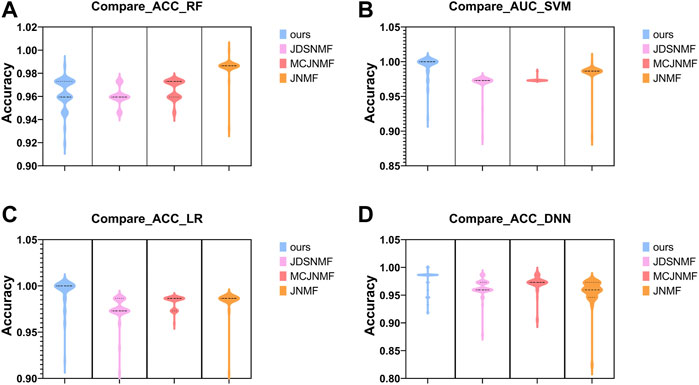
FIGURE 12. Violin plots for AUC using four classifiers to classify the features of the four algorithms in their respective significant modules. (A–D). The comparison results obtained using RF, SVM, LR, and DNN.
As can be seen from Figure 12 the proposed algorithm achieves higher AUC among the four classifiers, which again confirms that incorporating prior knowledge into the nonlinear matrix factorization algorithm can obtain more representative features.
This paper proposed a PD-JDSNMF algorithm to integrate prior information in genetic data, extract nonlinear features in genetic data, capture the underlying expression patterns of multiple data, mine heart failure-related biological markers, and build diagnostic models. Specifically, we identified module 12 as a key module and the genes in the module as inputs for subsequent analyses through functional enrichment analysis. Using multiple classifiers, we constructed a heart failure diagnostic model and validated the diagnostic model on an external dataset, which achieved an AUC of 0.8329. Compared with several other NMF-based algorithms, the proposed algorithm has a stronger matrix reconstruction ability. Furthermore, the PD-JDSNMF algorithm is confirmed to have a more stronger feature selection ability by using elements for classification.
The datasets presented in this study can be found in online repositories. The names of the repository/repositories and accession number(s) can be found in the article/Supplementary Material.
ZM: conceptualization, methodology, software, visualization, investigation, software, validation. BC: conceptualization, methodology, supervision, software, validation, writing—review and editing. YZ: data curation, writing—review and editing. JZ: visualization, investigation. JT: data curation, supervision. YH: software, validation. All authors read and approved the manuscript.
The authors declare that the research was conducted in the absence of any commercial or financial relationships that could be construed as a potential conflict of interest.
All claims expressed in this article are solely those of the authors and do not necessarily represent those of their affiliated organizations, or those of the publisher, the editors and the reviewers. Any product that may be evaluated in this article, or claim that may be made by its manufacturer, is not guaranteed or endorsed by the publisher.
The Supplementary Material for this article can be found online at: https://www.frontiersin.org/articles/10.3389/fgene.2022.967363/full#supplementary-material
Boström, P., Mann, N., Wu, J., Quintero, P. A., Plovie, E. R., Panáková, D., et al. (2010). C/EBPβ controls exercise-induced cardiac growth and protects against pathological cardiac remodeling Cell, 143, 1072. doi:10.1016/j.cell.2010.11.036
Broch, K., Ueland, T., Yndestad, A., Aukrust, P., and Gullestad, L. (2012). Heart failure biomarkers: Focus on interleukin-1 receptor-like 1-based blood tests. Drugs Today 48 (7), 479–491. doi:10.1358/dot.2012.48.7.1811719
Callén, E., and Surrallés, J. (2004). Telomere dysfunction in genome instability syndromes. Mutat. Research/Reviews Mutat. Res. 567 (1), 85–104. doi:10.1016/j.mrrev.2004.06.003
Castiglione, V., Aimo, A., Vergaro, G., Saccaro, L., Passino, C., and Emdin, M. (2022). Biomarkers for the diagnosis and management of heart failure. Heart Fail Rev. 27 (2), 625–643. doi:10.1007/s10741-021-10105-w
Chaikijurajai, T., and Tang, W. H. W. (2020). Reappraisal of inflammatory biomarkers in heart failure. Curr. Heart Fail Rep. 17, 9–19. doi:10.1007/s11897-019-00450-1
Chair, S. Y., Chan, J. Y. W., Waye, M. M. Y., Liu, T., Law, B. M. H., and Chien, W. T. (2021).,Exploration of potential genetic biomarkers for heart failure: A systematic review Int J Environ Res Public Health. 18, 5904. doi:10.3390/ijerph18115904
Deng, Jin, Zeng, W., Kong, W., Shi, Y., Mou, X., and Guo, J. (2019). Multi-constrained joint non-negative matrix factorization with application to imaging genomic study of lung metastasis in soft tissue sarcomas. IEEE Trans. Biomed. Eng. 67 (7), 1. doi:10.1109/TBME.2019.2954989
Deng, J., et al. (2021). Integrating multiple genomic imaging data for the study of lung metastasis in sarcomas using multi-dimensional constrained joint non-negative matrix factorization. Inf. Sci. 576, 4. doi:10.1016/j.ins.2021.06.058
Deng, Jin, Kong, W., Wang, S., Mou, X., and Zeng, W. (2018). Prior knowledge driven joint NMF algorithm for ceRNA Co-module identification.” Int. J. Biol. Sci. 14, 1822. doi:10.7150/ijbs.27555
di Salvo, T. G., Yang, K. C., Brittain, E., Absi, T., Maltais, S., and Hemnes, A. (2015). Right ventricular myocardial biomarkers in human heart failure. J. Cardiac Fail. 21 (5), 398–411. doi:10.1016/j.cardfail.2015.02.005
Fan, S., and Hu, Y. (2022). Integrative analyses of biomarkers and pathways for heart failure. BMC Med. Genomics 15, 72. doi:10.1186/s12920-022-01221-z
Fan, Z., Gao, S., Chen, Y., Xu, B., Yu, C., Yue, M., et al. (2018).Integrative analysis of competing endogenous RNA networks reveals the functional lnc RNA s in heart failure, J. Cell Mol. Med, 22, 13739. doi:10.1111/jcmm.13739
Gomes, C. P. C., Schroen, B., Kuster, G. M., Robinson, E. L., Ford, K., Squire, I. B., et al. (2020). Regulatory RNAs in heart failure. Circulation 141, 328. doi:10.1161/CIRCULATIONAHA.119.042474
Guo, H. M., and Liu, Z. P. (2021). Up-regulation of circRNA_0068481 promotes right ventricular hypertrophy in PAH patients via regulating miR-646/miR-570/miR-885. J. Cell Mol. Med. 25 (8), 3735–3743. doi:10.1111/jcmm.16164
Hein, S., Kostin, S., Heling, A., Maeno, Y., and Schaper, J. (2000).The role of the cytoskeleton in heart failure. Cardiovasc Res, 45. , 273–278. doi:10.1016/s0008-6363(99)00268-0
Kim, M., Ji, H. W., and Youn, J. (2019). Joint-connectivity-based sparse canonical correlation analysis of imaging genetics for detecting biomarkers of Parkinson's disease[J]. IEEE Trans. Med. Imaging 99, 1. doi:10.1109/TMI.2019.2918839
Knight, R. A., Scarabelli, T. M., and Stephanou, A. (2012). STAT transcription in the ischemic heart. JAK-STAT 1 (2), 111–117. doi:10.4161/jkst.20078
Maio, R., Perticone, M., Suraci, E., Sciacqua, A., Sesti, G., and Perticone, F. (2021).Endothelial dysfunction and C-reactive protein predict the incidence of heart failure in hypertensive patients. Esc. Heart Fail. 8, 399–407. doi:10.1002/ehf2.13088
Naeem, H., Küffner, R., and Zimmer, R. (2011). MIRTFnet: Analysis of miRNA regulated transcription factors, PLoS One 6, e22519. doi:10.1371/journal.pone.0022519
Oh, J. H., Kim, G. B., and Seok, H. (2022). Implication of microRNA as a potential biomarker of myocarditis. Clin. Exp. Pediatr. 65 (5), 230–238. doi:10.3345/cep.2021.01802
Pedregosa, F., Varoquaux, G., Gramfort, A., Michel, V., Thirion, B., Grisel, O., et al. (2011). Scikit-learn: Machine learning in Python. J. Mach. Learn. Res. 12, 2825. doi:10.3389/fninf.2014.00014
Ptaszynska-Kopczynska, K., Marcinkiewicz-Siemion, M., Lisowska, A., Waszkiewicz, E., Witkowski, M., Jasiewicz, M., et al. (2016). Alterations of soluble TWEAK and CD163 concentrations in patients with chronic heart failure. Cytokine 80, 7–12. doi:10.1016/j.cyto.2016.02.005
Sala, V., Gatti, S., Gallo, S., Medico, E., Cantarella, D., Cimino, J., et al. (2016). A new transgenic mouse model of heart failure and cardiac cachexia raised by sustained activation of met tyrosine kinase in the heart. BioMed Res. Int. 2016, 1. doi:10.1155/2016/9549036
Sharifi-Sanjani, M., Oyster, N. M., Tichy, E. D., Bedi, K. C., Harel, O., Margulies, K. B., et al. (2017). Cardiomyocyte-specific telomere shortening is a distinct signature of heart failure in humans Jaha, 6, e005086. doi:10.1161/JAHA.116.005086
Song, C., Zhang, J., Liu, Y., Pan, H., Qi, H. P., Cao, Y. G., et al. (2016). Construction and analysis of cardiac hypertrophy-associated lncRNA-mRNA network based on competitive endogenous RNA reveal functional lncRNAs in cardiac hypertrophy. Oncotarget 7, 10827–10840. doi:10.18632/oncotarget.7312
Wang, H., and Cai, J. (2017). The role of microRNAs in heart failure. Biochimica Biophysica Acta (BBA). Mol. Basis Dis. 1863 (8), 2019–2030. doi:10.1016/j.bbadis.2016.11.034
Wang, S., Wang, E., Chen, Q., Yang, Y., Xu, L., Zhang, X., et al. (2021). Uncovering potential lncRNAs and mRNAs in the progression from acute myocardial infarction to myocardial fibrosis to heart failure, Front. Cardiovasc. Med, 8, 664044. doi:10.3389/fcvm.2021.664044
Wang, Y., Li, C., Liu, Z., Shi, T., Wang, Q., Li, D., et al. (2014) DanQi Pill protects against heart failure through the arachidonic acid metabolism pathway by attenuating different cyclooxygenases and leukotrienes B4 BMC Complement. Altern. Med 14, 6882. doi:10.1186/1472-6882-14-67
Wei, K., Kong, W., and Wang, S. (2022). Integration of imaging genomics data for the study of alzheimer's disease using joint-connectivity-based sparse nonnegative matrix factorization. J. Mol. Neurosci. 72 (2), 255–272. doi:10.1007/s12031-021-01888-6
Xu, Y. L., Liu, Y., Cai, R. P., He, S. R., Dai, R. X., Yang, X. H., et al. (2020). Long non-coding RNA CASC7 is associated with the pathogenesis of heart failure via modulating the expression of miR-30cEpub 2020 Aug 29. Erratum in. J. Cell. Mol. Med.J Cell Mol. Med. 2426 (197), 115002133–115011511. doi:10.1111/jcmm.15764
Yan, H., Ma, F., Zhang, Y., Wang, C., Qiu, D., Zhou, K., et al. (2017). miRNAs as biomarkers for diagnosis of heart failure, Med. Baltim 96, 6825. doi:10.1097/MD.0000000000006825
Yin, X., Wang, X., Wang, S., Xia, Y., Chen, H., Yin, L., et al. (2022). Screening for regulatory network of miRNA-inflammation, oxidative stress and prognosis-related mRNA in acute myocardial infarction: An in silico and validation study. Ijgm Vol. 15, 1715–1731. doi:10.2147/IJGM.S354359
Yuan, X., Pan, J., Wen, L., Gong, B., Li, J., Gao, H., et al. (2020). MiR-590-3p regulates proliferation, migration and collagen synthesis of cardiac fibroblast by targeting ZEB1. J. Cell. Mol. Medi 24 (1), 227–237. doi:10.1111/jcmm.14704
Zeng, H., Liu, X., and Zhang, Y. (2021). Identification of potential biomarkers and immune infiltration characteristics in idiopathic pulmonary arterial hypertension using bioinformatics analysis. Front. Cardiovasc. Med. 8, 624714. doi:10.3389/fcvm.2021.624714
Keywords: heart failure, biomarker, joint nonnegative matrix factorization, diagnostic model, machine learning
Citation: Ma Z, Chen B, Zhang Y, Zeng J, Tao J and Hu Y (2022) Integration of RNA molecules data with prior-knowledge driven Joint Deep Semi-Negative Matrix Factorization for heart failure study. Front. Genet. 13:967363. doi: 10.3389/fgene.2022.967363
Received: 14 June 2022; Accepted: 27 September 2022;
Published: 10 October 2022.
Edited by:
Andrei Rodin, City of Hope National Medical Center, United StatesCopyright © 2022 Ma, Chen, Zhang, Zeng, Tao and Hu. This is an open-access article distributed under the terms of the Creative Commons Attribution License (CC BY). The use, distribution or reproduction in other forums is permitted, provided the original author(s) and the copyright owner(s) are credited and that the original publication in this journal is cited, in accordance with accepted academic practice. No use, distribution or reproduction is permitted which does not comply with these terms.
*Correspondence: Bin Chen, dGFpaGUtY2hlbmJpbkAxNjMuY29t
Disclaimer: All claims expressed in this article are solely those of the authors and do not necessarily represent those of their affiliated organizations, or those of the publisher, the editors and the reviewers. Any product that may be evaluated in this article or claim that may be made by its manufacturer is not guaranteed or endorsed by the publisher.
Research integrity at Frontiers

Learn more about the work of our research integrity team to safeguard the quality of each article we publish.