
94% of researchers rate our articles as excellent or good
Learn more about the work of our research integrity team to safeguard the quality of each article we publish.
Find out more
ORIGINAL RESEARCH article
Front. Genet., 20 October 2022
Sec. Cancer Genetics and Oncogenomics
Volume 13 - 2022 | https://doi.org/10.3389/fgene.2022.960567
This article is part of the Research TopicIntegrative Analysis of Single-Cell and/or Bulk Multi-omics Sequencing DataView all 14 articles
Breast cancer is a heterogeneous disease whose subtypes represent different histological origins, prognoses, and therapeutic sensitivity. But there remains a strong need for more specific biomarkers and broader alternatives for personalized treatment. Our study classified breast cancer samples from The Cancer Genome Atlas (TCGA) into three groups based on glycosylation-associated genes and then identified differentially expressed genes under different glycosylation patterns to construct a prognostic model. The final prognostic model containing 23 key molecules achieved exciting performance both in the TCGA training set and testing set GSE42568 and GSE58812. The risk score also showed a significant difference in predicting overall clinical survival and immune infiltration analysis. This work helped us to understand the heterogeneity of breast cancer from another perspective and indicated that the identification of risk scores based on glycosylation patterns has potential clinical implications and immune-related value for breast cancer.
Breast cancer has reached the highest incidence in women’s cancer types, and its lethality has reached second place, followed by lung cancer (Sung et al., 2021). As a heterogeneous disease, breast cancer’s multiple subtypes represent different histological origins, prognoses, and therapeutic sensitivity (Perou et al., 2000; Cancer Genome Atlas Network, 2012; Curtis et al., 2012; Marusyk et al., 2012). The pathological markers estrogen receptor (ER), progesterone receptor (PR), and human epidermal growth factor 2 (HER2) stratified patients with various treatment selecting, such as hormonal therapy (e.g., Tamoxifen) and HER2-targeted therapy (e.g., Trastuzumab) (Goldhirsch et al., 2013). Of note, HER2 is characterized by poor prognosis and has multiple sites of N-glycosylation, whose presence is linked with function (Peiris et al., 2017). Subsequently, intrinsic molecular subtyping based on expression profile highlights the intricate complexity of this cancer type and the importance of genomic/transcriptomic analyses for prognostic prediction. PAM50 utilizes a 50 genes system that classifies breast cancer into luminal A, luminal B, HER2-enriched, and basal-like subtype that involves not only diverse biological processes but also has prognostic significance (Prat et al., 2012; Prat et al., 2015). The highly heterogeneous of breast cancer requires a strong need for more specific biomarkers and broader alternatives for personalized treatment. Meanwhile, efforts to classify established histological subtypes have been carried out, which identified at least four distinct subtypes of ER-negative and six triple-negative subtypes (Teschendorff et al., 2007; Lehmann et al., 2011). According to recent reports, researchers are seeking a multi-angle classification approach to identify diversified functional clustering and signatures, such as glycolysis (Zhang et al., 2020a; Jiang et al., 2021), autophagy (Zhang et al., 2020b; Jiang et al., 2022), ferroptosis (Wang et al., 2021), stemness (Li et al., 2020), and immune microenvironment (Shen et al., 2020). All these attempts allow us to make more defined and precise characterizations based on new parameters to drive the heterogeneity landscape of breast cancer and put forward new ideas in prognostic prediction and treatment in the future.
Glycosylation is defined as a biosynthetic enzymatic process characterized by the covalent attachment of single sugar or glycans to a wide range of target proteins (Pinho and Reis, 2015; Eichler, 2019). As a post-translational modification, they play an essential role in almost all aspects of the life processes of cells, such as cell cycle, proliferation, and aging (Mallard and Tiralongo, 2017; Gudelj et al., 2018; Gao et al., 2021). The glycosylation pattern is profoundly altered during tumorigenesis. Among them, O-glycan truncation, sialylation, fucosylation, and N-glycan branching are common types of glycosylation in cancer (Drake et al., 2015; Kölbl et al., 2015; Kudelka et al., 2015; Taniguchi and Kizuka, 2015), leading to the occurrence of malignant phenotypes such as cell adhesion, metastasis, epithelial–mesenchymal transitioning, and even the shifting of the tumor microenvironment (Günthert et al., 1991; Rabinovich and Toscano, 2009; Pinho et al., 2011; Paredes et al., 2012; Pinho et al., 2013). Researchers have also identified glycosylation-related molecules as biomarkers for cancer diagnosis and prognostics evaluation. For instance, prostate-specific antigen (PSA) in prostate cancer (Gilgunn et al., 2013), carcinoma antigen 125 (CA125/MUC16) in ovarian cancer (Zurawski et al., 1988), CA19-9 and carcinoembryonic antigen (CEA) in colon cancer (Goldstein and Mitchell, 2005), and aberrantly glycosylated MUC1 (also known as CA15-3) in breast cancer (Kumpulainen et al., 2002). More recent studies have mapped the histopathological orientation and tissue distribution of N-linked glycans in clinical breast cancer tissues (Scott et al., 2019a; Scott et al., 2019b), which deepen the understanding of the heterogeneity of breast cancer from the perspective of glycosylation.
Our study classified breast cancer samples from The Cancer Genome Atlas (TCGA) into three groups based on glycosylation-associated genes and then identified differentially expressed genes under different glycosylation patterns to construct a prognostic model. Finally, a model containing 23 risk signatures was built and performed favorable predicting efficacy in training and testing cohorts, and the evaluation of immune infiltration and immunotherapy response were analyzed as well.
Figure 1 shows the workflow of our study. The TCGA column of Table 1. We classified TCGA-BRCA samples (n = 1,104) based on 179 glycosylation-related genes (GRGs) performed by consensus clustering analysis. Related clustering parameters are shown in Figures 2A–C, Supplementary Figure S1A, and Supplementary Figure S2A. Considering the complexity of grouping and the feasibility of subsequent analysis, we choose the optimal grouping when k = 3. Thus, we obtain three glycosylation-based clusters. We used t-SNE (Figure 2D) and PCA (Supplementary Figure S2B) dimensional reduction methods to observe that the samples had favorable overall differences under this grouping. Cluster 3 exhibited shorter overall survival (OS), indicating a poorer prognosis compared with clusters 1 and 2. (p < 0.05) (Figure 2E). In brief, this grouping method based on intracellular glycosylation status has specific differences in breast cancer samples and has substantial clinical value.
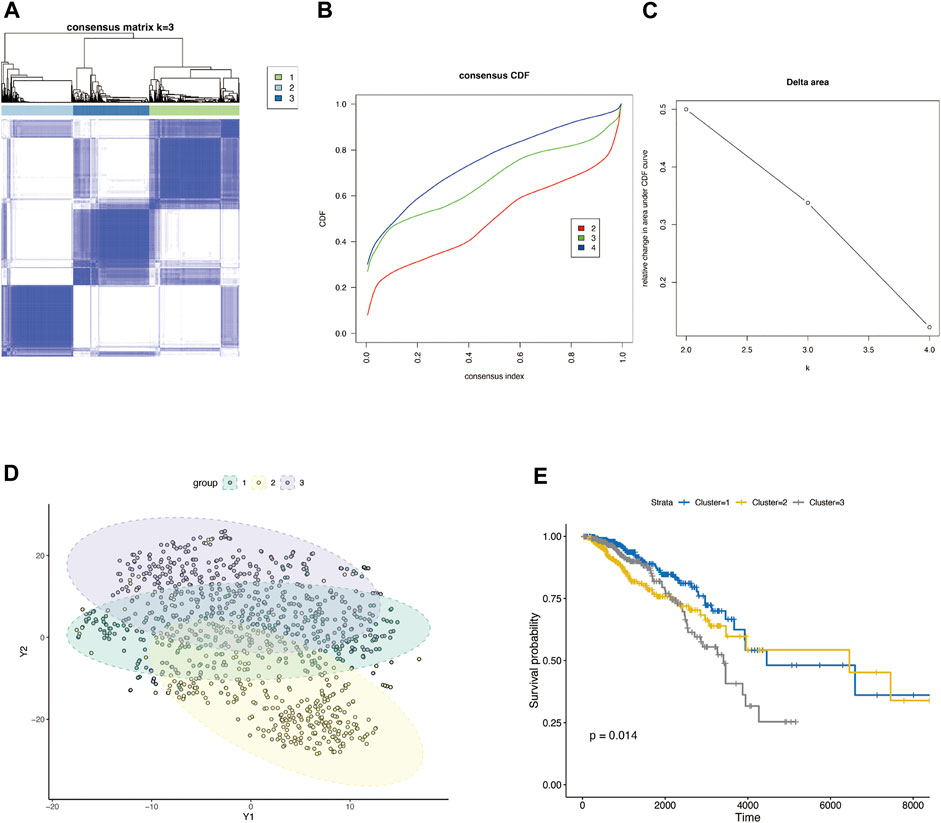
FIGURE 2. Consensus clustering classification of BRCA based on glycosylation-associated genes. (A) Optimal cluster distinction by consensus matrix (k = 3). (B) Empirical cumulative distribution function (CDF) plot displayed consensus distributions for each k. (C) Delta area plot. (D) T-SNE clustering of sample distributions based on glycosylation-related genes. (E) KM survival analysis of three glycosylation-based groups.
We classified BRCA tumor samples into three clusters based on glycosylation patterns. Next, we screened the DEGs of these three clusters using the “Deseq2” R package. Supplementary Figures S2C–E show the PCA map and DEGs heatmap between the three clusters. Figure 4 shows the differential analysis volcano plot of group 1 to group 2 (Figure 4A), group 2 to group 3 (Figure 4B), and group 1 to group 3 (Figure 4C). We made a Venn diagram for the three groups of differential genes to show their overlap (Figure 4D). The genes contained in each unit are shown in Supplementary Table S1, and the genes that show differences under one grouping are included in the next analysis. Finally, 1915 DEGs (Supplementary Table S1) were obtained and used to construct a prognostic risk-scoring model.
To explore the correlation between glycosylation patterns and immune characteristics, we analyzed the immune correlates of the three clusters. Figures 3B and C show significant differences in the immune score, stomal score, and immune cell infiltration. Cluster 3 demonstrated the lowest immune and stomal score and the poorest immune cell infiltration. Cluster 2 had the highest immune score and modest stomal score, and the immune cell infiltration was also the most abundant. Cluster 1 had the mediocre immune score and highest stomal score, and the immune cell infiltration was modest.
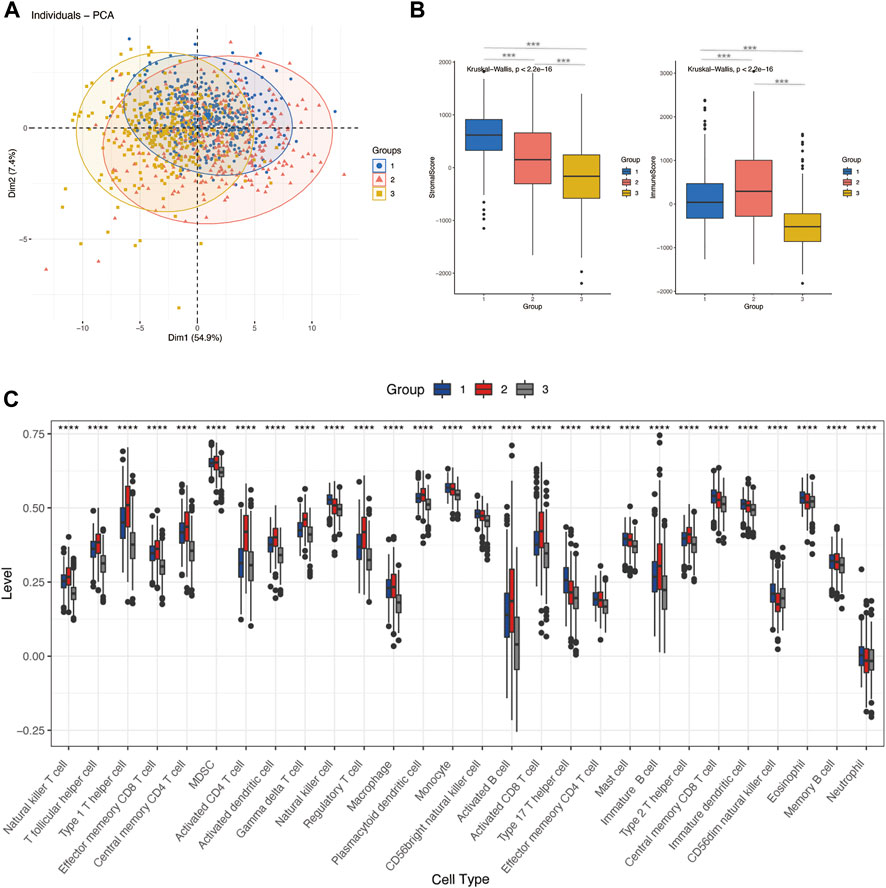
FIGURE 3. Differences in immune characteristics of glycosylation-based groups. (A) PCA clustering of sample distributions in immune signatures between three glycosylation-based groups. (B) Stomal score and the immune score of glycosylation-based groups (ESTIMATE algorithm). (C) Differences in 24 TME infiltration cells between glycosylation-based groups (ssGSEA) (****p < 0.0001).
To further construct a prognostic risk-scoring model without redundant genes, we used lasso regression to narrow down the range of candidate genes. According to mean-square error (Figure 4E) and coefficients (Figure 4F), we opted for the former λ as it results in a better prediction efficiency than the latter λ. Then, we fitted a multivariate Cox proportional hazard model to develop more valuable integrated molecules in the training set. Patients’ age, stage, and 23 genes were included in this model, with a concordance index of 0.87 (Log-rank P: 4.48e-43) (Figure 5A). Figure 5B arranged the sample from low to high according to the risk score. The proportion of deaths increased as risk scores rose. The 23 key molecule expression is also shown at the bottom. Its area under the ROC curve (AUC) in 1, 3, and 5 years prior to death was 0.89, 0.90, and 0.89, respectively (Figure 5C). Kaplan–Meier (KM) analysis showed a significant difference in overall survival (p < 0.0001) (Figure 5D).
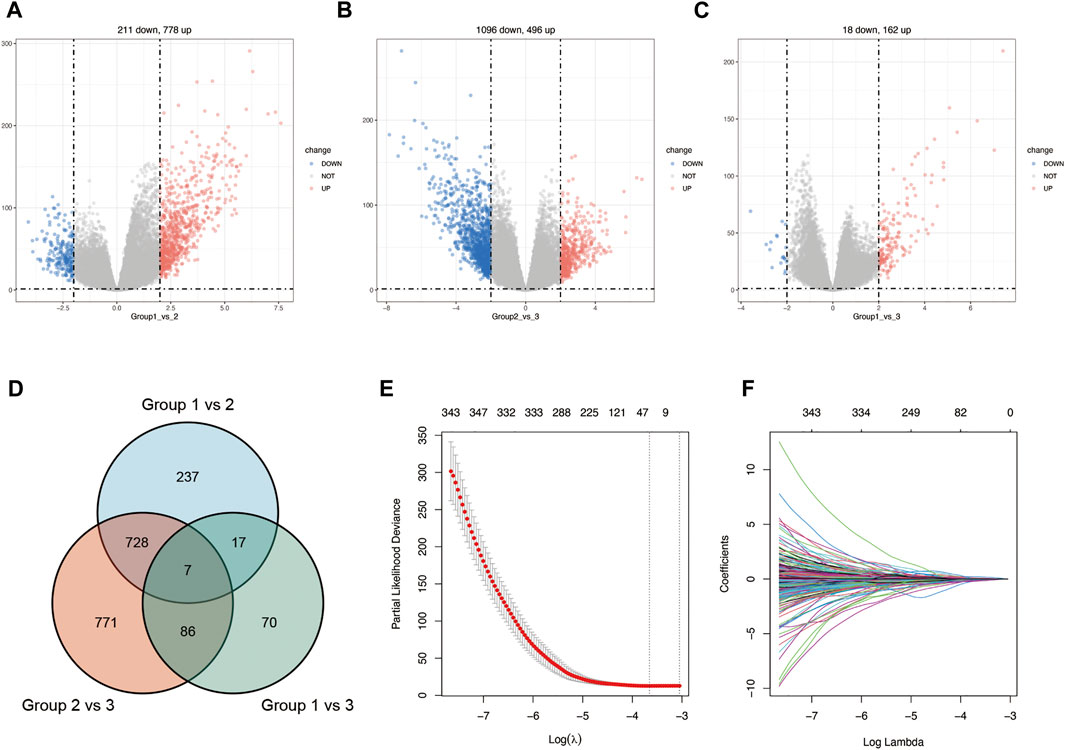
FIGURE 4. Construction of lasso regression model. Volcano plot of differentially expressed genes between cluster 1 vs. cluster 2 (A), cluster 2 vs. cluster 3 (B), and cluster 1 vs. cluster 3 (C) in BRCA. (D). Venn diagram of differentially expressed genes between glycosylation-based groups. (E). Cross-validation plot for the penalty term λ based on differentially expressed genes. Vertical bars represent acceptable maximum and minimum λ values with corresponding mean-squared error and the number of covariates. (F) Plots for lasso regression coefficients over different values of the penalty parameter λ.
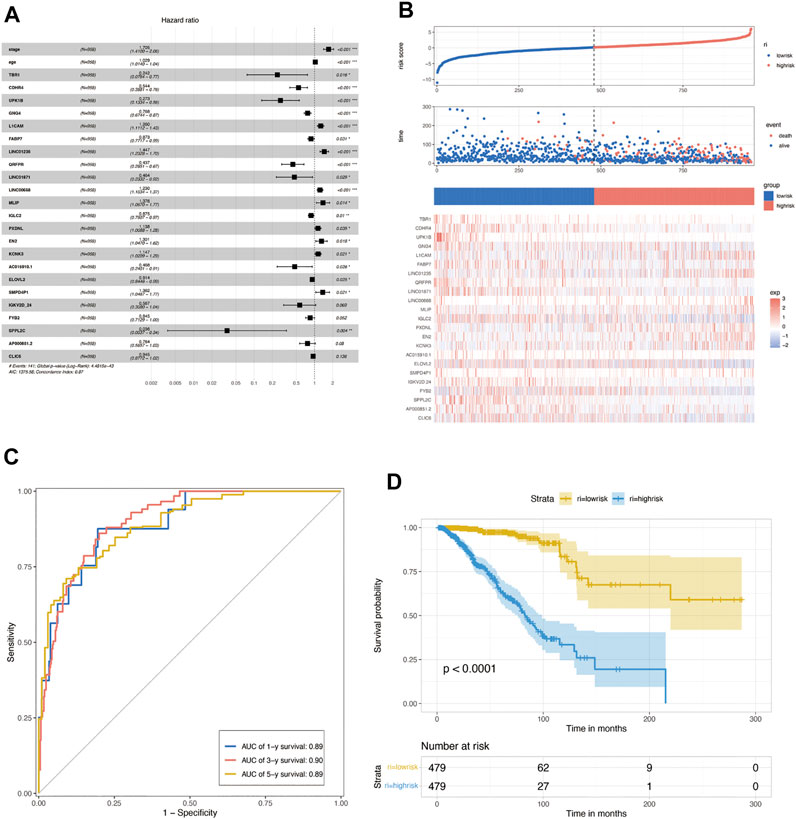
FIGURE 5. Construction of multivariate Cox regression. (A) Multivariate Cox proportional hazard model based on lasso de redundant gene set in the TCGA training set. (B) Proportion of deaths in the training set in high- and low-risk groups as risk score values increased. Top: red, high-risk; blue, low-risk. Middle: red, death; blue, alive. Bottom: hierarchical clustering of 14 key molecules between low- and high-risk groups. (C) COX risk score’s time-dependent ROC curves for 1, 3, and 5 years before death in the TCGA training set. In the training set, (D) Kaplan–Meier survival analyses for COX low- and high-risk groups. (p < 0.0001, log-rank test).
We choose two breast cancer cohorts from GEO to validate the efficacy of this protistic model. The GSE42582 column of Table 1. In GSE42568 cohort, AUC in 1, 3, and 5 years prior to death was 0.73, 0.82, and 0.88, respectively (Figure 6A), and KM analysis presents a significant difference (p < 0.0001) (Figure 6B). The GSE58812 column of Table 1. In GSE58812 cohort, AUC in 1, 3, and 5 years prior to death was 0.95, 0.77, and 0.79, respectively (Figure 6C), and KM analysis presents a significant difference (p = 6e-04) (Figure 6D).
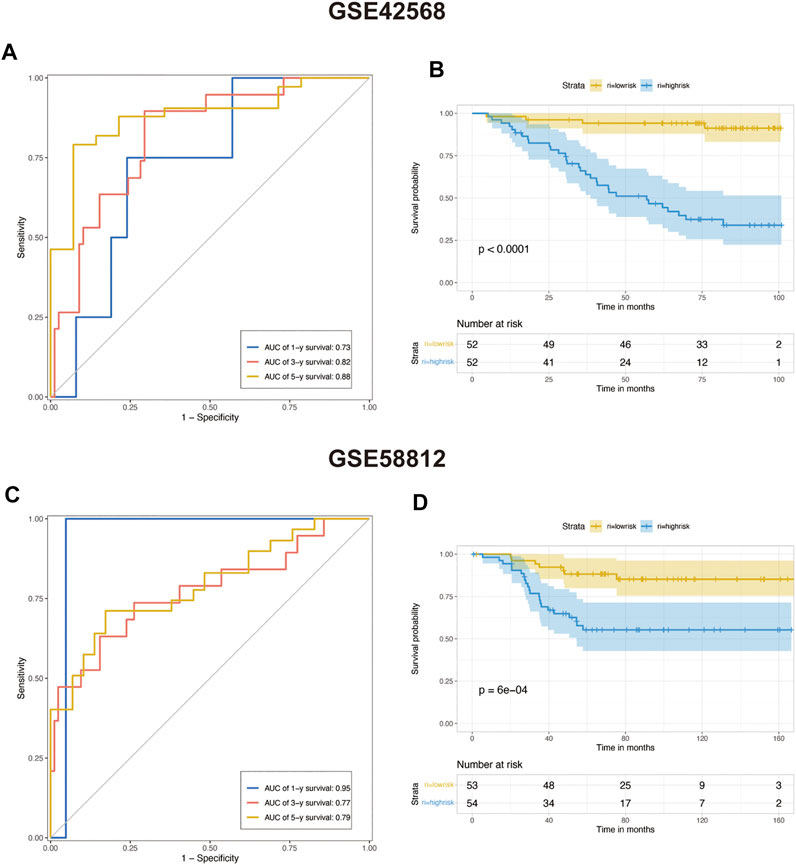
FIGURE 6. Predicting the efficacy of constructed multivariate Cox regression in the testing set. (A) COX risk score’s time-dependent ROC curves for 1, 3, and 5 years before death in testing cohort GSE42568. (B) Kaplan–Meier survival analyses for COX low- and high-risk groups in testing cohort GSE42568 (p < 0.0001, log-rank test). (C) COX risk score’s time-dependent ROC curves for 1, 3, and 5 years before death in testing cohort GSE58812. (D) Kaplan–Meier survival analyses for COX low- and high-risk groups in testing cohort GSE58812. (p < 0.0001, log-rank test).
We calculated a risk score for each sample according to the expression levels and regression coefficients and divided the BRCA cohort into low- and high-risk groups by median. To better investigate the interactions between the risk score and the immune microenvironment, we performed the ESTIMATE algorithm and ssGSEA to evaluate the correlation between the prognostic model and immune infiltrating in BRCA patients. Supplementary figure S3A shows PCA clustering of immune signatures. The low-risk group demonstrates a higher immune score but no difference in the stomal score (Supplementary figure S3B). In terms of immune cell infiltration (Figures 7B, 8C), the risk score was slightly negatively correlated with immune cell level. The low-risk group represents a more significant fraction of activated B cells, eosinophils, mast cells, activated CD8+ T cells, natural killer cells, and effector memory CD8+ T cells but no difference in neutrophils, T follicular helper T cells, type 2 T helper cells, and type 17 T helper cells. Then, we used TIDE, an online tool, to evaluate immune checkpoint blockade (ICB) response for our screened signatures based on the TCGA and PRECOG cohorts. According to Figure 9, the gene set we input obtained almost equivalent area under the curve (AUC) as other predicting scores, especially CD274, CD8, IFNG, and Merck 18.
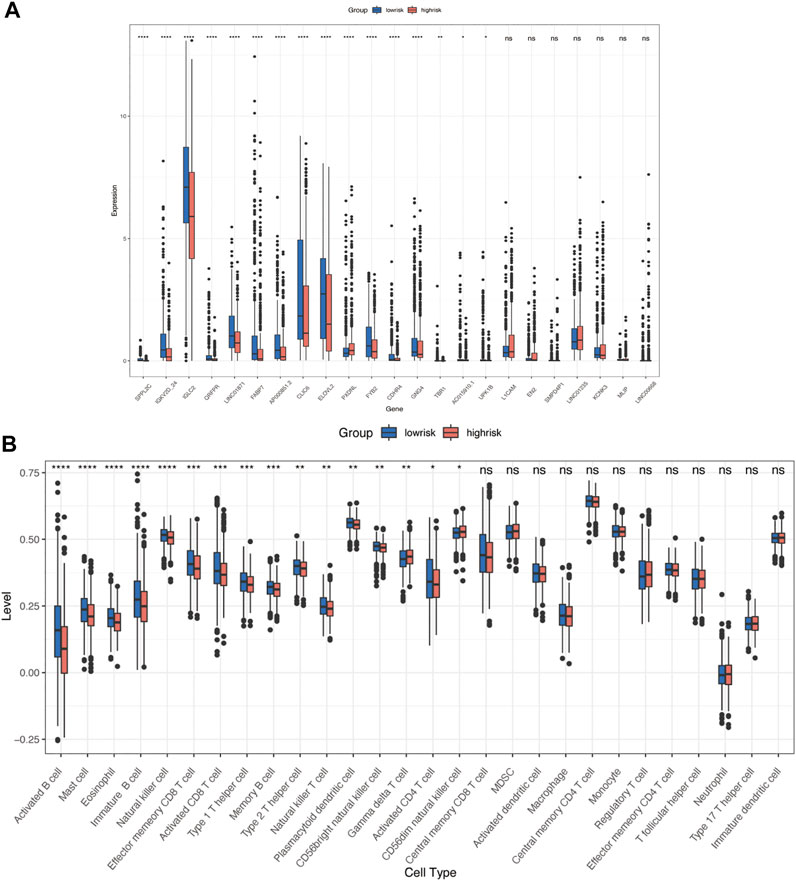
FIGURE 7. Immune characteristics in high- and low-risk groups. (A) Risk signatures expression in high- and low-risk groups. (B) Differences in 24 TME infiltration cells between high- and low-risk groups (ssGSEA) (*p < 0.05; **p < 0.01; ***p < 0.001, ****p < 0.0001).
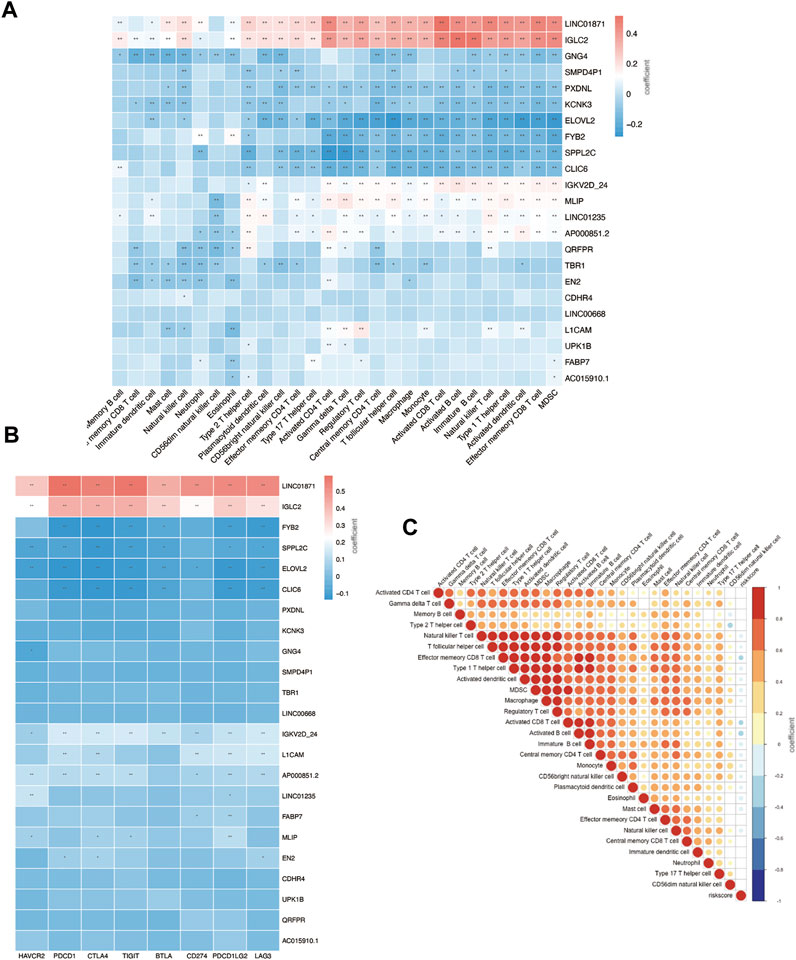
FIGURE 8. Immune infiltration status of prognostic signature. (A) Risk genes level in high- and low-risk groups. (B) Correlation between risk genes and checkpoint molecule expression. (C) Correlation between riskscore and immune infiltration.
We further investigated the correlation between 23 gene signatures and immune cell infiltration. Compared with the low-risk group, the high-risk group harbors a low level of SPPL2C, IGKV2D-24, IGLC2, QRFPR, LINC01871, FABP7, AP000851.2, CLIC6, ILOVL2, FYB2, CDHR4, GNG4, TBR1, AC015910.1, and UPK1B and a high level of PXDNL. (Figure 7A). LINC01871, IGLC2, IGKV2D-24, MLIP, LINC01235, and AP000851.2 positively correlated with immune cell infiltration, and GNG4, PXDNL, KCNK3, ELOVL2, FYB2, SPPL2C, CLIC6 negatively correlated with immune cell levels. The main types of immune cells with different infiltrating were activated CD4+ T cells, activated CD4+ T cells, natural killer T cells, activated B cells, activated dendritic cells, and MDSC. (Figure 8A). In addition, LINC01871 and IGLC2 positively correlated with immune checkpoint molecules such as PD-1, PDL1, CTLA4, TIGIT, LAG3, and BTLA and negatively correlated with HAVCR2. FYB2, SPPL2C, ELOVL2, CLIC6, IGKV2D-24, L1CAM, and AP000851.2 (Figure 8B).
The Breast Cancer (BRCA) data from The Cancer Genome Atlas Program (TCGA) was accessed via UCSC Xena (http://xena.ucsc.edu/). A total of 179 genes encoding glycosylation enzymes, targets, and regulators were obtained from previous literature (Krushkal et al., 2017) and are listed in Supplementary Table S1.
BRCA samples from TCGA were grouped into three clusters using the “ConsensusClusterPlus” (version1.60.0) R package (Wilkerson and Hayes, 2010) based on glycosylation-related genes (GRGs) (maxK = 4, innerLinkage = “complete”). “Fpkm” format was used for clustering analysis and “count” for difference analysis. Principal component analysis (PCA) and t-SNE were applied to assess sample clustering using the “FactoMineR” (version2.4) and Rtsne (version0.16) packages. “DESeq2” (version1.36.0) R package was used for screen differentially expressed genes (DEGs) between different clusters (|logFC| > 2, FDR <0.05).
First, the most minor absolute shrinkage and selection operator (LASSO) removed redundant genes achieved using the “glmnet” (version 4.1-4) R package. Ten-fold cross-validation was used to select the penalty term, λ. The mean-squared error was computed for the test data to measure the fitted models’ predictive performance. Then, 38 genes (Supplementary Table S1) were obtained for prognostic Cox regression construction using the “My.stepwise” (version 0.1.0) package to establish the optimal model. Finally, the 23 retained genes were used for calculating risk scores according to the following formula:
where
The single-sample gene-set enrichment analysis (ssGSEA) was used to establish the relative abundance of 24 cell infiltration, which was analyzed using the “GSVA” (version 1.44.2) package. The ESTIMATE algorithm calculated stomal scores and immune scores of high- versus low-risk groups and different GRGs-based clusters. Immune checkpoint blockade (ICB) predicting evaluation performed by biomarker evaluation module from TIDE (Tumor Immune Dysfunction and Exclusion: harvard.edu)">http://tide.dfci.harvard.edu/) (harvard.edu)), a computational method to model tumor immune evasion and ICB response and resistance regulators.
Immune Infiltrates differences of prognostic hub-genes were performed using ssGSEA, as mentioned earlier. Checkpoints correlation was analyzed using the ‘Hmisc’ (version 4.7-0) package. All the statistical significance sets as p < 0.05 with two-side. Data processing and visualization were performed using R version 4.1.2.
The role of glycocalyx–the extracellular carbohydrate coat, has been proposed in breast cancer occurrence and development since the 1950s (Aub et al., 1963). Then, it was noteworthy that plant lectin and carbohydrate motif binding proteins showed a higher affinity for malignant cells than normal cells in the 1960s (Remmele et al., 1986). By the 1980s, biochemists found that the enzyme-linked lectin binding assay could be used to predict tumor differentiation and therapeutic reactivity (Parodi et al., 1982). Shortly afterward, it was widely accepted that glycosylation status alteration could be used as biomarkers for breast cancer prognosis and tumor burden (Springer, 1997; Lin et al., 2002; Duffy et al., 2010). Given the heterogeneity of breast cancer, more recent studies have mapped the histopathological orientation and tissue distribution of glycosylated modifications in clinical breast cancer samples. So far, the influentially changed landscape of glycosylation processes in breast cancer is vividly portrayed.
We obtained a set of glycosylation-related genes containing 181 molecules from previous pieces of literature, including glycosylation pathways, genes encoding glycosylation targets or regulators, and members of cancer pathways affected by glycosylation (Supplementary Table S1) (Krushkal et al., 2017). In our study, TCGA-BRCA tumor samples were divided into three groups. We can consider three different glycosylated states based on these glycosylation-related genes by using consensus clustering analysis. There were significant differences in the expression patterns of glycosylated genes between them, and the survival analysis also reflected the difference in survival time under different glycosylated states (Figures 2D and E). It is well-documented that an altered “glycan coat” is a distinct hallmark of cancer.
Given that immune cells express a large variety of lectin (glycan-binding receptors), they recognize glycans on the tumor cell. Those immune cells can sense and respond to changes in the glycan signature of their environment. This often leads to tumor immune escape and immunomodulation. Therefore, the glycosylation-related signatures could affect tumor-immune cells’ connections within the tumor microenvironment (Rodríguez et al., 2018; Lopes et al., 2021). In addition, a variety of recruited stomal components–transformed parenchyma and the associated stroma–are involved in tumor progression and response to treatment (Arneth, 2019; Hanahan, 2022). We further analyzed the immune characteristics of glycosylation-based groups. According to our results, group 3 demonstrated the lowest immune and stomal score and the poorest immune cell infiltration; group 2 had the highest immune score and modest stomal score, and the immune cell infiltration was also the most abundant. This indicates that group 2 tends to the glycosylation pattern of immune cells, group 1 of stromal cells, and group 3 of malignant cells (Figures 3A–C). In combination with the survival analysis of Figure 2E, we were surprised to find that in terms of glycosylation pattern, the glycosylation mode of tumor cells and immune cells did not show any difference in patient survival, while the glycosylation of stromal cells may have a significant impact on patients’ survival. In future explorations of tumor microenvironment glycosylation, focusing on stromal cells may be a more effective research direction. These results prove that the classification based on glycosylation is meaningful and effective, which helps us to understand the heterogeneity of breast cancer from another perspective. However, at present, the classification samples are limited. Increasing the sample size will help formulate a more stable grouping method and hopefully be applied to clinical prognosis and prediction.
The change of glycosylation pattern in tumor cells and immune microenvironment will affect the expression of other critical genes and make their corresponding bioprocesses abnormal, thus, inducing the transformation of malignant phenotypes, such as proliferation, epithelial–mesenchymal transition, and apoptosis resistance. To identify the prognostic genes influenced by glycosylation processes, we screened the DEGs of these three groups and constructed a predictive risk model through lasso and Cox regression calculation. The final prognostic model containing 23 key molecules achieved exciting performance both in the TCGA training set and testing set GSE42568 and GSE58812 (Figures 5C and D, Figure 6). Using the model algorithm, we calculated a risk score and divided the sample into high- and low-risk groups by the median. This risk score also showed a significant difference in predicting overall clinical survival and immune infiltration (Figures 7B, 8C). Great achievement has been obtained in ICB-based immunotherapies (Chen et al., 2020). In order to obtain better clinical remission and fewer immune-related adverse events, researchers are committed to developing biomarkers to screen an effective population accurately. The reported measures that can be used to predict the efficacy of ICI therapy include immune cell infiltration (Cogdill et al., 2017), protein expressions such as PD-L1 (Teng et al., 2015), mutations and neoantigens (Mcgranahan et al., 2016), and genetic and epigenetic characteristics (Ascierto et al., 2012). On the TIDE prediction website, our gene set shows a favorable performance compared with the existing evaluation methods (Figure 9), which proves that our model has practical proficiency and value for further exploration and improvement in immunotherapy prediction.
Then, we move on to several single prognostic genes. LINC01871 significantly lower expression in the high-risk group and positively correlated with most of the immune cell infiltration (Figure 8). This suggests that LINC01871 may play a protective role in breast cancer. According to a recent review of the literature, LINC01871 has been identified by several studies in breast cancer through bioinformatic measurement involving the cellular phenotype of autophagy (Li et al., 2021; Wu et al., 2021; Jiang et al., 2022; Luo et al., 2022), stemness (Li et al., 2020), immune response (Ma et al., 2020; Mathias et al., 2021), ferroptosis (Xu et al., 2021), and lipid metabolism (Shi et al., 2022). IGLC2 has a similar expression and functional pattern to LINC01871 in our study (Figure 8). Chang et al. (2021) found in a study of triple-negative breast cancer (TNBC) cohort that a high expression of IGLC2 was related to a favorable prognosis for TNBC patients, which is consistent with our results. In addition, IGLC2 is linked with the proliferation, migration, and invasion of MDA-MB-231 cells. Pathway enrichment analysis showed that IGLC2 is related to the extracellular matrix–receptor interaction (Chang et al., 2021). All these features make IGLC2 have the potential to be a biomarker to predict prognosis, even for identifying breast cancer patients who can benefit the most from immune checkpoint blockade treatment. ELOVL2 is another prognostic signature in our results. Studies have shown that long noncoding RNA on its antisense chain (ELOVL2-AS1) correlates with breast cancer prognosis. The predictive efficacy of ELOVL2 needs to be verified in a larger sample size, and its mediated cell function also needs to be further explored.
The datasets presented in this study can be found in online repositories. The names of the repository/repositories and accession number(s) can be found in the article/Supplementary Material.
SG conceived the presented idea. XW developed the theory and performed the computations. XL undertook the visualization of results. WC encouraged SG and XW to investigate the tumor microenvironment and supervised the findings of this work. All authors discussed the results and contributed to the final manuscript.
The work was supported by CAMS Innovation Fund for Medical Sciences (CIFMS) 2021-I2M-1-014.
The authors thank Clarke C and Jézéquel P for submitting the dataset to Gene Expression Omnibus. The authors thank Dr. Jianming Zeng (University of Macau) and all the members of his bioinformatics team, Biotrainee, for generously sharing their experience and codes.
The authors declare that the research was conducted in the absence of any commercial or financial relationships that could be construed as a potential conflict of interest.
The reviewer XK declared a shared parent affiliation with authors SG, XL, and WC to the handling editor at the time of review.
All claims expressed in this article are solely those of the authors and do not necessarily represent those of their affiliated organizations, or those of the publisher, the editors, and the reviewers. Any product that may be evaluated in this article, or claim that may be made by its manufacturer, is not guaranteed or endorsed by the publisher.
The Supplementary Material for this article can be found online at: https://www.frontiersin.org/articles/10.3389/fgene.2022.960567/full#supplementary-material
Ascierto, M. L., Kmieciak, M., Idowu, M. O., Manjili, R., Zhao, Y., Grimes, M., et al. (2012). A signature of immune function genes associated with recurrence-free survival in breast cancer patients. Breast Cancer Res. Treat. 131 (3), 871–880. doi:10.1007/s10549-011-1470-x
Aub, J. C., Tieslau, C., and Lankester, A. (1963). Reactions of normal and tumor cell surfaces to enzymes. I. Wheat-germ lipase and associated mucopolysaccharides[J]. Proc. Natl. Acad. Sci. U. S. A. 50 (4), 613–619. doi:10.1073/pnas.50.4.613
Cancer Genome Atlas Network (2012). Comprehensive molecular portraits of human breast tumours[J]. Nature 490 (7418), 61–70. doi:10.1038/nature11412
Chang, Y. T., Tsai, W. C., Lin, W. Z., Wu, C. C., Yu, J. C., Tseng, V. S., et al. (2021). A novel IGLC2 gene linked with prognosis of triple-negative breast cancer. Front. Oncol. 11, 759952. doi:10.3389/fonc.2021.759952
Chen, X., Pan, X., Zhang, W., Guo, H., Cheng, S., He, Q., et al. (2020). Epigenetic strategies synergize with PD-L1/PD-1 targeted cancer immunotherapies to enhance antitumor responses. Acta Pharm. Sin. B 10 (5), 723–733. doi:10.1016/j.apsb.2019.09.006
Cogdill, A. P., Andrews, M. C., and Wargo, J. A. (2017). Hallmarks of response to immune checkpoint blockade. Br. J. Cancer 117 (1), 1–7. doi:10.1038/bjc.2017.136
Curtis, C., Shah, S. P., Chin, S. F., Turashvili, G., Rueda, O. M., Dunning, M. J., et al. (2012). The genomic and transcriptomic architecture of 2, 000 breast tumours reveals novel subgroups. Nature 486 (7403), 346–352. doi:10.1038/nature10983
Drake, R. R., Jones, E. E., Powers, T. W., and Nyalwidhe, J. O. (2015). Altered glycosylation in prostate cancer. Adv. Cancer Res. 126, 345–382. doi:10.1016/bs.acr.2014.12.001
Duffy, M. J., Evoy, D., and Mcdermott, E. W. (2010). CA 15-3: Uses and limitation as a biomarker for breast cancer. Clin. Chim. Acta. 411 (23-24), 1869–1874. doi:10.1016/j.cca.2010.08.039
Eichler, J. (2019). Protein glycosylation. Curr. Biol. 29 (7), R229–r231. doi:10.1016/j.cub.2019.01.003
Gao, Y., Luan, X., Melamed, J., and Brockhausen, I. (2021). Role of glycans on key cell surface receptors that regulate cell proliferation and cell death. Cells 10 (5), 1252. doi:10.3390/cells10051252
Gilgunn, S., Conroy, P. J., Saldova, R., Rudd, P. M., and O'Kennedy, R. J. (2013). Aberrant PSA glycosylationa sweet predictor of prostate cancer. Nat. Rev. Urol. 10 (2), 99–107. doi:10.1038/nrurol.2012.258
Goldhirsch, A., Winer, E. P., Coates, A. S., Gelber, R. D., Piccart-Gebhart, M., Thurlimann, B., et al. (2013). Personalizing the treatment of women with early breast cancer: Highlights of the st gallen international expert consensus on the primary therapy of early breast cancer 2013. Ann. Oncol. 24 (9), 2206–2223. doi:10.1093/annonc/mdt303
Goldstein, M. J., and Mitchell, E. P. (2005). Carcinoembryonic antigen in the staging and follow-up of patients with colorectal cancer. Cancer Invest. 23 (4), 338–351. doi:10.1081/cnv-58878
Gudelj, I., Lauc, G., and Pezer, M. (2018). Immunoglobulin G glycosylation in aging and diseases. Cell. Immunol. 333, 65–79. doi:10.1016/j.cellimm.2018.07.009
Günthert, U., Hofmann, M., Rudy, W., Reber, S., Zoller, M., Haussmann, I., et al. (1991). A new variant of glycoprotein CD44 confers metastatic potential to rat carcinoma cells. Cell 65 (1), 13–24. doi:10.1016/0092-8674(91)90403-l
Hanahan, D. (2022). Hallmarks of cancer: New dimensions. Cancer Discov. 12 (1), 31–46. doi:10.1158/2159-8290.CD-21-1059
Jiang, F., Wu, C., Wang, M., Wei, K., and Wang, J. (2022). An autophagy-related long non-coding RNA signature for breast cancer. Comb. Chem. High. Throughput Screen. 25 (8), 1327–1335. doi:10.2174/1386207324666210603122718
Jiang, F., Wu, C., Wang, M., Wei, K., and Wang, J. (2021). Identification of novel cell glycolysis related gene signature predicting survival in patients with breast cancer. Sci. Rep. 11 (1), 3986. doi:10.1038/s41598-021-83628-9
Kölbl, A. C., Andergassen, U., and Jeschke, U. (2015). The role of glycosylation in breast cancer metastasis and cancer control. Front. Oncol. 5, 219. doi:10.3389/fonc.2015.00219
Krushkal, J., Zhao, Y., Hose, C., Monks, A., Doroshow, J. H., and Simon, R. (2017). Longitudinal transcriptional response of glycosylation-related genes, regulators, and targets in cancer cell lines treated with 11 antitumor agents. Cancer Inf. 16, 1176935117747259. doi:10.1177/1176935117747259
Kudelka, M. R., Ju, T., Heimburg-Molinaro, J., and Cummings, R. D. (2015). Simple sugars to complex diseasemucin-type O-glycans in cancer. Adv. Cancer Res. 126, 53–135. doi:10.1016/bs.acr.2014.11.002
Kumpulainen, E. J., Keskikuru, R. J., and Johansson, R. T. (2002). Serum tumor marker CA 15.3 and stage are the two most powerful predictors of survival in primary breast cancer. Breast Cancer Res. Treat. 76 (2), 95–102. doi:10.1023/a:1020514925143
Lehmann, B. D., Bauer, J. A., Chen, X., Sanders, M. E., Chakravarthy, A. B., Shyr, Y., et al. (2011). Identification of human triple-negative breast cancer subtypes and preclinical models for selection of targeted therapies. J. Clin. Invest. 121 (7), 2750–2767. doi:10.1172/JCI45014
Li, X., Jin, F., and Li, Y. (2021). A novel autophagy related lncRNA prognostic risk model for breast cancer. J. Cell. Mol. Med. 25 (1), 4–14. doi:10.1111/jcmm.15980
Li, X., Li, Y., Yu, X., and Jin, F. (2020). Identification and validation of stemness-related lncRNA prognostic signature for breast cancer. J. Transl. Med. 18 (1), 331. doi:10.1186/s12967-020-02497-4
Lin, S., Kemmner, W., Grigull, S., and Schlag, P. M. (2002). Cell surface alpha 2, 6 sialylation affects adhesion of breast carcinoma cells. Exp. Cell Res. 276 (1), 101–110. doi:10.1006/excr.2002.5521
Lopes, N., Correia, V. G., Palma, A. S., and Brito, C. (2021). Cracking the breast cancer glyco-code through glycan-lectin interactions: Targeting immunosuppressive macrophages. Int. J. Mol. Sci. 22 (4), 1972. doi:10.3390/ijms22041972
Luo, Z., Nong, B., Ma, Y., and Fang, D. (2022). Autophagy related long non-coding RNA and breast cancer prognosis analysis and prognostic risk model establishment. Ann. Transl. Med. 10 (2), 58. doi:10.21037/atm-21-6251
Ma, W., Zhao, F., Yu, X., Guan, S., Suo, H., Tao, Z., et al. (2020). Immune-related lncRNAs as predictors of survival in breast cancer: A prognostic signature. J. Transl. Med. 18 (1), 442. doi:10.1186/s12967-020-02522-6
Mallard, B. W., and Tiralongo, J. (2017). Cancer stem cell marker glycosylation: Nature, function and significance. Glycoconj. J. 34 (4), 441–452. doi:10.1007/s10719-017-9780-9
Marusyk, A., Almendro, V., and Polyak, K. (2012). Intra-tumour heterogeneity: A looking glass for cancer?[J]. Nat. Rev. Cancer 12 (5), 323–334. doi:10.1038/nrc3261
Mathias, C., Muzzi, J. C. D., Antunes, B. B., Gradia, D. F., Castro, M. A. A., and Carvalho de Oliveira, J. (2021). Unraveling immune-related lncRNAs in breast cancer molecular subtypes. Front. Oncol. 11, 692170. doi:10.3389/fonc.2021.692170
Mcgranahan, N., Furness, A. J., Rosenthal, R., Ramskov, S., Lyngaa, R., Saini, S. K., et al. (2016). Clonal neoantigens elicit T cell immunoreactivity and sensitivity to immune checkpoint blockade. Science 351 (6280), 1463–1469. doi:10.1126/science.aaf1490
Paredes, J., Figueiredo, J., Albergaria, A., Oliveira, P., Carvalho, J., Ribeiro, A. S., et al. (2012). Epithelial E- and P-cadherins: Role and clinical significance in cancer. Biochim. Biophys. Acta 1826 (2), 297–311. doi:10.1016/j.bbcan.2012.05.002
Parodi, A. J., Blank, E. W., Peterson, J. A., and Ceriani, R. L. (1982). Dolichol-bound oligosaccharides and the transfer of distal monosaccharides in the synthesis of glycoproteins by normal and tumor mammary epithelial cells. Breast Cancer Res. Treat. 2 (3), 227–237. doi:10.1007/BF01806935
Peiris, D., Spector, A. F., Lomax-Browne, H., Azimi, T., Ramesh, B., Loizidou, M., et al. (2017). Cellular glycosylation affects Herceptin binding and sensitivity of breast cancer cells to doxorubicin and growth factors. Sci. Rep. 7, 43006. doi:10.1038/srep43006
Perou, C. M., Sørlie, T., Eisen, M. B., van de RijnM., , Jeffrey, S. S., Rees, C. A., et al. (2000). Molecular portraits of human breast tumours. Nature 406 (6797), 747–752. doi:10.1038/35021093
Pinho, S. S., Figueiredo, J., Cabral, J., Carvalho, S., Dourado, J., Magalhaes, A., et al. (2013). E-Cadherin and adherens-junctions stability in gastric carcinoma: Functional implications of glycosyltransferases involving N-glycan branching biosynthesis, N-acetylglucosaminyltransferases III and V. Biochim. Biophys. Acta 1830 (3), 2690–2700. doi:10.1016/j.bbagen.2012.10.021
Pinho, S. S., and Reis, C. A. (2015). Glycosylation in cancer: Mechanisms and clinical implications. Nat. Rev. Cancer 15 (9), 540–555. doi:10.1038/nrc3982
Pinho, S. S., Seruca, R., Gärtner, F., Yamaguchi, Y., Gu, J., Taniguchi, N., et al. (2011). Modulation of E-cadherin function and dysfunction by N-glycosylation. Cell. Mol. Life Sci. 68 (6), 1011–1020. doi:10.1007/s00018-010-0595-0
Prat, A., Parker, J. S., Fan, C., and Perou, C. M. (2012). PAM50 assay and the three-gene model for identifying the major and clinically relevant molecular subtypes of breast cancer. Breast Cancer Res. Treat. 135 (1), 301–306. doi:10.1007/s10549-012-2143-0
Prat, A., Pineda, E., Adamo, B., Galvan, P., Fernandez, A., Gaba, L., et al. (2015). Clinical implications of the intrinsic molecular subtypes of breast cancer. Breast 24 (2), S26–S35. doi:10.1016/j.breast.2015.07.008
Rabinovich, G. A., and Toscano, M. A. (2009). Turning 'sweet' on immunity: Galectin-glycan interactions in immune tolerance and inflammation. Nat. Rev. Immunol. 9 (5), 338–352. doi:10.1038/nri2536
Remmele, W., Hildebrand, U., Hienz, H. A., VierbuchenM., , Behnken, L. J., et al. (1986). Comparative histological, histochemical, immunohistochemical and biochemical studies on oestrogen receptors, lectin receptors, and Barr bodies in human breast cancer. Virchows Arch. A Pathol. Anat. Histopathol. 409 (2), 127–147. doi:10.1007/BF00708323
Rodríguez, E., Schetters, S. T. T., and Van Kooyk, Y. (2018). The tumour glyco-code as a novel immune checkpoint for immunotherapy. Nat. Rev. Immunol. 18 (3), 204–211. doi:10.1038/nri.2018.3
Scott, D. A., Casadonte, R., Cardinali, B., Spruill, L., Mehta, A. S., Carli, F., et al. (2019a). Increases in tumor N-glycan polylactosamines associated with advanced HER2-positive and triple-negative breast cancer tissues. Proteomics. Clin. Appl. 13 (1), e1800014. doi:10.1002/prca.201800014
Scott, D. A., Norris-Caneda, K., Spruill, L., Bruner, E., Kono, Y., Angel, P. M., et al. (2019b). Specific N-linked glycosylation patterns in areas of necrosis in tumor tissues. Int. J. Mass Spectrom. 437, 69–76. doi:10.1016/j.ijms.2018.01.002
Shen, Y., Peng, X., and Shen, C. (2020). Identification and validation of immune-related lncRNA prognostic signature for breast cancer. Genomics 112 (3), 2640–2646. doi:10.1016/j.ygeno.2020.02.015
Shi, G. J., Zhou, Q., Zhu, Q., Wang, L., and Jiang, G. Q. (2022). A novel prognostic model associated with the overall survival in patients with breast cancer based on lipid metabolism-related long noncoding RNAs. J. Clin. Lab. Anal. 36, e24384. doi:10.1002/jcla.24384
Springer, G. F. (1997). Immunoreactive T and Tn epitopes in cancer diagnosis, prognosis, and immunotherapy. J. Mol. Med. 75 (8), 594–602. doi:10.1007/s001090050144
Sung, H., Ferlay, J., Siegel, R. L., Laversanne, M., Soerjomataram, I., Jemal, A., et al. (2021). Global cancer statistics 2020: GLOBOCAN estimates of incidence and mortality worldwide for 36 cancers in 185 countries. Ca. Cancer J. Clin. 71 (3), 209–249. doi:10.3322/caac.21660
Taniguchi, N., and Kizuka, Y. (2015). Glycans and cancer: Role of N-glycans in cancer biomarker, progression and metastasis, and therapeutics. Adv. Cancer Res. 126, 11–51. doi:10.1016/bs.acr.2014.11.001
Teng, M. W., Ngiow, S. F., Ribas, A., and Smyth, M. J. (2015). Classifying cancers based on T-cell infiltration and PD-L1. Cancer Res. 75 (11), 2139–2145. doi:10.1158/0008-5472.CAN-15-0255
Teschendorff, A. E., Miremadi, A., Pinder, S. E., Ellis, I. O., and Caldas, C. (2007). An immune response gene expression module identifies a good prognosis subtype in estrogen receptor negative breast cancer. Genome Biol. 8 (8), R157. doi:10.1186/gb-2007-8-8-r157
Wang, D., Wei, G., Ma, J., Cheng, S., Jia, L., Song, X., et al. (2021). Identification of the prognostic value of ferroptosis-related gene signature in breast cancer patients. BMC Cancer 21 (1), 645. doi:10.1186/s12885-021-08341-2
Wilkerson, M. D., and Hayes, D. N. (2010). ConsensusClusterPlus: A class discovery tool with confidence assessments and item tracking. Bioinformatics 26 (12), 1572–1573. doi:10.1093/bioinformatics/btq170
Wu, Q., Li, Q., Zhu, W., Zhang, X., and Li, H. (2021). Identification of autophagy-related long non-coding RNA prognostic signature for breast cancer. J. Cell. Mol. Med. 25 (8), 4088–4098. doi:10.1111/jcmm.16378
Xu, Z., Jiang, S., Ma, J., Tang, D., Yan, C., and Fang, K. (2021). Comprehensive analysis of ferroptosis-related LncRNAs in breast cancer patients reveals prognostic value and relationship with tumor immune microenvironment. Front. Surg. 8, 742360. doi:10.3389/fsurg.2021.742360
Zhang, D., Zheng, Y., Yang, S., Li, Y., Wang, M., Yao, J., et al. (2020). Identification of a novel glycolysis-related gene signature for predicting breast cancer survival. Front. Oncol. 10, 596087. doi:10.3389/fonc.2020.596087
Zhang, R., Zhu, Q., Yin, D., Yang, Z., Guo, J., Zhang, J., et al. (2020). Identification and validation of an autophagy-related lncRNA signature for Patients with breast cancer. Front. Oncol. 10, 597569. doi:10.3389/fonc.2020.597569
Keywords: breast cancer, glycosylation, prognosis, subtype, biomarkers, immune
Citation: Gao S, Wu X, Lou X and Cui W (2022) Identification of a prognostic risk-scoring model and risk signatures based on glycosylation-associated cluster in breast cancer. Front. Genet. 13:960567. doi: 10.3389/fgene.2022.960567
Received: 03 June 2022; Accepted: 24 August 2022;
Published: 20 October 2022.
Edited by:
Geng Chen, Stemirna Therapeutics Co., Ltd., ChinaReviewed by:
Feng Jiang, Fudan University, ChinaCopyright © 2022 Gao, Wu, Lou and Cui. This is an open-access article distributed under the terms of the Creative Commons Attribution License (CC BY). The use, distribution or reproduction in other forums is permitted, provided the original author(s) and the copyright owner(s) are credited and that the original publication in this journal is cited, in accordance with accepted academic practice. No use, distribution or reproduction is permitted which does not comply with these terms.
*Correspondence: Wei Cui, Y3VpMTIzQGNpY2Ftcy5hYy5jbg==
†These authors have contributed equally to this work and share first authorship
Disclaimer: All claims expressed in this article are solely those of the authors and do not necessarily represent those of their affiliated organizations, or those of the publisher, the editors and the reviewers. Any product that may be evaluated in this article or claim that may be made by its manufacturer is not guaranteed or endorsed by the publisher.
Research integrity at Frontiers

Learn more about the work of our research integrity team to safeguard the quality of each article we publish.