 Hui Zhong1Yaxian Sun1Huihui Wu2Shengnan Li1Zhongyuan Shen1Conghui Yang1Ming Wen1Peng Chen3
 Qianhong Gu1,2*
- 1The State Key Laboratory of Developmental Biology of Freshwater Fish, College of Life Sciences, Hunan Normal University, Changsha, China
- 2College of Fisheries, Engineering Technology Research Center of Henan Province for Aquatic Animal Cultivation, Henan Normal University, Xinxiang, China
- 3Xinjiang Uygur Autonomous Region Fishery Research Institute, Urumchi, China
Montane systems provide excellent opportunities to study the rapid radiation influenced by geological and climatic processes. We assessed the role of Pleistocene climatic oscillations and mountain building on the evolution history of Triplophysa robusta, a cold-adapted species restricted to high elevations in China. We found seven differentiated sublineages of T. robusta, which were established during the Mid Pleistocene 0.87–0.61 Mya. The species distribution modeling (SDM) showed an expansion of T. robusta during the Last Glacial Maximum (LGM) and a considerable retraction during the Last Interglacial (LIG). The deep divergence between Clade I distributed in Qinling Mountains and Clade II in Northeastern Qinghai-Tibet Plateau (QTP) was mainly the result of a vicariance event caused by the rapid uplifting of Qinling Mountains during the Early Pleistocene. While the middling to high level of historical gene flow among different sublineages could be attributed to the dispersal events connected to the repetition of the glacial period during the Pleistocene. Our findings suggested that frequent range expansions and regressions due to Pleistocene glaciers likely have been crucial for driving the phylogeographic pattern of T. robusta. Finally, we urge a burning question in future conservation projection on the vulnerable cold-adapted species endemic to high elevations, as they would be negatively impacted by the recent rapid climate warming.
1 Introduction
The process of population isolation and differentiation, the core of micro-evolution, is one of the crucial steps for deciphering speciation, which has long fascinated evolutionary biologists (Rice and Hostert, 1993; Wang et al., 2021). The Earth’s complex topographical history often generates opportunities for population isolation and differentiation (Yan et al., 2010; Hou et al., 2014; Wang et al., 2021), especially for montane species. Mountain-building is often associated with tectonic forces, promoting population divergence through vicariance (Hoorn et al., 2010; Smith et al., 2014; Simões et al., 2016; Schramm et al., 2021). However, previous studies suggested that mountain building might not be regarded as the sole driver in the diversification of montane species (Kong et al., 2022). Climate change is also considered a major driver of vicariant speciation and intraspecific divergence and animal radiations (Wang et al., 2012; de Oliveira et al., 2021). Particularly, climatic changes associated with Pleistocene glacial cycles are believed to have caused montane species to shift, expand, or contract along latitudinal or elevational gradients (Wang et al., 2012). Populations adapted to different mountains may have experienced isolations due to the range contractions, or may have experienced connectivity as a result of range expansions following climate fluctuations and geological activity.
The drastic uplift of the Qinghai-Tibet Plateau (QTP) and the resulting Asian monsoons largely reshaped the landscape of local and adjacent regions (Clark et al., 2005; Zhang et al., 2012). For example, the Northeastward growth of the Tibetan Plateau since the late Cenozoic and the Northern Qinling Mountains have been strongly reactivated and uplifted. The Qinling Mountains rapidly uplifted during the Miocene-Quaternary (Dong et al., 2011; Liu et al., 2013; Meng, 2017), and extended more than 1,500 km from West to East in Central China. The diverse topography and varied habitats in Qinling Mountains come into being a biogeographical barrier for wild species (Yan et al., 2010; Huang et al., 2017; Wang et al., 2021). Both the Northeastern QTP and Qinling Mountains are important regions for the evolution of biota (Wang et al., 2012; Feng et al., 2019).
Triplophysa are endemic species in QTP and its adjacent area. It is believed that the origin and evolution of Triplophysa are related to the uplift of the QTP (Wang et al., 2016; Li et al., 2017). This group has been one major component of fish fauna on the QTP and the adjacent area and has evolved specific morphological and physiological adaptations to the low oxygen, low pressure, and cold conditions of the plateau (Wu et al., 2020). T. robusta is endemic to the Upper Yellow River and the upper reaches of the Jialing River (Feng et al., 2019). However, it was reported that T. robusta could be found in the upper reaches of the Yihe River and Luohe River, distributed in the Qinling Mountains, as well as the montane streams in the Southern Taihang Mountains (Wu et al., 2020). Therefore, T. robusta represents an ideal model to address the effects of past climatic and geological events on the intraspecific diversification among populations adjacent to and distant from QTP. Hence we used mitochondrial and nuclear genes to estimate the phylogeographic pattern and evolutionary history of T. robusta, and to evaluate the conservation status and strategy of this species.
2 Materials and methods
2.1 Samples and sequence data preparation
Ten populations of T. robusta in the Eastern Qinling Mountains and four populations in the Southern Taihang Mountains (Figure 1; Table 1) were collected in 2017 and 2018. The genomic DNA was extracted and the nuclear genes rhodopsin (RH1) was amplified following Feng et al. (2019). We sequenced 42 novel RH1 genes with three individuals in each population, and they have been deposited in GenBank (accession number, ON630917-ON630958). Three mitochondrial genes (16S rRNA, 16S; cytochrome b, cytb, cytochrome oxidase I, COI, Supplementary Table S1) were obtained from previous studies (Feng et al., 2019; Wu et al., 2020). A total of 237 individuals from 28 localities across the major distribution of T. robusta were collected in China (Figure 1; Table 1). Besides, another 122 RH1 sequences were also retrieved from the previous study (Feng et al., 2019), and a total of 164 RH1 sequences were used to investigate the populations’ relationship among the Northeastern QTP, the Eastern Qinling Mountains, and the Southern Taihang Mountains.
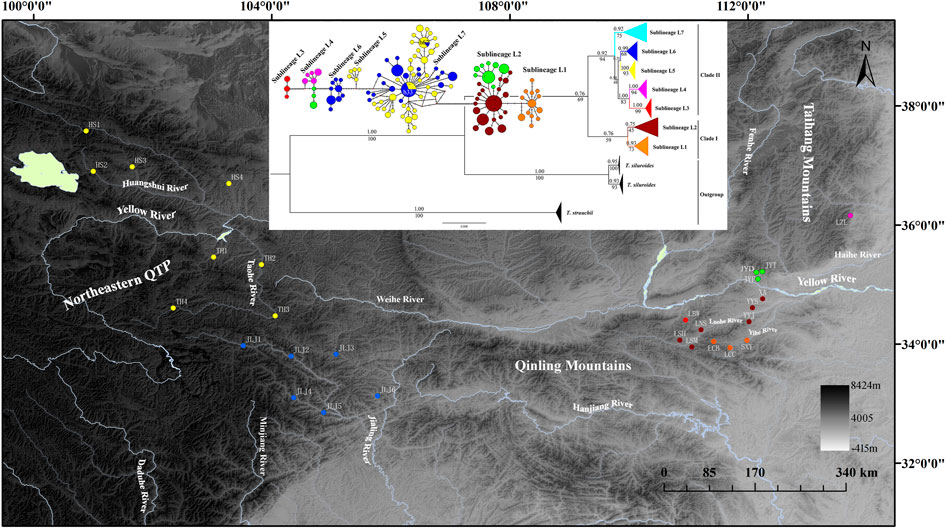
FIGURE 1. Map of sampling locations of T. robusta, localities are detailed in Table 1 according to Wu et al. (2020) and Feng et al. (2019), and the phylogenetic tree based on Bayesian inference (values on branches indicate bootstrap proportions from a maximum likelihood analysis and bayesian posterior probabilities), and the median-joining haplotype network based on 235 cytb sequences, the size of the circles represents haplotype frequency. Each connecting line represents a single nucleotide substitution, and each little short line represents a mutated position. Different river systems were represented in different colors, consistent with the colors of the haplotype.
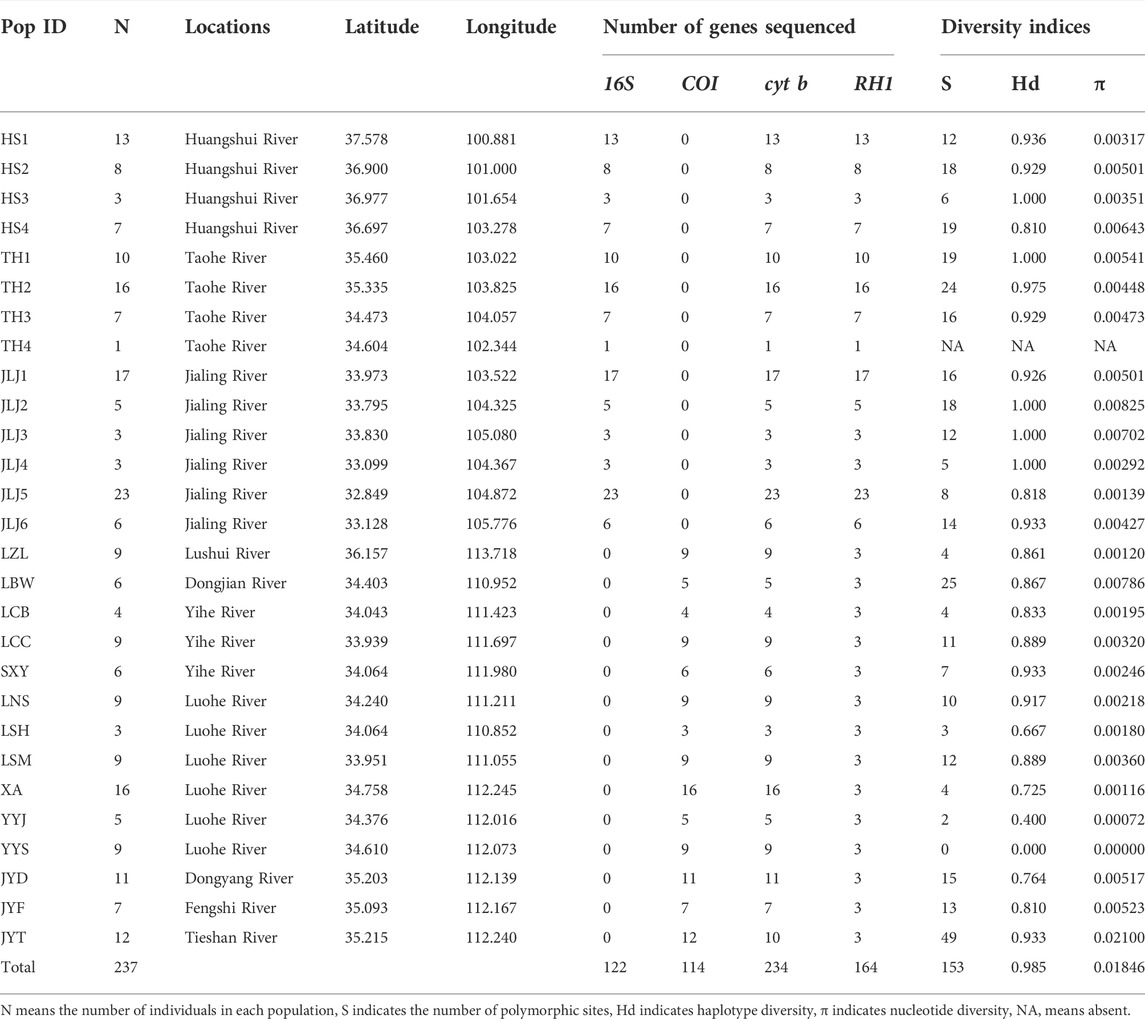
TABLE 1. Detailed information for specimens included in this study and diversity indices for each population based on cytb.
2.2 Phylogenetic analysis
All sequences were aligned by using MAFFT implemented in PhyloSuite v1.2.2. We tested the homogeneity of the combined genes (COI + cytb + 16S + RH1) in *PAUP and the p-value was 0.074 (>0.05). Consequently, the aligned nucleotide sequences cytb, COI, 16S, and RH1 were concatenated to construct the phylogenetic tree by using the maximum likelihood (ML) method implemented in RAxML v8.2.4 with 1,000 bootstrap replicates. Each gene was treated as unlinked since it is not required to have the same individuals analyzed for every genetic marker if partitions are considered as unlinked (Sota and Vogler, 2001; Husemann et al., 2013; Gu et al., 2022). Bayesian inferences (BI) analysis was performed in MrBayes v3.2.6 using the Markov Chain Monte Carlo method with 10 million generations and sampling trees every 1,000 generations. The first 25% of trees were discarded as burn-in with the remaining trees being used for generating a consensus tree. The species of Triplophysa siluroides and Triplophysa strauchii (Supplementary Table S1) were used as outgroups. The final trees were visualized in FIGTREE v1.4.4.
To further visualize haplotype diversity and distribution of T. robusta, we generated a haplotype network using 235 cytb sequences and colored each haplotype by the geographic region from which river system it was collected (Table 1). The haplotype networks were constructed using network v. 10 (www.fluxus-engineering.com/sharenet.htm) and applying the median-joining and maximum parsimony options. Seven sublineages were found in the present study, and the diversity indices of each population and sublineage were calculated using DNASP v6.12.03. Two neutrality statistics, Tajima’s D and Fu’s Fs were also calculated with 1,000 permutations in ARLEQUIN v. 3.5.2.2. Analysis of molecular variance (AMOVA) was conducted in ARLEQUIN to partition the genetic variance within and among populations. Furthermore, four groups were defined according to the river system and Mountains system (HS1-4 and TH1-4 as Yellow River system in Northeastern QTP; JLJ1-6 as Yangtze River system in Northeastern QTP; LBW, LSH, LSM, LNS, YYJ, YYS, XA, LCB, LCC, and SXY as Yellow River system in Qinling Mountains; the other four populations as River systems in Southern Taihang Mountains) to estimate variance components.
2.3 Demographic history and gene flow
As seven sublineages of T. robusta were found in phylogenetic analyses. We used the cytb data to generate Bayesian skyline plots (BSP) to study the demographic history of each sublineage alone and the whole combined data set. The appropriate substitution model was determined as GTR with Moldetest v.3.7. We created individual input files for each sublineage and all combined with BEAUti available in the BEAST package. Analyses were run in BEAST v.2.6.7. We used a strict clock with the average evolution rate of 0.68%–0.86% per million years for Cobitidae estimated for cytb under the GTR model (Perdices et al., 2014). The program was run for 20 million generations sampling every 2,000 generations. The Bayesian Skyline plots were subsequently generated with TRACER v.1.7.1.
Pairwise migration rates between the seven sublineages were estimated using the cytb and a maximum likelihood coalescent approach implemented in MIGRATE-n v 3.6.4; we estimated Θ and M (immigration rate/mutation rate) based on FST values. We ran 10 short chains with a total of 10,000 genealogy samples and three long chains with 1,000,000 samples, following a burn-in of 10,000 samples; four independent runs were performed.
2.4 Divergence time estimation
The divergence time was estimated using a molecular clock approach as implemented in BEAST v2.6.7 with a relaxed clock model. We used a reduced dataset of cytb: specimens for which three to six sequences from each population were included. This method resulted in 106 terminals—98 representatives of the 28 populations of T. robusta and eight outgroup sequences (T. siluroides and T. strauchii) (Supplementary Table S2). As fossil evidence for Triplophysa was lacking, we used a conservative approach by employing two calibration points from previous studies (Feng et al., 2019; Wu et al., 2020). The most recent common ancestor (TMRCA) of Triplophysa dates from the early Miocene, corresponding to the early Miocene QTP uplift (Wu et al., 2020). The prior “speciation: Yule process” tree was used to construct the tree. We ran four independent runs for 20 million generations logging trees every 2000 generations. Convergence was checked with TRACER v. 1.7.1. The maximum credibility tree was created in TreeAnnotator v. 2.6.7 available in the BEAST package.
2.5 Reconstruction of ancestral areas
A biogeographic reconstruction of ancestral areas using BioGeoBEARS was performed in RASP 4.02. Ancestral distributions were reconstructed using 31 cytb sequences covering the range of seven sublineages of T. robusta (Supplementary Table S3). The 7,500 post-burn-in trees resulting from the BEAST analysis were integrated for inference. Five major areas for T. robusta according to our collection localities and the published literature (Wang et al., 2016; Li et al., 2017; Feng et al., 2019; Wu et al., 2020) are depicted as follows: (A) Upper Yellow River system in Northeastern QTP, (B) Jialing River system in Northeastern QTP, (C) Yellow River system in Qinling Mountains, (D) Yellow River system in Southern Taihang Mountains, and (E) Haihe River system in Southern Taihang Mountains. All six models of geographic range evolution were compared in a likelihood framework. The DIVALIKE + j was chosen by comparing Akaike’s information criterion and likelihood-ratio tests.
2.6 Species distribution and paleo-distribution modeling
We used species distribution modeling (SDM) to construct a model of current, Last Glacial Maximum (LGM, about 22,000 years ago), and Last Interglacial (LIG; ∼120,000–140,000 years before present) T. robusta distributions. The occurrence records for T. robusta were collected from all published literature about T. robusta (Li et al., 2017; Feng et al., 2019; Wu et al., 2020), and a total of 29 unique, geo-referenced and quality-checked occurrence records were finally retained in the present study (Supplementary Table S4).
We extracted current bioclimatic data from the WORLDCLIM dataset (http://www.worldclim.org/) at 30 arc-seconds resolution, LGM bioclimatic data from the Model for Interdisciplinary Research on Climate (MIROC) dataset at 2.5-min resolution (Hasumi and Emori, 2004), and LIG bioclimatic data from Otto-Bliesner et al. (2006) at 30 arc-seconds resolution. The ArcGIS 10.0 (ESRI: Redlands, CA) was used to extract climatic variable layers to include the distribution area (QTP and adjacent area, Qinling Mountains, and Taihang Mountains) of T. robusta to improve the predictive power of Maxent models (Anderson and Raza, 2010). All layers were clipped to an extent encompassing the known range of T. robusta, as well as adjacent, potentially accessible habitats (30–40° N and 98–116° E). Prior to constructing SDM, the ENMTools v. 1.3 was used to determine which bioclimatic variables were correlated, using R > 0.90 as a cutoff, and fifteen variables (bio1, bio2, bio5, bio6, bio8, bio9, bio10, bio11, bio12, bio13, bio14, bio16, bio17, bio18, and bio19) which were found to be correlated with at least one other variable were removed. The following four predictor variables were retained: bio3, 4, 7, and 15. Using the four Bioclim layers and spatially filtered occurrence data, We ran the Maxent v. 3.4.4 to construct a present-day SDM, and then projected it to the LIG and LGM climate conditions, and used the following settings for the Maxent model: hinge features only, regularization multiplier of 1,10,000 max number of background points, replicate the run type of 10 cross-validations (equivalent to 20% testing), logistic output, 500 maximum iterations, and 0.00001 convergence threshold, and a random seed. Furthermore, we optimized the regularization multiplier by generating models with values from 1 to 10 and chose the value with the best Akaike Information Criterion score. We ran jackknife tests to measure the importance of each bioclimatic variable. Models used 29 records for testing and the four BIOCLIM environmental layers to produce models for present and paleodistributions of T. robusta. The logistic output, which was a continuous probability of presence ranging from 0 to 1, was displayed in ARCGIS 10.0.
3 Results
3.1 Phylogeographic pattern of T. robusta
Both phylogenetic tree (ML and BI) and haplotype network showed a clear identification of seven sublineages found in T. robusta (Figure 1). There was no shared haplotype among the six sublineages (L1-L6) in different river systems and mountains, except for the sublineage L7 in upstream of Yellow River and Jialing River. Therefore, a distinct biogeographic structure with six particular geographical regions was found across the investigation area, two in Northeastern QTP (sublineage L5 and L6), three in Eastern Qinling Mountains (sublineage L1, L2, and L3), and one in South Taihang Mountains (sublineage L4). However, sublineage L7 had a wide distribution across the upstream of Yellow River and Jialing River. Low levels of diversity indices were found in each sublineage (π < 0.005, Supplementary Table S5) and in most populations (Table 1). Particularly, the very low genetic diversity (π < 0.001, Hd < 0.500) was found in populations YYJ and YYS, distributed in the Luohe River system. Tajima’s D and Fu’s Fs were not significant in any sublineages, except for sublineage L7 (p < 0.01), as well as for all combined populations (Supplementary Table S5). AMOVA revealed that only 39.37% of genetic variation was explained by intra-population variation, while 60.63% (p < 0.0000) explained variation among populations (Table 2). Furthermore, a high differentiation at the group level was found in the present study, and 56.25% (p < 0.0000) explained variation among groups (Table 2). All these above results clearly identified a distinct hierarchical phylogeographical structure for the T. robusta in the studied area.
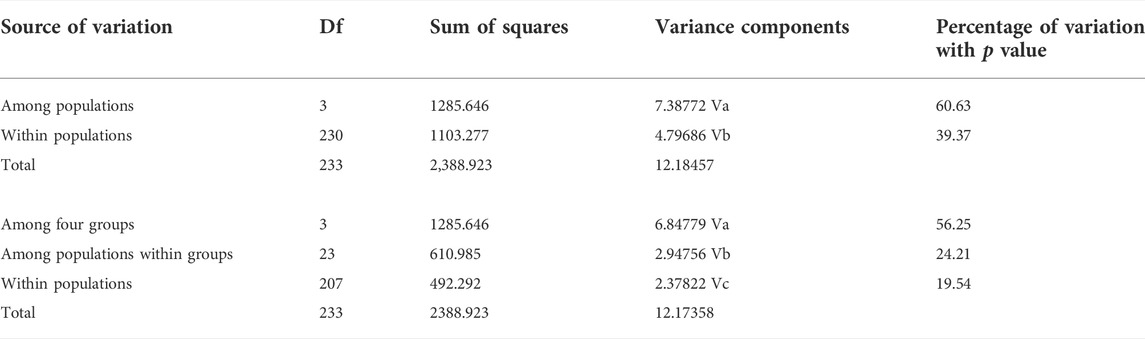
TABLE 2. Analysis of molecular variance partitioning the genetic variance within and among populations, and molecular variance results comparing genetic variation among four groups (HS1-4 and TH1-4 as Yellow River system in Northeastern QTP; JLJ1-6 as Yangtze River system in Northeastern QTP; LBW, LSH, LSM, LNS, YYJ, YYS, XA, LCB, LCC, and SXY as Yellow River system in Qinling Mountains; other four populations as River systems in Southern Taihang Mountains).
3.2 Demographic history and gene flow
The BSP detected relatively stable population sizes throughout the last 0.22 Mya for most sublineages (L1-L6) (data were not shown). However, the population size of sublineage L7 appeared to have increased constantly since 0.18 Mya (Supplementary Figure S1). Furthermore, the overall population size of the species appeared to have rapidly increased constantly since 0.21 Mya (Supplementary Figure S2). This suggested that only sublineage L7 in Northeastern QTP and the combined populations had expanded historically, coinciding with the result of the neutrality test (Supplementary Table S5).
Estimates of gene flow calculated with MIGRATE-n indicated low to high levels of historical gene flow between sublineages (Supplementary Table S6). The effective number of migrants entering and leaving each sublineage per generation ranged from M = 0.29 (L5→L4) to 15.44 (L5→L7). The highest unidirectional estimates of gene flow were found towards the sublineage L7 (M = 37.41) and the lowest was in sublineage L4 (M = 2.04), while the highest gene flow out of a sublineage was from L5 (M = 18.14).
3.3 Divergence time estimation and ancestral range reconstruction
The time-calibrated molecular clock analyses dated the TMRCA of T. robusta and T. siluroides at approximately 8.51 Mya (95% highest posterior density HPD: 10.62–6.61 Mya) (Supplementary Figure S3). The divergence between sublineage L1 (Yihe River) and sublineage L2 (Luohe River) distributed in Eastern Qinling Mountains was at approximately 0.70 Mya, and both sublineages diverged from sublineages L5-7 in Northeastern QTP at approximately 2.17 Mya (HPD: 2.84–1.58 Mya). Sublineage L3 in Eastern Qinling Mountains split from L4 in South Taihang Mountains at approximately 0.61 Mya, and both sublineages diverged from L5-7 at approximately 1.00 Mya. Sublineage L5 upstream of the Yellow River diverged from L6 in Jialing River at approximately 0.65 Mya, and both diverged from sublineage L7 at approximately 0.87 Mya.
Ancestral range reconstruction showed that TMRCA of T. robusta was mainly distributed in the Yellow River basin (node 61, AC: 45.87%, Supplementary Figure S4). The Clade I most likely originated in the Eastern Qinling Mountains, while the Clade II originated in Northeastern QTP, indicating a vicariant event early in the history of T. robusta.
3.4 Species distribution modeling
Maxent modeling accurately predicted a current range similar to that known for T. robusta in China with little variance (Figures 2A,B), with AUC values of 0.967 (SD = 0.020; training AUC range: 0.972–0.980, test AUC range: 0.925–0.990). The temperature seasonality (bio4; 49.9%), Precipitation Seasonality (bio15; 24.4%), were the largest contributors to the model contributing 74.3%, however, Temperature Annual Range (bio7) and bio4 were the highest permutation importance (31.8%, 27.1%, respectively) as supported by jackknifing.
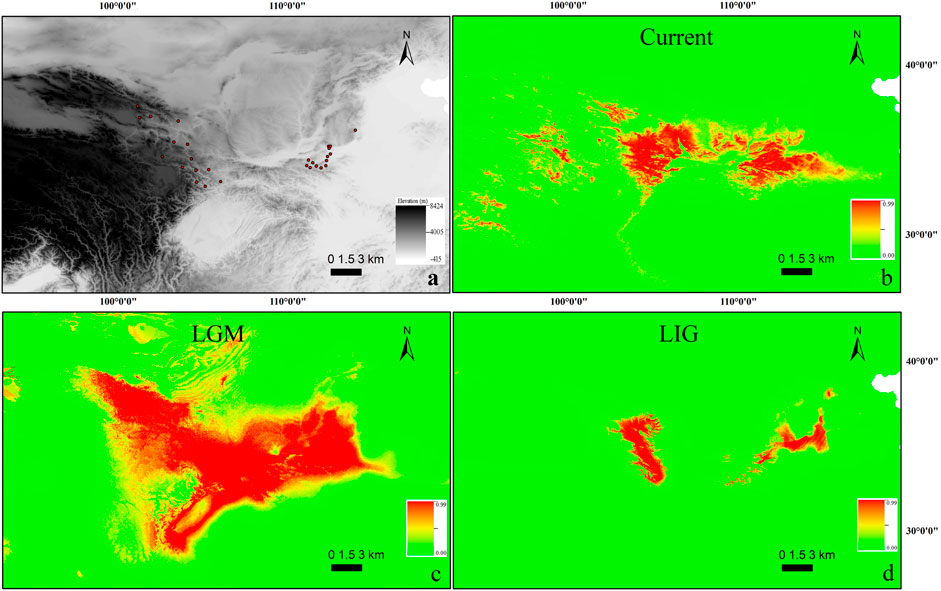
FIGURE 2. (A) Occurrence points used for building contemporary SDM for T. robusta (n = 29). The scale bar depicts altitude values. (B–D): Species distribution modeling (SDM) for T. robusta during the current (B), LGM (C), and LIG (D) periods. Scale bars depict suitability values.
When the model used current conditions to predict suitable habitat for T. robusta during LGM, the main areas of suitable habitat with high probability for this species were as follows: the whole Qinling Mountains, Northeastern QTP, and Southern Taihang Mountains (Figure 2C). However, during LIG, suitable habitats reflected that of LIG were very different from LGM and the present distribution, with a greater concentrtion of suitable habitats in the Qinling Mountains and Northeastern QTP (Figure 2D).
4 Discussion
As a typical montane species, T. robusta is mainly distributed in Northeastern QTP and Qinling Mountains, providing an interesting model to explore the impact of paleoclimate oscillation and geologic events on diversification patterns. It was not uncommon that species restricted to high elevation mountain habitats often show high levels of intra-species divergence and even unique patterns of genetic structure (Pauls et al., 2006; Hou et al., 2014; de Oliveira et al., 2021). We found seven distinct sublineages of T. robusta with no shared haplotype among different mountain rivers, even in two close mountain rivers (Yihe River and Luohe River) in Qinling Mountains. However, we found two shared haplotypes (h33 and h62, Figure 1) distributed upstream of the Yellow River and Jialing River, which are divided by watershed in Northeastern QTP. The present study showed a novel phylogeographic pattern and evolution history for T. robusta compared with previous studies on this species. The interspecies hybridization and introgressions in the T. robusta complex have distorted the molecular systematics and restricted speciation in the T. robusta complex (Feng et al., 2019). However, our study emphasized the historical gene flow among populations of T. robusta, resulting from the repetition of the glacial period during the Pleistocene, which played a crucial role in the phylogeographic pattern of T. robusta. Furthermore, our results showed that TMRCA of T. robusta differentiated into two clades (Figure 1) caused by a vicariant event early in the history of T. robusta, and Clade I most likely originated in the Eastern Qinling Mountains. While it was speculated that T. robusta in Qinling Mountains was mostly derived from the upstream of the Yellow River (Wu et al., 2020).
Our results revealed that T. robusta experienced Pleistocene rapid radiation. Divergence time among the seven sublineages was estimated at 2.17–0.61 Mya. Previous studies on plants and animals suggested mountain building as a predominant driver in triggering biological evolution (Hoorn et al., 2010; Smith et al., 2014; Simões et al., 2016), especially for the diversification of the species in QTP and Qinling Mountains (Che et al., 2010; Yan et al., 2010; Xu et al., 2018). However, there were few studies on the intra-species diversification between the two mountain lineages. In this study, we recovered the T. robusta in the investigated region of the present study with two main clades separated by the Qinling Mountains (Figure 1, Supplementary Figure S3). This mountain range extends more than 1,500 km from West to East in Central China with an average elevation between 1,500–3,000 m, representing an important geological and geographical boundary (Yan et al., 2010; Xu et al., 2018). The DIVALIKE + j-based analyses estimated allopatric speciation with the two sister clades inheriting each half of the ancestral range (Clade I in Eastern Qinling Mountains and Clade II in Northeastern QTP) (Supplementary Figure S4). The divergence time between clade I and clade II was estimated at approximately 2.17 Mya, relating to the further rapid uplift of the Qinling Mountains that occurred between 2.4 and 1.2 Mya (Yuan et al., 2012), and the interglacial period between 2.5 and 1.8 Mya (Xing, 1989; Jing and Liu, 1999). The retraction of cold-adapted species restricted to higher elevations during interglacial periods may have been another crucial element for producing a phylogeographic pattern for montane species (de Oliveira et al., 2021). The vicariance event likely had repeatedly happened during Pleistocene interglacials in Northeastern QTP and Qinling Mountains. Feng et al. (2019) mainly investigated the molecular systematics of the T. robusta complex distributed in Northeastern QTP. They speculated that there existed hybridization and introgressions between sympatric species according to the mitonuclear discordances, such as the hybridization and introgressions between T. minxianensis and T. robusta, and between T. pappenheimi and T. siluroides. Wu et al. (2020) studied the molecular phylogeny and divergence of Triplophysa species distributed in the Qinling Mountains and Southern Taihang Mountains. However, the phylogeography pattern of T. robusta is still unknown according to the two previous studies. Fortunately, they supply a comprehensive distribution for the T. robusta in China, making a good opportunity for us to investigate the phylogeography of T. robusta across Northeastern QTP and the Qinling Mountains. The SDM suggested increases in habitat suitability for T. robusta during LGM (Figure 2C), but contraction during LIG (Figure 2D), especially in Qinling Mountains. Unidirectional migration was found in T. robusta, with middle to high level of M (>1.00) from sublineages (L1-L4) in Eastern Qinling Mountains to that (L5 and L7) in Northeastern QTP (Supplementary Table S6). This scenario of historical gene flow from east to west supported the existence of historical corridors for the dispersion of high-elevation species during periods of climate cooling (Antonelli et al., 2010; de Oliveira et al., 2021). However, we found a low level of migration rate in the opposite direction (a West-East pattern), which was uncommon in freshwater species found in China during the same or much older period, such as the frogs, snails, and fish (Yan et al., 2013; Gu et al., 2019; Gu et al., 2022). The authors suggested the role of Pleistocene interglacials dispersal in influencing the species diversification.
In the present study, the divergence estimated for the seven sublineages showed rapid radiation during 0.87–0.61 Mya (Supplementary Figure S3), exactly coinciding with the Pleistocene interglacial stage (0.90–0.40 Mya) in China. It was reported that the main uplift events of the Qinling Mountains with an elevation of about 3,000 m (Zhu, 1989) had been completed before the Early Pleistocene (1.67–1.45 Mya). The orogenic belt of the Taihang Mountains, with an average elevation of 1,500–2000 m, rose sharply to approximately 1,400 m at the Miocene/Pliocene boundary, and reached their current elevation at the end of the Pliocene (Gong, 2010). Many speciation events and intraspecific differentiation might have been driven by the massive uplifting of the Taihang Mountains and Qinling Mountains from the late Miocene to the Pliocene. Species such as the freshwater Gammarus with low dispersal ability showed a congruent pattern with geographical vicariance caused by the uplift of the Lüliang and Taihang Mountains (Hou et al., 2014). The uplift of the Qinling Mountains during 23–2.6 Ma as a vicariance event had driven the speciation of Sinothela (Xu et al., 2018). However, the recent Mid-Pleistocene diversifications in different sublineages of T. robusta were far postdated to the uplift of the two mountains. Therefore, the retractions during inter-glacial periods found in the present study were more likely to play a key role in interrupting gene flow for cold-adapted species. It was likely a good candidate explanation of the Mid Pleistocene rapid diversification for this species.
Strangely, sublineage L7 in Northeastern QTP had a wide distribution across the upstream of Jialing River and Yellow River, in which both possessed their own sublineages (L5 and L6, respectively). The nested genetic structure of T. robusta in Northeastern QTP suggested an exchange between the Yellow River and the Jialing River. The high level of historical gene flow from Jialing River to Yellow River supported the existence of historical corridors for the dispersal of T. robusta (Supplementary Table S6) and coincided with the speculation that the upstream of Yellow River was once connected to the Jialing River. It was supposed that the continual tectonic activities, such as earthquakes over the past million years in the Northeastern QTP likely led to extensive gene flow (Feng et al., 2019). Furthermore, during glacial periods, ephemeral rivers and periglacial lakes could arise, likely to provide further opportunities for dispersal and interactions between populations of T. robusta. The elevation shift model stated that populations of cold-adapted species inhabiting high elevations expanded to lowland areas during periods of climate cooling, increasing spatial connectivity and gene flow (Galbreath et al., 2009; Newman and Austin, 2015; de Oliveira et al., 2021).
Previous studies on the T. robusta (Feng et al., 2019; Wu et al., 2020) have little practical and instructive value on the conservation strategies of wildly distributed species of Triplophysa. The present study had an important implication for the conservation of the cold-adapted species restricted to higher elevations. The diversification pattern found in the T. robusta can provide guidelines for effective conservation measures for Triplophysa, which might be negatively impacted by current climate change caused by humans. Montane endemic species were thought to be particularly vulnerable to the effects of rapid climate changes, as lots of montane habitats may be lost or fragmented due to climate warming (Moritz et al., 2008). Bonatelli et al. (2014) and Fernandes et al. (2014) believed that climate change in the next few decades might accelerate the declines and local extinctions of high elevation species due to the reduction of suitable habitats. The low genetic diversity found in most sublineages and populations of T. robusta indicated a serious challenge in adaptive ability (O’Brien, 1994; Bazin et al., 2006). Our results suggested that the temperature was one of the most important environmental factors influencing T. robusta distribution range, which experienced a considerable retraction as historical climatic fluctuations in Northeastern QTP and Qinling Mountains in China. In this context, the studied species T. robusta, as well as other Triplophysa distributed in the QTP and adjacent regions would be negatively impacted by climate warming. A burning question in future conservation projection on cold-adapted fish species endemic to higher elevations is how to tackle global warming for them. Furthermore, mid to low levels of genetic diversities were found for all populations except for JYT (Table 1). While T. robusta is classed as Least Concern (LC) in China, the current conservation strategy is carried out under the assumption of only one species and one gene pool. Our results demonstrated that different protection strategies for T. robusta should be conducted in different mountains and river systems: two protection units for T. robusta in Northeastern QTP, one upstream of the Yellow River basin, and the other one upstream of the Jialing River; three protection units in Qinling Mountains, one in Yihe River, one in Luohe River and another in Dongjian River; and only one protection unit in the Southern Taihang Mountains. Especially for two populations (YYJ and YYS) in a couple of mountain streams in Luohe River, with very low nucleotide diversity and haplotype diversity, forbidden fishing zone and habitat environment restoration should be implemented to strengthen protection for them.
Data availability statement
The datasets presented in this study can be found in online repositories. The names of the repository/repositories and accession numbers can be found in the article/Supplementary Material.
Ethics statement
The animal study was reviewed and approved by the Hunan Normal University and Henan Normal University.
Author contributions
QG conceived and designed the study. HZ and YS analyzed the data. HW, HZ, SL, ZS, and CY carried out tissue dissection, DNA isolation, sample preparation for sequencing and collecting the mtDNA data from GenBank. QG and HZ drafted the manuscript, and MW and PC revised the language. All authors read and approved the final manuscript.
Funding
This study was supported by the Natural Science Foundation of Hunan (Grant No. 2021JJ30442, 2020JJ5357), and the National Natural Science Foundation of China (No. 31601851, 32002372).
Acknowledgments
We greatly appreciate the reviewers for their very helpful comments on previous versions of the manuscript.
Conflict of interest
The authors declare that the research was conducted in the absence of any commercial or financial relationships that could be construed as a potential conflict of interest.
Publisher’s note
All claims expressed in this article are solely those of the authors and do not necessarily represent those of their affiliated organizations, or those of the publisher, the editors and the reviewers. Any product that may be evaluated in this article, or claim that may be made by its manufacturer, is not guaranteed or endorsed by the publisher.
Supplementary material
The Supplementary Material for this article can be found online at: https://www.frontiersin.org/articles/10.3389/fgene.2022.955382/full#supplementary-material
References
Anderson, R. P., and Raza, A. (2010). The effect of the extent of the study region on GIS models of species geographic distributions and estimates of niche evolution: Preliminary tests with montane rodents (genus Nephelomys) in Venezuela. J. Biogeogr. 37, 1378–1393. doi:10.1111/j.1365-2699.2010.02290.x
Bazin, E., Glémin, S., and Galtier, N. (2006). Population size does not influence mitochondrial genetic diversity in animals. Science 312, 570–572. doi:10.1126/science.1122033
Bonatelli, I. A. S., Perez, M. F., Peterson, A. T., Taylor, N. P., Zappi, D. C., Machado, M. C., et al. (2014). Interglacial microrefugia and diversification of a cactus species complex: Phylogeography and palaeodistributional reconstructions for Pilosocereus aurisetus and allies. Mol. Ecol. 23, 3044–3063. doi:10.1111/mec.12780
Che, J., Zhou, W. W., Hu, J. S., Yan, F., Papenfuss, T. J., Wake, D. B., et al. (2010). Spiny frogs (paini) illuminate the history of the himalayan region and southeast asia. Proc. Natl. Acad. Sci. U. S. A. 107, 13765–13770. doi:10.1073/pnas.1008415107
Clark, M. K., House, M. A., Royden, L. H., Whipple, K. X., Burchfiel, B. C., Zhang, X., et al. (2005). Late cenozoic uplift of southeastern tibet. Geol. 33, 525–528. doi:10.1130/g21265.1
de Oliveira, F. R., Gehara, M., Solé, M., Lyra, M., Haddad, C. F. B., Silva, D. P., et al. (2021). Quaternary climatic fluctuations influence the demographic history of two species of sky-island endemic amphibians in the Neotropics. Mol. Phylogenet. Evol. 160, 107113–113. doi:10.1016/j.ympev.2021.107113
Dong, Y., Zhang, G., Neubauer, F., Liu, X., Genser, J., and Hauzenberger, C. (2011). Tectonic evolution of the Qinling orogen, China: Review and synthesis. J. Asian Earth Sci. 41, 213–237. doi:10.1016/j.jseaes.2011.03.002
Feng, C. G., Zhou, W. W., Tang, Y. T., Gao, Y., Chen, J. M., Tong, C., et al. (2019). Molecular systematics of the Triplophysa robusta (cobitoidea) complex: Extensive gene flow in a depauperate lineage. Mol. Phylogenet. Evol. 132, 275–283. doi:10.1016/j.ympev.2018.12.009
Fernandes, G. W., Barbosa, N. P. U., Negreiros, D., and Paglia, A. P. (2014). Challenges for the conservation of vanishing megadiverse rupestrian grasslands. Natureza Conservacao 12, 162–165. doi:10.1016/j.ncon.2014.08.003
Galbreath, K. E., Hafner, D. J., and Zamudio, K. R. (2009). When cold is better: Climate-driven elevation shifts yield complex patterns of diversification and demography in an alpine specialist (American Pika, Ochotona princeps). Evolution 63, 2848–2863. doi:10.1111/j.1558-5646.2009.00803.x
Gong, M. (2010). Uplifting process of southern Taihang mountian in cenozoic. PhD Thesis. Beijing, China: Chinese Academy of Geological Science.
Gu, Q. H., Husemann, M., Wu, H. H., Dong, J., Zhou, C. J., Wang, X. F., et al. (2019). Phylogeography of bellamya (Mollusca: Gastropoda: Viviparidae) snails on different continents: Contrasting patterns of diversification in China and east africa. BMC Evol. Biol. 19, 82. doi:10.1186/s12862-019-1397-0
Gu, Q. H., Wang, S., Zhong, H., Yuan, H., Yang, J. L., Yang, C. H., et al. (2022a). Phylogeographic relationships and the evolutionary history of the Carassius auratus complex with a newly born homodiploid raw fish (2nNCRC). BMC Genomics 23, 242. doi:10.1186/s12864-022-08468-x
Gu, Q., Zhong, H., Sun, Y., Yuan, H., Li, S., Shen, Z., et al. (2022b). Reanalysis on phylogeographic pattern of sharpbelly Hemiculter leucisculus (cyprinidae: Cultrinae) in China: A review and the implications for conservation. Front. Ecol. Evol. 10, 865089. doi:10.3389/fevo.2022.865089
Hasumi, H., and Emori, S. (2004). K-1 coupled model (MIROC) description. K-1 Tech Rep. p 34. Available at: http://ccsr.aori.u-tokyo.ac.jp/∼hasumi/miroc_description.pdf (Accessed at Sep 29, 2014).
Hoorn, C., Wesselingh, F. P., Ter Steege, H., Bermudez, M. A., Mora, A., Sevink, J., et al. (2010). Amazonia through time: Andean uplift, climate change, landscape evolution, and biodiversity. Science 330, 927–931. doi:10.1126/science.1194585
Hou, Z., Li, J. B., and Li, S. Q. (2014). Diversification of low dispersal crustaceans through mountain uplift: A case study of Gammarus (Amphipoda: Gammaridae) with descriptions of four novel species. Zool. J. Linn. Soc. 170, 591–633. doi:10.1111/zoj.12119
Huang, Z., Yu, F., Gong, H., Song, Y., Zeng, Z., and Zhang, Q. (2017). Phylogeographical structure and demographic expansion in the endemic alpine stream salamander (hynobiidae: Batrachuperus) of the qinling mountains. Sci. Rep. 7, 1871. doi:10.1038/s41598-017-01799-w
Husemann, M., Guzman, N. V., Danley, P. D., Cigliano, M. M., and Confalonieri, V. A. (2013). Biogeography of Trimerotropis pallidipennis (acrididae: Oedipodinae): Deep divergence across the americas. J. Biogeogr. 40, 261–273. doi:10.1111/jbi.12007
Jing, C. R., and Liu, H. P. (1999). On the glacial and Interglacial stages in Quaternary of China. J. Chengdu Univ. Technol. 26, 97–100.
Kong, H. H., Condamine, F. L., Yang, L. H., Harris, A. J., Feng, C., Wen, F., et al. (2022). Phylogenomic and macroevolutionary evidence for an explosive radiation of a plant genus in the Miocene. Syst. Biol. 71 (3), 589–609. doi:10.1093/sysbio/syab068
Li, J. X., Wang, Y., Jin, H. F., Li, W. J., Yan, C. C., Yan, P. F., et al. (2017). Identification of Triplophysa species from the Qinghai-Tibetan Plateau (QTP) and its adjacent regions through DNA barcodes. Gene 605, 12–19. doi:10.1016/j.gene.2016.11.045
Liu, J., Zhang, P., Lease, R. O., Zheng, D., Wan, J., Wang, W., et al. (2013). Eocene onset and late Miocene acceleration of Cenozoic intracontinental extension in the North Qinling range-Weihe graben: Insights from apatite fission track thermochronology. Tectonophysics 584, 281–296. doi:10.1016/j.tecto.2012.01.025
Moritz, C., Patton, J. L., Conroy, C. J., Parra, J. L., White, G. C., and Beissinger, S. R. (2008). Impact of a century of climate change on small-mammal communities in Yosemite national park, USA. Science 322, 261–264. doi:10.1126/science.1163428
Newman, C. E., and Austin, C. C. (2015). Thriving in the cold: Glacial expansion and postglacial contraction of a temperate terrestrial salamander (Plethodon serratus). PLoS ONE 10, e0130131. doi:10.1371/journal.pone.0130131
O'Brien, S. J. (1994). A role for molecular genetics in biological conservation. Proc. Natl. Acad. Sci. U. S. A. 91 (13), 5748–5755. doi:10.1073/pnas.91.13.5748
Otto-Bliesner, B. L., Marshall, S. J., Overpeck, J. T., Miller, G. H., and Hu, A. (2006). Simulating Arctic climate warmth and icefield retreat in the last interglaciation. Science 311, 1751–1753. doi:10.1126/science.1120808
Pauls, S. U., Lumbsch, T., and Haase, P. (2006). Phylogeography of the montane caddisfly Drusus discolor: Evidence for multiple refugia and periglacial survival. Mol. Ecol. 15, 2153–2169. doi:10.1111/j.1365-294X.2006.02916.x
Perdices, A., Vasil’Eva, E., and Vasil’Ev, V. (2014). From asia to europe across siberia: Phylogeography of the siberian spined loach (teleostei, Cobitidae). Zool. Scr. 44 (1), 29–40. doi:10.1111/zsc.12085
Rice, W. R., and Hostert, E. E. (1993). Laboratory experiments on speciation: What have we learned in 40 years? Evolution 47, 1637–1653. doi:10.1111/j.1558-5646.1993.tb01257.x
Schramm, F. D., Valdez-Mondragón, A., and Prendini, L. (2021). Volcanism and palaeoclimate change drive diversification of the world's largest whip spider (Amblypygi). Mol. Ecol. 30, 2872–2890. doi:10.1111/mec.15924
Simões, M., Breitkreuz, L., Alvarado, M., Baca, S., Cooper, J. C., Heins, L., et al. (2016). The evolving theory of evolutionary radiations. Trends Ecol. Evol. 31, 27–34. doi:10.1016/j.tree.2015.10.007
Smith, B. T., McCormack, J. E., Cuervo, A. M., Hickerson, M. J., Aleixo, A., Cadena, C. D., et al. (2014). The drivers of tropical speciation. Nature 515, 406–409. doi:10.1038/nature13687
Sota, T., and Vogler, A. P. (2001). Incongruence of mitochondrial and nuclear gene trees in the carabid beetles ohomopterus. Syst. Biol. 50, 39–59. doi:10.1080/10635150119427
Wang, B., Jiang, J., Xie, F., and Li, C. (2012). Postglacial colonization of the qinling mountains: Phylogeography of the swelled vent frog (Feirana quadranus). PLoS ONE 7, e41579. doi:10.1371/journal.pone.0041579
Wang, X. G., Ma, T., Yun, Y., Li, Y., Zhang, J., Liang, H. Y., et al. (2021a). Distinct phylogeographic structures and evolutionary histories of wild medicinal Salvia miltiorrhiza Bunge plant populations in the mountains of Central China. Genet. Resour. Crop Evol. 68, 3309–3318. doi:10.1007/s10722-021-01189-2
Wang, X. Z., Gan, X. N., Li, J. P., Chen, Y. Y., and He, S. P. (2016). Cyprininae phylogeny revealed independent origins of the Tibetan Plateau endemic polyploid cyprinids and their diversifications related to the Neogene uplift of the plateau. Sci. China. Life Sci. 59, 1149–1165. doi:10.1007/s11427-016-0007-7
Wang, Y., Feijó, A., Cheng, J., Xia, L., Wen, Z. X., Ge, D. Y., et al. (2021b). Ring distribution patterns—diversification or speciation? Comparative phylogeography of two small mammals in the mountains surrounding the sichuan basin. Mol. Ecol. 30, 2641–2658. doi:10.1111/mec.15913
Wu, H. H., Gu, Q. H., Zhou, C. J., Tang, Y. T., Husemann, M., Meng, X. L., et al. (2020). Molecular phylogeny and biogeography of Triplophysa stone loaches in the Central Chinese Mountains. Biol. J. Linn. Soc. Lond. 130 (3), 563–577. doi:10.1093/biolinnean/blaa060
Xing, L. S. (1989). Magnetostratigraphic age of Quaternary glaciations in the Lushan area. Bull. Inst. Geomechanics Cags 13, 71–79. (in Chinese).
Xu, X., Kuntner, M., Liu, F. X., Chen, J., and Li, D. (2018). Formation of rivers and mountains drives diversification of primitively segmented spiders in continental East Asia. J. Biogeogr. 45, 2080–2091. doi:10.1111/jbi.13403
Yan, J., Wang, Q., Chang, Q., Ji, X., and Zhou, K. (2010). The divergence of two independent lineages of an endemic Chinese gecko, Gekko swinhonis, launched by the Qinling orogenic belt. Mol. Ecol. 19, 2490–2500. doi:10.1111/j.1365-294X.2010.04660.x
Yuan, J. H., Cheng, F. Y., and Zhou, S. L. (2012). Genetic structure of the tree peony (Paeonia rockii) and the Qinling Mountains as a geographic barrier driving the fragmentation of a large population. PLoS ONE 7, e34955. doi:10.1371/journal.pone.0034955
Zhang, R., Jiang, D. B., Liu, X. D., and Tian, Z. P. (2012). Modeling the climate effects of different subregional uplifts within the Himalaya-Tibetan Plateau on Asian summer monsoon evolution. Chin. Sci. Bull. 57, 4617–4626. doi:10.1007/s11434-012-5284-y
Zhu, Z. Y. (1989). The formation of river terraces and evolution of drainage system in the middle Yellow River. Acta Geogr. Sin. 44, 429–440. 10.11821/xb198904006.
Keywords: Qinling mountains, vicariance event, past climate change, phylogeographic pattern, T. robusta
Citation: Zhong H, Sun Y, Wu H, Li S, Shen Z, Yang C, Wen M, Chen P and Gu Q (2022) Pleistocene climate and geomorphology drive the evolution and phylogeographic pattern of Triplophysa robusta (Kessler, 1876). Front. Genet. 13:955382. doi: 10.3389/fgene.2022.955382
Received: 28 May 2022; Accepted: 21 July 2022;
Published: 12 September 2022.
Edited by:
Shaokui Yi, Huzhou University, ChinaCopyright © 2022 Zhong, Sun, Wu, Li, Shen, Yang, Wen, Chen and Gu. This is an open-access article distributed under the terms of the Creative Commons Attribution License (CC BY). The use, distribution or reproduction in other forums is permitted, provided the original author(s) and the copyright owner(s) are credited and that the original publication in this journal is cited, in accordance with accepted academic practice. No use, distribution or reproduction is permitted which does not comply with these terms.
*Correspondence: Qianhong Gu, Z3FoQGh1bm51LmVkdS5jbg==cWlhbmhvbmdfZ0AxNjMuY29t