 Aasim Majeed
 Prerna Johar2†
 Xianzhong Feng
 Javaid Akhter Bhat
- 1School of Agricultural Biotechnology, Punjab Agriculture University (PAU), Ludhiana, India
- 2School of Biotechnology, Sher-e-Kashmir University of Agricultural Sciences and Technology of Jammu, Jammu, India
- 3Department of Botany, Faculty of Life Sciences, Aligarh Muslim University, Aligarh, India
- 4Zhejiang Lab, Hangzhou, China
- 5International Genome Center, Jiangsu University, Zhenjiang, China
Most plant traits are governed by polygenes including both major and minor genes. Linkage mapping and positional cloning have contributed greatly to mapping genomic loci controlling important traits in crop species. However, they are low-throughput, time-consuming, and have low resolution due to which their efficiency in crop breeding is reduced. In this regard, the bulk segregant analysis sequencing (BSA-seq) and its related approaches, viz., quantitative trait locus (QTL)-seq, bulk segregant RNA-Seq (BSR)-seq, and MutMap, have emerged as efficient methods to identify the genomic loci/QTLs controlling specific traits at high resolution, accuracy, reduced time span, and in a high-throughput manner. These approaches combine BSA with next-generation sequencing (NGS) and enable the rapid identification of genetic loci for qualitative and quantitative assessments. Many previous studies have shown the successful identification of the genetic loci for different plant traits using BSA-seq and its related approaches, as discussed in the text with details. However, the efficiency and accuracy of the BSA-seq depend upon factors like sequencing depth and coverage, which enhance the sequencing cost. Recently, the rapid reduction in the cost of NGS together with the expected cost reduction of third-generation sequencing in the future has further increased the accuracy and commercial applicability of these approaches in crop improvement programs. This review article provides an overview of BSA-seq and its related approaches in crop breeding together with their merits and challenges in trait mapping.
Introduction
Identification and dissection of genetic loci determining a particular trait is a regular process in genetics. Most of the complex quantitative traits are regulated by multiple loci distributed across the genome of a species. So to precisely detect the specific genetic elements linked with the trait of interest, one has to link all the loci with that trait (Bhat and Yu, 2021). A quantitative trait locus (QTL) is defined as a region within the genome that is associated with the genetic variation of a quantitative trait. QTL mapping is a widely accepted and applied approach to identify the genes/QTLs determining a complex quantitative trait. Moreover, positional cloning and QTL mapping are the two powerful approaches to dissect the genetic basis of phenotypic variation of important agronomic traits. Both these approaches investigate the genomes for polymorphic markers, followed by linking the polymorphic markers with a particular trait to identify the most likely candidate genomic regions controlling that trait. At the next level, increasing the marker density across these candidate regions would ensure further refinement of their physical interval (fine-mapping), followed by the evaluation of their actual physical position on the chromosomes (physical mapping). Diverse QTLs and underlying genes for numerous traits across a myriad of species have been successfully deciphered using these approaches. The major limitation to these approaches, however, is that they usually are low-throughput and time-consuming (Song et al., 2017).
The bulk segregant analysis is a high-throughput QTL mapping approach to rapidly identify genomic loci regulating the trait of interest. In contrast to individual segregant analysis (ISA), which classifies segregants according to their marker genotypes, the BSA pools segregants according to their phenotypes. When the former compares trait values of different classes, the latter compares marker allele frequencies in different classes (Huang et al., 2020). Although ISA is more commonly used, however, due to more precision and power of BSA and its simplicity, quickness, and cheaper nature than ISA, it provides additional advantages as compared to ISA. The brisk evolution of sequencing technologies along with the rapid downfall of sequencing costs has put the BSA approach to a newer level by integrating the traditional BSA approach with NGS. The basis of BSA is to generate two phenotypically contrasting groups or populations by crossing two extreme phenotypes. This is followed by creating two bulks from the segregating populations, i.e., F2 by selecting individuals with contrasting phenotypes; for example, tall and short plants, tolerant and susceptible plants, etc. (Zhang and Panthee, 2020). The key to this approach is that the alleles of a locus controlling the trait would be enriched in either bulk; for example, the allele “A” can occur frequently in the tolerant plants, and the allele “a” frequently exists in the susceptible plants, whereas those not affecting the trait would segregate randomly in both bulks (Zhang and Panthee, 2020). BSA was initially targeted to develop genetic markers for trait dissection at earlier stages (Giovannoni et al., 1991; Michelmore et al., 1991). Both marker development and genetic mapping were time-consuming and labor-intensive. However, the rapid advancement of sequencing technologies has greatly facilitated marker discovery and their associations with traits of interest. Integrating BSA with sequencing has dramatically enhanced the speedy detection of marker-trait association by eliminating the time-consuming marker detection step in the traditional BSA approach. This hybrid approach of BSA combined with sequencing was subsequently termed BSA-seq (Zhang and Panthee, 2020). BSA-seq can be regarded as a selective genotyping in which only the tails (individuals with extreme phenotypes) from a population are selected for genotyping. The tailed concept, originally proposed by Darvasi and Soller (2013), reduces the cost and simplifies the analytical process without compromising the statistical power. Rather than analyzing each individual, bulking all the individuals from each tail to create two pools significantly reduces the sequencing cost. BSA-Seq is comparatively an expeditious approach to accomplish the bulk segregant analysis by NGS. BSA conjugated with NGS ensures the rapid identification of both qualitative and quantitative trait loci (Zhang et al., 2021) and speeds up the recognition of candidate genes controlling relevant agronomic traits in diverse crop species (Liang et al., 2020). It can be applied to any population with significant phenotypic differences (Dakouri et al., 2018). For BSA-seq to be more efficient and fruitful, comparatively high sequencing depth and coverage are needed to distinguish significant SNP-trait associations. This results in a sharp rise in the sequencing cost (Zhang et al., 2021), which curbs the application of BSA-Seq to species with large genomes (Tang et al., 2018). However, BSA-seq requires only two sequencing reactions for two pools, thus compensating for high depth and coverage. Nevertheless, for an efficient and productive BSA-seq experiment, the sequencing must be performed to the deepest affordable level, rather than to construct a large pool.
General overview of the BSA-seq technique
Creation of bulks
For the fast-track identification of QTLs linked with a particular trait of interest, a mapping population has to be constructed from a cross between parents encompassing contrasting attributes (Figure 1A). From the progeny of this cross, the individuals exhibiting contrasting phenotypes for a particular trait are initially identified. These contrasting individuals would form two different groups/bulks. For example, some individuals may be resistant to a disease, thereby forming one group/bulk, whereas the other individuals showing susceptibility to the disease form another contrasting group/bulk. Then, the DNA of the individuals from each group is extracted, and all the DNA samples of one group are pooled to create one bulk, and those of the other group are pooled separately to create a second bulk (Song et al. (2017)). After that, sequencing libraries are prepared from the pooled DNA samples of each group/bulk, followed by sequencing of the libraries using an appropriate sequencing platform (Yuexiong et al., 2020; Zhan et al., 2020).
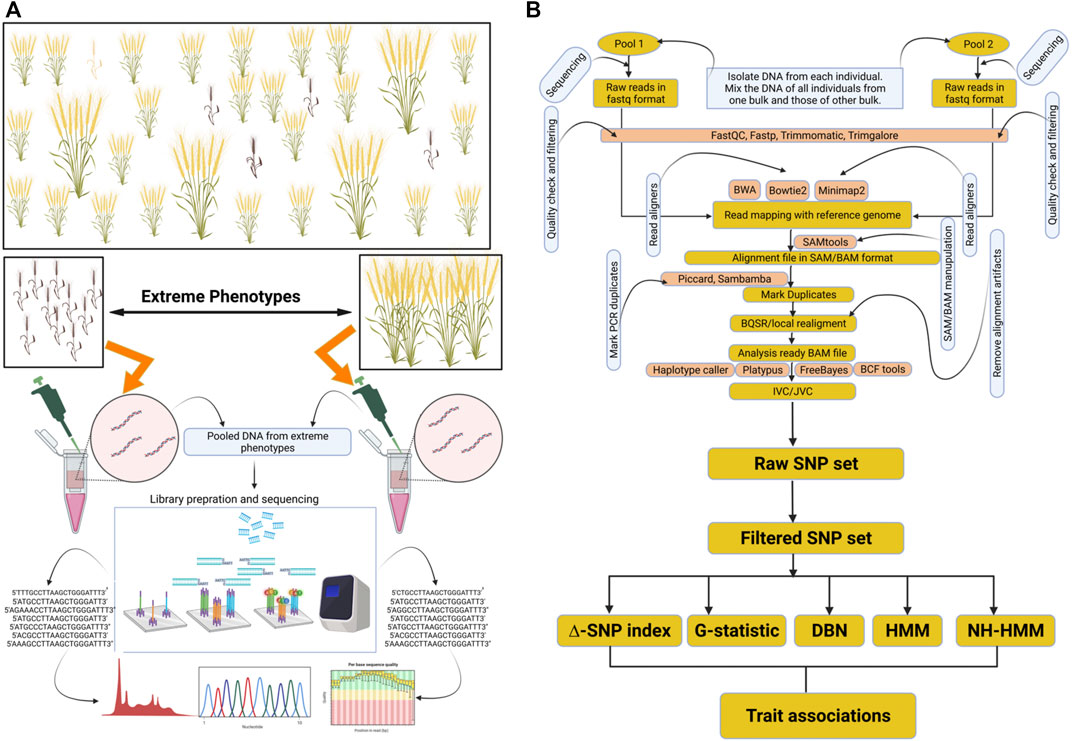
FIGURE 1. Representation of BSA-seq and general data analysis approach for marker trait associations. (A) depicts the creation of opposite bulks and their sequencing. (B) depicts variant identification and their association with the trait. This figure was created through Biorender https://biorender.com.
Sequencing and variant calling
There are diverse variant calling approaches, with no constraints for appraising a single technique, to call SNPs. Usually, the application of a variant calling technique depends on the organism and the depth and coverage of the sequencing data. The differences in the depth and breadth of sequencing coverage have implications on variant calling. Researchers have a choice to use a particular sequencing strategy, depending on their budget. The bulked samples can be sequenced by using different approaches like whole-genome sequencing, genotyping by sequencing (GBS), restriction site-associated DNA sequencing (RAD-seq), etc. The outcome of the SNP calling depends on the sequencing strategy used. Whatever the sequencing strategy used, the downstream analysis of the sequenced reads, in the fastQ/fasta format, involves aligning them with a reference genome or a de novo genome assembly. A standard reference genome of a species is used for this purpose; however, owing to the fact that a single reference genome could not cover all the diversities present within a species, a pangenome concept has emerged to resolve this issue. Therefore, it would be more advantageous to sequence the genome of at least one parent and use it for aligning the reads of two bulks (Luo et al., 2019; Bayer et al., 2020; Kumar et al., 2020). Read alignment represents a critical step of data analysis. Common alignment tools include BWA (Li and Durbin, 2010), Bowtie2 (Langmead and Salzberg, 2012), and Minimap2 (Li, 2018). The resulting alignments are stored and sorted in the SAM/BAM format. BAM is preferred and has become the standard format due to its compressed size and indexed nature. Manipulation of the BAM file is mostly performed through the SAMtools package (Li et al., 2009). After read alignment with the reference genome, the next step is to identify and remove the duplicated reads, i.e., the reads originating from the same genomic region. The duplicated reads may arise due to the amplification of the same fragment several times during library preparation. Picard (http://broadinstitute.github.io/picard), Sambamba (Tarasov et al., 2015), etc., are used to identify and mark these PCR duplicates in the BAM file for downstream exclusion. Before variant calling, some SNP calling pipelines utilize additional processing steps; for example, the GATK Best Practices workflow (Van der Auwera et al., 2013) performs adjustments to base quality scores of sequencing reads (base quality score recalibration (BQSR)) to remove the alignment artifacts and to reduce false positives through local realignment. However, BQSR/realignment has been found to marginally improve the variant calling accuracy; therefore, these steps may be considered optional (Koboldt, 2020). A myriad of tools have been developed for variant calling accurately like FreeBayes (Garrison and Marth, 2012), GATK HaplotypeCaller (DePristo et al., 2011), Platypus (Rimmer et al., 2014), SAMtools/BCFtools (Li, 2011), TASSEL (Bradbury et al., 2007), etc. Studies have shown that different callers produce similar results (with 90% concordance), and the differences arise only around the low coverage and low confidence regions. Despite these low differences, the differently called genome-wide variants by different callers could amount to 1,000s, necessitating the need for benchmarking and fine-tuning the variant caller (Koboldt, 2020). Choosing a single tool is usually sufficient; however, variants called through different callers can be integrated for sensitive advantage. Various tools like BCFtools are used for this purpose. Whatever the tools used, variant calling can be performed in two ways: individual variant calling (IVC) and joint variant calling (JVC). In IVC, variants are called to create a VCF file for each sample separately, followed by the merging of individual VCF files through BCFtools or other packages. One of the main problems with IVC is that since VCF files contain positional information of variants only, it is not possible to distinguish whether a variation absent in some samples is a wild type or just has low coverage to be called a variant (Koboldt, 2020). In JVC, all the samples are called simultaneously and produce genotypes at each variant position for all samples, which has the potential to resolve the above problem of the IVC. The JVC can also infer the likely genotype of a sample based on the information from the other, which provides a sensitive advantage around low coverage regions (DePristo et al., 2011; Koboldt, 2020). Errors during short-read alignment can produce artifacts during variant calling (Li, 2014). In addition, artifacts may arise due to low-quality base calls, local misalignment around indels, erroneous alignments around low complexity regions, and paralogous alignments of reads not well represented in the reference. These artifacts have been excellently described by Koboldt (2020). Such false positives usually skip during automated filtration, so a visual cross-check using genome browsers is needed to review the alignment of variants.
Approaches for downstream data analysis
When the principle of BSA-seq for the mapping of QTLs is simple, a myriad of statistical methods have been developed to analyze BSA-seq data (Figure 1B). A more convenient and robust pipeline called PyBSASeq was developed by Zhang and Panthee (2020). Once the SNPs are generated by the variant caller, generally, the next step is to filter them based on certain criteria. The unmapped SNPs, missing SNPs, SNPs with more than one alternate (ALT) allele, and the SNPs with low-quality scores are excluded (Zhang and Panthee, 2020). The filtered SNPs are then subjected to Fischer’s exact test to obtain a set of significant SNPs. Identification of SNPs is accomplished by matching the bases from sequencing data to the reference genome. Each identified SNP is compared with the reference genome and designated as REF (reference SNP) if identical with the reference genome or ALT (alternate SNP) if not identical with the reference genome. Now, after dividing the number of ALT SNPs by the total number of SNPs (REF + ALT), an allele frequency measure termed the SNP index is obtained. The difference in SNP indices between the two bulks is termed the ∆ SNP index. For any SNP, the greater the value of its ∆ SNP index, the higher is the probability that SNP is associated with the trait of interest (Zhang and Panthee, 2020). In BSA, the alleles associated with a trait get enriched in either bulk. Therefore, if a gene contributes to a trait, its alleles and, therefore, the SNPs within that gene are enriched in either bulk. For example, in one bulk, there may be more REF allele-containing reads, whereas the other bulk may contain more ALT allele-containing reads. Due to the phenomenon of linkage disequilibrium (LD), the SNPs flanking this gene are also enriched, depending on their closeness to the gene. Based on the quantification of enrichment values of these trait-associated flanking SNPs, a recent python algorithm has been developed to analyze the BSA-seq data more simply and effectively (Zhang and Panthee, 2020). The pipeline can also calculate a G-statistic value for each SNP through the G-test using both REF and ALT SNPs in each bulk. The higher the G-statistic value, the more likely the SNP is linked with the trait. After the calculation of the ∆ SNP index or the G-statistic, a sliding window algorithm is utilized to aid the visualization. The sliding windows may contain 100s to 1000s of SNPs among which only a few can be significant. The pipeline developed by Zhang and Panthee (2020) uses the ratio of significant SNPs and the total number of SNPs within a sliding window as an indicator of the trait-associated gene within the sliding window. The greater the ratio, the higher is the probability of the sliding window containing the trait-associated gene. This approach is referred to as the significant SNP method. When using the ∆ SNP index or the G-statistic values during window sliding, the higher ∆ SNP index and G-statistic values indicate that the window under observation contains the trait-associated gene (Zhang and Panthee, 2020). Based on the plots derived from the sliding window approach, candidate genomic regions can be distinguished. The candidate genomic regions would be the windows containing the trait-associated gene. These candidate regions or QTLs associated with a particular trait can then be validated using diverse polymorphic markers (Arikit et al., 2019). Next, the SNPs within the candidate regions can be annotated using distinct bioinformatics tools. PyBSASeq is simple, effective, and highly sensitive. It performs better at low sequence coverage; therefore, it has the potential to significantly reduce the sequencing costs. It can calculate significance levels of the detected associations; however, it suffers from the deficiency of the estimation of confidence intervals for the detected QTLs. It may be resolved in future versions.
Block regression mapping (BRM) is another robust approach developed to analyze BSA-seq data comprehensively. This method was developed by Huang et al. (2020). The authors developed this algorithm to solve two key issues in analyzing BSA-seq data: 1) to accurately determine the significance threshold and 2) to determine the confidence interval of the QTLs. These two issues remain associated with QTL-seq, as claimed by Huang et al. (2020). Through the BRM approach, the users can also integrate the results from the BRM pipeline with the Pooled QTL Heritability Estimator (PQHE) (Tang et al., 2018) to estimate the heritability. The method is based on a null hypothesis (Ho), which if an allele is not associated with the trait, the frequency of that allele in two pools is equal. Conversely, the difference in frequencies of an allele between the two pools is equal to zero if the allele is not associated with the trait. However, under this condition, both the pools should be a random sample from the population for the marker. At Ho
where f = frequency of an allele in a population, f1 = frequency of an allele in pool-1, and f2 = frequency of an allele in pool-2. If an allele is linked with a trait, then
The larger the value of ∆f for an allele, the more strongly the allele is associated with the trait (Huang et al., 2020). After calculating the ∆f value for each marker, a continuous ∆f curve can be plotted across the genome. QTLs can be identified from this curve as their peaks. The local regression method LOESS (Jacoby, 2000) is used to fit the ∆f, f1, and f2 curves, followed by block regression. To calculate the significance levels, the method relies on the fact that ∆f approximately follows a normal distribution under the central limit theorem. Therefore, the significance level of the ∆f is calculated using a two-tailed test. If it is significant, the alternative hypothesis is accepted, i.e., there is QTL present in this peak. Then, the confidence interval is derived as the region between the left and right intersection points of a horizontal line (calculated mathematically) with the curve. This region represents the 95% confidence interval of the QTL (Huang et al., 2020). Bonferroni correction is used for multiple testing. Here, f1 and f2 are equivalent to SNP indices, and ∆f is the ∆SNP index of the QTL-seq method of Takagi et al. (2013a) and PyBSASeq of Zhang and Panthee (2020). The main advantage of the BRM approach is that it can calculate significance levels through multiple testing and determine the confidence intervals.
Among the other statistical approaches developed to analyze BSA-seq data, a G-statistic-based approach developed by Magwene et al. (2011) is well known. It calculates the G-statistic value for each SNP through a smoothed version of the G-test using both REF and ALT SNPs in each bulk. The higher the G-statistic value, the more likely the SNP is linked with the trait. This method takes into consideration the allele frequency variation due to bulks and variation due to sequencing of bulks. Larger bulk sizes and enough sequencing depth have the potential to detect even weak effect QTLs (Magwene et al., 2011). Although this approach is simple, Huang et al. (2020) have asserted that the method of calculating FDR for multiple testing is not concretely devised, confidence intervals cannot be estimated through this method, and it is less effective under low sequencing depth.
The MULTIPOOL method was developed by Edwards and Gifford (2012) for genetic mapping through the utilization of pooled genotyping. This approach was focused on experiments with model organisms, where the progeny of a cross is grouped and pooled based on phenotypes. Its theme is simple: a marker not linked with a trait shall segregate with equal frequency in both pools, whereas the marker linked with a trait shall be enriched in either pool. It was developed to handle larger data sets containing 1000s of markers. It uses the dynamic Bayesian network (DBN) approach for estimating confidence intervals and statistical accuracy of QTLs. The method can be used for any number of replicates and multiple experimental designs (Edwards and Gifford, 2012). It uses a probabilistic multi-locus dynamic Bayesian network model, wherein a single chromosome is considered at a time to model the influence of pool size and recombination on the frequency of neighboring alleles and describes the allele frequency change across the chromosome. Although MULTIPOOL does not rely on a specific read aligner or SNP calling strategy, however, it suffers from the problem of estimating the LOD threshold and judging the significance of signals accurately.
A simpler and widely accepted method known as QTL-seq was developed by Takagi et al. (2013b) to identify the QTLs in rice recombinant inbred lines (RIL) and F2 populations but can be applied to any population for detecting genomic regions that underwent artificial or natural selection. It can also be applied to populations under different environmental conditions like high and low temperatures. However, this method is not suitable for detecting minor effect QTLs as replicated measurements are not possible for each genotype. The approach uses the ∆ SNP index method. It first calculates k (number of reads having an allele different from the reference); then, the SNP index is calculated using the formula
where n = total number of reads.
QTL-seq estimates the contribution of each parent to the variation. If SNP index = 0, there is no variation and all SNPs are the same as reference. If SNP index = 1, all SNPs belong to either parent and if SNP index = 0.5, each parent contributes equally to the variation. Generally, only the SNPs with SNP index > 0.3 in either bulk are retained for downstream analysis. A sliding window is then applied to visualize the graphs based on the SNP index. After that, the ∆ SNP index is calculated for all genomic regions, and the regions exhibiting a higher ∆ SNP index than the background genome represent the regions associated with the trait of interest. These regions correspond to peaks or the valleys of the SNP index plot (Takagi et al., 2013a). Depending on the type of genotyping, i.e., whether analysis involves allele frequencies of both tails of the phenotypic distribution of a targeted trait (bidirectional selective genotyping) (Zhang et al., 2003) or the allele frequencies from only one tail (unidirectional selective genotyping) (Foolad et al., 2001), the QTL-seq can be termed as bidirectional and unidirectional QTL-seq, respectively. Although this selective genotyping of one or both phenotypic extremes has the potential to detect effective QTLs, a simulation study evaluating the power and precision of unidirectional and bidirectional approaches revealed that the latter is more powerful than the former (Navabi et al., 2009). QTL-seq has been successfully used in a myriad of species like tomato (Illa-Berenguer et al., 2015; Wen et al., 2019), capsicum (Park et al., 2019), groundnut (Pandey et al., 2017; Clevenger et al., 2018), watermelon (Branham et al., 2018; Cho et al., 2021), bottle gourd (Chanda et al., 2018; Song et al., 2020), pear (Xue et al., 2017), radish (Hu et al., 2022), rice (Lei et al., 2020), soybean (Zhang et al., 2018), etc. QTL-seq is the most popular and widely used tool for BSA-seq analysis and has the most citations (Table 1). However, Huang et al. (2020) opine that the significance threshold estimated in QTL-seq is inappropriate, and there is no estimation of confidence interval.
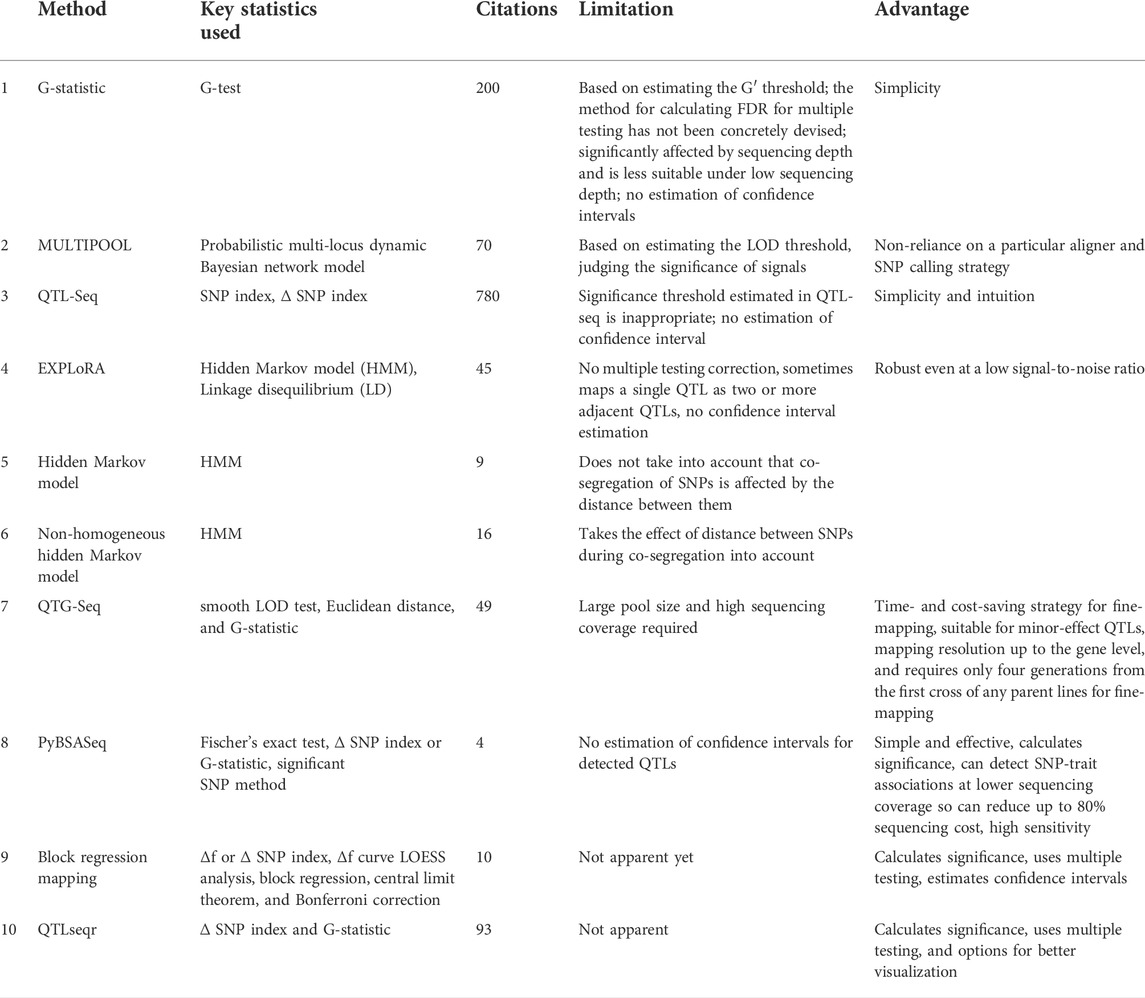
TABLE 1. Key characteristics of different statistical approaches and pipelines used to analyze BSA-seq data.
Several approaches have also been developed that rely on the hidden Markov model (HMM) concept to link SNPs with the phenotype. The HMM is used to explain or derive the probabilistic characteristic of any random process. It is used to describe the observed events that depend on hidden events. HMMs capture the hidden information from observed sequential events. In HMM, the system being modeled is assumed to be a Markov process with unknown parameters, and the observed parameters are used to determine the hidden parameters. The latter is used for further analysis (Hundal et al., 2016; Lan et al., 2017). The EXPLoRA method was developed by Duitama et al. (2014) to precisely distinguish between true and spurious linked regions for a trait of interest. This algorithm relies on linkage disequilibrium and uses HMM to model the relationships between neighboring markers. This algorithm is robust and performs better under a low signal-to-noise ratio. This tool is claimed to give better results when the true linkage signal is diluted by the availability of few segregants, sampling, and screening errors (Duitama et al., 2014). EXPLoRA is effective even at a low signal-to-noise ratio, but no multiple testing correction and confidence interval estimation are carried out. Another approach named the hidden Markov model (HMM) was developed by Calaesen and Burzykowski (2015) to analyze the BSA-seq data. The model assumes different states of a nucleotide, and each state in an offspring being same or different compared to the parent. Transition of nucleotides implies transition in states. By calculating the probabilities of transitions and states, the most probable state of each SNP is selected, which indicates the most probable genomic regions associated with the trait (Calaesen and Burzykowski, 2015). Through this method, each identified SNP is classified into one of the several predefined states having their specific biological interpretation. The HMM identified states allow the identification of genomic regions containing genes governing the trait. This method is based on the assumption that the identified SNPs are equally spaced across the whole genome, which may not always be the case. Furthermore, the co-segregation of SNPs is affected by the distance between them. Taking these two issues into consideration, an extended method of the HMM known as the non-homogeneous hidden Markov model (NH HMM) was developed by Ghavidel et al. (2015), which takes the distance between SNPs into account.
The quantitative trait gene sequencing (QTG-Seq) method was developed by Zhang et al. (2019) to accelerate QTL fine-mapping. The method partitions QTLs to convert a quantitative trait into a near-qualitative trait. The partitioning is performed by selfing the individuals heterozygous for the target QTL and homozygous for other QTLs. This is followed by mining, in which bulked pools are sequenced. In addition to the Euclidean distance and G-statistic, a new statistic called smooth LOD was used to delimit the QTL to a small interval (Zhang et al., 2019). For the determination of minor-effect QTLs and fine-mapping, QTG-Seq is cost-effective and time-saving but at the cost of a large pool size and high sequencing coverage required. The details and key features of these approaches are presented in Table 1.
BSR-Seq approach
SNPs can be deduced from the transcriptomic data also; therefore, it is also possible to use the RNA-sequencing technology to efficiently identify SNPs from bulks. This integration of BSA and transcriptome is known as bulked segregant analysis RNA-seq (BSR-Seq). The fundamental principles of BSR-Seq would remain the same as that of the traditional BSA-seq, with the difference that only the transcribed genome is used as a data source. BSR-Seq has been applied for the elucidation of important genomic regions and SNPs associated with different traits in both plants and animals. For example, Wang et al. (2013) identified 1,255 and 56,419 differentially expressed genes (DEGs) and SNPs, respectively, between resistant and susceptible pools against enteric septicemia in catfish. By pooling the RNA samples from 12 homozygous F3 resistant lines to the stem rust pathogen (strain Ug99 F3) and 11 susceptible homozygous lines, Edae and Rouse (2019) could map the stem rust resistance to a 3.2-Mbp region on chromosome 2U of Ae. umbellulata, with two nucleotide-binding and leucine-rich repeat (NLR) genes as the potential candidate genes (Edae and Rouse, 2019). Moreover, BSR-Seq was used to clone the glossy3 (gl3) gene of maize (Liu et al., 2012). In addition, the molecular details of wheat powdery mildew resistance through BSR-Seq revealed that a single dominant gene on chromosome 5DS conferred resistance (Zhu et al., 2020). BSR-seq was also used to identify DEGs and SNPs associated with waterlogging tolerance (Du et al., 2017). Through the BSR-seq technique, the regulatory network of melon color was identified by Chayut et al. (2015). The cold tolerance response of Actinidia arguta through BSR-Seq revealed that soluble sucrose and β-amylase activity were enhanced in tolerant population compared to susceptible population (Lin et al., 2021). Through BSR-Seq, in addition to the QTL regions, the differential expression of candidate genes is also achieved. However, for traits affected by the environment and the traits determined by many minor genes, BSR-Seq may not be very effective (Edae and Rouse, 2019).
MutMap approach
With the advent of the sequencing technologies, there has been a rapid progress in deciphering the causative alleles for a particular trait more quickly than traditional QTL mapping approaches. Spontaneous mutations and activation of natural mutagens like transposons and viruses, etc., are the main sources of variation in the natural populations. If variations are not sufficient in a natural population, then artificial mutagens like EMS, acridine dyes, base analogs, and UV, X-, and gamma-rays can be used to induce mutation (Raina et al., 2016, 2020). The mutations caused by these agents lead to altered phenotypes through the generation of SNPs, indels, or segmental breaks (Tribhuvan et al., 2018). The phenotypic variations either existing spontaneously or induced artificially are exploited to map the causative genes/QTLs using an appropriate marker system. When the phenotypic variation is artificially induced to create a mutant phenotype, then the causative mutation can be analyzed and identified through MutMap methods. These methods include MutMap, MutMap+, SHOREmap (SHOrtREad map), MutMap-Gap, and NGM (next-generation mapping). First, a mutant phenotype is created through mutagenesis which is then crossed with the parent to create F1 and F2 populations. With the aid of a marker system like SNPs, the mutant phenotype is screened for segregation in the filial generations and thus mapped on the genome. The key to these approaches is the utilization of traditional BSA to generate SNP data. They exploit the power of NGS technologies to map inherited traits across any plant species where the generation of an F2 mapping populations is possible. SHOREmap was developed by Schneeberger et al. (2009) to identify the causative gene mutation for slow growth and pale green leaves in Arabidopsis. The authors first generated mutant lines and crossed it with distant parent to dilute the distribution pattern of non-causal SNPs present throughout the genome. Next, they created a bulk of 500 mutant individuals, and their DNA was pooled and sequenced. SNPs were identified between the parent and mutant. The basic idea of this technique is that among the progenies of mutant x parent, those with the mutant phenotype are assumed to have SNP distribution similar to mutants at the loci controlling the mutant phenotype, whereas other loci have a random distribution. NGM mapping was developed by Austin et al. (2011) to identify the cell wall biosynthesis and maintenance genes in Arabidopsis. NGM is similar to SHOREmap except that it utilizes less mutant lines (10) to create a bulk, without compromising the power to detect causal mutation. Like SHOREmap and NGM, the MutMap technique, which was developed by Abe et al. (2012), also uses the creation of bulks from mutant F2 progenies (Etherington et al., 2014). MutMap, however, differs from the aforementioned two techniques in the sense that while the latter utilizes distantly related mapping lines, the former relies on the crossing between the mutant and its wild type itself. This approach of MutMap directly targets the causal SNPs generated during mutagenesis (Tribhuvan et al., 2018). The SNPs, which are associated with the mutant phenotype, would show 0% wild type and 100% mutant reads, whereas the unlinked SNPs would show 50% each. Abe et al. (2012) developed an SNP index as the number of mutant SNP reads divided by the total number of SNP reads. If this index =1, it means that the SNP is highly linked to the mutant phenotype. This method is more likely to map recessive mutations. An advancement to MutMap known as MutMap+ was developed by Fekih et al. (2013) to tackle the lethal or sterile mutations, wherein F2 cannot be developed. Bulks of around 20–30 individuals for mutant and wild type are created at M3 generation, sequenced at ∼10x coverage followed by SNP identification in both bulks. Then, the SNP index for both is calculated, and the ∆ SNP index is derived by subtracting the wild-type SNP index from the mutant SNP index. The positive ∆ SNP index values indicate that SNP is linked with the phenotype. A further extension of MutMap, to map a causal mutation with the gaped region of the genome, was developed and named MutMap-Gap (Takagi et al., 2013a, b). Here, if an SNP with index = 1 remains undetected in the reference genome, there is a possibility that such SNPs are present within the gaped regions. Then, the unassembled reads are de novo assembled, and the casual SNP is identified using the de novo assembly. The key advantages of MutMap include 1) no need of large mapping populations, 2) no need of genetic linkage maps, 3) no need of natural variation in the population, 4) time-saving and labor-effective, and 5) direct identification of casual SNPs. Key disadvantages include 1) availability of a reference genome, 2) artificial mutagenesis required to develop mutant lines, 3) maintenance of mutant lines, and 4) not applicable if a phenotype cannot be scored (Tribhuvan et al., 2018).
Successful application of BSA-Seq in elucidation of trait-associated QTLs
A myriad of studies on diverse species have proven the applicability of BSA-seq in mapping QTLs for different traits of agronomic importance. The details of some important studies on important crop plants are presented in Table 2. BSA-Seq successfully identified the genomic regions controlling the locule number and fruit weight in tomatoes (Illa-Berenguer et al., 2015) that may lead to significant breakthroughs in fruit development in tomatoes. Breeding heat-tolerant cultivars of tomatoes seems appealing. In order to identify the heat stress-responsive QTLs in tomato, Wen et al. (2019) used an integrated approach of conventional QTL mapping, BSA-Seq, and RNA-Seq and found five major QTLs determining the trait of interest. Their results have significance in breeding for improved thermotolerance in tomatoes. A major QTL on chromosome 1 regulating capsaicinoid biosynthesis in the pericarp of capsicum was identified by Park et al. (2019) using BSA-Seq in integration with RNA-Seq. Significant yield losses and deteriorated fodder quality in groundnut are caused due to rust and late leaf spot fungal diseases. To address this issue, Pandey et al. (2017) identified three QTL loci for rust resistance and one for late leaf spot resistance using the BSA-Seq approach. Furthermore, Clevenger et al. (2018) also mapped late leaf spot resistance QTLs in groundnut by BSA-Seq. Identification of these genomic regions controlling rust and late leaf spot resistance and their introgression into elite groundnut cultivars would bring revolution in groundnut breeding. In the case of watermelon, Fusarium wilt, caused by the fungus Fusarium oxysporum f. sp. niveum (Fon) leads to significant losses in yield. Using BSA-seq coupled to QTL mapping, the genomic region controlling resistance to this fungus was fine-mapped to around the 315-kb region (Branham et al., 2018). In order to map loci determining semi-dwarfism in watermelon, Cho et al. (2021) identified a single recessive gene through BSA-Seq. Watermelons are severely affected by heat stress. Grafting watermelon to heat-tolerant bottle gourd rootstocks is one solution to this problem (Yang Y. et al., 2013a). So understanding of the inheritance and identification of loci controlling heat tolerance in bottle gourd may lead to significant breakthroughs in watermelon breeding for heat tolerance. Using BSA-Seq, seven heat-tolerant QTLs with one as a major effect QTL for heat tolerance in bottle gourd were determined (Song et al., 2020). In addition, bottle gourd rootstock is used to improve cold tolerance and disease resistance in cucurbits. The aphid-transmitted papaya ringspot virus watermelon strain (PRSV-W) and zucchini yellow mosaic virus (ZYMV) are the two most common viruses infecting bottle gourd. Through BSA-seq, fine-mapping of the Prs locus and identification of the candidate resistance gene for PRSV-W were elucidated (Chanda et al., 2018). The red peel of pears is more attractive and also provides health benefits to consumers. So genes controlling the skin coloration aid in cultivar selection and enhance pear breeding. Using BSA-seq, a 582.5-kb candidate genomic region associated with red/green skin (R/G) locus, harboring approximately 81 predicted protein-coding genes, was identified (Xue et al., 2017). Further fine-mapping and elucidation of the specific casual genes would enhance the commercial value of pears. An important commercial attribute of radish is its root shape, measured as the ratio of the root length to root diameter. Hu et al. (2022) identified seven QTLs distributed on five chromosomes controlling the root shape. The results of this study are significant for fine-mapping and functional analysis of root-shaped QTLs and cultivar breeding for the root shape in radish (Hu et al., 2022). Among the abiotic stresses, salt stress negatively affects all crop species, leading to compromised plant performance and significant losses in crop yield. Seedling survival and overall yield in rice are directly affected by salt tolerance at the bud burst stage. Using BSA-seq, a major candidate region on chromosome 7 was identified, which was further narrowed down to a 222-kb genomic interval. Furthermore, five differentially expressed genes (DEGs) were identified in this candidate region through the RNA-seq approach at the bud burst stage under the salt-treated condition. In addition, the expression of one gene, (OsSAP16), was enhanced under drought stress, implying that OsSAP16 is the strong candidate gene (Lei et al., 2020). These results are significant for improving the salt tolerance of rice varieties. Grain size and weight are important traits that determine the overall yield in cereal crops. In order to identify the candidate genomic regions controlling the grain size and weight in rice, Yaobin et al. (2018 used BSA-seq and identified a 15–20 Mb region on chromosome 5. Plant height is closely related to soybean yield. Using QTL-seq, Zhang et al. (2018) identified a 1.73-Mb region on chromosome 13. Linkage mapping was used to confirm this region in the mapping population. Candidate gene analysis revealed that Glyma.13 g249400 showed significantly higher expression in soybean plants with greater plant height; therefore, it can be a strong candidate gene for this trait (Zhang et al. (2018).
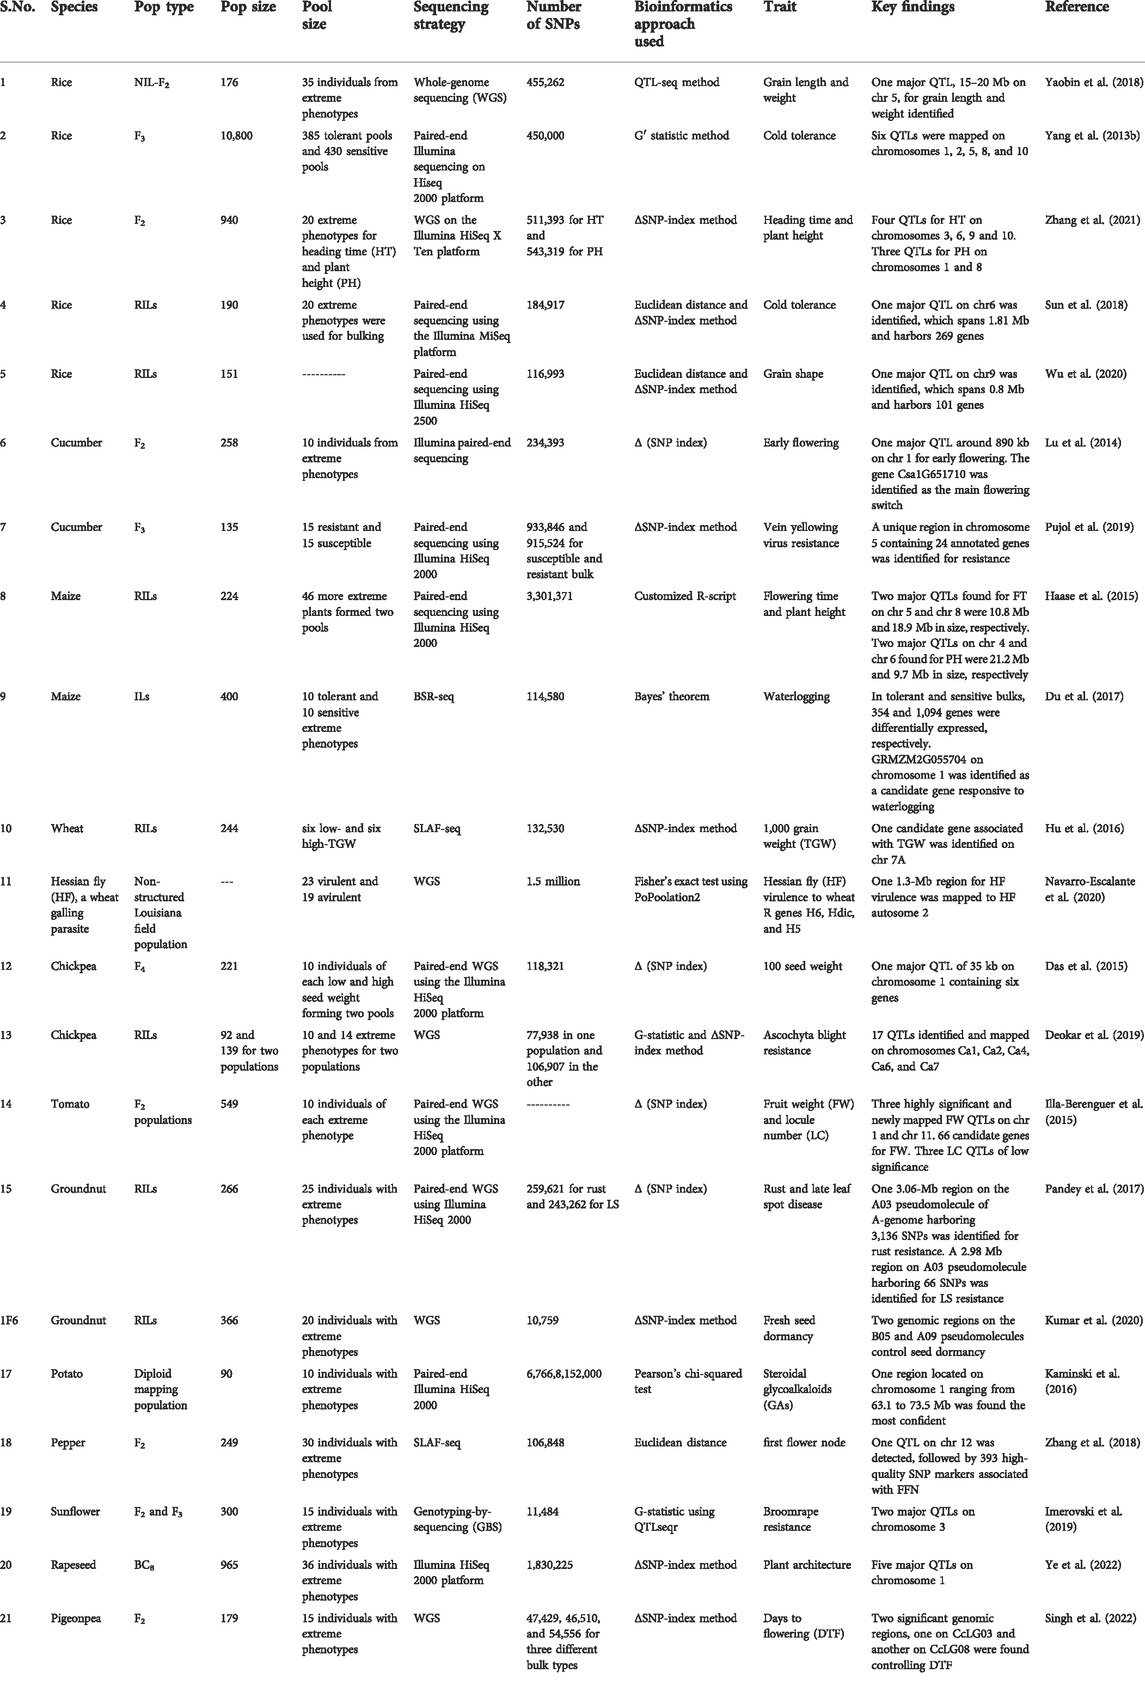
TABLE 2. Details of the studies utilizing BSA-Seq for the elucidation of trait-specific genomic regions in different crop species.
In addition to its importance in crop plants, BSA-seq is also widely used in other species as well like yeast (Wenger et al., 2010; Hu et al., 2015), Tilapia fishes (Gu et al., 2018), etc. Using MULTIPOOL, Vogel et al. (2021) was able to dissect the genomic regions controlling the root and crown rot resistance against phytophthora in squash fish, whereas De Witt et al. (2019) and Wang et al. (2019) were successful in elucidating the unique alleles involved in lignocellulosic inhibitor tolerance and genomic variants linked to high-temperature fermentation performance in yeast, respectively. Furthermore, Trindade de Carvalho et al. (2017) successfully used BSA-seq in yeast through EXPLoRA that relies on the hidden Markov model (HMM).
Potential of BSA-seq in medicinal plant genomics
Medicinal plants are less explored at the genomic level as compared to staple crop plants. Even the breeding programs for the genetic improvement of medicinal plants are at the pioneering stage, and the development of trait-specific homogeneous lines is far away from reality. However, BSA-seq can greatly speed up and facilitate their breeding programs by making the use of F2 generations. Thus, medicinal plant breeders can get a general idea about the nature of the progenies in the context of a specific trait by integrating BSA with NGS technologies. This information can then be used to develop trait-specific homogeneous lines through selfing of the selected lines. Practically, this approach is feasible for only those medicinal plants that have less generation time and flower early in life. Some examples of such medicinal plants that are best suited for which reference genome is available and hence BSA-seq can serve their breeding purpose effectively may include stevia, tea, and tulsi. For longer generation time in medicinal plants, especially tree species, the creation of F2 generation is almost impossible.
Conclusion and future prospects
BSA-seq and its related approaches have the potential to quickly identify the trait-specific genomic regions/QTLs in a high-throughput manner. It takes the advantage of traditional BSA in integration with rapidly evolving NGS technologies. The most admirable attribute of this approach is that it takes only F2 generations to precisely identify trait-specific genomic regions/QTLs, thereby saving much time. However, this is achieved at the cost of additional capital investment for deep sequencing. Therefore, there is a trade-off between time and capital investment in using BSA-seq. With the rapid advancement of NGS technologies and a steep decrease in the cost of sequencing, it is expected that in near future, the sequencing depth would not be a matter of concern while estimating the overall cost of BSA-seq.
Author contributions
All authors listed have made a substantial, direct, and intellectual contribution to the work and approved it for publication.
Funding
This work was financially supported by the Zhenjiang International-Joint fund (Grant No. 595 GJ2020010) and by the Zhejiang Lab (Soybean Intelligent Computing Breeding and Applications, 596 Grant No. 2021PE0AC04).
Conflict of interest
The authors declare that the research was conducted in the absence of any commercial or financial relationships that could be construed as a potential conflict of interest.
Publisher’s note
All claims expressed in this article are solely those of the authors and do not necessarily represent those of their affiliated organizations, or those of the publisher, the editors, and the reviewers. Any product that may be evaluated in this article, or claim that may be made by its manufacturer, is not guaranteed or endorsed by the publisher.
References
Abe, A., Kosugi, S., Yoshida, K., Natsume, S., Takagi, H., Kanzaki, H. N., et al. (2012). Genome sequencing reveals agronomically important loci in rice using MutMap. Nat. Biotechnol. 30, 174–178. doi:10.1038/nbt.2095
Arikit, S., Wanchana, S., Khanthong, S., Saensuk, C., Thianthavon, T., Vanavichit, A., et al. (2019). QTL-seq identifies cooked grain elongation QTLs near soluble starch synthase and starch branching enzymes in rice (Oryza sativa L.). Sci. Rep. 9, 8328. doi:10.1038/s41598-019-44856-2
Austin, R. S., Vidaurre, D., Stamatiou, G., Breit, R., Provart, N. J., Bonetta, D., et al. (2011). Next-generation mapping of Arabidopsis genes. Plant J. 67, 715–725. doi:10.1111/j.1365-313X.2011.04619.x
Bayer, P. E., Golicz, A. A., Scheben, A., Batley, J., and Edwards, D. (2020). Plant pan-genomes are the new reference. Nat. Plants 6 (8), 914–920. doi:10.1038/s41477-020-0733-0
Bhat, J. A., and Yu, D. (2021). High-throughput NGS-based genotyping and phenotyping: Role in genomics-assisted breeding for soybean improvement. Legum. Sci. 3, e81. doi:10.1002/leg3.81
Bradbury, P. J., Zhang, Z., Kroon, D. E., Casstevens, T. M., Ramdoss, Y., Buckler, E. S., et al. (2007). Tassel: Software for association mapping of complex traits in diverse samples. Bioinformatics 23, 2633–2635. doi:10.1093/bioinformatics/btm308
Branham, S. E., Patrick Wechter, W., Lambel, S., Massey, L., Ma, M., Fauve, J., et al. (2018). QTL-seq and marker development for resistance to Fusarium oxysporum f. sp. niveum race 1 in cultivated watermelon. Mol. Breed. 38 (11), 139. doi:10.1007/s11032-018-0896-9
Chanda, B., Wu, S., Fei, Z., and Ling, K. (2018). “Resequencing of bottle gourd germplasm and using QTL-seq to fine-map PRSV-W resistance in Bottle gourd (Lagenaria sinceraria),” in Cucurbitaceae proceedings. Available at: https://www.ars.usda.gov/research/publications/publication/?seqNo115=358356.
Chayut, N., Yuan, H., Ohali, S., Meir, A., Yeselson, Y., Portnoy, V., et al. (2015). A bulk segregant transcriptome analysis reveals metabolic and cellular processes associated with Orange allelic variation and fruit β-carotene accumulation in melon fruit. BMC Plant Biol. 15, 274. doi:10.1186/s12870-015-0661-8
Cho, Y., Lee, S., Park, J., Kwon, S., Park, G., Kim, H., et al. (2021). Identification of a candidate gene controlling semi-dwarfism in watermelon, Citrullus lanatus, using a combination of genetic linkage mapping and QTL-seq. Hortic. Environ. Biotechnol. 62 (3), 447–459. doi:10.1007/s13580-020-00330-x
Claesen, J., and Burzykowski, T. (2015). A hidden Markov-model for gene mapping based on whole-genome next generation sequencing data. Stat. Appl. Genet. Mol. Biol. 14 (1), 21–34.
Clevenger, J., Chu, Y., Chavarro, C., Botton, S., Culbreath, A., Isleib, T. G., et al. (2018). Mapping late leaf spot resistance in peanut (Arachis hypogaea) using QTL-seq reveals markers for marker-assisted selection. Front. Plant Sci. 9, 83. doi:10.3389/fpls.2018.00083
Dakouri, A., Zhang, X., Peng, G., Falk, K. C., Gossen, B. D., Strelkov, S. E., et al. (2018). Analysis of genome-wide variants through bulked segregant RNA sequencing reveals a major gene for resistance to Plasmodiophora brassicae in Brassica oleracea. Sci. Rep. 8, 17657. doi:10.1038/s41598-018-36187-5
Das, S., Upadhyaya, H. D., Bajaj, D., Kujur, A., Badoni, S., Kumar, L. V, et al. (2015). Deploying QTL-seq for rapid delineation of a potential candidate gene underlying major trait-associated QTL in chickpea. DNA Res. 22, 193–203. doi:10.1093/dnares/dsv004
De Witt, R. N., Kroukamp, H., Van Zyl, W. H., Paulsen, I. T., and VolscHenk, H. (2019). QTL analysis of natural Saccharomyces cerevisiae isolates reveals unique alleles involved in lignocellulosic inhibitor tolerance. FEMS Yeast Res. 19, foz047. doi:10.1093/femsyr/foz047
Deokar, A., Sagi, M., Daba, K., and Tar'an, B. (2019). QTL sequencing strategy to map genomic regions associated with resistance to ascochyta blight in chickpea. Plant Biotechnol. J. 17, 275–288. doi:10.1111/pbi.12964
DePristo, M. A., Banks, E., Poplin, R., Garimella, K. V., Maguire, J. R., Hartl, C., et al. (2011). A framework for variation discovery and genotyping using next-generation DNA sequencing data. Nat. Genet. 43, 491–498. doi:10.1038/ng.806
Du, H., Zhu, J., Su, H., Huang, M., Wang, H., and Ding, S. (2017). Bulked segregant RNA-seq reveals differential expression and SNPs of candidate genes associated with waterlogging tolerance in maize. Front. Plant Sci. 8, 1022. doi:10.3389/fpls.2017.01022
Duitama, J., Sánchez-Rodríguez, A., Goovaerts, A., Pulido-Tamayo, S., Hubmann, G., Foulquié-Moreno, M. R., et al. (2014). Improved linkage analysis of Quantitative Trait Loci using bulk segregants unveils a novel determinant of high ethanol tolerance in yeast. BMC Genomics 15, 207. doi:10.1186/1471-2164-15-207
Edae, E. A., and Rouse, M. N. (2019). Bulked segregant analysis RNA-seq (BSR-Seq) validated a stem resistance locus in Aegilops umbellulata, a wild relative of wheat. PLoS One 14, e0215492. doi:10.1371/journal.pone.0215492
Edwards, M. D., and Gifford, D. K. (2012). High-resolution genetic mapping with pooled sequencing. BMC Bioinforma. 13, S8. doi:10.1186/1471-2105-13-S6-S8
Etherington, G. J., Monaghan, J., Zipfel, C., and MacLean, D. (2014). Mapping mutations in plant genomes with the user-friendly web application CandiSNP. Plant Methods 10, 41. doi:10.1186/s13007-014-0041-7
Fekih, R., Takagi, H., Tamiru, M., Abe, A., Natsume, S., Yaegashi, H., et al. (2013). MutMap+: Genetic mapping and mutant identification without crossing in rice. PloS one 8, e68529. doi:10.1371/journal.pone.0068529
Foolad, M. R., Zhang, L. P., and Lin, G. Y. (2001). Identification and validation of QTLs for salt tolerance during vegetative growth in tomato by selective genotyping. Genome 44, 444–454. doi:10.1139/g01-030
Garrison, E., and Marth, G. (2012). Haplotype-based variant detection from short-read sequencing, 3907. arXiv, 1207.
Ghavidel, F. Z., Claesen, J., and Burzykowski, T. (2015). A nonhomogeneous hidden Markov model for gene mapping based on next-generation sequencing data. J. Comput. Biol. 22, 178–188. doi:10.1089/cmb.2014.0258
Giovannoni, J. J., Wing, R. A., Ganal, M. W., and Tanksley, S. D. (1991). Isolation of molecular markers from specific chromosomal intervals using DNA pools from existing mapping populations. Nucleic Acids Res. 19, 6553–6558. doi:10.1093/nar/19.23.6553
Gu, X. H., Jiang, D. L., Huang, Y., Li, B. J., Chen, C. H., Lin, H. R., et al. (2018). Identifying a major QTL associated with salinity tolerance in Nile Tilapia using QTL-Seq. Mar. Biotechnol. 20, 98–107. doi:10.1007/s10126-017-9790-4
Haase, N. J., Beissinger, T., Hirsch, C. N., Vaillancourt, B., Deshpande, S., Barry, K., et al. (2015). Shared genomic regions between derivatives of a large segregating population of maize identified using bulked segregant analysis sequencing and traditional linkage analysis. G3 5, 1593–1602. doi:10.1534/g3.115.017665
Hu, M. J., Zhang, H. P., Liu, K., Cao, J. J., Wang, S. X., Jiang, H., et al. (2016). Cloning and characterization of TaTGW-7A gene associated with grain weight in wheat via SLAF-seq-BSA. Front. Plant Sci. 7, 1902. doi:10.3389/fpls.2016.01902
Hu, T., Wei, Q., Wang, J., Wang, W., Hu, H., Yan, Y., et al. (2022). Identification of quantitative trait loci controlling radish root shape using QTL-seq [Preprint from Research Square]. Durham UK: Europe PMC. doi:10.21203/rs.3.rs-1500743/v1
Hu, W., Suo, F., and Du, L. L. (2015). Bulk segregant analysis reveals the genetic basis of a natural trait variation in fission yeast. Genome Biol. Evol. 7 (12), 3496–3510. doi:10.1093/gbe/evv238
Huang, L., Tang, W., Bu, S., and Wu, W. (2020). Brm: A statistical method for QTL mapping based on bulked segregant analysis by deep sequencing. Bioinformatics 36, 2150–2156. doi:10.1093/bioinformatics/btz861
Hundal, J., Miller, C. A., Griffith, M., Griffith, O. L., Walker, J., Kiwala, S., et al. (2016). Cancer immunogenomics: Computational neoantigen identification and vaccine design. Cold Spring Harb. symposia quantitative Biol. 81, 105–111. doi:10.1101/sqb.2016.81.030726
Illa-Berenguer, E., Van Houten, J., Huang, Z., and van der Knaap, E. (2015). Rapid and reliable identification of tomato fruit weight and locule number loci by QTL-seq. Theor. Appl. Genet. 128, 1329–1342. doi:10.1007/s00122-015-2509-x
Imerovski, I., Dedić, B., Cvejić, S., Miladinović, D., Jocić, S., Owens, G. L., et al. (2019). BSA-seq mapping reveals major QTL for broomrape resistance in four sunflower lines. Mol. Breed. 39, 41. doi:10.1007/s11032-019-0948-9
Kaminski, K. P., Kørup, K., Andersen, M. N., Sønderkær, M., Andersen, M. S., Kirk, H. G., et al. (2016). Next generation sequencing bulk segregant analysis of potato support that differential flux into the cholesterol and stigmasterol metabolite pools is important for steroidal glycoalkaloid content. Potato Res. 59, 81–97. doi:10.1007/s11540-015-9314-4
Koboldt, D. C. (2020). Best practices for variant calling in clinical sequencing. Genome Med. 12, 91. doi:10.1186/s13073-020-00791-w
Kumar, R., Janila, P., Vishwakarma, M. K., Khan, A. W., Manohar, S. S., Gangurde, S. S., et al. (2020). Whole‐genome resequencing‐based QTL‐seq identified candidate genes and molecular markers for fresh seed dormancy in groundnut. Plant Biotechnol. J. 18 (4), 992–1003. doi:10.1111/pbi.13266
Lan, Y., Zhou, D., Zhang, H., and Lai, S. (2017). “Development of early warning models,” in Early warning for infectious disease outbreak (Academic Press), 35–74.
Langmead, B., and Salzberg, S. L. (2012). Fast gapped-read alignment with Bowtie 2. Nat. Methods 9, 357–359. doi:10.1038/nmeth.1923
Lei, L., Zheng, H., Bi, Y., Yang, L., Liu, H., Wang, J., et al. (2020). Identification of a major qtl and candidate gene analysis of salt tolerance at the bud burst stage in rice (Oryza sativa L.) using QTL-Seq and RNA-Seq. Rice 13 (1), 55. doi:10.1186/s12284-020-00416-1
Li, H. (2011). A statistical framework for SNP calling, mutation discovery, association mapping and population genetical parameter estimation from sequencing data. Bioinformatics 27, 2987–2993. doi:10.1093/bioinformatics/btr509
Li, H., and Durbin, R. (2010). Fast and accurate long-read alignment with Burrows-Wheeler transform. Bioinformatics 26 (5), 589–595. doi:10.1093/bioinformatics/btp698
Li, H., Handsaker, B., Wysoker, A., Fennell, T., Ruan, J., Homer, N., et al. (2009). The sequence alignment/map format and SAMtools. Bioinformatics 25, 2078–2079. doi:10.1093/bioinformatics/btp352
Li, H. (2018). Minimap2: Pairwise alignment for nucleotide sequences. Bioinformatics 34 (18), 3094–3100. doi:10.1093/bioinformatics/bty191
Li, H. (2014). Toward better understanding of artifacts in variant calling from high-coverage samples. Bioinformatics 30, 2843–2851. doi:10.1093/bioinformatics/btu356
Liang, T., Chi, W., Huang, L., Qu, M., Zhang, S., Chen, Z. Q., et al. (2020). Bulked segregant analysis coupled with whole-genome sequencing (BSA-Seq) mapping identifies a novel pi21 haplotype conferring basal resistance to rice blast disease. Int. J. Mol. Sci. 21, 2162. doi:10.3390/ijms21062162
Lin, M., Sun, S., Fang, J., Qi, X., Sun, L., Zhong, Y., et al. (20212021). BSR-Seq analysis provides insights into the cold stress response of Actinidia arguta F1 populations. BMC Genomics 22, 72. doi:10.1186/s12864-021-07369-9
Liu, S., Yeh, C. T., Tang, H. M., Nettleton, D., and Schnable, P. S. (2012). Gene mapping via bulked segregant RNA-Seq (BSR-Seq). PloS One 7, e36406. doi:10.1371/journal.pone.0036406
Lu, H., Lin, T., Klein, J., Wang, S., Qi, J., Zhou, Q., et al. (2014). QTL-seq identifies an early flowering QTL located near Flowering Locus T in cucumber. Theor. Appl. Genet. 127, 1491–1499. doi:10.1007/s00122-014-2313-z
Luo, H., Pandey, M. K., Khan, A. W., Guo, J., Wu, B., Cai, Y., et al. (2019). Discovery of genomic regions and candidate genes controlling shelling percentage using QTL-seq approach in cultivated peanut (Arachis hypogaea L.). Plant Biotechnol. J. 17 (7), 1248–1260. doi:10.1111/pbi.13050
Magwene, P. M., Willis, J. H., and Kelly, J. K. (2011). The statistics of bulk Segregant analysis using next generation sequencing. PLoS Comput. Biol. 7, e1002255. doi:10.1371/journal.pcbi.1002255
Michelmore, R. W., Paran, I., and Kesseli, R. V. (1991). Identification of markers linked to disease-resistance genes by bulked segregant analysis: A rapid method to detect markers in specific genomic regions by using segregating populations. Proc. Natl. Acad. Sci. U. S. A. 88, 9828–9832. doi:10.1073/pnas.88.21.9828
Navabi, A., Mather, D. E., Bernier, J., Spaner, D. M., and Atlin, G. N. (2009). QTL detection with bidirectional and unidirectional selective genotyping: Marker-based and trait-based analyses. Theor. Appl. Genet. 118 (2), 347–358. doi:10.1007/s00122-008-0904-2
Navarro-Escalante, L., Zhao, C., Shukle, R., and Stuart, J. (2020). BSA-seq discovery and functional analysis of candidate Hessian fly (Mayetiola destructor) avirulence genes. Front. Plant Sci. 11, 956. doi:10.3389/fpls.2020.00956
Pandey, M. K., Khan, A. W., Singh, V. K., Vishwakarma, M. K., Shasidhar, Y., Kumar, V., et al. (2017). QTL‐seq approach identified genomic regions and diagnostic markers for rust and late leaf spot resistance in groundnut (Arachis hypogaea L.). Plant Biotechnol. J. 15, 927–941. doi:10.1111/pbi.12686
Park, M., Lee, J. H., Han, K., Jang, S., Han, J., Lim, J. H., et al. (2019). A major QTL and candidate genes for capsaicinoid biosynthesis in the pericarp of Capsicum chinense revealed using QTL-seq and RNA-seq. Theor. Appl. Genet. 132 (2), 515–529. doi:10.1007/s00122-018-3238-8
Pujol, M., Alexiou, K. G., Fontaine, A. S., Mayor, P., Miras, M., Jahrmann, T., et al. (2019). Mapping cucumber vein yellowing virus resistance in cucumber (Cucumis sativus L.) by using BSA-seq analysis. Front. Plant Sci. 10, 1583. doi:10.3389/fpls.2019.01583
Rimmer, A., Phan, H., Mathieson, I., Iqbal, Z., Twigg, S. R. F., Wilkie, A. O. M., et al. (2014). Integrating mapping-assembly- and haplotype-based approaches for calling variants in clinical sequencing applications. Nat. Genet. 46, 912–918. doi:10.1038/ng.3036
Schneeberger, K., Ossowski, S., Lanz, C., Juul, T., Petersen, A. H., Nielsen, K. L., et al. (2009). SHOREmap: Simultaneous mapping and mutation identification by deep sequencing. Nat. Methods 6, 550–551. doi:10.1038/nmeth0809-550
Singh, V., Sinha, P., Obala, J., Khan, A. W., Chitikineni, A., Saxena, R. K., et al. (2022). QTL-seq for the identification of candidate genes for days to flowering and leaf shape in pigeonpea. Heredity 128, 411–419. doi:10.1038/s41437-021-00486-x
Song, H., Huang, Y., and Gu, B. (2020). QTL-Seq identifies quantitative trait loci of relative electrical conductivity associated with heat tolerance in bottle gourd (Lagenaria siceraria). PloS one 15 (11), e0227663. doi:10.1371/journal.pone.0227663
Song, J., Li, Z., Liu, Z., Guo, Y., and Qiu, L. J. (2017). Next-generation sequencing from bulked-segregant analysis accelerates the simultaneous identification of two qualitative genes in soybean. Front. Plant Sci. 8, 919. doi:10.3389/fpls.2017.00919
Sun, J., Yang, L., Wang, J., Liu, H., Zheng, H., Xie, D., et al. (2018). Identification of a cold-tolerant locus in rice (Oryza sativa L.) using bulked segregant analysis with a next-generation sequencing strategy. Rice 11, 24. doi:10.1186/s12284-018-0218-1
Takagi, H., Abe, A., Yoshida, K., Kosugi, S., Natsume, S., Mitsuoka, C., et al. (2013a). QTL-Seq: Rapid mapping of quantitative trait loci in rice by whole genome resequencing of DNA from two bulked populations. Plant J. 74, 174–183. doi:10.1111/tpj.12105
Takagi, H., Uemura, A., Yaegashi, H., Tamiru, M., Abe, A., Mitsuoka, C., et al. (2013b). MutMap-Gap: Whole-genome re-sequencing of mutant F2 progeny bulk combined with de novo assembly of gap regions identifies the rice blast resistance gene Pii. New Phytol. 200, 276–283. doi:10.1111/nph.12369
Tang, W., Huang, L., Bu, S., Tamiru, M., Abe, A., Mitsuoka, C., et al. (2018). Estimation of QTL heritability based on pooled sequencing data. Bioinformatics 34, 978–984. doi:10.1093/bioinformatics/btx703
Tarasov, A., Vilella, A. J., Cuppen, E., Nijman, I. J., and Prins, P. (2015). Sambamba: Fast processing of NGS alignment formats. Bioinformatics 31, 2032–2034. doi:10.1093/bioinformatics/btv098
Tribhuvan, K. U., Kumar, K., Sevanthi, A. M., and Gaikwad, K. (2018). MutMap: A versatile tool for identification of mutant loci and mapping of genes. Indian J. Plant Physiol. 23, 612–621. doi:10.1007/s40502-018-0417-1
Trindade de Carvalho, B., Holt, S., Souffriau, B., Lopes Brandão, R., Foulquié-Moreno, M. R., and Thevelein, J. M. (2017). Identification of novel alleles conferring superior production of rose flavor phenylethyl acetate using polygenic analysis in yeast. MBio 8 (6), e01173-17. doi:10.1128/mBio.01173-17
Van der Auwera, G. A., Carneiro, M. O., Hartl, C., Poplin, R., Del Angel, G., Levy-Moonshine, A., et al. (2013). From FastQ data to high confidence variant calls: The genome analysis toolkit best practices pipeline. Curr. Protoc. Bioinforma. 43, 01–11. doi:10.1002/0471250953.bi1110s43
Vogel, G., LaPlant, K. E., Mazourek, M., Gore, M. A., and Smart, C. D. (2021). A combined BSA-Seq and linkage mapping approach identifies genomic regions associated with Phytophthora root and crown rot resistance in squash. Theor. Appl. Genet. 134 (4), 1015–1031. doi:10.1007/s00122-020-03747-1
Wang, R. J., Sun, Y., Bao, L. S., Zhang, J., Jiang, Y., Yao, J., et al. (2013). Bulk segregant RNA-seq reveals expression and positional candidate genes and allele-specific expression for disease resistance against enteric septicemia of catfish. BMC Genomics 14, 929. doi:10.1186/1471-2164-14-929
Wang, Z., Qi, Q., Lin, Y., Guo, Y., Liu, Y., Wang, Q., et al. (2019). QTL analysis reveals genomic variants linked to high-temperature fermentation performance in the industrial yeast. Biotechnol. Biofuels 12 (1), 59. doi:10.1186/s13068-019-1398-7
Wen, J., Jiang, F., Weng, Y., Sun, M., Shi, X., Zhou, Y., et al. (2019). Identification of heat-tolerance QTLs and high-temperature stress-responsive genes through conventional QTL mapping, QTL-seq and RNA-seq in tomato. BMC Plant Biol. 19 (1), 398. doi:10.1186/s12870-019-2008-3
Wenger, J. W., Schwartz, K., and Sherlock, G. (2010). Bulk segregant analysis by high-throughput sequencing reveals a novel xylose utilization gene from Saccharomyces cerevisiae. PLoS Genet. 6, e1000942. doi:10.1371/journal.pgen.1000942
Wu, L., Cui, Y., Xu, Z., and Xu, Q. (2020). Identification of multiple grain shape-related loci in rice using bulked segregant analysis with high-throughput sequencing. Front. Plant Sci. 11, 303. doi:10.3389/fpls.2020.00303
Xue, H., Shi, T., Wang, F., Zhou, H., Yang, J., Wang, L., et al. (2017). Interval mapping for red/green skin color in Asian pears using a modified QTL-seq method. Hortic. Res. 4, 17053. doi:10.1038/hortres.2017.53
Yang, Y., Lu, X., Yan, B., Li, B., Sun, J., Guo, S., et al. (2013a). Bottle gourd rootstock-grafting affects nitrogen metabolism in NaCl-stressed watermelon leaves and enhances short-term salt tolerance. J. Plant Physiol. 170, 653–661. doi:10.1016/j.jplph.2012.12.013
Yang, Z., Huang, D., Tang, W., Zheng, Y., Liang, K., Cutler, A. J., et al. (2013b). Mapping of quantitative trait loci underlying cold tolerance in rice seedlings via high-throughput sequencing of pooled extremes. Plos one 8, e68433. doi:10.1371/journal.pone.0068433
Yaobin, Q., Peng, C., Yichen, C., Yue, F., Derun, H., Tingxu, H., et al. (2018). QTL-Seq identified a major QTL for grain length and weight in rice using near isogenic F2 population. Rice Sci. 25 (3), 121–131. doi:10.1016/j.rsci.2018.04.001
Ye, S., Yan, L., Ma, X., Chen, Y., Wu, L., Ma, T., et al. (2022). Combined BSA-seq based mapping and RNA-seq profiling reveal candidate genes associated with plant architecture in Brassica napus. Int. J. Mol. Sci. 23, 2472. doi:10.3390/ijms23052472
Yuexiong, Z., Gang, Q., Qianqian, M., Minyi, W., Xinghai, Y., Zengfeng, Ma., et al. (2020). Identification of major locus Bph35 resistance to Brown planthopper in rice. Rice Sci. 27, 237–245. doi:10.1016/j.rsci.2020.04.006
Zhan, Z., Jiang, Y., Shah, N., Hou, Z., Zhou, Y., Dun, B., et al. (2020). Association of clubroot resistance locus PbBa8. 1 with a linkage drag of high erucic acid content in the seed of the European turnip. Front. Plant Sci. 11, 810. doi:10.3389/fpls.2020.00810
Zhang, B., Qi, F., Hu, G., Yang, Y., Zhang, L., Meng, J., et al. (2021). BSA-seq-based identification of a major additive plant height QTL with an effect equivalent to that of Semi-dwarf 1 in a large rice F2 population. Crop J. 9, 1428–1437. doi:10.1016/j.cj.2020.11.011
Zhang, H., Wang, X., Pan, Q., Li, P., Liu, Y., Lu, X., et al. (2019). QTG-Seq accelerates QTL fine mapping through QTL partitioning and whole-genome sequencing of bulked segregant samples. Mol. Plant 12 (3), 426–437. doi:10.1016/j.molp.2018.12.018
Zhang, J., and Panthee, D. R. (2020). PyBSASeq: A simple and effective algorithm for bulked segregant analysis with whole-genome sequencing data. BMC Bioinforma. 21 (1), 99. doi:10.1186/s12859-020-3435-8
Zhang, L. P., Lin, G. Y., Niño, D., and Foolad, M. R. (2003). Mapping QTLs conferring early blight (Alternaria solani) resistance in a Lycopersicon esculentum × L. hirsutum cross by selective genotyping. Mol. Breed. 12, 3–19.
Zhang, X., Wang, W., Guo, N., Zhang, Y., Bu, Y., Zhao, J., et al. (2018). Combining QTL-seq and linkage mapping to fine map a wild soybean allele characteristic of greater plant height. BMC Genomics 19 (1), 226. doi:10.1186/s12864-018-4582-4
Keywords: QTL-seq, MutMap, next-generation sequencing, crop breeding, fine-mapping
Citation: Majeed A, Johar P, Raina A, Salgotra RK, Feng X and Bhat JA (2022) Harnessing the potential of bulk segregant analysis sequencing and its related approaches in crop breeding. Front. Genet. 13:944501. doi: 10.3389/fgene.2022.944501
Received: 15 May 2022; Accepted: 28 June 2022;
Published: 08 August 2022.
Edited by:
Frank M. You, Agriculture and Agri-Food Canada (AAFC), CanadaReviewed by:
Sunil S. Gangurde, University of Georgia, United StatesYelda Özden Çiftçi, Gebze Technical University, Turkey
Faheem Shehzad Baloch, Sivas Bilim ve Teknoloji Fakültesi, Turkey
Mehdi Rahimi, Graduate University of Advanced Technology, Iran
Copyright © 2022 Majeed, Johar, Raina, Salgotra, Feng and Bhat. This is an open-access article distributed under the terms of the Creative Commons Attribution License (CC BY). The use, distribution or reproduction in other forums is permitted, provided the original author(s) and the copyright owner(s) are credited and that the original publication in this journal is cited, in accordance with accepted academic practice. No use, distribution or reproduction is permitted which does not comply with these terms.
*Correspondence: R. K. Salgotra, cmtzXzI5NTlAcmVkaWZmbWFpbC5jb20=; Xianzhong Feng, ZmVuZ3hpYW56aG9uZ0BpZ2EuYWMuY24=; Javaid Akhter Bhat, amF2aWQuYWtodGVyNjlAZ21haWwuY29t
†These authors have contributed equally to this work