 Tian Zheng1,2*
- 1Department of Computer Science and Technology, School of Electronic and Information Engineering, Xi’an Jiaotong University, Xi’an, China
- 2Institute of Data Science and Information Quality, Shaanxi Engineering Research Center of Medical and Health Big Data, Xi’an Jiaotong University, Xi’an, China
Detecting SNV at very low read depths helps to reduce sequencing requirements, lowers sequencing costs, and aids in the early screening, diagnosis, and treatment of cancer. However, the accuracy of SNV detection is significantly reduced at read depths below ×34 due to the lack of a sufficient number of read pairs to help filter out false positives. Many recent studies have revealed the potential of mutational signature (MS) in detecting true SNV, understanding the mutational processes that lead to the development of human cancers, and analyzing the endogenous and exogenous causes. Here, we present DETexT, an SNV detection method better suited to low read depths, which classifies false positive variants by combining MS with deep learning algorithms to mine correlation information around bases in individual reads without relying on the support of duplicate read pairs. We have validated the effectiveness of DETexT on simulated and real datasets and conducted comparative experiments. The source code has been uploaded to https://github.com/TrinaZ/extra-lowRD for academic use only.
1 Introduction
Mutation detection is important for the accurate diagnosis and personalized therapeutics of cancer (Fanfani et al., 2021). Somatic mutations are caused by exogenous and endogenous mutational processes that operate during the cell lineage between the fertilized eggs and the cancer cells. Each mutational process may involve components of DNA damage or modification, DNA repair, and DNA replication (which may be normal or abnormal) and potentially include base substitutions, small insertions and deletions (indels), genome rearrangements, and chromosome copy number changes (Stratton et al., 2009). Of all mutation types, single nucleotide variants (SNVs) have high genetic stability, which helps to determine the relationship between genetic polymorphism and disease, explain the susceptibility to phenotypic differences between individuals, and have important implications for disease diagnosis, individualized treatment, and prognosis (Xu et al., 2012; Cashman et al., 2020).
Accurate detection of SNVs with low read depths is of great significance and helps in early cancer screening, diagnosis, and treatment (Kothen et al., 2018). Read depth is the ratio of the total number of bases to the size of the genome (Sims et al., 2014). Most SNV detection methods rely on high sequence read depth and false-positive results appear to increase with the decrease of sequencing depth (Xiao et al., 2021). Although advances in sequencing technologies have reduced the cost of high read depth, the effective depth remains low in the case of prenatal fetal detection (Alba et al., 2012), low purity tumors (Wilkerson et al., 2014), and subclonal structures (Al-Katib et al., 2020). For example, liquid biopsies that identify cancer mutations through blood material have been proposed as a transformative technology for early cancer screening and residual disease monitoring (Kleftogianniss et al., 2020). However, the proportion of ctDNA (cell-free tumor DNA) in the overall blood DNA is relatively low, particularly in situations of low disease burden, such as early cancer detection, and residual disease surveillance after therapeutic intervention ( Underhill., 2021).
The solution to this problem is not unambiguous. Existing methods, such as MuTect, have a sensitivity that drops below 0.1 at 5% variant allelic frequency (VAF) and ×10 read depth (Steven et al., 2018). The possible causes are analyzed in this study and listed as follows. 1) Existing methods mainly calculate reads mapped to the same allele as a set of extracted features to locate mutations (Fang et al., 2015). Their performance is limited in challenging situations such as low-complexity regions and low tumor purity (Steven et al., 2018; Esteva et al., 2019; Zheng et al., 2021). 2) Existing methods align each read pair to a haplotype to obtain a likelihood matrix based on the pairwise HMM algorithm and then use a Bayesian somatic likelihood model to obtain the log ratio of somatic mutation to sequencing error (Cibulskis et al., 2013). Mutations supported by low read depths are indistinguishable in the values of these models. The existing methods cannot support single reads and require many hard filters to filter mutation candidates (Sahraeian et al., 2019). Furthermore, existing deep learning-based methods treat the sequence reads as images for variant detection and encode bases by one-hot encoding (Poplin et al., 2018; Luo et al., 2019; Sahraeian et al., 2019). However, 1) this encoding method only extracts the information of the base itself in the convolution operation and does not notice the differences between the variant sites and other bases and 2) mutation identification using only two-dimensional information may take up less resource.
Recent studies have highlighted the potential of mutational signatures (MSs) for the accurate detection of SNVs (Lawrence et al., 2013; Alexandrov et al., 2020). Somatic mutations in the cancer genome are caused by multiple mutational processes, each producing features called MSs. Over the last few years, large-scale analyses have revealed many MSs in human cancer types. The Pan-Cancer Analysis of Whole Genomes (PCAWG) Network have analyzed data from over 23,000 samples (Tarabichi et al., 2021), showing that SNV tri-nucleotide structures have unique distribution characteristics. The observed MSs suggest that the occurrence of SNV is not an equiprobable event and may help to reveal the true probability of positive SNV, which provides a promising potential approach for SNV detection at low read depths.
Inspired by these, this study presents DETexT, an SNV detection enhancement model that works at very low read depths by integrating MS and the deep semantic learning model Text Convolution Neural Network (TextCNN). DETexT uses a training scheme that not only detects true mutations with high sensitivity but also rejects candidate mutations caused by systematic sequencing artifacts. It integrates MS to maximize the extraction of features carried by individual reads and reflects the cumulative effects of exogenous and endogenous mutational processes acting on cancer cells. Specifically, DETexT can be divided into three parts: 1) Read coding. It proposes a differential encoding algorithm that translates the difference information between reads and the reference genome into an input matrix for a deep learning model instead of a one-hot encoder. 2) TextCNN learning and training. 3) Integration of MS as prior probabilities. We conducted several experiments on simulated data and a dataset of esophageal cancer (ESCC) SNVs. The results show that DETexT can filter out the false-positive variant candidates at very low read depths, which may provide support for liquid biopsy technology for cancer.
2 Materials and methods
2.1 Overview of DETexT
The input to the proposed method is a sequence alignment map (SAM) file, the built-in reference is the human genome 19 (hg19), and the output is a variant calling format (VCF). The specific pipeline of the proposed method is shown in Figures 1, 2 and can be divided into three parts: 1) encoding of the read-pair difference representation, 2) learning and training of the TextCNN, and 3) integration of the MS as prior probabilities.
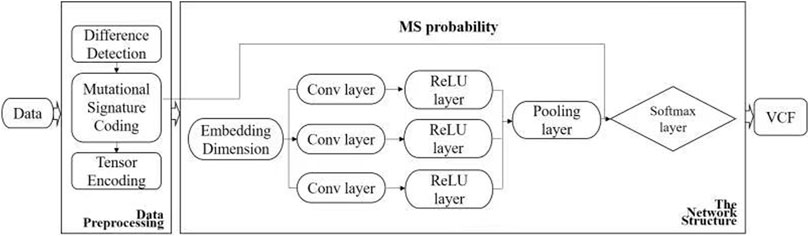
FIGURE 1. Workflow of DETexT. The workflow of DETexT can be divided into two parts: data pre-processing and network structure. 1) Data pre-processing includes different base detection, mutational signature encoding, and tensor encoding. 2) The network structure consists of three convolution filters, each followed by a ReLU layer. The mutational signature probabilities are applied before the Softmax layer. The output is the true SNV after the false positive filter.
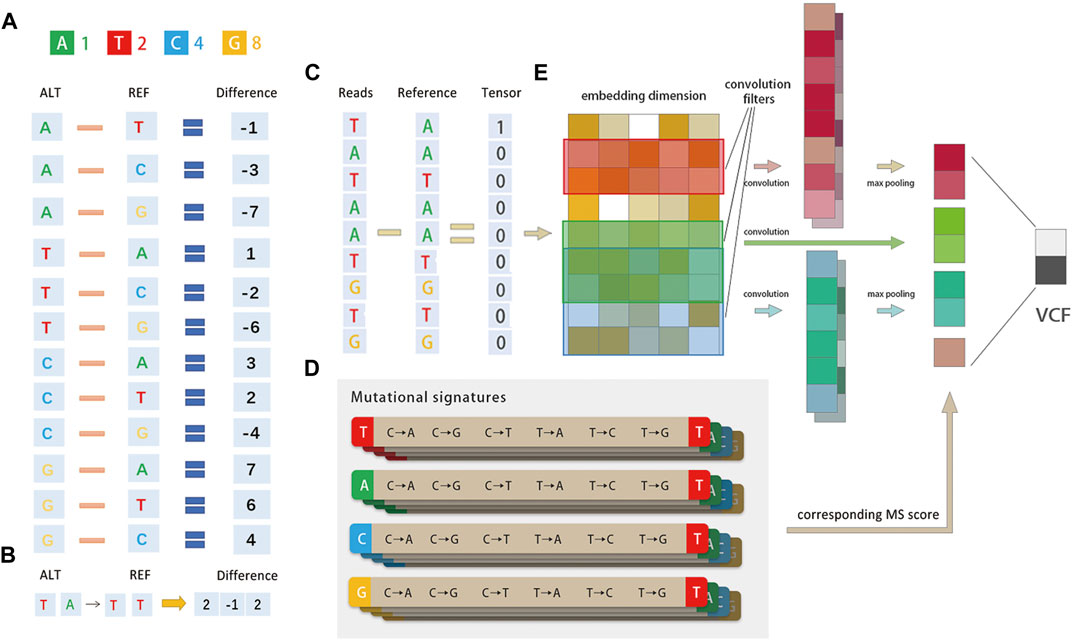
FIGURE 2. Method diagram. (A)Diagrammatic representation of the base difference. Bases A/T/C/G are converted to 1/2/4/8 codes and for each read, and the difference between it and the corresponding position of the built-in reference is calculated. The mutational signature is encoded by tri-nucleotide structure, for example, if a position is A → T, the corresponding position is encoded as 1–2 = −1. (B)Representation of the tri-nucleotide structure of the mutational signature. The mutational signature is encoded by tri-nucleotide structure; if a position has T (A→T) T, the corresponding position is encoded as (2, −1, 2). (C) Schematic representation of the entire pipeline. The network structure consists of three convolution filters, each followed by a ReLU layer. The mutational signature probabilities are concatenated before the Softmax layer. The output is the true SNV with false positives filtered. (D) There are 96 possible mutations as we incorporated six classes of base substitution: C > A, C > G, C > T, T > A, T > C, and T > G (referred by a pyramiding of mutated Watson–Crick base pair) and base information for the 5′ and 3′ bases immediately adjacent to each mutated base. (E) DETexT converts the reads of the variance representation (C) into the embedding_size dimension (E) through the embedding operation of the tensor.
2.2 Difference detection and tensor encoding
DETexT devised the coding principle for the difference representation of sequencing data, as shown in Figure 2A. The read bases A/T/C/G are converted to 1/2/4/8, and the difference between each read base and the corresponding position of the built-in reference is calculated by numerical subtraction. For example, if a position has A → T, the corresponding position code is 1–2 = −1. One-hot CNNs may not be suitable for classification when one has a small to medium-sized training dataset, possibly due to sparsity: the reads of NGS are perhaps too brief to provide sufficient information for such high dimensional encoding (Zhang and Wallace., 2015). Compared to the one-hot coding algorithm used in existing methods, the replaced bases (−1, −2, −4, ±3, ±6...) may differ from the representation of ATCG bases (1/2/4/8), which retains the information before and after the base substitution. In addition, the information of one of the original bases around the variable point is also retained [i.e., encoding T (A→T) T as ( 2, −1, 2)], as shown in Figure 2B.
The user is supported to set the vector dimension manually according to the length of the input reads, with a default value of 100 (bps). DETexT converts the reads of difference representation (Figure 2C) into the embedding_size dimension (Figure 2E) by the embedding operation of the tensor. Here, the number of the embedding is 20 and the embedding size is 5.
2.3 Model selection and architecture
SNV detection on a single read is essentially a binary classification problem, that is, whether the difference between a read and the reference is a genuine mutation or an error that needs to be screened. Compare to traditional neural networks such as MLP, convolutional neural network has the characteristic of sparse interactions, parameter sharing, and equivariant representations. TextCNN (Sahraeian et al., 2019) is a successful application of image CNN networks on text data with a simple network structure, small number of parameters, low computational effort, and fast training. It can automatically combine and filter N-gram features to obtain semantic information at different levels of abstraction. These make it suitable for processing the sequence data. On a single-card v100 machine, it can train 1.65 million data, iterate 260,000 steps, and converge in about half an hour. Inspired by these, DETexT has proposed an attempt to detect SNV with the TextCNN model.
2.3.1 Implementation details
The specific structure and parameters of DETexT are shown in Figure 2E; Table 1, and described below. The input of the TextCNN is the embedding layer computed in Section 2.2. We start with tokenized mutation candidate reads, which are then transformed into a vector representation of each token. The model architecture is a slight variant of the TextCNN architecture (Zhang and Wallace. 2015). The convolution layer here is one-dimensional. DETexT depicts three filter region sizes, namely, 2, 3, and 4, with one filter size of 100 and a step size of 1. Each filter has two output channels. DETexT uses rectified linear unit (ReLU) as the activation function and sets the pooling operation to 1-max pooling. The dropout rate is 0.5 and the l2 norm constraint is 3. The Softmax activation function is used to calculate the probability of each category (true variant or false positive).
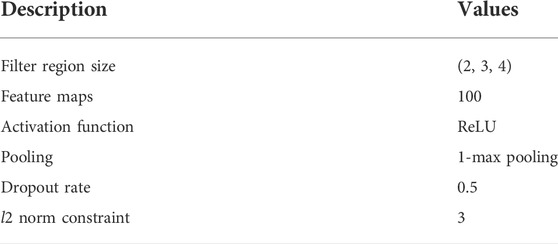
TABLE 1. Baseline configuration.
2.3.2 Feature extraction
We describe here the process of feature extraction. Suppose there is a filter parameterized by a weight matrix w with region size h, then w will contain h·d parameters to be estimated. DETexT uses filters with widths equal to the read vectors dimension (d = 100) and simply varies the ‘height’ of the filter as the region size of the filter. Furthermore, since the embedding size is 5, we set the three region sizes (h) to (2, 3, 4), as shown in Figure 3.
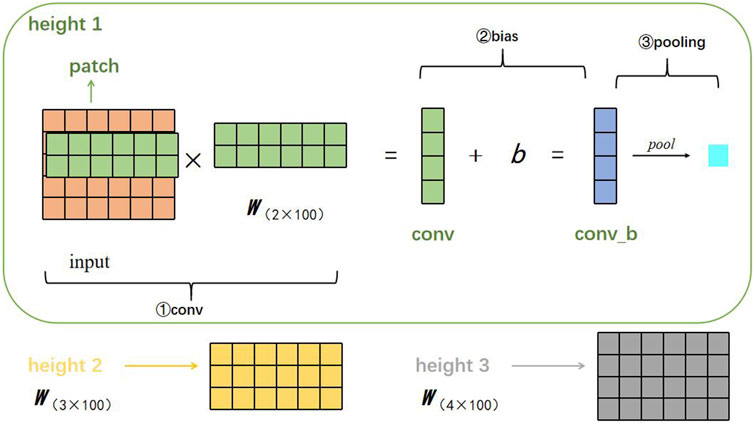
FIGURE 3. Visualization of the corresponding convolution calculation steps.
We use
where
The feature map can be presented as follows:
We then apply a max-overtime pooling operation over the feature map and use the maximum value
2.3.3 Regularization
These features form the penultimate layer and are passed to a fully connected softmax layer whose output is the probability distribution of the labels. For regularization, DETexT employs dropout in the penultimate layer to constrain the l2 norms of the weight vectors (Hinton et al., 2012). The dropout method prevents the hidden units from co-adaptation through random rejection, that is, a certain proportion of hidden units are set to zero during forward backpropagration. That is, given the penultimate layer
where
2.4 Integration of mutational signatures
A third innovation of DETexT is the integration of mutational signatures (MSs), which are mutations types shared between patients or in local sequence environments that can reveal information about the somatic mutational process such as slight infidelity inherent in the DNA replication machinery, exposures to exogenous or endogenous mutagens, enzymatic modification, exposures to DNA repair defects or abnormalities maintenance (Lawrence et al., 2013; Alexandrov et al., 2020). MS have been tentatively identified by analyzing 4,938,362 somatic substitutions and small insertions/deletions (InDels) from the mutational catalogs of 7,042 primary cancers of 30 different classes (507 from whole genome and 6,535 from exome sequences) with the nonnegative matrix factorization (NMF) algorithm (Alexandrov et al., 2013).
There are 96 possible mutations as we incorporated six classes of base substitution: C > A, C > G, C > T, T > A, T > C, and T > G (referred to by the pyramiding of the mutated Watson–Crick base pair) as well as information on the 5′ and 3′ bases immediately adjacent to each mutated base, as shown in Figure 2D) (Alexandrov et al., 2013). The 96 substitution classifications are particularly useful for distinguishing MS that give rise to the same substitution but in different sequence contexts. Mutational processes from different etiologies are active during cancer development and can be identified by MS due to their unique mutational pattern and specific activity on the genome. The results reveal the diversity of mutational processes during the development of cancer and have potential implications for understanding cancer etiology (Tianyuan Liu et al., 2022), prevention (Aaron Chevalier et al., 2021), and therapy (Drews et al., 2022).
The Catalogue Of Somatic Mutations In Cancer (COSMIC) database is the world’s largest and most comprehensive resource for exploring the impact of somatic mutations on human cancer. Extensive statistical analyses have shown that variable tri-nucleotide structures have distributional characteristics and that the probability of occurrence of sharp base substitution is not an equal probability event (Helleday et al., 2014; Roberts and Gordenin, 2014). The incidence of somatic mutations varies widely between and within cancer categories, from about 0.001 per megabase (Mb) to over 400 per Mb. Certain childhood cancers [Pilocytic astrocytoma (∼0.001), medulloblastoma (∼0.01), and kidney chromophobe (∼0.1)] have the fewest mutations, whereas cancers associated with chronic mutagenic exposures such as lung (tobacco smoking, ∼100) and malignant melanoma (exposure to ultraviolet light, ∼400) exhibited the highest prevalence (Alexandrov et al., 2013). This variation in mutation prevalence can be attributable to differences in cell lineage duration between the fertilized egg and the cancer cell being sequenced and/or differences in somatic mutation rates during all or part of that cell lineage (Stratton et al., 2009). From the results of the probability statistics, the probability of occurrence of A (C > G) G was 0.005275, the lowest of the 96 classifications, whereas T (C > T) A was the highest at 0.41994, a 79.6-fold difference, as shown in Figure 4. In conclusion, mutational signatures are summaries of mutation occurrence rules extracted from large-scale cancer data, and it is necessary to judge variants with mutational signatures suggesting high probability among candidate mutations as true mutations, rather than false positives.
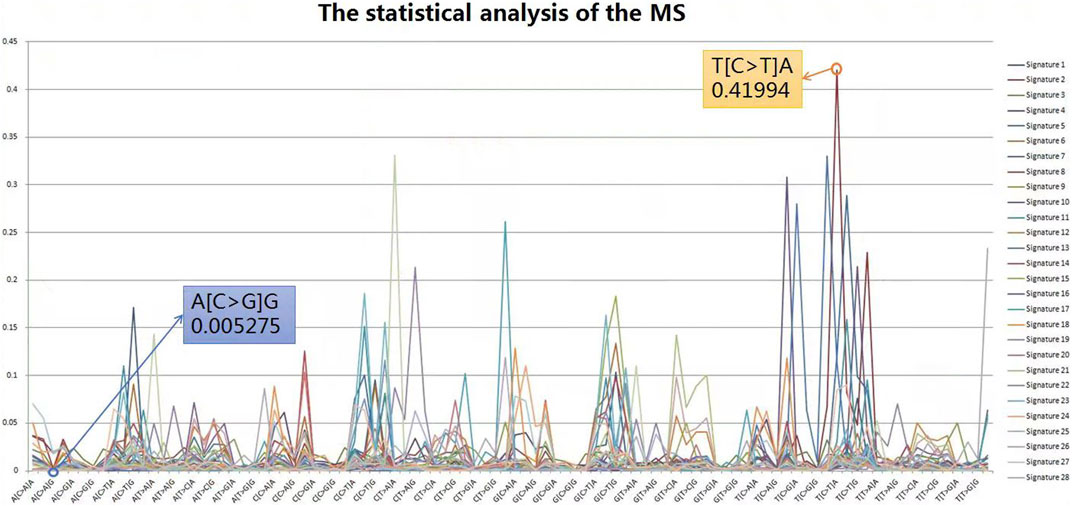
FIGURE 4. Statistical analysis of the MS. From the results of probability statistics, A (C > G) G has the lowest probability of occurrence among the 96 classifications at 0.005275 while T (C > T) A has the highest at 0.41994, a difference of 79.6 times.
DETexT downloaded the mutation signature probability from the COSMIC, traversed the probability value of the 96 classifications, and integrated the maximum occurrence probability of each mutational signature as prior knowledge into the deep learning framework to help filter mutation false positives, as shown in Figure 2C. DETexT matches the candidate mutation to 96 types and obtains the probability values from the COSMIC. We took the prior value of the maximum occurrence probability, added it to the convolution kernel processing result, extended the convolution kernel result to one dimension, and put them into a Softmax layer for training to help obtain the classification probability values. Section 3 presents the experimental results demonstrating that the design can greatly improve the accuracy of mutation detection. When there is no agglomeration effect of read pairs at very low read depth, this method can maximize the retention of essential information about candidate mutation and filter out the false positives. Furthermore, during the integration of mutational signatures, we tested the difference between adding the probability directly and multiplying by a coefficient, considering the numerical difference between the probability value and convolution kernel results, and determined the coefficient to seven based on experimental verification, as shown in Section 3.3.1.
3 Experiments and results
We conducted a series of experiments on several simulated and real datasets covering esophageal cancer (ESCC) and benchmark datasets to validate the performance of DETexT. How we obtained the data and performance is described in detail in each section. In Section 3.1, we describe the datasets and conduct experiments on test and training datasets of different sizes. In Section 3.2, we test the performance of DETexT on 10 simulated datasets and compare it with existing advanced detection software and algorithms. In Section 3.3, we test the performance of the DETexT on ESCC real datasets. In Section 3.3.1, we evaluate the effect of integrating MS. In Section 3.3.2, we perform a sensitivity analysis on regularization. In Section 3.3.3, we evaluate the capability of DETexT in different specific chromosomes and add experiments to compare the proposed method with several classical machine learning algorithms.
3.1 Experiments on test and training sets of different sizes
To validate the performance of DETexT against an explicit evaluation benchmark, we tested it on a simulated dataset. The simulated data were obtained from the Genome in a Bottle (GIAB) published authentic structural variant marker dataset, a NIST-hosted consortium dedicated to the authoritative characterization of benchmark human genomes, which currently has characterized a pilot genome from the HapMap project (NA12878/HG001) and two son/father/mother trios of Ashkenazi Jewish and Han Chinese ancestry from the Personal Genome Project (Zook et al., 2020). Highly reliable variant annotation files are available from official public data sources and are widely used for the evaluation or testing of variant detections (Poplin et al., 2018; Cameron et al., 2019). We downloaded the candidate variant results for HG002 and its families HG003 (father) and HG004 (mother) as a source for the simulation training dataset. The sample NA12878 (HG001) of the descendants of the CEU trio was downloaded for inference. To construct the training sample dataset, we randomly selected 10,000 sample data from each category (both true variants and false positives) of each original dataset and obtained labels for true positives and false positives by comparing with the original VCFs to form a subset of 20,000 sample data with labels.
We conducted experiments on different proportions of the training and test set. We used scikit-learn’s StratifiedKFold function to slice the training and test set (n-fold cross-validation), and the results are shown in Figure 5. The light blue curve in the figure indicates the experimental results when 10% of the samples of the dataset are used as the training set and 90% as the test set, light yellow indicates that 20% of the dataset is used for training and 80% for testing, and light green indicates 30% of the dataset is used for training and 70% for testing. Light red indicates 40% for training and 60% for testing, light purple indicates 50% as the training set and 50% as the testing set, brown indicates 60% as the training set and 40% as the testing set, and dark blue indicates 70% of the data as the training set and 30% as the testing set. The curve highlighted in dark purple indicates the average value, and the gray area indicates the value space of the seven results. It can be seen that the AUC gradually increases as the proportion of the training set increases.
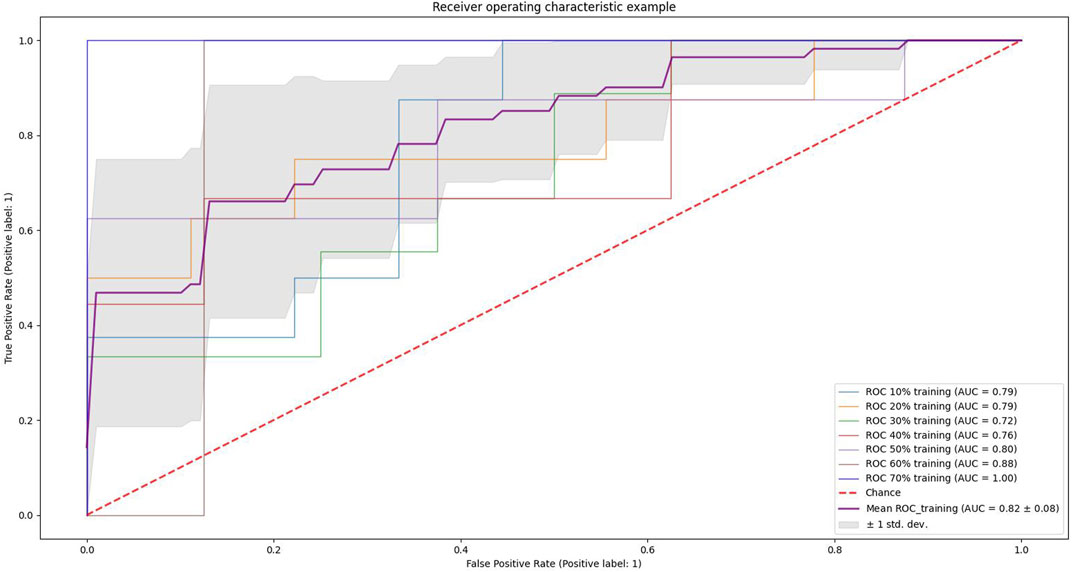
FIGURE 5. Example of receiver operating characteristics. The light blue curve in the figure indicates the results of the experiment when 10% of the dataset samples are used as the training set and 90% as the test set, light yellow indicates 20% of the dataset is used for training and 80% for testing, light green indicates 30% of the dataset is used for training and 70% for testing, light red indicates 40% for training and 60% for testing, light purple indicates 50% as the training set and 50% as the testing set, brown indicates 60% as the training set and 40% as the testing set, and dark blue indicates 70% of the data as the training set and 30% as the testing set. The curve highlighted in dark purple indicates the average value, and the gray area indicates the value space of the seven results.
3.2 Comparative experiments on simulated data
To simulate data with low read depths, we extract read pairs from the same read pairs in the BAM file to simulate different coverage rates. Based on the position information, one read pair matching the same position is extracted to simulate a ×1 read depth, two to simulate ×2 read depth, and so forth. Once the new BAM/SAM file was obtained, the variant identification was then re-run, and those with the same mark as the real variant are true positives and those with different marks are false positives. We simulated sequencing samples with ×1 read depth and extracted 20,000 candidate mutations each time to form the test data, and a total of eleven simulations were performed to obtain 1 training dataset and 10 test datasets. The reference genome here is the human genome 19. We use classical data sampling methods to balance positive and negative categories: under-sampling a large amount of data in a category (classical easensemble) and over-sampling a small amount of data in a category (classical SMOTE). For each simulated dataset, the positive and negative categories are balanced. We chose accuracy, recall, precision, and F1-score as evaluation criteria. The experimental results for the 10 datasets are shown in Table 2.
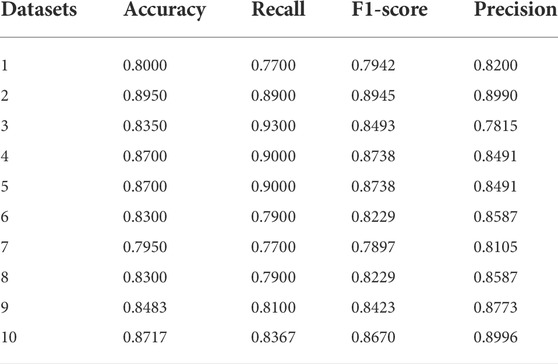
TABLE 2. Detection performance on simulated datasets.
We compared DETexT with the well-established and popular SNV detection algorithms MuTect (Cibulskis et al., 2013), freebayes (Garrison and Marth, 2012), and SiNVICT (Kockan et al., 2017). MuTect is a reliable and accurate identification of somatic point mutations in NGS data and is known for sensitive detection in impure and heterogeneous cancer samples. Freebayes is a Bayesian genetic variant detector designed to look for small polymorphisms, especially SNPs, indels, MNPs (multi-nucleotide polymorphisms), and complex events (composite insertion and substitution events) with lengths smaller than short-read sequencing alignments. SiNVICT is an ultrasensitive detection of single nucleotide variants and indels in circulating tumor DNA, with advanced and promising applications. The comparison results on 10 test datasets are shown in Table 3. The results show that similar methods perform poorly at very low read depths, whereas DETexT achieved over 80% accuracy.
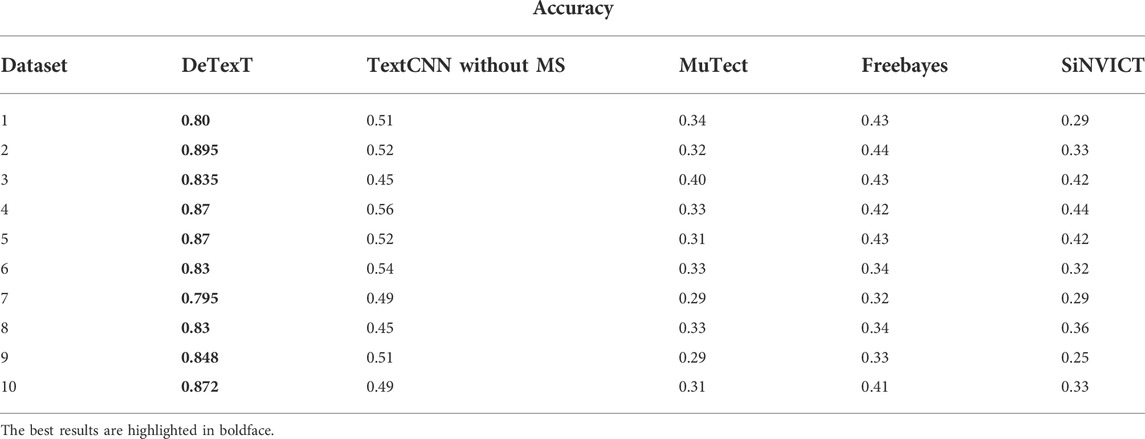
TABLE 3. Comparison result with MuTect, freebayes, and SiNVICT.
3.3 Experiments on the esophageal cancer datasets
We applied DETexT to SNV detection of esophageal cancer (ESCC), the seventh most common and sixth deadliest cancer in the world. The largest ESCC project sequenced 508 ESCC samples by whole-genome sequencing, with an average sequencing depth of ×98 for tumors and ×44 for normal tissues. The 7,630,294 SNVs and indels associated with ESCC cancer species were accurately identified (Cui et al., 2020). We selected the final results published by the project, implanting all 7,454,579 SNVs into the corresponding positions in the reference genome (hg19). We used the NGS simulator GSDcreator (Wang et al., 2019) to simulate the sequence data, which included simulated sequencing errors, amplification bias, unique molecule indices, adapter artifact, quality score distribution, GC content, population polymorphisms, sequencing depth distribution, and insert-size distribution. We simulated paired-end sequencing with 100-bps sequencing read length. We set the sequencing error rate to 0.001, the amplification error rate to 3.0, the template length to (0, 600), and normal bases varying in (33, 36). The sequencing error base was in the interval (7, 19).
We generated sequencing sample data by seeding the ESCC SNPs into the hg19 reference genome using read pair generation software to simulate sequencing depths of 1–8×. We used DETexT for SNP variant detection discrimination and the candidate variants obtained by the string position matching algorithm constitute the test set in this section. Corresponding to a sequencing read pair depth of 1–8×, 20,000 candidates were selected for each sample to form a total of 8 test sets, and another dataset with 20,000 data was extracted from 5× samples as the training set. In addition, we added a comparison with a textCNN model that does not integrate mutation signatures. The results show that DETexT can accurately detect the SNV as shown in Figure 6, with a 10 percentage points improvement in accuracy compared to the other four methods.
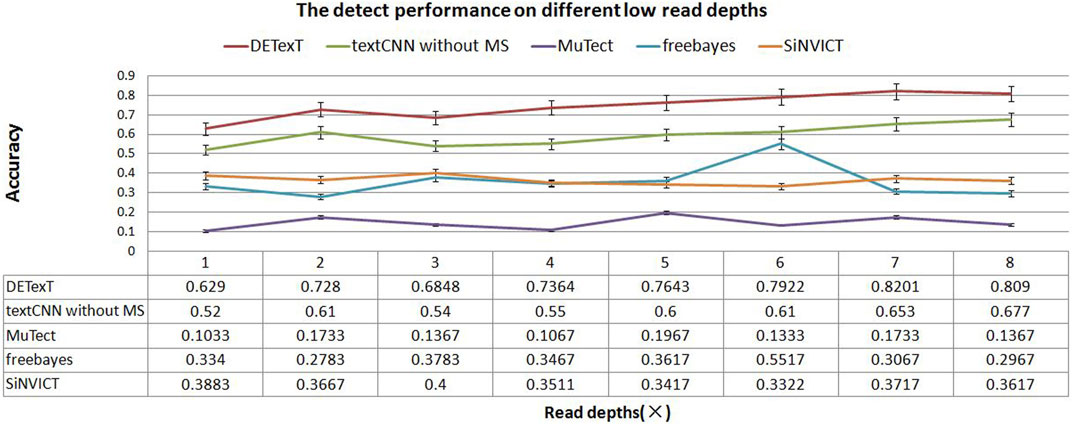
FIGURE 6. Detection performance at different low read depths. The experimental results of DETexT were compared with those of textCNN without MS, MuTect, freebayes, and SiNVICT on datasets with read depths of 1–8×.
3.3.1 Experiments of mutational signatures
As previously described, the proposed method selects the maximum probability of occurrence in COSMIC MS multiplied by a fixed coefficient and adds it to the previous layer before Softmax to assist in discriminative classification. A total of two sets of experiments were performed to test the effect of mutation signatures. The first experiment was a sensitivity experiment on the coefficients, and the second compared the proposed method with the integration of only the MS probabilities of individual cancers. Here, the training set is the 5× training set presented in Section 3.3, and the test set is a concatenated set of the 1–8× ESCC sample datasets in Section 3.3 (keeping all candidates appearing in the 8 datasets and removing duplicate terms).
The first experiment was a sensitivity experiment of the coefficients. There is a difference in numerical dimensional between the features extracted by the deep network and MS probability, so we added parameters and used the results of multiplying the parameters with the MS probabilities to incorporate the feature results. We conducted parameter comparison experiments and recorded the results of parameter variation in the interval (0,10), as shown in Table 4A. Experiment 1 focused on the incorporation of the multiplied parameters, and we found that the better performance was achieved when the coefficient was 7. Iters denotes the number of iteration in which the model converged.
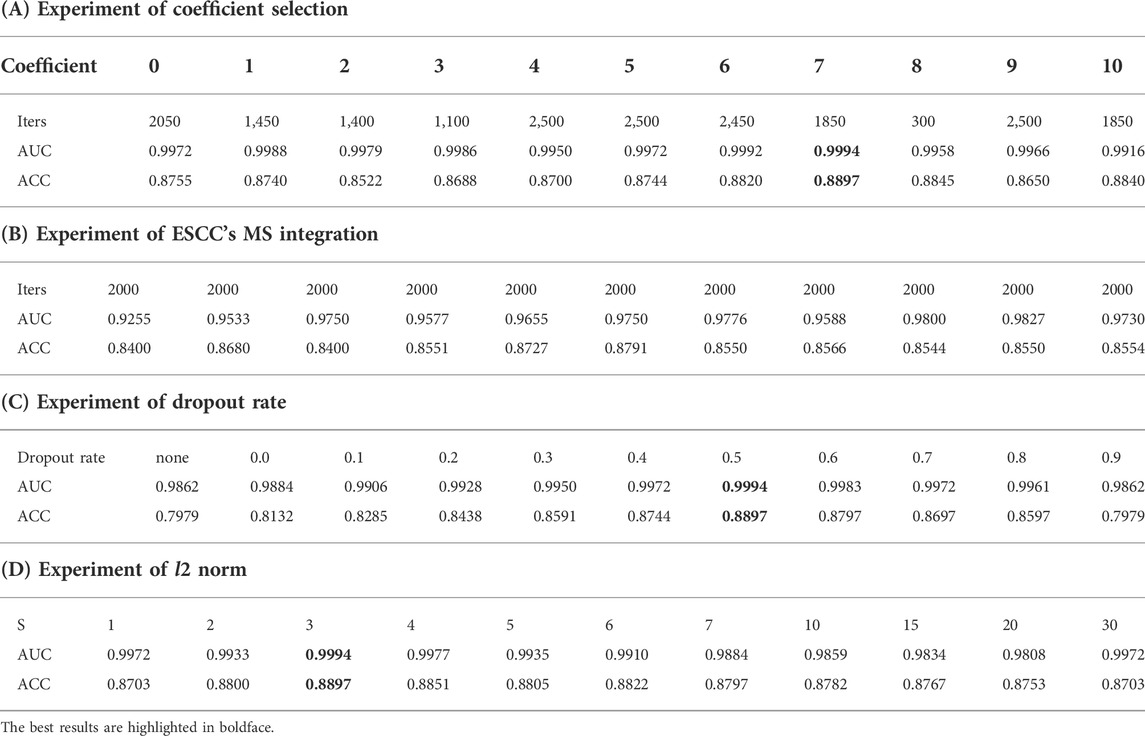
TABLE 4. Experiments of MS and normalization.
In addition, we tested the effect of different probability selection methods on the validity of the model in Experiment 2. The results of selecting only MSs associated with ESCC for integration were compared with those of extracting the maximum probability without differentiating cancer types. Our analysis of the literature and data yielded MS specifically for ESCC cancer types as COSMIC MS 1, 2, 6, and 17, with percentages of 48%, 11%, 14%, and 27%, respectively, as shown in the pie chart in Figure 6 (Alexandrov et al., 2013). The ESCC project also showed that 11 MSs (S1–S11) were identified in the 508 WGS cohort, and nine signatures corresponded to mutation signatures in the COSMIC database. S1 and S2 have related to APOBEC (apolipoprotein B mRNA editing enzyme, catalytic polypeptide-like) activity, S3 with DNA mismatch repair deficiency (dMMR), S4 with age, S8 with aristolochic acid, S9 with alcoholic consumption, and S11 with homologous recombination deficiency. S6 was similar to COSMIC signature S17, and recent studies implicated its association with gastric acid reflux (Cui et al., 2020). We plotted the probability results for MS1, 2, 6, and 17 against the maximum probability values in cosmic in Figure 7 and compared the results using the maximum probabilities from the entire cosmic library using the maximum values in MS1, 2, 6, and 17, which are more relevant to ESCC, as shown in Table 4B. The results show that the differences between the two methods are not significant for the reasons that can be seen in Figure 7, where the maximum probability values in MS1, 2, 6, and 17 do not differ significantly from the COSMIC library, but there is also some difference in accuracy from the results.

FIGURE 7. MS probability of ESCC in COSMIC. MS statistics specific to ESCC and comparison with the COSMIC schematic. ESCC has four MSs, COSMIC MS 1, 2, 6, and 17, accounting for the probability statistics of the 96 tri-nucleotide structure results of MS 1, 2, 6, and 17, as shown in the pie. Cosmic_max indicates the maximum value of the cosmic library records corresponding to the 96 tri-nucleotide results.
3.3.2 Experiments of regularization
In total, two common regularization strategies for CNNs are dropout and l2 norm constraints. As mentioned earlier, we set the dropout rate (p) to 0.5 and the l2 norm constraint (s) to 3 based on the sensitivity analysis. Here, we describe the experimental details of the regularization. The “dropout” was applied to the penultimate layer of inputs. We experimented with dropout rate ranging from 0.0 to 0.9, fixing the l2 norm constraint to 3. The results are shown in Table 4C. We also report the accuracy achieved when we remove both dropout and the l2 norm constraint (i.e., when no regularization is performed), denoted by “None”. In addition, we considered the effect of imposing the l2 norm on the weight vectors that parameterize the Softmax function. We recall that the l2 norm of a weight vector is linearly scaled to a constraint s when it exceeds this threshold, so a smaller s implies stronger regularization. (Like dropout, this strategy is applied only to the penultimate layer.) We show the relative effect of varying s in Table 4D, where we have fixed the dropout rate to 0.5. From the results, one can see that non-zero dropout rates can help (though very little) at some points from 0.1 to 0.5. But imposing an l2 norm constraint generally does not improve performance much. We see that dropout on the convolution layer helps little, and large dropout rate may hurts performance.
We also plotted the loss curves and the learning curves, as shown in Figure 8, to demonstrate that our model can converge quickly without overfitting. The training set is same as the Section 3.3.1, being the ×5 training set introduced in Section 3.3 and the test set is the concatenated set of 1–8× ESCC sample datasets from Section 3.3 (retaining all candidates appearing in the eight datasets and removing duplicate terms). The iters is the number of iterations, indicating the number of iterations for which the model converges. The small graph on the left shows the loss curves, with the blue curve (loss_t) indicating the loss of the training set and the red curve (loss_v) indicating the loss of the test set. The small graph on the right shows the learning curve, with the red curve (ACC on training set) indicating the ACC of the training set and the blue curve (ACC on test set) indicating the ACC of the test set.
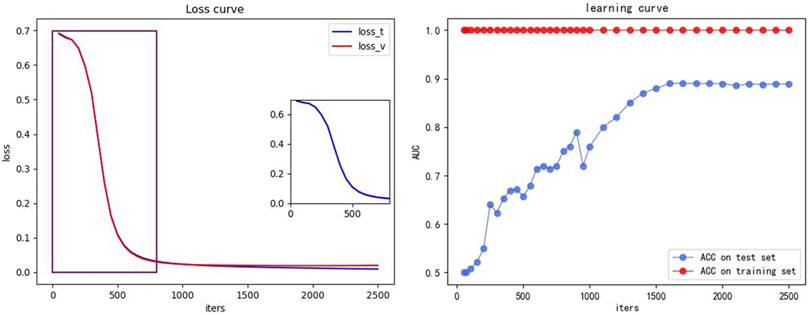
FIGURE 8. Loss and learning curve. The small graph on the left shows the loss curve, the blue curve (loss_t) indicates the loss of the training set, and the red curve (loss_v) indicates the loss of the test set. The small graph on the right shows the learning curve, the red curve (ACC on training set) indicating the ACC of the training set, and the blue curve (ACC on test set) indicates the ACC of the test set.
3.3.3 Experiments on different chromosomes
To further explore the effectiveness of the proposed method, we compared its performance on different chromosomes, as shown in Figure 9 and Table 5. We randomly selected 20,000 reads from each chromosome data on the 1–8× dataset described in 3.3 to form 24 test datasets, additionally extracted 20,000 data on chromosome 2 as the training data set, and calculated the performance of the model on these 24 test sets. In addition, we tested the proposed method with another pooling algorithm and other machine learning algorithms, including decision trees, gradient boosted decision trees (GBDT), random forests, and support vector machines (SVM). The accuracy results are shown in Table 6. The results show that DETexT has good overall performance, with slightly different results for mutation signatures on different chromosomes. On chromosomes 8, 16, and 19, the effect of MS tends to be negative, whereas on the other chromosomes, positive effects of integrated MS can be seen, especially on chromosome 22.
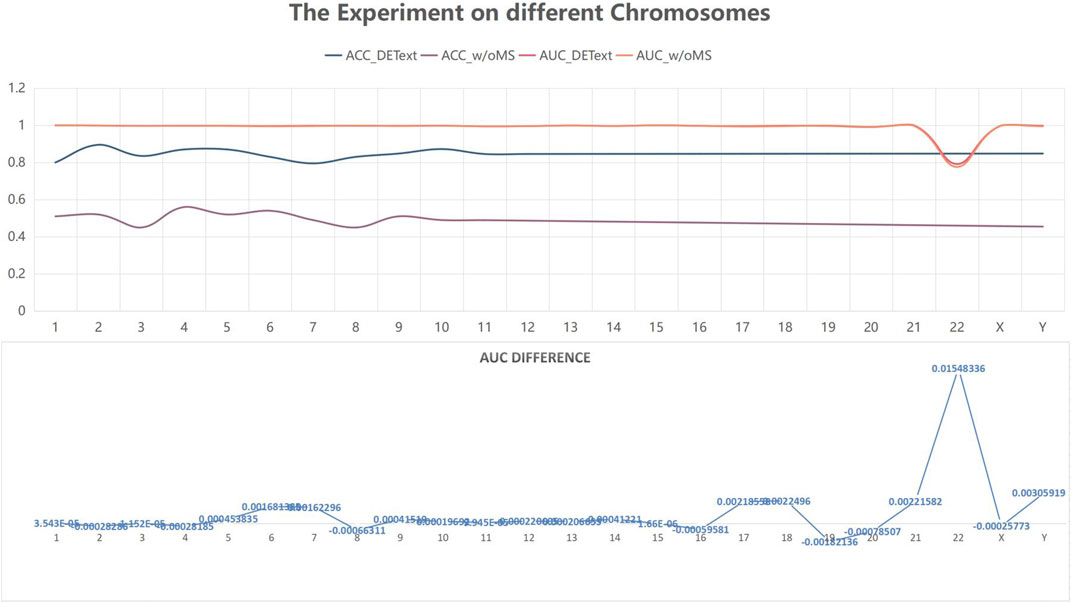
FIGURE 9. Experiment on different chromosomes. The effect of mutational signatures on each chromosome. The overall performance of the method was good, whereas the effects of mutational signatures on different chromosomes are slightly different.
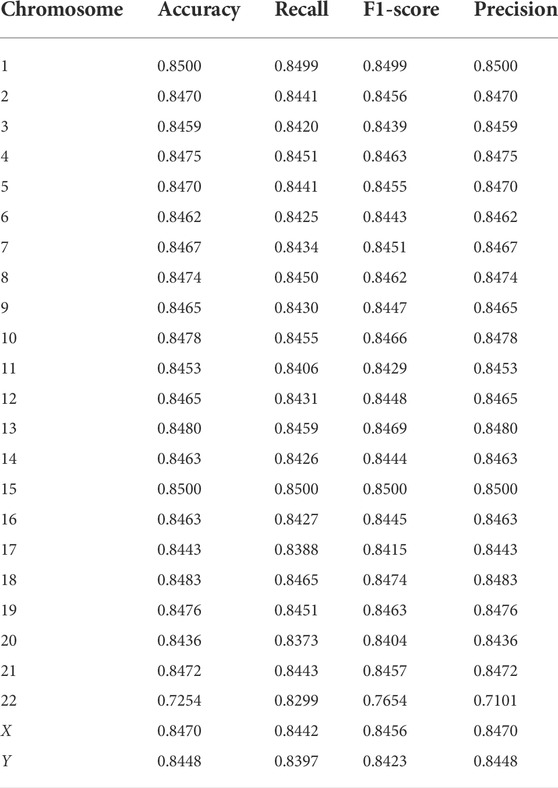
TABLE 5. Detection performance on a real dataset and shown in each chromosome.
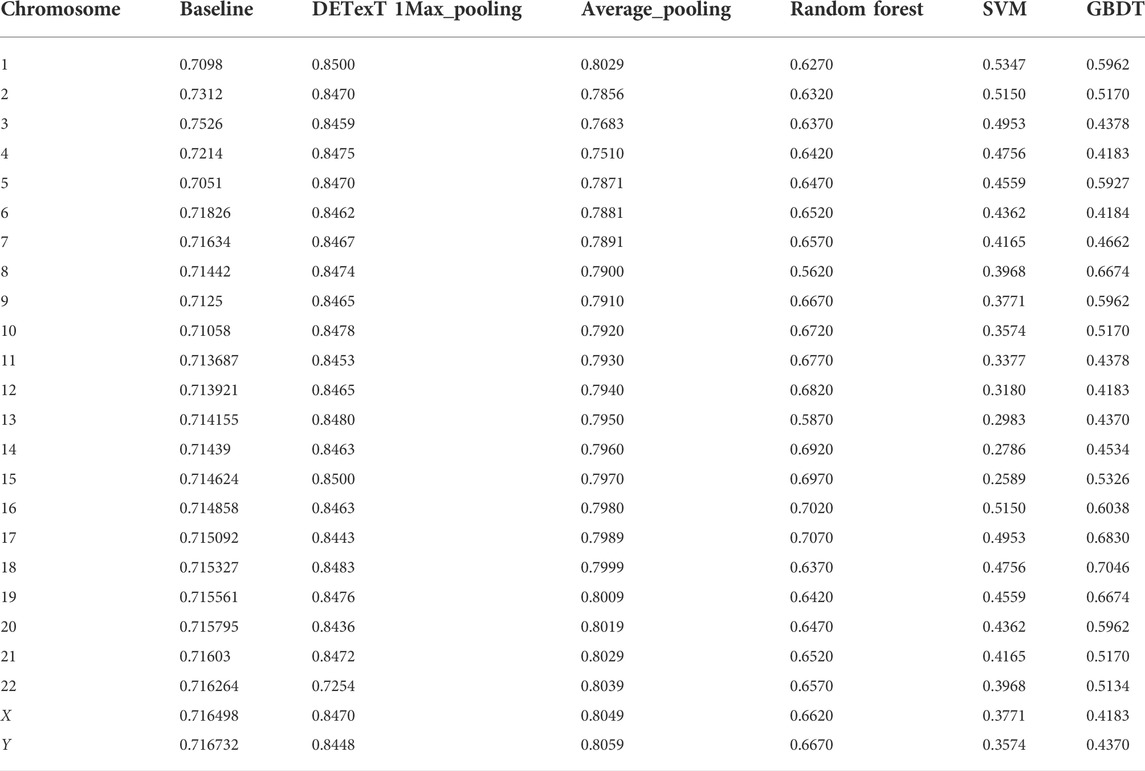
TABLE 6. Comparison experiment with average_pooling and traditional machine learning algorithms.
4 Discussion and conclusion
This work focuses on SNV detection for low read depths in NGS data, but can also be used for high depth calls, and performs comparatively well compared to other advanced methods with a big emphasis on utilization when looking at low depth WGS. Compared with existing methods based mainly on extracting statistical results from correlated features of read pairs, 1) the proposed differential representation ensures maximum utilization of base sequence information and differential information on the one hand and minimizes storage and operation costs on the other. 2) The integration of the mutational signature is enlightening for distinguishing true SNV from false positives. We have conducted extensive experiments, and the results show that the proposed method can accomplish SNV detection at low read depth with low cost and high efficiency.
Furthermore, although the structure and parameters of the proposed method are relatively clear, the deep learning model is still a black box and/or the interpretability of the model is worth investigating. Our study highlights the importance of using mutational signatures, and in experiments testing the effect of MS on different chromosomes, we have noticed that the effects of MS on different chromosomes was different. We cannot assert that the effect of the proposed method will not change at all in other cancer types or new datasets, which suggests that more work on the model with larger datasets is still worth exploring. We aim to collect more data to explore the effect of MS on variant detection and expand the cancer species data in the future work.
Data availability statement
The original contributions presented in the study are included in the article/Supplementary Material; further inquiries can be directed to the corresponding author.
Author contributions
TZ conceived and designed the experiments, performed the experiments, and wrote the manuscript.
Acknowledgments
We thank reviewers for their helpful comments.
Conflict of interest
The authors declare that the research was conducted in the absence of any commercial or financial relationships that could be construed as a potential conflict of interest.
Publisher’s note
All claims expressed in this article are solely those of the authors and do not necessarily represent those of their affiliated organizations, or those of the publisher, the editors, and the reviewers. Any product that may be evaluated in this article, or claim that may be made by its manufacturer, is not guaranteed or endorsed by the publisher.
Supplementary material
The Supplementary Material for this article can be found online at: https://www.frontiersin.org/articles/10.3389/fgene.2022.943972/full#supplementary-material
Abbreviations
ACC, accuracy; COSMIC, Catalogue Of Somatic Mutations In Cancer; CNN, convolutional neural network; cfDNA, cell-free circulating DNA; ctDNA, cell-free tumor DNA; MS, mutational signature; NMF, nonnegative matrix factorization; NGS, next-generation sequencing; PCAWG, Pan-Cancer Analysis Of Whole Genomes; ROC, receiver operating characteristic; ReLU, rectified linear unit; SNV, single nucleotide variant; SAM, sequence alignment map; SV, structural variant; TCGA, the cancer genome atlas; VAF, variant allelic frequency; VCF, variant calling format.
References
Al-Katib, A. M., Ebrahim, A. S., Kandouz, M., Zaiem, F., Raufi, A., Ebrahim, S., et al. (2020). Isolation and characterization of a CD34+ sub-clone in B-cell lymphoma. Oncotarget 11 (2), 148–160. doi:10.18632/oncotarget.27415
Alba, M. R. D., Bustamante-Aragonés, A., Perlado, S., Trujillo-Tiebas, M. J., Díaz-Recasens, J., Plaza-Arranz, J., et al. (2012). Noninvasive prenatal diagnosis of monogenic disorders. Expert Opin. Biol. Ther. 12, S171–S179. doi:10.1517/14712598.2012.674509
Alexandrov, L. B., Kim, J., Haradhvala, N. J., Huang, M. N., Ng, A. W. T., Wu, Y., et al. (2020). The repertoire of Mutational Signatures in human cancer. Nature 578 (7793), 94–101. doi:10.1038/s41586-020-1943-3
Alexandrov, L. B., Nik-Zainal, S., Wedge, D. C., Aparicio, S. A., Behjati, S., Biankin, A. V., et al. (2013). Signatures of mutational processes in human cancer. Nature 500 (7463), 415–421. doi:10.1038/nature12477
Cameron, D. L., Stefano, L. D., and Papenfuss, A. T. (2019). Comprehensive evaluation and characterisation of short read general-purpose structural variant calling software. Nat. Commun. 10, 3240. doi:10.1038/s41467-019-11146-4
Cashman, R., Zilberberg, A., Priel, A., Philip, H., Varvak, A., Jacob, A., et al. (2020). A single nucleotide variant of human PARP1 determines response to PARP inhibitors. NPJ Precis. Oncol. 4 (1), 10. doi:10.1038/s41698-020-0113-2
Chevalier, A., Yang, S., Khurshid, Z., Nathan, S., Tong, T., Huggins, J. H., et al. (2021). The mutational signature comprehensive analysis toolkit (musicatk) for the discovery, prediction, and exploration of mutational signatures. Cancer Res. 81 (23), 5813–5817. doi:10.1158/0008-5472.CAN-21-0899
Cibulskis, K., Lawrence, M. S., Carter, S. L., Sivachenko, A., Jaffe, D., Sougnez, C., et al. (2013). Sensitive detection of somatic point mutations in impure and heterogeneous cancer samples. Nat. Biotechnol. 31 (3), 213–219. doi:10.1038/nbt.2514
Cui, Y., Chen, H., Xi, R., Cui, H., Zhao, Y., Xu, E., et al. (2020). Whole-genome sequencing of 508 patients identifies key molecular features associated with poor prognosis in esophageal squamous cell carcinoma. Cell Res. 30 (10), 902–913. doi:10.1038/s41422-020-0333-6
Drews, R. M., Hernando, B., Tarabichi, M., Haase, K., Lesluyes, T., Smith, P. S., et al. (2022). A pan-cancer compendium of chromosomal instability. Nature 606, 976–983. doi:10.1038/s41586-022-04789-9
Esteva, A., Robicquet, A., Ramsundar, B., Kuleshov, V., DePristo, M., Chou, K., et al. (2019). A guide to deep learning in healthcare. Nat. Med. 25 (1), 24–29. doi:10.1038/s41591-018-0316-z
Fanfani, V., Citi, L., Harris, A. L., Pezzella, F., and Stracquadanio, G. (2021). The landscape of the heritable cancer genome. Cancer Res. 81 (10), 2588–2599. canres.3348. doi:10.1158/0008-5472.CAN-20-3348
Fang, L. T., Afshar, P. T., Chhibber, A., Mohiyuddin, M., Fan, Y., Mu, J. C., et al. (2015). An ensemble approach to accurately detect somatic mutations using SomaticSeq. Genome Biol. 16 (1), 197. doi:10.1186/s13059-015-0758-2
Helleday, T., Eshtad, S., and Nik-Zainal, S. (2014). Mechanisms underlying Mutational Signatures in human cancers. Nat. Rev. Genet. 15 (9), 585–598. doi:10.1038/nrg3729
Hinton, G. E., Srivastava, N., Krizhevsky, A., Sutskever, I., and Salakhutdinov, R. R. (2012). Improving neural networks by preventing co-adaptation of feature detectors. Neural and Evol. arXiv:1207.0580. doi:10.48550/arXiv.1207.0580
Kleftogiannis, D., Ho, D., Liew, J. X., Poon, P. S. Y., Gan, A., Ng, R. C. H., et al. (2020). Detection of genomic alterations in breast cancer with circulating tumour DNA sequencing. Sci. Rep. 10, 16774. doi:10.1038/s41598-020-72818-6
Kockan, C., Hach, F., Sarrafi, I., Bell, R. H., McConeghy, B., Beja, K., et al. (2017). SiNVICT: Ultra-sensitive detection of single nucleotide variants and indels in circulating tumour DNA. Bioinformatics 33 (1), 26–34. doi:10.1093/bioinformatics/btw536
Kothen-Hill, S. T., Zviran, A., Schulman, R. C., Deochand, S., Gaiti, F., Maloney, D., et al. (2018). “Will liao, nicolas robine. Deep learning mutation prediction enables early stage lung cancer detection in liquid biopsy,” in Proceedings of the Sixth International Conference on Learning Representations, Vancouver, BC, Canada, April 30–May 3, 2018.
Lawrence, M. S., Stojanov, P., Polak, P., Kryukov, G. V., Cibulskis, K., Sivachenko, A., et al. (2013). Mutational heterogeneity in cancer and the search for new cancer-associated genes. Nature 499 (7457), 214–218. doi:10.1038/nature12213
Liu, T., Yuan, L. L., and Wu, C. (2022). Resolving mutational signatures in cancer development. Cancer Cell 2022, 1535–6108. doi:10.1016/j.ccell.2022.05.011
Luo, R., Sedlazeck, F. J., Lam, T. W., and Schatz, M. C. (2019). Clairvoyante: A multi-task convolutional deep neural network for variant calling in 2 single molecule sequencing. Nat. Commun. 10, 998. doi:10.1038/s41467-019-09025-z
Poplin, R., Chang, P. C., Alexander, D., Schwartz, S., Colthurst, T., Ku, A., et al. (2018). A universal SNP and small-indel variant caller using deep neural networks. Nat. Biotechnol. 36, 983–987. doi:10.1038/nbt.4235
Roberts, S. A., and Gordenin, D. A. (2014). Hypermutation in human cancer genomes: Footprints and mechanisms. Nat. Rev. Cancer 14 (12), 786–800. doi:10.1038/nrc3816
Sahraeian, S. M. E., Liu, R., Lau, B., Podesta, K., Mohiyuddin, M., and Lam, H. Y. K. (2019). Deep convolutional neural networks for accurate somatic mutation detection. Nat. Commun. 10 (1), 1041. doi:10.1038/s41467-019-09027-x
Sims, D., Sudbery, I., Ilott, N. E., Heger, A., and Ponting, C. P. (2014). Sequencing depth and coverage: Key considerations in genomic analyses. Nat. Rev. Genet. 15 (2), 121–132. doi:10.1038/nrg3642
Stratton, M. R., Campbell, P. J., and Futreal, P. A. (2009). The cancer genome. Nature 458 (7239), 719–724. doi:10.1038/nature07943
Tarabichi, M., Demeulemeester, J., Verfaillie, A., Flanagan, A. M., and Konopka, T. (2021). A pan-cancer landscape of somatic mutations in non-unique regions of the human genome. Nat. Biotechnol. 39, 1589–1596. doi:10.1038/s41587-021-00971-y
Underhill, H. R. (2021). Leveraging the fragment length of circulating tumour DNA to improve molecular profiling of solid tumour malignancies with next-generation sequencing: A pathway to advanced non-invasive diagnostics in precision oncology? Mol. Diagn. Ther. 25, 389–408. doi:10.1007/s40291-021-00534-6
Wang, S., Wang, J., Xiao, X., Zhang, X., Wang, X., Zhu, X., et al. (2019). GSDcreator: An efficient and comprehensive simulator for genarating NGS data with population genetic information. in Proceedings of the 2019 IEEE International Conference on Bioinformatics and Biomedicine (BIBM). 18-21 November 2019, San Diego, CA, USA, doi:10.1109/BIBM47256.2019.8983192
Wilkerson, M. D., Cabanski, C. R., Sun, W., Hoadley, K. A., Walter, V., Mose, L. E., et al. (2014). Integrated RNA and DNA sequencing improves mutation detection in low purity tumors. Nucleic Acids Res. 42 (13), e107. doi:10.1093/nar/gku489
Xiao, W., Ren, L., Chen, Z., Fang, L. T., Zhao, Y., Lack, J., et al. (2021). Towards best practice in cancer mutation detection with whole-genome and whole-exome sequencing. Nat. Biotechnol. 39, 1141–1150. doi:10.1038/s41587-021-00994-5
Xu, F., Wang, W., Wang, P., Li, M. J., Sham, P. C., and Wang, J. (2012). A fast and accurate SNP detection algorithm for next-generation sequencing data. Nat. Commun. 3, 1258. doi:10.1038/ncomms2256
Yoon, K. (2014). Convolutional neural networks for sentence classification. Comput. Lang. arXiv preprint arXiv:1408:5882, 2014. doi:10.48550/arXiv.1408.5882
Zhang., Y., and Wallace., B. C., (2015). A sensitivity analysis of (and practitioners' guide to) convolutional neural networks for sentence classification. Comput. Lang. arXiv preprint arXiv:1510.03820. doi:10.48550/arXiv.1510.03820
Zheng, T., Wang, J., Xiao, X., Zhu, X., Zhang, X., Lai, X., et al. (2021). Abstract 255: TransVAF: A transfer learning approach for recognize genomic mutations with various tumor purity and clonal proportions. Cancer Res. 81, 255. doi:10.1158/1538-7445.AM2021-255
Keywords: extra-low read depth, variant detection, TextCNN, mutational signatures, SNV
Citation: Zheng T (2022) DETexT: An SNV detection enhancement for low read depth by integrating mutational signatures into TextCNN. Front. Genet. 13:943972. doi: 10.3389/fgene.2022.943972
Received: 14 May 2022; Accepted: 06 September 2022;
Published: 28 September 2022.
Edited by:
Jijun Tang, University of South Carolina, United StatesReviewed by:
Ruofan Xia, University of South Carolina, United StatesMercedeh Movassagh, Harvard University, United States
Copyright © 2022 Zheng. This is an open-access article distributed under the terms of the Creative Commons Attribution License (CC BY). The use, distribution or reproduction in other forums is permitted, provided the original author(s) and the copyright owner(s) are credited and that the original publication in this journal is cited, in accordance with accepted academic practice. No use, distribution or reproduction is permitted which does not comply with these terms.
*Correspondence: Tian Zheng, enQxMjM4OUBzdHUueGp0dS5lZHUuY24=