 Qi-en He1
 Li-yan Wang
 Kai Song
- 1School of Chemical Engineering and Technology, Tianjin University, Tianjin, China
- 2Tianjin First Central Hospital, Tianjin, China
Aberrant methylation is one of the early detectable events in many tumors, which is very promising for pan-cancer early-stage diagnosis and prognosis. To efficiently analyze the big pan-cancer methylation data and to overcome the co-methylation phenomenon, a MapReduce-based distributed and parallel-designed partial least squares approach was proposed. The large-scale high-dimensional methylation data were first decomposed into distributed blocks according to their genome locations. A distributed and parallel data processing strategy was proposed based on the framework of MapReduce, and then latent variables were further extracted for each distributed block. A set of pan-cancer signatures through a differential co-expression network followed by statistical tests was further identified based on their gene expression profiles. In total, 15 TCGA and 3 GEO datasets were used as the training and testing data, respectively, to verify our method. As a result, 22,000 potential methylation loci were selected as highly related loci with early-stage pan-cancer diagnosis. Of these, 67 methylation loci were further identified as pan-cancer signatures considering their gene expression as well. The survival analysis as well as pathway enrichment analysis on them shows that not only these loci may serve as potential drug targets, but also the proposed method may serve as a uniform framework for signature identification with big data.
Introduction
Early diagnosis of cancer has been a worldwide hotspot of research because it can obviously increase the opportunities for effective treatment and appropriate monitoring of cancer patients. Since it has been well-known that distinct types of human cancer share similar traits, including rapid cell proliferation, the ability to migrate, and seed malignant tumors in distal locations (Zhang et al., 2012), tremendous efforts have been taken in the development of reliable and cost-effective early detection methods for common cancers (Irizarry et al., 2009). It has been shown that the aberrant variation of methylation, which is a major pattern of epigenetics, is an early event in many tumors. It may also be one of the first detectable biomarkers for the early detection of cancer (Xu et al., 2017; Luo et al., 2020). Correspondingly, the methylation pan-cancer study is an emerging research hotspot, which is dedicated to find common or cancer-specific diagnostic or prognostic biomarkers from a variety of cancers (Yang et al., 2017; Ding et al., 2019; Tian et al., 2019).
Although good outcomes have been achieved over these studies, there are still improvements that need to be made: 1) there are few pan-cancer methylation studies focusing on the early diagnosis of cancer. 2) Most of the existing methods do not consider the functional relationships between methylation loci or even the co-methylation phenomenon, resulting in many false-positive results.
It is now a well-recognized fact that the main difference between cancer and normal cells is a complex landscape of genetic and epigenetic aberrations, which usually cause a rewiring of gene regulatory networks (GRNs) at a system level, finally impairing normal cell physiology (Hanahan and Weinberg, 2011). Correspondingly, signature methylation loci responsible for pan-cancer early-stage diagnosis should be functionally related to each other by regulating their own expression levels first (Matys et al., 2003). Therefore, our study is aimed to identify functionally related methylation loci for pan-cancer early diagnosis. It inevitably evolves the analysis of pan-cancer genome-wide methylation and expression data.
Unfortunately, the most widely used methylation platform is the Infinium HumanMethylation450 or 850 k platform. It includes 485,000 or 850,000 CpG loci covering more than 99% of RefSeq genes (Price et al., 2013). Such high-dimensional variables but only thousands of pan-cancer patients bring up a typical problem: big data with a comparatively very small sample size.
A new wave of deep learning in both academic and industrial fields has gradually developed deep ANN (Elmarakeby et al., 2021), graph convolutional networks (Wang et al., 2021), and other deep learning methods with multilayer nonlinear structures due to their superior visualization and classification performance. Unfortunately, for machine learning methods, especially for deep learning methods, the smaller the training sample size is, the robustness or generalization ability of the trained model is less. Additionally, although DeepLIFT (Trevino et al., 2021) and other interpretation methods have been available for deep learning methods, it is still hard for them to identify biomarkers. In short, both high-dimensional big data and the biomarker identification of our study exclude deep learning methods.
More importantly, it has been found that closer neighboring CpG sites are more likely to share the same methylation status (Affinito et al., 2020). An effective way to overcome this co-methylation situation is to divide the methylation loci into different groups and then select the important ones from the most important ones of each individual group.
Therefore, to speed up the analysis, to avoid false-positive results caused by co-methylation, and to improve the performance for such a big-data problem, a MapReduce-based partial least squares (MRPLS) method was proposed. The overall pipeline of this study is shown in Figure 1.
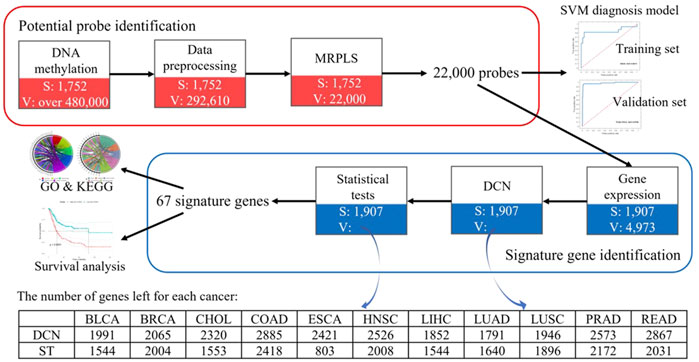
FIGURE 1. Overall pipeline of identified methylation loci for early-stage pan-cancer diagnosis. MRPLS, MapReduce-based partial least squares; DCN, differential co-expression network; ST, statistical test; S, the number of samples; V, the number of variables.
Materials and methods
Datasets
Level 3 DNA methylation (HumanMethylation450), level-3 RNA-Seq V2, and clinical data were downloaded from TCGA. Among them, the data of 12 types of cancer were used as the training dataset. The data of other three types of cancer from TCGA and three GEO datasets (GSE54503, GSE63409, and GSE66695) were collected as the independent test dataset. Their details are summarized in Table 1.
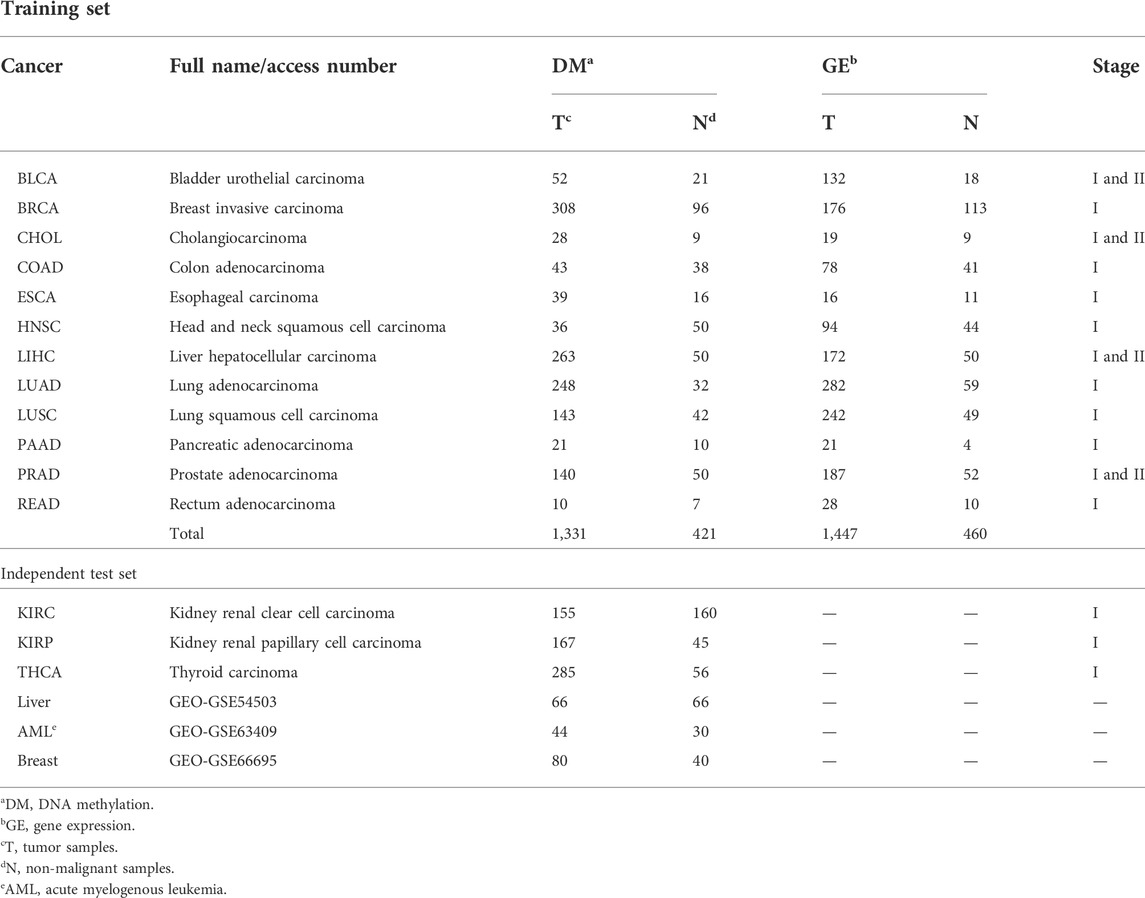
TABLE 1. Details of the training and independent test sets.
The methylation level of each locus is represented as a beta-value β, which is defined as the ratio of the methylated allele intensity and the overall intensity (Bibikova et al., 2011):
where M is the methylated intensity and U is the unmethylated intensity of each locus. β is a continuous variable with a value between 0 and 1, where 0 means no methylation and 1 means completely methylated.
Data preprocessing
For each type of cancer, there are over 485,000 loci in the downloaded methylation data with many missing values represented as “NA.” This is due to the masking of CpGs owing to single-nucleotide polymorphisms (SNPs) with a high minor allele frequency within 10 bp of the targeted CpGs or a substantial overlap between probe sequences and repetitive elements (Yang et al., 2017). Therefore, the following multi-step preprocessing procedure was performed before any further analysis to reduce the computational complexity as well as to improve the accuracy of the final results:
1) Identifying common loci among all types of cancers.
2) Removing the explicitly built-in SNP loci (identifiers start with “rs”) and non-CpG-targeting loci (identifiers start with “ch”).
3) Removing loci with “NA” values in more than 30% of the samples.
4) Replacing “NA” values with the corresponding average values of non-NA values of other samples.
5) Removing loci with SD (standard deviation) < 0.01 to reduce significantly unrelated or redundant loci.
6) An empirical Bayesian method ComBat (Johnson et al., 2007) is employed to eliminate batch effects caused by the system bench effect or abiotic differences using R package “sva.”
At this point, 292,610 high-quality loci are obtained for each type of cancer.
The new MapReduce-based partial least squares method
Several analysis methods like SVM (support vector machine) were used in our study. For readers’ convenience and for the clear context, only PLS and MapReduce, which are the basis for our newly proposed MRPLS, are briefly introduced here. Other regular existing methods are available in the Supplementary Material.
⁃ Partial least squares (PLS)
PLS is a widely used algorithm for modeling relationships between sets of observed variables. Although PLS was not originally designed as a tool for statistical discrimination, applied scientists routinely use PLS for classification, and there is substantial empirical evidence to suggest that it performs well in that role (Barker and Rayens, 2003). It iteratively extracts the latent variables (LVs) ti, ui, X-loading vectors pi, and Y-weight vectors qi from X and Y matrices in decreasing order of their corresponding singular values as follows (Word et al., 2001):
where E and F are the residual matrices of X and Y, respectively; n is the number of variables; and
The variable importance in projection (VIP) index based on PLS can be used to evaluate the importance of each variable (in our case, it is the methylation value of each locus) in the classification model (Mehmood et al., 2012). The definition is
where k stands for the explained variance of Y by each variable, s represents the total variance explained by LVs, and w is the unitized form of W.
⁃ MapReduce framework
MapReduce is a programming framework proposed by Google for modeling and analyzing those massive amounts of data in a parallel manner. The MapReduce programming framework employs the Hadoop Distributed File System (HDFS) to store data. It saves researchers from organizing and managing files in computer stations. Researchers only need to pay attention on how the Map and Reduce functions are written. In the MapReduce model, all the computation is organized by <key, value> pairs, especially in the Map phase, each worker node takes the initial organized <key1, value1> pairs as input and produces a list of intermediate <key2, value2> pairs as output. This can be represented as
Then, the system merges and groups these intermediate pairs by the same key2 and passes them to the Reduce function. Afterward, the Reduce function takes a key and a related value list as input and generates the expected < key2, value3> pair lists as output, which can be represented as
The simplified data flow overview of MapReduce is shown in Figure 2.
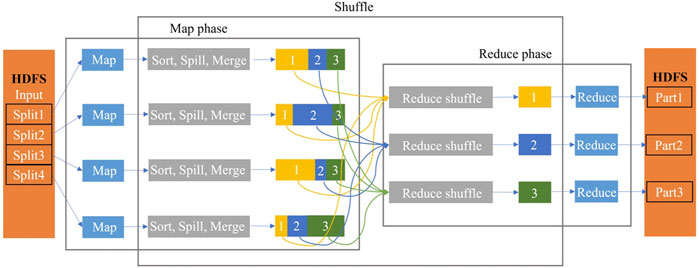
FIGURE 2. Data flow overview of the MapReduce model with four Map workers and three Reduce workers.
The newly proposed MRPLS method
In the traditional PLS method, VIP is usually used to evaluate the importance of features in the classification model (Mehmood et al., 2012). When it comes to VIP calculation for big data, however, NIPALS would become very slow or even out of the computer’s memory. Hence, MRPLS (MapReduce-based partial least squares) algorithm was first proposed by us to handle massive amounts of biological data. As mentioned previously, the core task of MRPLS is to design appropriate <key, value> pairs for the Map and Reduce process, respectively. Therefore, MRPLS is designed consisting of three MapReduce modules in series:
♦ MapReduce1 is used to calculate w;
♦ MapReduce2 takes w and X as input and calculates t and p, respectively;
♦ MapReduce3 takes t, p, and X as input to calculate new X for the next iteration.
The details of each Map and Reduce function and the corresponding algorithm pipeline and pseudo-codes are shown in Figure 3. The package can be made available on request.
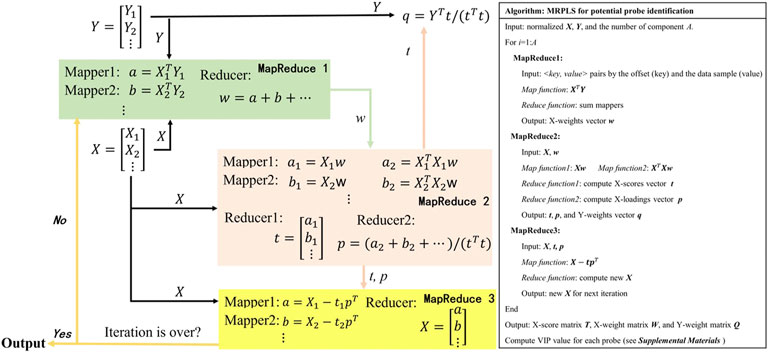
FIGURE 3. MapReduce-based partial least squares (MRPLS) algorithm flow chart and pseudo-code.
A modified prognostic index for survival analysis
To integrate both expression and methylation values of genes for each type of cancer, we modified the prognostic index (PI) (Yang et al., 2017) (the original method is described in the Supplementary Material) to include both expression values and methylation levels to evaluate the survival risk of a patient using a multivariate Cox proportional hazard model (R package “survival”):
where N is the number of signature genes,
Differential co-expression network inferring method
The steps for inferring a differential co-expression network (DCN) are shown as follows and in Figure 4B:
⁃ Inferring tumor co-expression network: Pearson’s correlation coefficient (PCC) between any two gene pairs in tumor samples was calculated, and each p-value of PCC was corrected by the false discovery rate (FDR). Then, the gene pairs with the corrected p-value < 0.05 were chosen as the edges of the tumor co-expression network.
⁃ Inferring normal co-expression network: PCC between any two gene pairs in non-malignant samples was calculated, and each p-value of PCC was corrected by the FDR. Then, the gene pairs with the corrected p-value < 0.05 were chosen as the edges of the normal co-expression network.
⁃ Selecting the common part between tumor and normal co-expression networks.
⁃ Selecting tumor-specific GRN and normal-specific GRN by removing the common part from the tumor or normal co-expression network, respectively.
⁃ Common genes between the normal-specific and the tumor-specific networks were selected for further statistical tests.
⁃ Checking whether the gene expression in tumor or non-malignant samples was normally distributed: if the number of samples >50, the Jarque–Bera test was used, otherwise the Shapiro–Wilk test was used.
⁃ For normal distribution genes, a two-sided t-test with the corrected p-value < 0.05 was used to select genes whose expression values are significantly different between tumor and non-malignant samples. Otherwise, the Wilcoxon rank sum test was used.
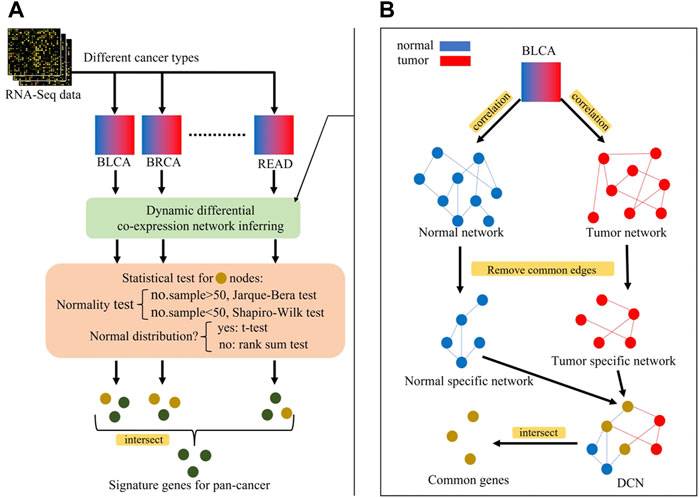
FIGURE 4. (A) Overview of identification process of signature genes for pan-cancer, (B) Inferring of differential co-expression network (DCN). Blue nodes represent genes in normal network, red nodes represent genes in tumor network, and yellow nodes represent genes in both networks (intersection). Perform statistical tests on yellow nodes and green nodes represent statistically significant genes, i.e., signature genes for pan-cancer early-stage diagnosis.
After performing the aforementioned process, each type of cancer received a set of genes, which were 1) functionally related both in tumor and non-malignant samples and 2) significantly differentially expressed between tumor and non-malignant samples.
Identification of signature loci for pan-cancer based on genome-wide methylation and expression data
To overcome the drawbacks caused by the huge difference between the sample number and locus number, to reduce high noise inherent in the genome data, to reduce the false-positive rate, to improve the efficiency in analyzing the big pan-cancer data, and to identify the functionally related real signature methylation loci, a multi-step method of data preprocessing, the MRPLS- and DCN-based procedure was performed and summed up as follows (Figure 1):
1) Data preprocessing using the aforementioned multi-step method;
2) Potential methylation locus identification using MRPLS;
3) Functionally related gene identification using the DCN inferring method followed by statistical tests;
4) Early-stage signature methylation locus identification by mapping these genes back to methylation loci.
The major merit of using MRPLS is that it is a linear method. This is the reason it is used to select highly related methylation loci rather than the final signature loci. The major function of MRPLS is to select methylation loci highly related to pan-cancer early-stage diagnosis effectively and as precisely as possible. Therefore, the following steps 3 and 4 are equally important for real-signature loci identification.
After this procedure, the identified methylation loci were highly related to early-stage tumor diagnosis and prognosis and functionally related to each other through their gene expression levels for pan-cancer.
1) SVM (support vector machine, see Supplementary Material) was used to distinguish early-stage tumor from non-malignant samples using only methylation values of potential methylation loci as input.
2) To verify the roles of early-stage signature methylation loci in tumor diagnosis and prognosis, GO and KEGG (Supplementary Material) pathway enrichment analyses and survival analysis of patients were performed.
It is reasonable to consider them as signature methylation loci that can serve as early-stage diagnosis and prognosis biomarkers.
Results
Potential methylation loci identified using MRPLS
To further speed up the calculation and overcome neighborhood co-methylation, the preprocessed genome-wide methylation loci (292,610 loci) were divided into 11 blocks according to their chromosome locations. In this way, the number of loci in each block ranged from 20,000 to 60,000. The details of the 11 blocks are shown in Supplementary Table S1. They were fed into MRPLS in parallel. Then, the top 22,000 loci (smaller than one-tenth of 292,610 loci) with the biggest VIP values were selected for further analysis.
To verify whether these methylation loci were highly related to early-stage tumor diagnosis, their methylation values were used to classify early-stage tumor from non-malignant samples using SVM algorithm with a five-fold cross-validation. If the classification results are good enough, it means the methylation values of these loci contain enough information for early-stage tumor diagnosis. The training dataset consists of 12 types of cancers from TCGA, and the independent test set includes the other six methylation profiles from TCGA and GEO databases (Table 1). The definition of the classification performance measurements is available in the Supplementary Material.
Table 2 shows the classification performance of the training set and independent test set. For the training dataset, we can see that, except for PAAD, the accuracies of all other types of cancer are >90%, and the average accuracy is >95%. Particularly, two types of cancer, CHOL and READ, reach 100%. Given that there are extremely unbalanced sample sizes in BRCA, LIHC, and LUAD (the number of non-malignant samples is much smaller than that of tumor samples), precision, recall, and F1 score (the harmonic average of precision and recall) were used to further evaluate the performance of the classification model. We can see that the averages of these three measurements are all >90%. AUCs are also shown in Table 2 and Supplementary Figure S1A. The average AUC is 0.958, and 5 out of 12 types of cancer even reach 1. Among the 12 types of cancer, only ESCA and PAAD have comparatively poorer results, whose AUCs are <0.90.
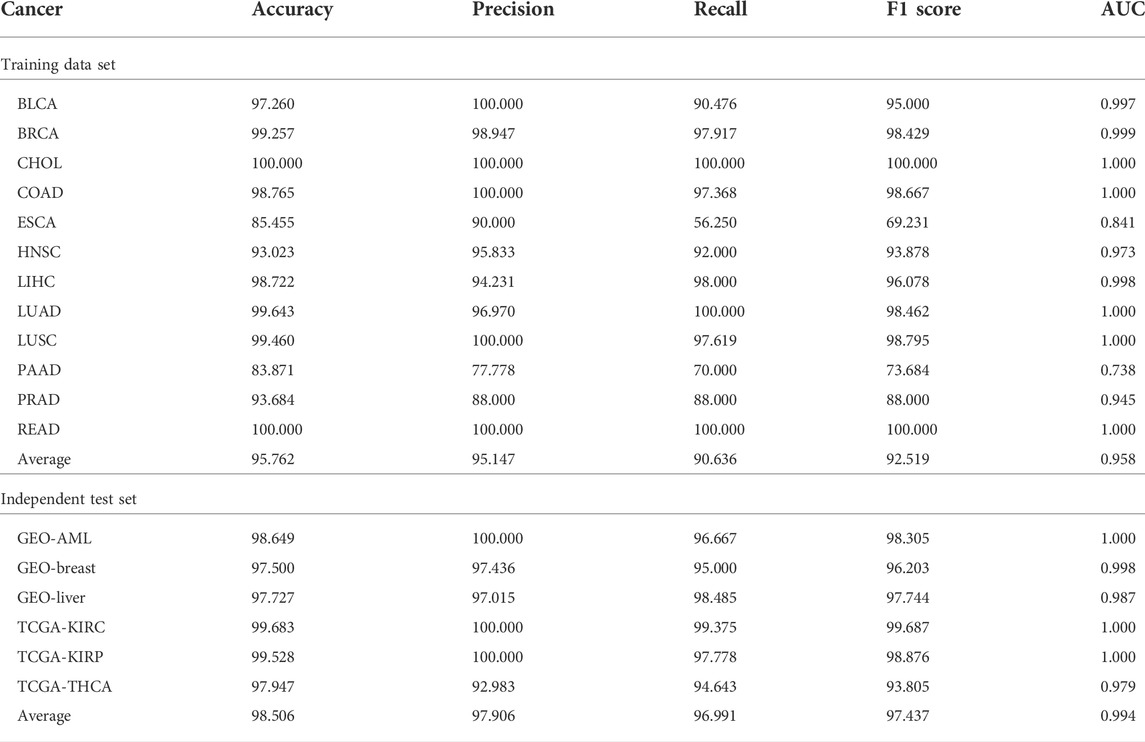
TABLE 2. Performance of the methylation loci-based diagnostic model for the training set and independent test set.
Similarly, for the independent test set, we also obtained good results (Table 2 and Supplementary Figure S1B). For both TCGA and GEO datasets, all measures are >90, and their average values are all >95. In summary, we can conclude that these potential methylation loci selected by MRPLS can successfully diagnose early-stage tumor samples from non-malignant samples for different cancers. Consequently, these loci were proven to be highly related to early-stage pan-cancer.
The 22,000 loci are located at different positions of 4,973 genes. Specifically, 29.37% of them are located at the transcription start site (TSS) and 47.19% of loci are located at the gene body (Supplementary Figure S2A). In addition, 36.5% of loci are distributed on the island, 7.6% on the shelf, and 20.14% on shore (Supplementary Figure S2B).
Functionally related loci identified for pan-cancer early-stage diagnosis
After obtaining the potential loci, functionally related and differently expressed genes were further identified using DCN inferring method and statistical tests (Figure 4). As shown in Figure 5A, after applying statistical tests, we obtained different numbers of significant genes for different types of cancer. Among them, no such kind of genes could be identified only for PAAD, which may be because of the small sample size of this type of cancer. Then, 67 common genes among the remaining 11 types of cancers were selected as the final signature genes whose methylation variations may be responsible for the early-stage tumor diagnosis and prognosis. The detailed information of these 67 genes and their corresponding methylation loci is summarized in Supplementary Table S2.
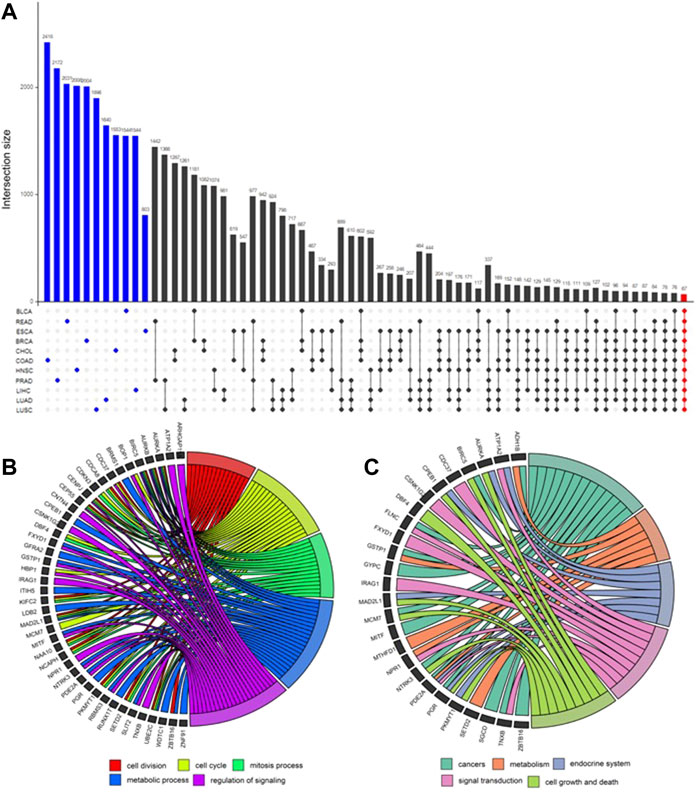
FIGURE 5. UpSet plot for differential genes’ intersection among 11 cancers and functional enrichment analysis. (A) In the UpSet plot, the intersection of different cancers is represented by solid dots and lines, and the number of intersections is represented by the histogram above. Different numbers of significantly differential genes for each cancer (marked blue) were identified. Finally, 67 early-stage pan-cancer biomarkers were identified by taking the intersection of 11 cancers (marked red). (B) Gene Ontology (GO) enrichment analysis. The top five significantly enriched GO biological processes and relevant genes. (C) Kyoto Encyclopedia of Genes and Genomes (KEGG) pathway enrichment analysis. The top five significantly enriched KEGG pathways and relevant genes.
GO and KEGG enrichment analyses were applied to these 67 genes, and the results are shown in Figures 5B,C. The top five GO biological processes include “cell division,” “cell cycle,” “mitosis process,” “metabolic process,” and “regulation of signaling.” The top enriched KEGG pathways are “cancers,” “metabolism,” “endocrine system,” “signal transduction,” and “cell growth and death.”
To further test whether methylation and gene expression levels of the 67 signature genes are clinically related to early-stage tumor patients, survival analysis using a multivariate Cox proportional hazard model was applied to them. KM survival curves are shown in Figure 6. It shows that they are highly related to the survival risk of patients with 10 out of 11 types of cancer (except for PRAD). It strongly proved that they could serve as potential targets for early-stage tumor prognosis.

FIGURE 6. Kaplan–Meier survival curves for overall survival of different types of cancer. Statistical difference in the outcome between high and low PI groups is indicated by the log-rank test p-value. “+” stands for the censoring samples.
Discussion
In the past decade, results have been remarkably accelerated in the validation of the concept that cancer is a disease of epigenetic, as well as genetic, abnormalities. There is even an emerging view on what is now called “the cancer epigenome.” DNA methylation is a major epigenetic modification that is involved in differentiation and development, aging, tumorigenesis, and other diseases. Aberrant methylation, including hypomethylation of oncogenes and hypermethylation of tumor suppressor genes (Irizarry et al., 2009), is a central feature of carcinogenesis and is an early event in many tumors (Luo et al., 2020). All these facts have laid down a solid foundation for identifying methylation loci for pan-cancer early-stage diagnosis.
As mentioned previously, however, the most widely used methylation platform is Infinium HumanMethylation450k. It includes 485,000 CpG loci, which means there are 485,000 variables in methylation data. For the HM850 k platform and other platforms based on the whole-genome bisulfite sequencing (WGBS) technique (Beck et al., 2022), there are even much more loci/variables. One of the most challenging problems is how to efficiently analyze big pan-cancer methylation data. Correspondingly, MapReduce has been taken into consideration to provide fast and cost-effective solutions (Li et al., 2020). The MapReduce framework is a solution originally provided by Google for processing big data in a distributed and parallel way. It is a software framework designed to parallelly run over a cluster of machines/nodes. Up to now, Hadoop, Spark, and even MATLAB provide an integrated MapReduce platform for developers so that they only need to focus on the explicit expressions of “Map” and “Reduce” (Li et al., 2020). It is an excellent framework for processing and analyzing big data. On the other hand, although new non-linear methods [for example, convolutional neural networks (Wang et al., 2021)] have been rapidly developed, PLS is still the most widely used multivariate statistical method considering the model interpretation of it in signature identification. Therefore, the MapReduce-based PLS (MRPLS) was proposed as the first application of a multivariate statistical method in modeling and signature identification with big data. The whole genome-wide methylation loci were divided into 11 blocks and were analyzed with MRPLS parallelly.
Another challenging problem is that it has been reported that methylation of CpGs located on the same DNA fragment occurs non-stochastic. In other words, closer neighboring CpG sites are more likely to share the same methylation status (Affinito et al., 2020). Dividing genome-wide loci into different blocks and to select the most important loci in each block can not only analyze such a big genome-wide methylation data efficiently but also avoid selecting false-positive important loci caused by co-methylation.
MRPLS is supposed to select methylation loci highly related to pan-cancer early-stage diagnosis, and then the DCN and the following steps were supposed to identify functionally related methylation loci from them. Therefore, MRPLS should not be too time-consuming or computation-consuming. PLS has shown its superiority in supervised classification problems in bioinformatics in several studies. Therefore, it was chosen in our study. The basic PLS can be easily extended to other forms such as nonlinear PLS and dynamic PLS.
As a result, 22,000 potential loci were selected. Final real-signature loci would be identified out of these followed by the DCN inferring method. A closer relationship between them for classification would make sure the performance of the final signature loci and reduce the false-positive ratio. The SVM model for classifying early-stage tumor from non-malignant samples using the methylation values of only these 22,000 potential loci strongly proved that their methylation profile contained enough information for early-stage tumor diagnosis.
The third big challenging problem is that it is now a well-recognized fact that the main difference between cancer and normal cells is the complex landscape of genetic and epigenetic aberrations, which usually cause a dynamic rewiring of GRNs at a system level (Hanahan and Weinberg, 2011). There might be inconsistent opinions about the effects of the methylation status on the promoter or other parts of genes, but almost no argument on the opinion that a gene can be directly regulated only by its own methylation status (Matys et al., 2003). A reasonable hypothesis is that the methylation status of signature loci regulates expression values of their own genes, and then these genes are regulated through their expression and functionally work together to initiate tumors. Therefore, 22,000 highly related methylation loci were mapped to 4,973 genes. Then, functionally related genes were identified using the DCN inferring method among these 4,973 genes.
To double-ensure that signature genes are not only functionally related but also significantly differentially expressed between tumor and non-malignant samples, significance tests were performed following the DCN inferring step. It is to be noted that statistical results have a lot to do with the right choice of statistical methods according to the data distribution and sample size (Bandyopadhyay et al., 2014). Specifically, parametric statistical tests require data to be normally distributed while non-parametric tests do not. For normally distributed data, parametric tests usually get better results than non-parametric tests. On the contrary, when data distribution is non-normal, the p-value of parametric tests may be misleading and non-parametric methods should be used. Additionally, when the number of samples is less than 50, the aforementioned situation needs to be carefully handled (Mallik et al., 2017). So in our study, for both tumor and non-malignant samples, if the number of samples >50, the Jarque–Bera test was used to check the distribution of the sample, and if the number of samples <50, the Shapiro–Wilk test was used. When both tumor samples and non-malignant samples meet the normal distribution, the two-sided t-test with the corrected p-value < 0.05 was used to filter genes; otherwise, the Wilcoxon rank sum test was used.
After performing the aforementioned process, each type of cancer received a statistically significant set of genes. Common genes among all cancers were then selected as the final genes, and their methylation loci were correspondingly selected as the final signature methylation loci for pan-cancer early-stage tumor diagnosis. The details are listed in Supplementary Table S2.
Figure 7 shows the distribution of 67 signature methylation loci. Among them, 38 loci are distributed on the promoter region (including TSS1500, TSS200, first exon, and 5′ UTR), 25 loci are distributed on the gene body region, and 4 loci are located at 3′ UTR. One possible explanation for the effect of promoter methylation is that the methylation status affects the binding affinity between transcription factors with cognate DNA sequences (i.e., methylation-sensitive or -resistant), and the regulatory function of the affected transcription factors might be either positive or negative on their target genes (Ma et al., 2013).
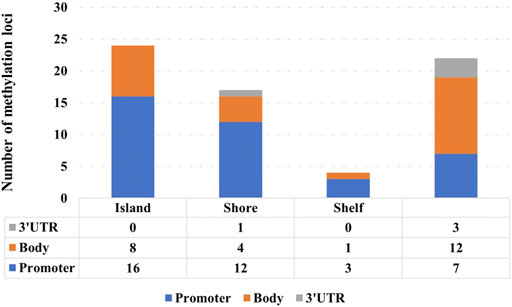
FIGURE 7. Distribution of 67 signature methylation loci.
Figure 6 shows the KM survival curves with the log-rank test for all 12 training cancer sets. Because of the small size and inherent characteristics of data, PAAD did not obtain any significantly differential genes using the DCN inferring method (see Methods). However, from Figure 6, we can see that PAAD patients can still be significantly (p = 0.44E-4) divided into high- and low-risk groups by 67 genes that were intersected by other 11 cancers. The result once again proves that these genes we selected can be considered pan-cancer early diagnosis signatures.
On the other hand, among 12 cancers, only PRAD did not get significant results in survival analysis (p > 0.05). For PRAD, there are 498 early-stage cancer samples available, of which only 10 patients’ overall survival (OS) status is “deceased” and that of the others is “living.” In other words, the proportion of failure events in PRAD is too low (only 0.02) to get any meaningful results. This phenomenon is in line with the basic laws of survival analysis and has been supported by other published literatures (Zupan et al., 2000; Nezhad et al., 2019).
The biological process of GO refers to biological goals that genes or gene products help to achieve, which is the most important independent ontology that we care most about (Ashburner et al., 2000). The top five remarkably involved biological processes among 67 genes and relevant genes are shown in Figure 5B. These biological processes include “cell division,” “cell cycle,” “mitosis process,” “metabolic process,” and “regulation of signaling,” which have been proved to be highly related to the occurrence and development of a variety of cancers (Susan et al., 1990; Jerby et al., 2012; Williams and Stoeber, 2012; Dominguez-Brauer et al., 2015; Schmid, 2017; Zhang et al., 2020).
A total of 43 genes are enriched in at least one biological process. Among these genes, AURKA, AURKB, BIRC5, CENPJ, CEP55, MAD2L1, and UBE2C are enriched in at least four biological processes.
⁃ The latest review by Du et al. (2021) reports that the activation of AURKA has been demonstrated to play an important role in a wide range of cancers.
⁃ The research of Bertran-Alamillo et al. (2019) reveals that AURKB constitutes a potential target in non-small cell lung cancer (NSCLC) progressing to anti-EGFR therapy and not carrying resistance mutations.
⁃ Gai et al. (2020) used integrative bioinformatics analysis to reveal that BIRC5 may be adopted as a promising predictive marker and potential therapeutic target in breast cancer.
⁃ Dastsooz et al. (2019) performed a comprehensive bioinformatics analysis and then concluded that UBE2C is overexpressed in all 27 cancers they investigated and its expression is significantly higher in late-stage tumors, which might indicate its involvement in tumor progression and invasion.
Figure 5C shows the main enriched KEGG pathways and relevant 26 genes. They are “cancers,” “metabolism,” “endocrine system,” “signal transduction,” and “cell growth and death.” These pathways have also been proved to be highly related to cancers (Gleeson and Shalet, 2004; DeBerardinis et al., 2008; Shimizu et al., 2014; Sever and Brugge, 2015). The other genes of 67 signatures, which have not been verified yet, are likely to be cancer vulnerability genes which are worth further exploring in future studies.
In addition to finding the common signatures for pan-cancer, we further explored the cancer-specific prognostic markers of 67 genes based on the HR of the Cox model. In the Cox model, an HR above 1 indicates a covariate that is positively associated with the event probability and thus negatively associated with the length of survival. In other words, a covariate with HR > 1 is called a bad prognostic factor. Cancer-specific prognostic markers (HR > 1) are summarized for 12 cancers with p < 0.05 (Wald test) in Supplementary Table S3. It shows that the number of expression prognostic markers is much more than that of methylation prognostic markers in most cancers, which indicates that gene expression plays more direct roles in cancer initiation than methylation does. It also proved that methylation can only function by regulating its own gene expression status.
Moreover, the main focus of this study was to propose an interpretable method for analyzing big data cost-effectively. Thus, the terms of nonlinearity or non-Gaussian distribution have not been considered in this study. Because methylation data measured by HM450k have been the most widely used data currently, they were used as an example in our study. However, based on the proposed modeling framework, other big data (i.e., HM850k) can also be analyzed using our MRPLS method. The basic PLS can be easily extended to other forms such as nonlinear PLS and dynamic PLS.
Conclusion
In this study, we developed a new MapReduce-based PLS method for analyzing methylation data parallelly and efficiently to overcome the “curse of big data” brought up by pan-cancer studies and the false-positive caused by neighboring co-methylation. We analyzed methylation and expression profiles of 12 cancers from TCGA and identified 67 signature methylation loci and corresponding genes for early-stage pan-cancer diagnosis and prognosis. Their methylation status and the difference in their co-expression network and expression values were all highly related to early-stage tumors and non-malignant sample classification. The biological processes and pathways they were significantly involved in were proved to play key roles in cancer initiation. Most importantly, their methylation and expression values are highly related to patient survival risk. Furthermore, the selected biomarkers could provide a reliable reference for understanding cancer progress mechanisms and precision medicine. The data analysis workflow that we proposed could be applied to any large-scale biological data for integrative signature discovery.
Data availability statement
Publicly available datasets were analyzed in this study. These data can be found at: level-3 DNA methylation (HumanMethylation450), level-3 RNA-Seq V2, and clinical data were downloaded from TCGA. The data of the other three types of cancer from TCGA and three GEO datasets (GSE54503, GSE63409, and GSE66695) were collected as the independent validation dataset.
Author contributions
QH and KS conceived and planned the project and contributed to the analysis and writing and review of the manuscript. JZ, LW, and ED performed most of the analyses and writing.
Funding
This work was partially supported by the Tianjin Health Science and Technology Project (No. TJWJ2021MS013).
Conflict of interest
The authors declare that the research was conducted in the absence of any commercial or financial relationships that could be construed as a potential conflict of interest.
Publisher’s note
All claims expressed in this article are solely those of the authors and do not necessarily represent those of their affiliated organizations, or those of the publisher, the editors, and the reviewers. Any product that may be evaluated in this article, or claim that may be made by its manufacturer, is not guaranteed or endorsed by the publisher.
Supplementary material
The Supplementary Material for this article can be found online at: https://www.frontiersin.org/articles/10.3389/fgene.2022.940214/full#supplementary-material
References
Affinito, O., Palumbo, D., Fierro, A., Cuomo, M., De Riso, G., Monticelli, A., et al. (2020). Nucleotide distance influences co-methylation between nearby CpG sites. Genomics 112 (1), 144–150. doi:10.1016/j.ygeno.2019.05.007
Ashburner, M., Ball, C. A., Blake, J. A., Botstein, D., Butler, H., Cherry, J. M., et al. (2000). Gene ontology: Tool for the unification of biology. The gene ontology consortium. Nat. Genet. 25 (1), 25–29. doi:10.1038/75556
Bandyopadhyay, S., Mallik, S., and Mukhopadhyay, A. (2014). A survey and comparative study of statistical tests for identifying differential expression from microarray data. IEEE/ACM Trans. Comput. Biol. Bioinform. 11 (1), 95–115. doi:10.1109/TCBB.2013.147
Barker, M., and Rayens, W. (2003). Partial least squares for discrimination. J. Chemom. 17 (3), 166–173. doi:10.1002/cem.785
Beck, D., Ben Maamar, M., and Skinner, M. K. (2022). Genome-wide CpG density and DNA methylation analysis method (MeDIP, RRBS, and WGBS) comparisons. Epigenetics 17 (5), 518–530. doi:10.1080/15592294.2021.1924970
Bertran-Alamillo, J., Cattan, V., Schoumacher, M., Codony-Servat, J., Gimenez-Capitan, A., Cantero, F., et al. (2019). AURKB as a target in non-small cell lung cancer with acquired resistance to anti-EGFR therapy. Nat. Commun. 10 (1), 1812. doi:10.1038/s41467-019-09734-5
Bibikova, M., Barnes, B., Tsan, C., Ho, V., Klotzle, B., Le, J. M., et al. (2011). High density DNA methylation array with single CpG site resolution. Genomics 98 (4), 288–295. doi:10.1016/j.ygeno.2011.07.007
Dastsooz, H., Cereda, M., Donna, D., and Oliviero, S. (2019). A comprehensive bioinformatics analysis of UBE2C in cancers. Int. J. Mol. Sci. 20 (9), 2228. doi:10.3390/ijms20092228
DeBerardinis, R. J., Lum, J. J., Hatzivassiliou, G., and Thompson, C. B. (2008). The biology of cancer: Metabolic reprogramming fuels cell growth and proliferation. Cell Metab. 7 (1), 11–20. doi:10.1016/j.cmet.2007.10.002
Ding, W. B., Chen, G., and Shi, T. L. (2019). Integrative analysis identifies potential DNA methylation biomarkers for pan-cancer diagnosis and prognosis. Epigenetics 14 (1), 67–80. doi:10.1080/15592294.2019.1568178
Dominguez-Brauer, C., Thu, K. L., Mason, J. M., Blaser, H., Bray, M. R., and Mak, T. W. (2015). Targeting mitosis in cancer: Emerging strategies. Mol. Cell 60 (4), 524–536. doi:10.1016/j.molcel.2015.11.006
Du, R., Huang, C., Liu, K., Li, X., and Dong, Z. (2021). Targeting AURKA in cancer: Molecular mechanisms and opportunities for cancer therapy. Mol. Cancer 20 (1), 15. doi:10.1186/s12943-020-01305-3
Elmarakeby, H. A., Hwang, J., Arafeh, R., Crowdis, J., Gang, S., Liu, D., et al. (2021). Biologically informed deep neural network for prostate cancer discovery. Nature 598 (7880), 348–352. doi:10.1038/s41586-021-03922-4
Gai, J. B., Zhu, B., Lin, W. J., Gao, H. Y., Dai, H., Zheng, L., et al. (2020). Identification of prognostic significance of BIRC5 in breast cancer using integrative bioinformatics analysis. Biosci. Rep. 40, BSR20193678. doi:10.1042/BSR20193678
Gleeson, H. K., and Shalet, S. M. (2004). The impact of cancer therapy on the endocrine system in survivors of childhood brain tumours. Endocr. Relat. Cancer 11 (4), 589–602. doi:10.1677/erc.1.00779
Hanahan, D., and Weinberg, R. A. (2011). Hallmarks of cancer: The next generation. Cell 144 (5), 646–674. doi:10.1016/j.cell.2011.02.013
Irizarry, R. A., Ladd-Acosta, C., Wen, B., Wu, Z., Montano, C., Onyango, P., et al. (2009). The human colon cancer methylome shows similar hypo- and hypermethylation at conserved tissue-specific CpG island shores. Nat. Genet. 41 (2), 178–186. doi:10.1038/ng.298
Jerby, L., Wolf, L., Denkert, C., Stein, G. Y., Hilvo, M., Oresic, M., et al. (2012). Metabolic associations of reduced proliferation and oxidative stress in advanced breast cancer. Cancer Res. 72 (22), 5712–5720. doi:10.1158/0008-5472.CAN-12-2215
Johnson, W. E., Li, C., and Rabinovic, A. (2007). Adjusting batch effects in microarray expression data using empirical Bayes methods. Biostatistics 8 (1), 118–127. doi:10.1093/biostatistics/kxj037
Li, X., Xue, F., Qin, L., Zhou, K., Chen, Z., Ge, Z., et al. (2020). A recursively updated Map-Reduce based PCA for monitoring the time-varying fluorochemical engineering processes with big data. Chemom. Intelligent Laboratory Syst. 206, 104167. doi:10.1016/j.chemolab.2020.104167
Luo, H., Zhao, Q., Wei, W., Zheng, L., Yi, S., Li, G., et al. (2020). Circulating tumor DNA methylation profiles enable early diagnosis, prognosis prediction, and screening for colorectal cancer. Sci. Transl. Med. 12 (524), eaax7533. doi:10.1126/scitranslmed.aax7533
Ma, X., Wang, Y. W., Zhang, M. Q., and Gazdar, A. F. (2013). DNA methylation data analysis and its application to cancer research. Epigenomics 5 (3), 301–316. doi:10.2217/epi.13.26
Mallik, S., Bhadra, T., and Maulik, U. (2017). Identifying epigenetic biomarkers using maximal relevance and minimal redundancy based feature selection for multi-omics data. IEEE Trans. Nanobioscience 16 (1), 3–10. doi:10.1109/TNB.2017.2650217
Matys, V., Fricke, E., Geffers, R., Gossling, E., HaubrockM., , , Hehl, R., et al. (2003). Transfac: Transcriptional regulation, from patterns to profiles. Nucleic Acids Res. 31 (1), 374–378. doi:10.1093/nar/gkg108
Mehmood, T., Warringer, J., Snipen, L., and Saebo, S. (2012). Improving stability and understandability of genotype-phenotype mapping in Saccharomyces using regularized variable selection in L-PLS regression. Bmc Bioinforma. 13, 327. doi:10.1186/1471-2105-13-327
Nezhad, M. Z., Sadati, N., Yang, K., and Zhu, D. X. (2019). A Deep Active Survival Analysis approach for precision treatment recommendations: Application of prostate cancer. Expert Syst. Appl. 115, 16–26. doi:10.1016/j.eswa.2018.07.070
Price, M. E., Cotton, A. M., Lam, L. L., Farre, P., Emberly, E., Brown, C. J., et al. (2013). Additional annotation enhances potential for biologically-relevant analysis of the Illumina Infinium HumanMethylation450 BeadChip array. Epigenetics Chromatin 6 (1), 4. doi:10.1186/1756-8935-6-4
Schmid, S. L. (2017). Reciprocal regulation of signaling and endocytosis: Implications for the evolving cancer cell. J. Cell Biol. 216 (9), 2623–2632. doi:10.1083/jcb.201705017
Sever, R., and Brugge, J. S. (2015). Signal transduction in cancer. Cold Spring Harb. Perspect. Med. 5 (4), a006098. doi:10.1101/cshperspect.a006098
Shimizu, S., Yoshida, T., Tsujioka, M., and Arakawa, S. (2014). Autophagic cell death and cancer. Int. J. Mol. Sci. 15 (2), 3145–3153. doi:10.3390/ijms15023145
Susan, P., Malcolm, C., Ronald, K., Peter, A., and Henderson, B. E. (1990). Increased cell division as a cause of human cancer. Cancer Res. 50 (23), 7415–7421.
Tian, Q., Zou, J. X., Fang, Y., Yu, Z., Tang, J., Song, Y., et al. (2019). A hybrid ensemble approach for identifying robust differentially methylated loci in pan-cancers. Front. Genet. 10, 774. doi:10.3389/fgene.2019.00774
Trevino, A. E., Muller, F., Andersen, J., Sundaram, L., Kathiria, A., Shcherbina, A., et al. (2021). Chromatin and gene-regulatory dynamics of the developing human cerebral cortex at single-cell resolution. Cell 184 (19), 5053–5069.e23. doi:10.1016/j.cell.2021.07.039
Wang, T., Shao, W., Huang, Z., Tang, H., Zhang, J., Ding, Z., et al. (2021). MOGONET integrates multi-omics data using graph convolutional networks allowing patient classification and biomarker identification. Nat. Commun. 12 (1), 3445. doi:10.1038/s41467-021-23774-w
Williams, G. H., and Stoeber, K. (2012). The cell cycle and cancer. J. Pathol. 226 (2), 352–364. doi:10.1002/path.3022
Word, S., Sjoatrom, M., and Eriksson, L. (2001). PLS-regression a basic tool of chemometrics. Chemom. Intell. Lab. Syst. 58 (2), 109–130. doi:10.1016/s0169-7439(01)00155-1
Xu, R. H., Wei, W., Krawczyk, M., Wang, W., Luo, H., Flagg, K., et al. (2017). Circulating tumour DNA methylation markers for diagnosis and prognosis of hepatocellular carcinoma. Nat. Mat. 16 (11), 1155–1161. doi:10.1038/nmat4997
Yang, X. F., Gao, L., and Zhang, S. H. (2017). Comparative pan-cancer DNA methylation analysis reveals cancer common and specific patterns. Brief. Bioinform. 18 (5), 761–773. doi:10.1093/bib/bbw063
Zhang, J., Lu, K., Xiang, Y., Islam, M., Kotian, S., Kais, Z., et al. (2012). Weighted frequent gene co-expression network mining to identify genes involved in genome stability. PLoS Comput. Biol. 8 (8), e1002656. doi:10.1371/journal.pcbi.1002656
Zhang, Z. Y., Yao, Q. Z., Liu, H. Y., Guo, Q. N., Qiu, P. J., Chen, J. P., et al. (2020). Metabolic reprogramming-associated genes predict overall survival for rectal cancer. J. Cell. Mol. Med. 24 (10), 5842–5849. doi:10.1111/jcmm.15254
Keywords: DNA methylation, partial least squares, MapReduce, pan-cancer analysis, early-stage tumor diagnosis and prognosis
Citation: He Q-e, Zhu J-x, Wang L-y, Ding E-c and Song K (2022) DNA methylation loci identification for pan-cancer early-stage diagnosis and prognosis using a new distributed parallel partial least squares method. Front. Genet. 13:940214. doi: 10.3389/fgene.2022.940214
Received: 10 May 2022; Accepted: 30 September 2022;
Published: 19 October 2022.
Edited by:
Leyi Wei, Shandong University, ChinaReviewed by:
Xiaofeng Yuan, Central South University, ChinaYijie Ding, University of Electronic Science and Technology of China, China
Copyright © 2022 He, Zhu, Wang, Ding and Song. This is an open-access article distributed under the terms of the Creative Commons Attribution License (CC BY). The use, distribution or reproduction in other forums is permitted, provided the original author(s) and the copyright owner(s) are credited and that the original publication in this journal is cited, in accordance with accepted academic practice. No use, distribution or reproduction is permitted which does not comply with these terms.
*Correspondence: Kai Song, a3NvbmdAdGp1LmVkdS5jbg==