 Zhiwen Wang
 Xi Zhu
 Hongyun Zhai
95% of researchers rate our articles as excellent or good
Learn more about the work of our research integrity team to safeguard the quality of each article we publish.
Find out more
ORIGINAL RESEARCH article
Front. Genet. , 25 July 2022
Sec. Cancer Genetics and Oncogenomics
Volume 13 - 2022 | https://doi.org/10.3389/fgene.2022.922712
This article is part of the Research Topic Molecular Mechanisms of Prostate Cancer Initiation and Progression View all 4 articles
Background: Prostate cancer is one of the most common malignancies among men worldwide currently. However, specific mechanisms of prostate cancer were still not fully understood due to lack of integrated molecular analyses. We performed this study to establish an mRNA-single nucleotide polymorphism (SNP)-microRNA (miRNA) interaction network by comprehensive bioinformatics analysis, and search for novel biomarkers for prostate cancer.
Materials and methods: mRNA, miRNA, and SNP data were acquired from Gene Expression Omnibus (GEO) database. Differential expression analysis was performed to identify differentially expressed genes (DEGs) and miRNAs (DEMs). Gene Ontology (GO), Kyoto Encyclopedia of Genes and Genomes (KEGG) pathway analyses, protein-protein interaction (PPI) analysis and expression quantitative trait loci (eQTL) analysis of DEGs were conducted. SNPs related to DEMs (miRSNPs) were downloaded from the open-source website MirSNP and PolymiRTS 3.0. TargetScan and miRDB databases were used for the target mRNA prediction of miRNA. The mRNA-SNP-miRNA interaction network was then constructed and visualized by Cytoscape 3.9.0. Selected key biomarkers were further validated using the Cancer Genome Atlas (TCGA) database. A nomogram model was constructed to predict the risk of prostate cancer.
Results: In our study, 266 DEGs and 11 DEMs were identified. KEGG pathway analysis showed that DEGs were strikingly enriched in focal adhesion and PI3K-Akt signaling pathway. A total of 60 mRNA-SNP-miRNAs trios were identified to establish the mRNA-SNP-miRNA interaction network. Seven mRNAs in mRNA-SNP-miRNA network were consistent with the predicted target mRNAs of miRNA. These results were largely validated by the TCGA database analysis. A nomogram was constructed that contained four variables (ITGB8, hsa-miR-21, hsa-miR-30b and prostate-specific antigen (PSA) value) for predicting the risk of prostate cancer.
Conclusion: Our study established the mRNA-SNP-miRNA interaction network in prostate cancer. The interaction network showed that hsa-miR-21, hsa-miR-30b, and ITGB8 may be utilized as new biomarkers for prostate cancer.
Prostate cancer (PCa) is the fifth leading cause of cancer death and the second most commonly diagnosed cancer among men worldwide in 2020 (Sung et al., 2021). In addition to significantly impacting the quality of life and health of patients, advanced PCa imposes a substantial economic burden on individuals and societies (Lu et al., 2021). PCa, a highly heterogeneous disease, is tightly regulated by diverse cytokines, gene expression programs and signal pathways throughout the disease course (Wang et al., 2018; Haffner et al., 2021). However, studies on the underlying pathogenesis and molecular mechanisms still remain largely uninvestigated because of lacking integrated molecular analyses. Hence, despite significant advances in treatment, the overall therapeutic benefits still remain unfavorable (Lin et al., 2020; Asif and Teply, 2021). This underscores the importance of early diagnosis of PCa. Prostate-specific antigen (PSA) is a widely used biomarker for the early diagnosis of PCa. However, the value of PSA screening for early detection of PCa remains controversial due to over-diagnosis and over-treatment (Mottet et al., 2021). Previous studies reported that increased PSA may be associated with benign conditions such as infection and inflammation, and some aggressive PCa tissues do not produce PSA, thus resulting in low diagnostic accuracy (McGrath et al., 2015). Therefore, effective biomarkers are urgently needed to improve the accuracy of early diagnosis of PCa.
MicroRNAs (miRNAs) are an important class of single-stranded, non-coding, and endogenous RNAs with 21–25 nucleotides in length, serving as the molecular carriers of highly specific genetic information (Hill et al., 2014). In recent years, miRNA was believed to be pivotal in the pathogenesis of PCa. For instance, the downregulation of miR-146a could suppress the migration and invasion of PCa cells by regulating ROCK1 levels (Moustafa et al., 2018). The miRNA seed region, located at the 5′ end of the mature miRNA with 2-8 nucleotides could specifically bind to 3′ untranslated region (3′UTR) of target mRNA, called miRNA recognizing element (MRE) sites (Saunders et al., 2007). Thus, any interference in miRNA-MRE interactions may cause dysregulated gene expression and thereby contribute to human diseases. Single nucleotide polymorphisms (SNPs), the most frequent genetic variation, are essential markers for investigating the genetic basis of human diseases. SNPs in miRNA and MRE may disrupt the base complementary pairing to interfere with the combination of mRNA-miRNA, leading to mRNA destabilization and/or translational inhibition (Kang et al., 2016).
Genome-Wide Association Studies (GWAS) have been widely applied to robustly link SNP genotypes with clinical phenotypes, which have identified 269 common SNPs correlated with higher risk of PCa (Conti et al., 2021). Expression quantitative trait loci (eQTL) analysis has been conducted to explore the impact of known disease-associated genetic variation (mostly SNP) on gene expression changes (Fehrmann et al., 2011; Hernandez et al., 2012). However, most of the existing eQTL analyses only study the association between mRNA and SNP, rarely involving miRNA, thus resulting in an incomplete interaction pattern. Therefore, in this study, we aim to construct an mRNA-SNP-miRNA interaction network by bioinformatics analysis and search for novel biomarkers for PCa.
The GEO microarray database was searched using different combinations of the following terms: “prostate cancer,” “adjacent normal prostate tissues” and “benign prostatic hyperplasia.” Adjacent normal prostate tissues and benign prostatic hyperplasia were defined as normal prostate. Based on the search strategy above, we obtained two gene expression datasets (GSE54808, GSE69223), one miRNA expression dataset (GSE60117) and one SNP expression dataset (GSE18333). Detailed information for each dataset was presented in Table 1 (see Supplementary Table S1 for further details).
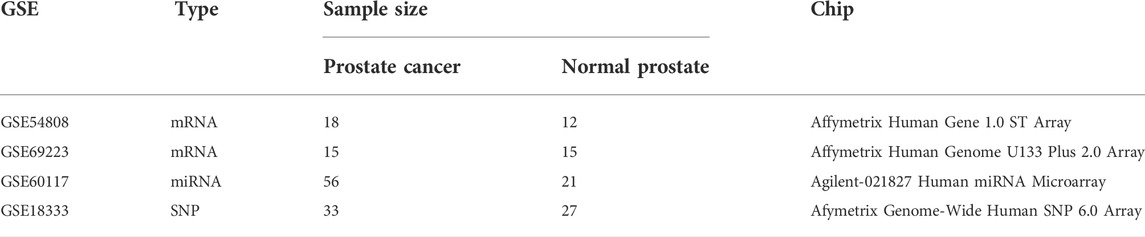
TABLE 1. Details of microarray datasets from GEO database.
We downloaded the matrix files of GSE54808 and GSE69223 datasets to acquire gene expression profiles. Probe names in matrix files were converted into gene symbols according to the appropriate platform annotation files. Missing values of the processed gene expression datasets were imputed using the k-Nearest Neighbor (kNN) algorithm by R package impute. The two gene expression datasets were merged by R package dplyr and a batch correction was conducted to remove technical differences using ComBat from the R package sva. The data processing of miRNA expression profile in GSE60117 dataset was similar to those carried out for gene expression profiles, including ID conversion and missing values imputation.
Differential expression analysis was conducted between normal and PCa tissues by limma package. Genes and miRNAs with q-value < 0.05 and |log2FC|>1 were defined as differentially expressed genes (DEGs) and differentially expressed miRNAs (DEMs), respectively. Subsequently, DEGs and DEMs were visualized by volcano plots and heatmaps using R package pheatmap.
Gene Ontology (GO) and Kyoto Encyclopedia of Genes and Genomes (KEGG) pathway analyses were conducted to test the functional enrichment of DEGs using R packages clusterProfiler, DOSE, org.hs.eg.db and topGO. GO terms were identified in three categories: Molecular Function (MF), Biological Process (BP) and Cellular Component (CC). The pathway annotation was obtained from KEGG pathway information. The results were visualized using R packages ggplot2 and tidyverse. Protein-protein interaction (PPI) network for the identified DEGs was established by the Search Tool for the Retrieval of Interacting Genes (STRING) online database. DEGs that the edge counts of every single gene (degree) were more than five were defined as hub genes. To access more reliable results, the minimum interaction score was set at high confidence (0.700).
EQTL analysis was conducted to analyze the relationship between DEGs and SNP genotypes in GSE18333 using R package MatrixEQTL. cis-eQTL refers to regulatory variation physically locating near the gene itself, and trans-eQTL refers to regulatory variation residing at locations distant from the genes. cis-eQTLs and trans-eQTLs (with p < 0.01) were identified and used for subsequent analysis.
SNPs in DEMs target sites (miRSNPs) were downloaded from the open-source websites MirSNP (http://bioinfo.bjmu.edu.cn/mirsnp/search/) and PolymiRTS 3.0 (https://compbio.uthsc.edu/miRSNP/). cis-eQTL and trans-eQTL of mRNA were matched with miRSNPs through overlapping SNPs, thus linking mRNAs to miRNAs. We searched for the effect of miRSNPs on the binding sites in this network from the website MirSNP. Then, we searched for the target mRNAs of miRNA in the above mRNA-SNP-miRNA trios on the online tool Targetscan (http://www.targetscan.org/) and miRDB (www.mirdb.org). Finally, the mRNA-SNP-miRNA interaction network was constructed and visualized using Cytoscape 3.9.0.
The gene and miRNA expression profiles of the same subjects were obtained from the Cancer Genome Atlas (TCGA) database, including 52 normal prostate and 497 prostate cancer cases. Then, we conducted differential expression analysis by limma package (q-value < 0.05 and |log2FC|>0.5 were used as thresholds) to validate the biomarkers selected from differential expression results and the mRNA-SNP-miRNA interaction network.
All statistical analyses were performed using R software (version 4.1.0, http://www.r-project.org). Student’s t-test was used to determine statistically significant differences between two groups. Boxplots were generated using R package ggplot2 and ggpubr to describe the distribution of expression levels. The receiver operating characteristic (ROC) curve was plotted to assess diagnostic performance of selected biomarkers, and the area under the curve (AUC) was also reported. Univariable logistic regression analyses were used to evaluate the association between PCa and correlated variables, including age, PSA value and selected biomarkers. Then, variables that with p-value less than 0.1 in the univariate analysis or with important clinical significance were entered into the multivariate logistic regression analysis. A nomogram was constructed based on the multivariate logistic regression analysis and internal validation of the nomogram was performed using the 1000-bootstrap resample. The performance of the nomogram was evaluated by discrimination and calibration. The AUC was used to determine discriminative ability of the nomogram. The calibration was graphically assessed by a visual calibration plot, which compares the predicted probability with actual probability of PCa. All tests were two-tailed, and p-values of less than 0.05 were considered statistically significant.
The study design and the process of the bioinformatics analysis are shown in Figure 1. In our study, compared with normal prostate tissues, 266 DEGs that FC > 2 or <0.5 and q < 0.05 were screened out, including 70 upregulated and 196 downregulated genes. Sorted by |Log2FC| value, the top 11 DEGs were displayed in Supplementary Table S2. 11 DEMs (|Log2FC |>1 and q < 0.05) were also screened, including 9 upregulated and 2 downregulated miRNAs (Supplementary Table S3). DEGs and DEMs were visualized as heatmaps and volcano plots (Figure 2).
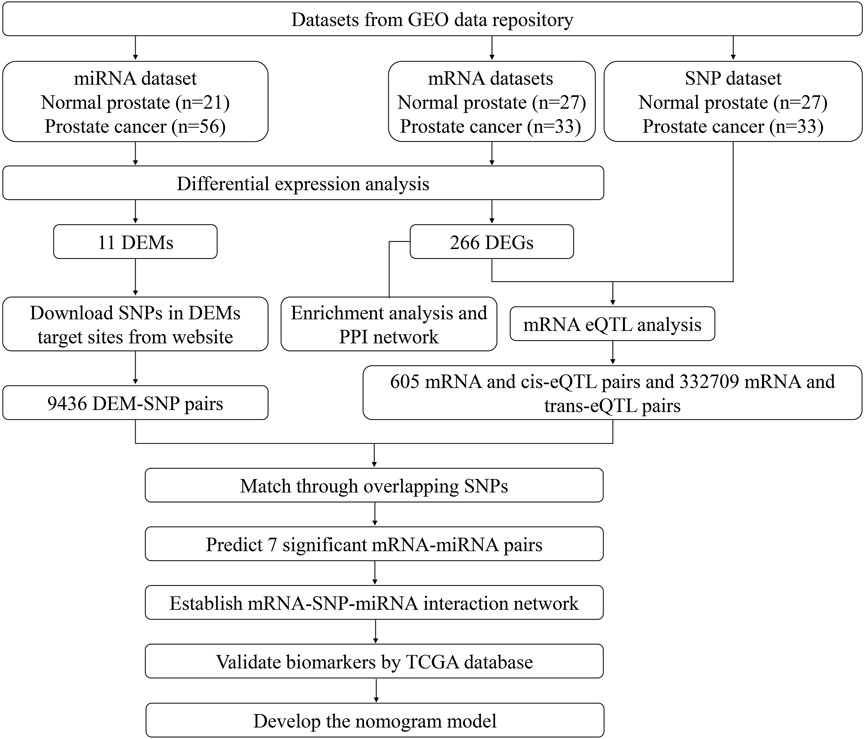
FIGURE 1. Flow chart of study design.
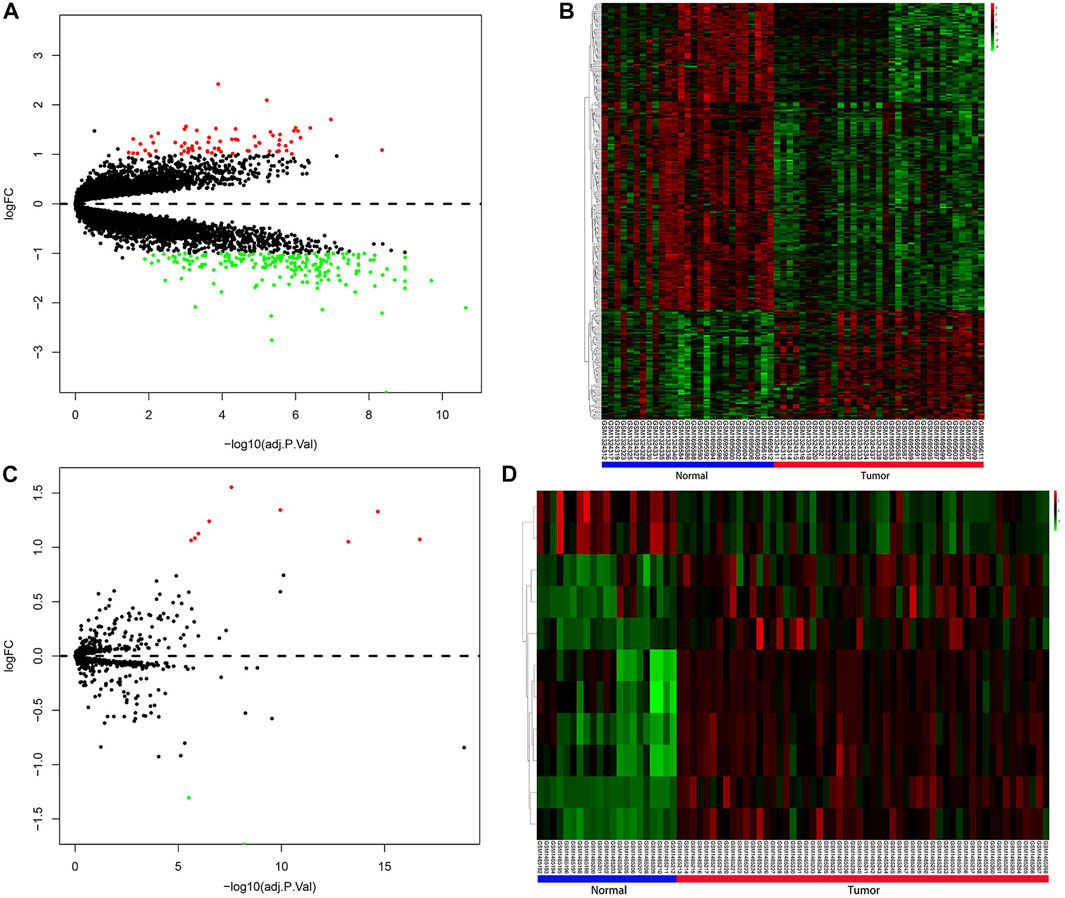
FIGURE 2. Results of differential expression analysis. (A) Volcano plot for DEGs. (B) Heatmap for DEGs. (C) Volcano plot for DEMs. (D) Heatmap for DEMs. Red indicated upregulated DEGs or DEMs, green indicated downregulated DEGs or DEMs, and black indicated genes or miRNAs that were not differentially expressed. In the heatmaps of DEGs and DEMs, the vertical axis represents genes or miRNAs that were clustered by similarity of their transcription profile, and the horizontal axis represents samples. DEGs, differentially expressed genes; DEMs, differentially expressed miRNAs.
To study the function of DEGs, we performed GO and KEGG analyses (Figure 3A and Figure 3B). Extracellular matrix organization and extracellular structure organization in BP-associated category, collagen-containing extracellular matrix in CC-associated category and actin binding in MF-associated category were the most significant GO terms enriched with a large number of DEGs. In addition, KEGG analyses showed that DEGs were associated with focal adhesion, PI3K-Akt signaling pathway, proteoglycans in cancer and other molecular pathways. A total of 263 of the 266 DEGs were mapped into the PPI network (Figure 3C). In this network, the parameter degree was used to calculate edge counts of every single gene, and 79 DEGs with the degree>5 were defined as hub genes (Supplementary Table S4).
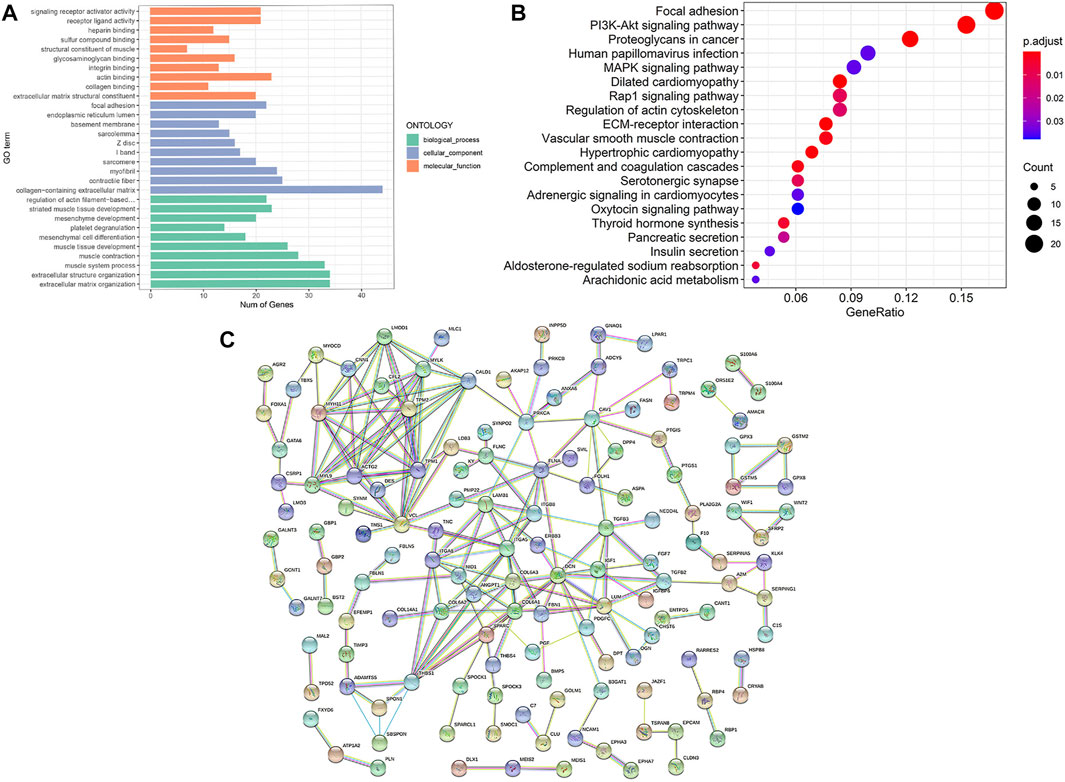
FIGURE 3. Results of enrichment analysis and PPI network. (A) The top 30 enriched significant GO categories of BP, CC, and MF. (B) The top 20 enriched KEGG pathways. The magnitude of gene counts is represented by the circle size, and the adjusted p value is represented by the legend’s color saturation. (C) PPI network of differentially expressed gene. BP, biological process; CC, cellular component; MF, molecular function; PPI, protein-protein interaction.
eQTL analysis was conducted to identify the relationship between SNP and mRNA expression, then 605 DEGs and cis-eQTL pairs and 332709 DEGs and trans-eQTL pairs were identified. miRSNPs were acquired from the open-source websites MirSNP and PolymiRTS 3.0 and a total of 9,436 pairs of miRNA-SNPs were screened out. By matching miRNA-miRSNPs pair with cis- and trans-eQTLs of mRNAs through overlapping SNPs, 60 mRNA-SNP-miRNAs trios were identified. The effect and binding energy of binding sites on the miRSNPs in the mRNA-SNP-miRNA trios had been listed in Supplementary Table S5. In addition, we predicted the target mRNAs of DEMs, and 7 target mRNAs in the mRNA-miRNA pairs were found to be in concordance with the mRNAs in our mRNA-SNP-miRNA pairs (Table 2). We ultimately visualized the mRNA-SNP-miRNAs trios by constructing an interaction network using Cytoscape3.9.0 (Figure 4).

TABLE 2. Target mRNAs of DEMs in the mRNA-SNP-miRNA network.
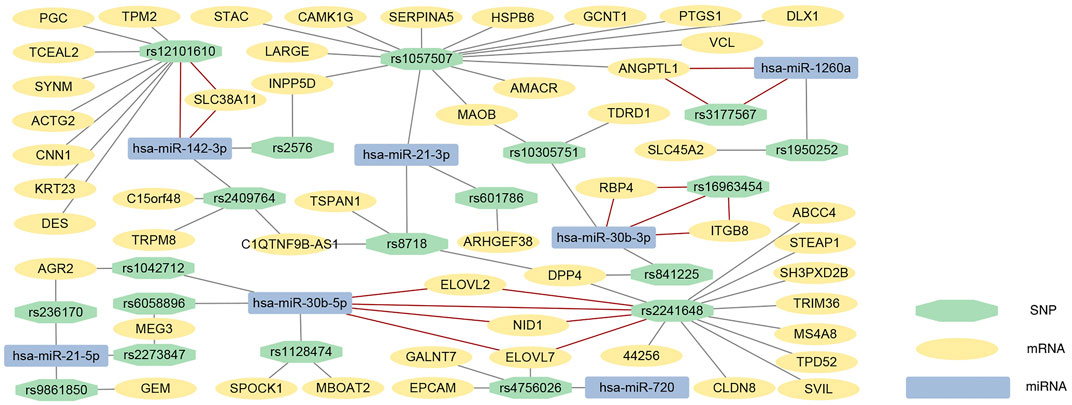
FIGURE 4. mRNA-SNP-miRNA interaction network. Every box represents one mRNA, SNP or miRNA, detailed in the legend. The 7 mRNA-SNP-miRNA trios with predicted mRNA-miRNA pairs are connected by red solid lines, and other mRNA-SNP-miRNA trios were connected by the grey solid lines. SNP, single nucleotide polymorphism; miRNA, microRNA.
The top 11 DEGs and DEMs, and 7 mRNA-miRNA pairs in the interaction network were selected for further validation in the TCGA database. The results showed that all 11 DEGs were confirmed, and three of the top 11 DEMs were validated including hsa-miR-21, hsa-miR-146b-5p and hsa-miR-30b. In addition, all DEGs and one of three DEMs in the 7 mRNA-miRNA pairs were also validated by the TCGA database analysis, including ANGPTL1, RBP4, ELOVL2, ELOVL7, NID1, SLC38A11, ITGB8, and hsa-miR-30b. The boxplots for validated biomarkers were presented in Figure 5A. To further explore useful biomarkers for PCa diagnosis, four biomarkers (ELOVL7, ITGB8, hsa-miR-21, and hsa-miR-30b) were screened out based on the above analysis results and literature survey. The ITGB8 showed the highest predictive capacity (AUC = 0.889, 95%CI = 0.850–0.927) for PCa, followed by hsa-miR-30b (AUC = 0.739, 95%CI = 0.657–0.820), hsa-miR-21 (AUC = 0.737, 95%CI = 0.672–0.801) and ELOVL7 (AUC = 0.607, 95%CI = 0.529–0.685) (Figure 5B).
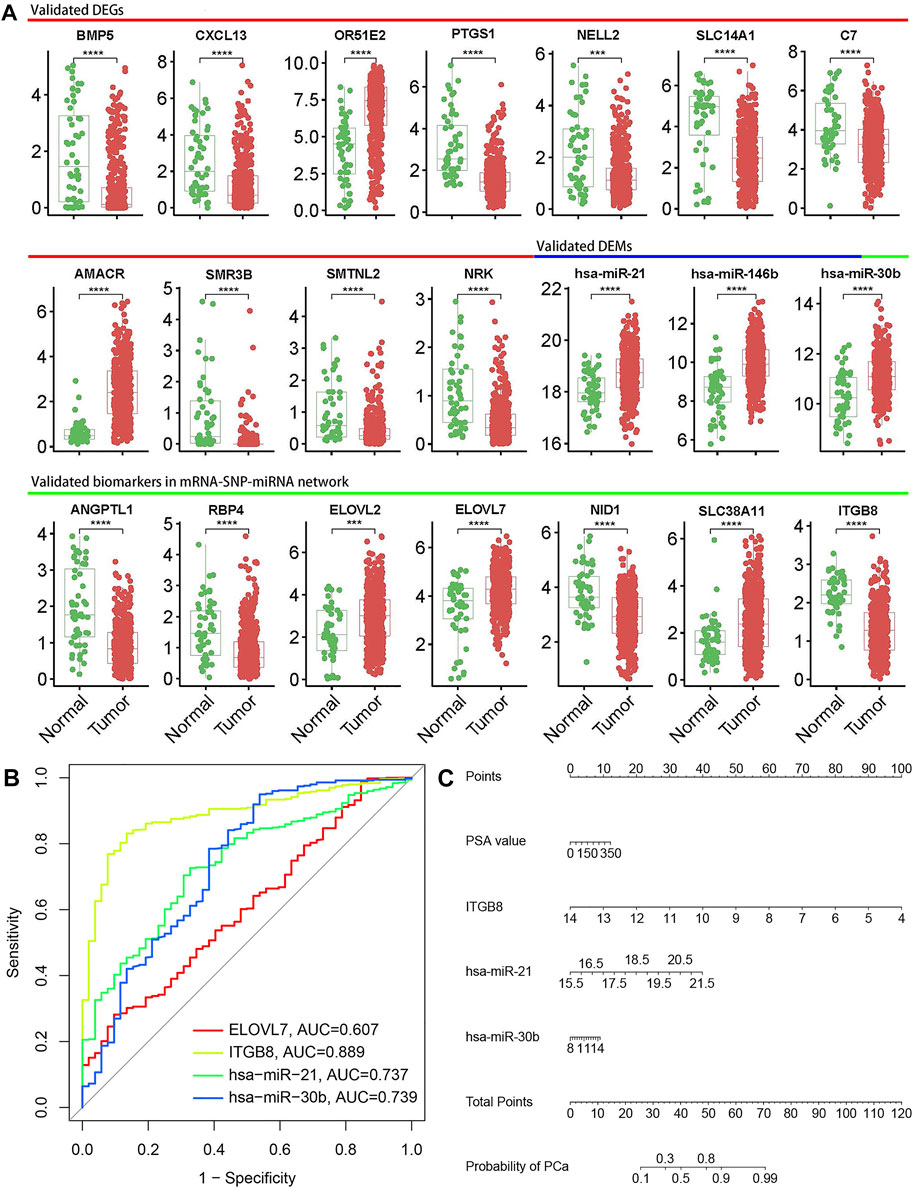
FIGURE 5. Validation and diagnostic performance of biomarkers. (A) Boxplots of representative biomarkers. Significant p-values were shown in boxplots; * means p value ≤ 0.05, ** means p value ≤ 0.01, *** means p value ≤ 0.001 and **** means p ≤ 0.0001, if not indicated, means p value > 0.05. (B) Receiver operation characteristic (ROC) analysis to analyze the ability of ELOVL7, ITGB8, hsa-miR-21, and hsa-miR-30b to distinguish PCa from normal controls. (C) Nomogram for predicting the risk of PCa. The points of each variable could be obtained from the point scale axis, then total points could be calculated by summing up each single point. The probability of PCa could be estimated by locating the sum on the total points axis of the nomogram.
The three biomarkers with AUC>0.7 were selected for model development, and univariable analysis showed that ITGB8, hsa-miR-21 and hsa-miR-30b were significantly associated with PCa risk (p < 0.05), but age and PSA value were not significant. Considering the significant clinical diagnostic implications of PSA value, ITGB8, hsa-miR-21, hsa-miR-30b and PSA value were finally entered into the multivariable logistic regression analysis. Based on the regression analysis, a nomogram was constructed that contained four variables for predicting the risk of PCa (Figure 5C). The nomogram yielded an AUC of 0.919 (95% CI: 0.889–0.949), indicating a good discrimination ability for PCa (Supplementary Figure S1A). The calibration curve showed good agreement among the prediction by the nomogram and actual observations (Supplementary Figure S1B).
Advanced PCa is a lethal illness with a dismal prognosis. Early diagnosis and treatment for PCa may be particularly significant. Although PSA was widely used to screen for PCa, there were several limitations in PSA testing as population screening program. Low sensitivity of PSA testing has limited its application for PCa screening (Sanda et al., 2017). Previous research has reported that 15% of men with PSA of less than 4.0 ng/ml would be diagnosed with PCa, of which 15% would be diagnosed with high-grade PCa (Thompson et al., 2004; Lucia et al., 2008). PSA testing also has specificity limitations. Currently, there were only less than half of men whose PSA level was higher than 4.0 ng/ml were diagnosed with PCa by needle biopsy (Schröder et al., 2009; Tomlins et al., 2011). Understanding the molecular mechanisms of PCa development may contribute to identifying effective biomarkers for this disease. However, the specific regulatory mechanism of miRNA and SNP still remains unclear due to the lack of integrated molecular analyses. Constructing an mRNA-SNP-miRNA interaction network contributes to the comprehensive analysis of the underlying regulatory mechanisms between genetic variants and diseases. Thus, we combined the profiles of mRNA, SNP, and miRNA from GEO microarray datasets and built an interaction network and nomogram model synthetically. Our study has identified several novel biomarkers in the mRNA-SNP-miRNA trios, revealing that SNPs in miRNA and MRE may interfere with the combination of mRNA-miRNA, which is beneficial to explore the novel biomarkers for PCa.
In our present study, 266 DEGs were identified, including 70 upregulated and 196 downregulated genes. C7 was one of the top-ranked downregulated DEGs in this study based on the |log2FC| values. Interestingly, previous studies have reported similar findings among PCa patients, and demonstrated that C7 was closely associated with immune infiltration level, overall survival and disease-free survival of the patients, suggesting that C7 had the potential for use as a prognostic prediction and immunoregulatory target in PCa (Chen, et al., 2020). Moreover, BMP5 has been found to closely relate to the progression of PCa. Huang et al. (2012) analyzed the genotype of 601 patients with PCa and showed that PCa cell lines displayed high expression of BMP5, and rs3734444 in BMP5 was significantly correlated with PCa-specific mortality (Huang et al., 2012). Another study found that inhibition of BMP5 can be effective in delaying the PCa progression of Pten-deficient mice by impairing self-renewal capacity of stem/progenitor cells (Tremblay et al., 2020). However, our research showed that BMP5 was differentially downregulated in PCa patients, which was inconsistent with prior studies. Differences in the experimental approaches, species and specimen types may explain the discordant results, and further experiments are required to validate the findings of this research. Notably, the activation of OR51E2, another significantly overexpressed DEG in our study, was able to enhance the proliferation of androgen-independent PCa cells, thus driving transformation to neuroendocrine cancer (Abaffy et al., 2018). Our study provided converging evidence that the upregulated OR51E2 might be crucial in the pathogenesis of PCa.
MiRNAs have been recognized as a group of non-coding RNA which are intimately involved in posttranscriptional regulation. In our study, 11 DEMs including nine upregulated and two downregulated miRNAs were identified. Consistent with our study, previous research has reported that several upregulated DEMs were implicated in the progression of PCa. Prior findings showed that hsa-miR-21 could regulate the growth of androgen-independent PCa, and only the overexpression of hsa-miR-21 was enough to enable androgen-dependent cancer cells to overcome castration and progress to androgen-independent cancer (Ribas et al., 2009; Fabris et al., 2016; Wang et al., 2020). Therefore, the upregulation of hsa-miR-21 might be associated with ADT-resistance and castration-resistant prostate cancer (CRPC) progression. Since liquid biopsy became more widely applied in PCa, hsa-miR-30b-3p was found high-expressed in the extracellular vesicles of patients’ urine, suggesting that hsa-miR-30b-3p has the potential as a biomarker for PCa (Wang et al., 2020; Matsuzaki et al., 2021). In addition, circ_CCNB2 knockdown can upregulate hsa-miR-30b-5p to modulate KIF18A expression and enhance the radiosensitizing effect for PCa patients (Cai et al., 2020). These DEMs might offer vital insight into underlying regulatory mechanisms of PCa.
KEGG pathway analysis of DEGs revealed significant enrichment for focal adhesion and PI3K-Akt signaling pathway. Focal adhesion kinase (FAK) was an important molecular for focal adhesion signaling pathway and a non-receptor tyrosine kinase that mediates integrin-based signaling. Previous studies suggested that FAK participated in the proliferation, adhesion, migration and survival of PCa cells, suggesting focal adhesion may play a vital role in PCa pathogenesis (Figel and Gelman, 2011). 22 DEGs were associated with focal adhesion signaling pathway, including one upregulated gene (THBS4) and 21 downregulated genes (PRKCA, ITGB8, MYLK, FLNA, VCL, CCND2, MYL9, THBS1, ITGA5, COL6A3, LAMB1, TNC, CAV1, FLNC, PRKCB, COL6A2, IGF1, PGF, COL6A1, ITGA8, PDGFC). Of these, the key gene IGF1 has been reported to drive the fine-tuning network between the integrin-FAK signaling and the Akt-mTOR pathway, thus promoting the growth and invasion of PCa cells (Siech et al., 2022). Furthermore, Shorning et al. (2020) found that PI3k-Akt signaling pathway could interact with other oncogenic signaling cascades, like androgen receptor, thereby stimulating the growth and developing drug resistance of PCa cells (Shorning et al., 2020). ITGA5 is the key gene in PI3k-Akt signaling pathway. The combination treatment of the pharmaceutical inhibition of PI3K signaling pathway and ITGA5 knockdown has been reported to promote apoptosis in PTEN mutant PCa cells, possibly due to the joint signal transduction to BCL-XL (Ren et al., 2016). Taken together, it is reasonable to speculate that the focal adhesion and PI3K-Akt signaling pathway were probably relevant to the mechanism of PCa, and IGF1 and ITGA5 could be potential markers for PCa.
The mRNA-SNP-miRNA interaction network was comprised of 19 SNPs, 7 miRNAs, and 51 mRNAs. The results were verified by online websites Targetscan and miRDB, and ultimately 7 mRNA-SNP-miRNA trios were found to be related with each other. Among the 7 trios, we found several DEGs and DEMs have important implications for understanding the underlying mechanism of PCa, including hsa-miR-30b, hsa-miR-142-3p, ITGB8, and ELOVL7. miRNA hsa-miR-30b-5p was found to be related to 17 DEGs through 4 overlapped SNPs, and hsa-miR-30b-3p was correlated with 5 DEGs through 3 SNPs. These findings indicate hsa-miR-30b might contribute importantly to the pathogenesis of PCa. As mentioned above, overexpression of hsa-miR-30b-3p was found in the extracellular vesicles in patients’ urine, and the upregulating hsa-miR-30b-5p can exert a radiosensitizing effect on tumor cells for PCa patients, providing supporting evidence for our study. In addition, hsa-miR-142-3p related to 13 DEGs through 3 SNPs. Hsa-miR-142-3p can bind to the 3′UTR of FOXO1 to decrease FOXO1 expression, causing the proliferation of PCa cells and suppression of apoptosis (Tan et al., 2020). However, hsa-miR-142-3p was not found to be differentially expressed in the samples from the TCGA database, and further validation is required to elucidate its biological functions.
In the interaction network, ITGB8 was associated with hsa-miR-30b-3p through rs16963454. Previous findings have reported that ITGB8 can be upregulated by miR-93 to promote the proliferation and invasion of PCa cells, confirming the instrumental role of ITGB8 in PCa carcinogenesis (Liu et al., 2018). However, our results found that ITGB8 was obviously downregulated in PCa. This is possibly because different miRNA binding activates different pathways, thus follow-up experimental studies are needed to further elucidate its specific mechanism. Moreover, ELOVL7, a validated overexpressed DEG in our interaction network, was associated with hsa-miR-30b-5p through rs2241648, which might make a critical contribution to the development of PCa. Specifically, ELOVL7 may be involved in the growth and survival of PCa cells through the metabolism of saturated very-long-chain fatty acids (SVLFAs) and their derivatives in previous study, which may become a druggable molecular target for novel treatment or prevention strategies (Tamura et al., 2009). Nevertheless, since the AUC of ELOVL7 was only 0.607, we could not determine its diagnostic performance, and further validation is required. Based on the above results, we constructed a nomogram model to predict the risk of PCa pathogenesis. However, we did not find relevant literature directly relating to the regulatory mechanism of the SNPs identified in our study, thus further validation by experimental investigations is needed.
In this study, we constructed an mRNA-SNP-miRNA interaction network and a nomogram model for PCa. However, several limitations still exist in this study. First, Gleason score and neoadjuvant treatment, which may affect gene and miRNA expression in PCa, were not available in our datasets, thus we could not evaluate their association with our results. Second, due to differences in sample and microarray types between the two gene expression datasets, the batch effect cannot be completely removed and may affect the robustness of our results. Third, the GEO datasets of mRNA, SNP and miRNA in this study were not obtained from the same population, which may be subject to bias in the results. To eliminate the bias as much as possible, we performed batch correction and analyzed the gene and miRNA expression profiles of the same subjects from TCGA database to validate our results. In the future, the mRNA, miRNA and SNP datasets from the same samples are still required to offer more compelling outcomes, and our results need further experiments to validate.
Our study established mRNA-SNP-miRNA interaction network in PCa. In the interaction network, we found hsa-miR-21, hsa-miR-30b and ITGB8 played vital regulatory roles in the pathogenesis of PCa. Further experiments are needed to verify the specific mechanism of these screened-out biomarkers in PCa.
The original contributions presented in the study are included in the article/Supplementary Material, further inquiries can be directed to the corresponding author.
Ethical review and approval was not required for the study on human participants in accordance with the local legislation and institutional requirements. Written informed consent for participation was not required for this study in accordance with the national legislation and the institutional requirements.
The overall design of the study was conducted by GH and ZW. Data samples were collected by ZW, XZ, HZ, and YW. Data analysis was performed by ZW and XZ. The manuscript was written by ZW, XZ, HZ, and YW, and GH revised the paper.
The authors would like to thank the GEO and TCGA datasets for providing bioinformatics data.
The authors declare that the research was conducted in the absence of any commercial or financial relationships that could be construed as a potential conflict of interest.
All claims expressed in this article are solely those of the authors and do not necessarily represent those of their affiliated organizations, or those of the publisher, the editors and the reviewers. Any product that may be evaluated in this article, or claim that may be made by its manufacturer, is not guaranteed or endorsed by the publisher.
The Supplementary Material for this article can be found online at: https://www.frontiersin.org/articles/10.3389/fgene.2022.922712/full#supplementary-material
Abaffy, T., Bain, J. R., Muehlbauer, M. J., Spasojevic, I., Lodha, S., Bruguera, E., et al. (2018). A Testosterone Metabolite 19-hydroxyandrostenedione induces neuroendocrine Trans-Differentiation of Prostate cancer cells via an ectopic Olfactory receptor. Front. Oncol. 8, 162. doi:10.3389/fonc.2018.00162
Asif, S., and Teply, B. A. (2021). Biomarkers for treatment response in advanced prostate cancer. Cancers (Basel) 13, 5723. doi:10.3390/cancers13225723
Cai, F., Li, J., Zhang, J., and Huang, S. (2020). Knockdown of circ_CCNB2 sensitizes prostate cancer to radiation through repressing autophagy by the miR-30b-5p/KIF18A Axis. Cancer Biother. Radiopharm. 00, 1–14. doi:10.1089/cbr.2019.3538
Chen, Z., Yan, X., Du, G. W., Tuoheti, K., Bai, X. J., Wu, H. H., et al. (2020). Complement C7 (C7), a potential tumor suppressor, is an immune-related prognostic biomarker in prostate cancer (PC). Front. Oncol. 10, 1532. doi:10.3389/fonc.2020.01532
Conti, D. V., Darst, B. F., Moss, L. C., Saunders, E. J., Sheng, X., Chou, A., et al. (2021). Trans-ancestry genome-wide association meta-analysis of prostate cancer identifies new susceptibility loci and informs genetic risk prediction. Nat. Genet. 53, 65–75. doi:10.1038/s41588-020-00748-0
Fabris, L., Ceder, Y., Chinnaiyan, A. M., Jenster, G. W., Sorensen, K. D., Tomlins, S., et al. (2016). The potential of MicroRNAs as prostate cancer biomarkers. Eur. Urol. 70, 312–322. doi:10.1016/j.eururo.2015.12.054
Fehrmann, R. S., Jansen, R. C., Veldink, J. H., Westra, H. J., Arends, D., Bonder, M. J., et al. (2011). Trans-eQTLs reveal that independent genetic variants associated with a complex phenotype converge on intermediate genes, with a major role for the HLA. PLoS Genet. 7, e1002197. doi:10.1371/journal.pgen.1002197
Figel, S., and Gelman, I. H. (2011). Focal adhesion kinase controls prostate cancer progression via intrinsic kinase and scaffolding functions. Anticancer. Agents Med. Chem. 11, 607–616. doi:10.2174/187152011796817646
Haffner, M. C., Zwart, W., Roudier, M. P., True, L. D., Nelson, W. G., Epstein, J. I., et al. (2021). Genomic and phenotypic heterogeneity in prostate cancer. Nat. Rev. Urol. 18, 79–92. doi:10.1038/s41585-020-00400-w
Hernandez, D. G., Nalls, M. A., Moore, M., Chong, S., Dillman, A., Trabzuni, D., et al. (2012). Integration of GWAS SNPs and tissue specific expression profiling reveal discrete eQTLs for human traits in blood and brain. Neurobiol. Dis. 47, 20–28. doi:10.1016/j.nbd.2012.03.020
Hill, J. M., Zhao, Y., Bhattacharjee, S., and Lukiw, W. J. (2014). miRNAs and viroids utilize common strategies in genetic signal transfer. Front. Mol. Neurosci. 7, 10. doi:10.3389/fnmol.2014.00010
Huang, S. P., Bao, B. Y., Hour, T. C., Huang, C. Y., Yu, C. C., Liu, C. C., et al. (2012). Genetic variants in CASP3, BMP5, and IRS2 genes may influence survival in prostate cancer patients receiving androgen-deprivation therapy. PLoS One 7, e41219. doi:10.1371/journal.pone.0041219
Kang, B. W., Jeon, H. S., Chae, Y. S., Lee, S. J., Park, J. S., Choi, G. S., et al. (2016). Impact of genetic variation in MicroRNA-binding site on susceptibility to colorectal cancer. Anticancer Res. 36, 3353–3361.
Lin, J. Z., Wang, W. W., Hu, T. T., Zhu, G. Y., Li, L. N., Zhang, C. Y., et al. (2020). FOXM1 contributes to docetaxel resistance in castration-resistant prostate cancer by inducing AMPK/mTOR-mediated autophagy. Cancer Lett. 469, 481–489. doi:10.1016/j.canlet.2019.11.014
Liu, J. J., Zhang, X., and Wu, X. H. (2018). miR-93 promotes the growth and invasion of prostate cancer by upregulating its target genes TGFBR2, ITGB8, and LATS2. Mol. Ther. Oncolytics 11, 14–19. doi:10.1016/j.omto.2018.08.001
Lu, L., Gavin, A., Drummond, F. J., and Sharp, L. (2021). Cumulative financial stress as a potential risk factor for cancer-related fatigue among prostate cancer survivors. J. Cancer Surviv. 15, 1–13. doi:10.1007/s11764-020-00906-7
Lucia, M. S., Darke, A. K., Goodman, P. J., La Rosa, F. G., Parnes, H. L., Ford, L. G., et al. (2008). Pathologic characteristics of cancers detected in the Prostate Cancer Prevention Trial: Implications for prostate cancer detection and chemoprevention. Cancer Prev. Res. 1, 167–173. doi:10.1158/1940-6207.CAPR-08-0078
Matsuzaki, K., Fujita, K., Tomiyama, E., Hatano, K., Hayashi, Y., Wang, C., et al. (2021). MiR-30b-3p and miR-126-3p of urinary extracellular vesicles could be new biomarkers for prostate cancer. Transl. Androl. Urol. 10, 1918–1927. doi:10.21037/tau-20-421
McGrath, S. E., Michael, A., Morgan, R., and Pandha, H. (2015). EN2 in prostate cancer. Adv. Clin. Chem. 71, 47–76. doi:10.1016/bs.acc.2015.06.002
Mottet, N., van den Bergh, R. C. N., Briers, E., Van den Broeck, T., Cumberbatch, M. G., De Santis, M., et al. (2021). EAU-EANM-ESTRO-ESUR-SIOG guidelines on prostate cancer-2020 update. Part 1: Screening, diagnosis, and local treatment with curative intent. Eur. Urol. 79, 243–262. doi:10.1016/j.eururo.2020.09.042
Moustafa, A. A., Kim, H., Albeltagy, R. S., El-Habit, O. H., and Abdel-Mageed, A. B. (2018). MicroRNAs in prostate cancer: From function to biomarker discovery. Exp. Biol. Med. 243, 817–825. doi:10.1177/1535370218775657
Ren, W., Joshi, R., and Mathew, P. (2016). Synthetic lethality in PTEN-mutant prostate cancer is induced by combinatorial PI3K/Akt and BCL-XL inhibition. Mol. Cancer Res. 14, 1176–1181. doi:10.1158/1541-7786.MCR-16-0202
Ribas, J., Ni, X., Haffner, M., Wentzel, E. A., Salmasi, A. H., Chowdhury, W. H., et al. (2009). miR-21: an androgen receptor–regulated MicroRNA that promotes hormone-dependent and hormone-independent prostate cancer growth. Cancer Res. 69, 7165–7169. doi:10.1158/0008-5472.CAN-09-1448
Sanda, M. G., Feng, Z., Howard, D. H., Tomlins, S. A., Sokoll, L. J., Chan, D. W., et al. (2017). Association between combined TMPRSS2: ERG and PCA3 RNA urinary testing and detection of aggressive prostate cancer. JAMA Oncol. 3, 1085–1093. doi:10.1001/jamaoncol.2017.0177
Saunders, M. A., Liang, H., and Li, W. H. (2007). Human polymorphism at microRNAs and microRNA target sites. Proc. Natl. Acad. Sci. U. S. A. 104, 3300–3305. doi:10.1073/pnas.0611347104
Schröder, F. H., Hugosson, J., Roobol, M. J., Tammela, T. L., Ciatto, S., Nelen, V., et al. (2009). Screening and prostate-cancer mortality in a randomized European study. N. Engl. J. Med. 360, 1320–1328. doi:10.1056/NEJMoa0810084
Shorning, B. Y., Dass, M. S., Smalley, M. J., and Pearson, H. B. (2020). The PI3K-AKT-mTOR pathway and prostate cancer: At the crossroads of AR, MAPK, and WNT signaling. Int. J. Mol. Sci. 21, 4507. doi:10.3390/ijms21124507
Siech, C., Rutz, J., Maxeiner, S., Grein, T., Sonnenburg, M., Tsaur, I., et al. (2022). Insulin-like growth factor-1 influences prostate cancer cell growth and invasion through an integrin α3, α5, αV, and β1 dependent mechanism. Cancers 14, 363. doi:10.3390/cancers14020363
Sung, H., Ferlay, J., Siegel, R. L., Laversanne, M., Soerjomataram, I., Jemal, A., et al. (2021). Global cancer statistics 2020: GLOBOCAN estimates of incidence and mortality worldwide for 36 cancers in 185 countries. CA. Cancer J. Clin. 7, 209–249. doi:10.3322/caac.21660
Tamura, K., Makino, A., Hullin-Matsuda, F., Kobayashi, T., Furihata, M., Chung, S., et al. (2009). Novel lipogenic enzyme ELOVL7 is involved in prostate cancer growth through saturated long-chain fatty acid metabolism. Cancer Res. 69, 8133–8140. doi:10.1158/0008-5472.CAN-09-0775
Tan, Y. F., Chen, Z. Y., Wang, L., Wang, M., and Liu, X. H. (2020). MiR-142-3p functions as an oncogene in prostate cancer by targeting FOXO1. J. Cancer 11, 1614–1624. doi:10.7150/jca.41888
Thompson, I. M., Pauler, D. K., Goodman, P. J., Tangen, C. M., Lucia, M. S., Parnes, H. L., et al. (2004). Prevalence of prostate cancer among men with a prostate-specific antigen level < or =4.0 ng per milliliter. N. Engl. J. Med. 350, 2239–2246. doi:10.1056/NEJMoa031918
Tomlins, S. A., Aubin, S. M., Siddiqui, J., Lonigro, R. J., Sefton-Miller, L., Miick, S., et al. (2011). Urine TMPRSS2:ERG fusion transcript stratifies prostate cancer risk in men with elevated serum PSA. Sci. Transl. Med. 3, 94ra72. doi:10.1126/scitranslmed.3001970
Tremblay, M., Viala, S., Shafer, M. E., Graham-Paquin, A. L., Liu, C., Bouchard, M., et al. (2020). Regulation of stem/progenitor cell maintenance by BMP5 in prostate homeostasis and cancer initiation. Elife 9, e54542. doi:10.7554/eLife.54542
Wang, G., Zhao, D., Spring, D. J., and DePinho, R. A. (2018). Genetics and biology of prostate cancer. Genes Dev. 32, 1105–1140. doi:10.1101/gad.315739.118
Keywords: prostate cancer, mRNA, SNP, miRNA, interaction network
Citation: Wang Z, Zhu X, Zhai H, Wang Y and Hao G (2022) Integrated analysis of mRNA-single nucleotide polymorphism-microRNA interaction network to identify biomarkers associated with prostate cancer. Front. Genet. 13:922712. doi: 10.3389/fgene.2022.922712
Received: 18 April 2022; Accepted: 04 July 2022;
Published: 25 July 2022.
Edited by:
Nabila Kazmi, University of Bristol, United KingdomReviewed by:
Yufei Zhou, Fudan University, ChinaCopyright © 2022 Wang, Zhu, Zhai, Wang and Hao. This is an open-access article distributed under the terms of the Creative Commons Attribution License (CC BY). The use, distribution or reproduction in other forums is permitted, provided the original author(s) and the copyright owner(s) are credited and that the original publication in this journal is cited, in accordance with accepted academic practice. No use, distribution or reproduction is permitted which does not comply with these terms.
*Correspondence: Gangyue Hao, aGFvZ2FuZ3l1ZUAxMjYuY29t
Disclaimer: All claims expressed in this article are solely those of the authors and do not necessarily represent those of their affiliated organizations, or those of the publisher, the editors and the reviewers. Any product that may be evaluated in this article or claim that may be made by its manufacturer is not guaranteed or endorsed by the publisher.
Research integrity at Frontiers
Learn more about the work of our research integrity team to safeguard the quality of each article we publish.