 Raphael Hirtz1,2*
 Christine Hars1
 Roaa Naaresh2
 Björn-Hergen Laabs3
 Jochen Antel2
 Corinna Grasemann4
 Anke Hinney2
 Johannes Hebebrand2
 Triinu Peters2
- 1Division of Pediatric Endocrinology and Diabetology, Department of Pediatrics II, University Hospital Essen, University of Duisburg-Essen, Essen, Germany
- 2Department of Child and Adolescent Psychiatry, Psychosomatics and Psychotherapy, University Hospital Essen, University of Duisburg-Essen, Essen, Germany
- 3Institute of Medical Biometry and Statistics, University Medical Center Schleswig-Holstein—Campus Lübeck, University of Lübeck, Lübeck, Germany
- 4Department of Pediatrics, Division of Rare Diseases and CeSER, St. Josef-Hospital, Ruhr-University Bochum, Bochum, Germany
A fair number of epidemiological studies suggest that age at menarche (AAM) is associated with depression, but the reported effect sizes are small, and there is evidence of residual confounding. Moreover, previous Mendelian randomization (MR) studies to avoid inferential problems inherent to epidemiological studies have provided mixed findings. To clarify the causal relationship between age at menarche and broadly defined depression risk, we used 360 genome-wide significantly AAM-related single-nucleotide polymorphisms (SNPs) as instrumental variable and data from the latest GWAS for the broadly defined depression risk on 807,553 individuals (246,363 cases and 561,190 controls). Multiple methods to account for heterogeneity of the instrumental variable (penalized weighted median, MR Lasso, and contamination mixture method), systematic and idiosyncratic pleiotropy (MR RAPS), and horizontal pleiotropy (MR PRESSO and multivariable MR using three methods) were used. Body mass index, education attainment, and total white blood count were considered pleiotropic phenotypes in the multivariable MR analysis. In the univariable [inverse-variance weighted (IVW): OR = 0.96, 95% confidence interval = 0.94–0.98, p = 0.0003] and multivariable MR analysis (IVW: OR = 0.96, 95% confidence interval = 0.94–0.99, p = 0.007), there was a significant causal effect of AAM on depression risk. Thus, the present study supports conclusions from previous epidemiological studies implicating AAM in depression without the pitfalls of residual confounding and reverse causation. Considering the adverse consequences of an earlier AAM on mental health, this finding should foster efforts to address risk factors that promote an earlier AAM.
1 Introduction
There is a steep increase in depressive symptoms and major depressive disorder (MDD) during adolescence. Moreover, a gender gap in the prevalence of MDD emerges only by puberty, affecting twice as many girls as boys. This finding persists throughout much of adult life (Thapar et al., 2012). These observations highlight the importance of puberty on mental health, especially in pubescent girls. To better understand puberty-related mental health trajectories in girls, age at menarche (AAM) has been extensively studied.
Earlier menarche relates not only to a higher risk for externalizing problems, among others, early or risky sexual behavior (Ullsperger and Nikolas, 2017), substance use (Ullsperger and Nikolas, 2017), and peer victimization (Smith-Woolley et al., 2017) but also to internalizing problems, including anxiety (Platt et al., 2017; Smith-Woolley et al., 2017), eating disorders (Smith-Woolley et al., 2017; Ullsperger and Nikolas, 2017), and depressive symptoms (Ullsperger and Nikolas, 2017). However, effect sizes regarding internalizing outcomes are small (d ≈ 0.2) (Ullsperger and Nikolas, 2017), and there are also contradictory findings from well-designed studies (Carter et al., 2011; Gaysina et al., 2015; Winer et al., 2016), which might indicate a variable degree of confounding. Consistent with this, a more recent study by Vaughan et al. (2015), that examined the impact of AAM on depressive symptoms in adolescence by a multilevel familial design, concluded that the effects of AAM might be driven by unmeasured or residual confounding. Thus, AAM may instead act sensitizing rather than causally in an environment of endogenous and exogenous pubertal stressors to favor the development of depression (Skoog and Stattin, 2014).
However, the approach chosen by Vaughan et al. (2015) relied on several key assumptions, some of which were not tested or may not hold in the studied context. Moreover, observational studies are not only prone to residual confounding but also reverse causation (Haycock et al., 2016; Besser et al., 2021). In contrast, Mendelian randomization (MR) uses genetic markers to draw causal conclusions on the association between an exposure (e.g., AAM) and an outcome (e.g., depression) of interest by exploiting the fact that genotypes are not generally associated with confounders in the population and randomly assigned at conception, analogous to randomization in clinical trials. Moreover, since the individual genotype is determined upon conception and cannot be modified by the outcome of interest, MR is robust to reverse causation. Usually, single-nucleotide polymorphisms (SNPs) derived from large-scale genome-wide association studies (GWASs) are used as instrumental variables (IVs). While in the one-sample MR setting, the individual participant data are used to assess the causal effect of the exposure on the outcome of interest, two-sample MR studies rely on the summary statistics from independent GWAS. The latter approach allows for greater sample sizes and, thereby, statistical power and comes with the advantage of less bias in the presence of weak genetic instruments (Haycock et al., 2016; Davies et al., 2018). However, for valid causal conclusions, MR relies on several assumptions. A potential threat to the validity of MR findings is horizontal pleiotropy, which refers to an effect of the IV on the outcome (depression) by a mechanism other than via the exposure (AAM). Previously, BMI has been identified as a potential pathway to horizontal pleiotropy when using AAM as exposure as a large number of SNPs associated with AAM are also negatively related to BMI (Day et al., 2017). When also considering that a higher BMI is associated with a higher risk for depression (Casanova et al., 2021), BMI is a potential source of horizontal pleiotropy. Moreover, recently, Magnus et al. (2020) have shown in their one-sample MR phenome-wide association study with 17,893 health-related traits in the UK Biobank that many phenotype categories, such as sociodemographic characteristics, substance use and addictions, mental health and traumatic events, measures of cognition and aging, blood parameters, and others, might also be relevant in this regard. Thus, MR studies addressing the causal relationship between AAM and MDD also have to be judged by the degree to which horizontal pleiotropy is considered. For example, a one-sample MR study of 12.233 Chinese women aged 50 years and older could not find evidence of a significant contribution of AAM to depressive symptoms in older women (Au Yeung et al., 2018). However, despite no apparent evidence of a weak instrument bias, their analysis included only five AAM-related SNPs and did not account for BMI. In contrast to the null finding of this study, Sequeira et al. (2017) demonstrated an effect of AAM on depression in 3.579 longitudinally studied girls at the age of 14, but not thereafter. This study not only included 120 AAM-related SNPs but also accounted for BMI. However, as recently discussed, this analysis was likely to be affected by low power (Chan et al., 2019). This conclusion is supported by the results from a recent large-scale, one-sample MR study of 181,318 women from the UK Biobank that could relate AAM to a broad, categorical depression phenotype in adult women (40–69 years) (Magnus et al., 2020). Notably, apart from a (much) larger sample size, the study was based on a more recent and extended set of 360 AAM-related SNPs but did not consider other potential causes of horizontal pleiotropy in addition to BMI. Regarding two-sample MR, a single, more recent study found no evidence of a causal relationship between AAM and depression (Howard et al., 2019), but the study included only 60 genetic variants for methodological reasons.
Considering this somewhat inconsistent picture, the present study was intended to clarify the directional relationship between AAM and risk for depression by 1) a two-sample Mendelian randomization approach with the so-far largest sample size and 2) considering BMI and other potential causes of horizontal pleiotropy on this relationship by a multivariable MR (MVMR) analysis. Establishing this causal link would not only support paying particular attention to the development of mental health in early maturing girls but also justify addressing risk factors that promote experiencing menarche at an earlier age.
2 Methods and Materials
2.1 Univariate Mendelian Randomization Analysis
To perform an MR study, three main assumptions must be met (Lawlor et al., 2008; König and Greco, 2018): 1) the genetic instrument must have a strong association with the exposure, 2) the genetic instrument is independent of potential confounding factors in the relationship between the exposure and outcome, and 3) the outcome is associated with the genetic instrument only through the effect of the exposure (Haycock et al., 2016; König and Greco, 2018).
Only the first assumption can be tested directly by assessing the F-statistic (Haycock et al., 2016). An F < 10 suggests potential weak instrument bias (Sanderson et al., 2020). Independent genome-wide significant SNPs (p < 5 × 10⁻⁸) were used as IV for AAM to avoid such a bias. The second assumption is unlikely to be violated in the MR context as genetic variants are fixed at conception and cannot be influenced by the confounding factors of the risk factor–outcome association (Del Greco et al., 2015). To assess the third assumption, we used different approaches. First, we used Cochran’s Q-statistic to test for IV heterogeneity, which may have several causes, of which horizontal pleiotropy is most likely. Cochran’s Q-statistic assesses whether causal estimates of SNPs are comparable (Bowden et al., 2015). In the univariate MR case, a significant finding (p < 0.05) indicates heterogeneity. Second, to specifically address horizontal pleiotropy, we calculated MR–Egger regression and performed MR-PRESSO analysis. If Egger’s intercept is not significantly different from zero, horizontal pleiotropy is unlikely (Burgess and Thompson, 2017). MR PRESSO uses a global bias test to evaluate whether the removal of potentially pleiotropic instruments results in a significant difference in the overall causal estimate and provides a corrected causal estimate after the removal of pleiotropic instruments. Comparing both the approaches, simulation studies have shown that MR PRESSO is more sensitive to horizontal pleiotropy than Egger’s intercept (Verbanck et al., 2018).
It is unlikely that all IVs meet the instrumental variable assumptions. Therefore, several MR methods have been developed, which differ in their robustness to various violations of assumptions. Considering that no method alone provides an infallible test of causality, the use of different methods to assess whether a causal effect determined by MR is robust has been recommended (Burgess et al., 2017a; Burgess et al., 2019). Accordingly, we applied the following MR methods: 1) the inverse-variance weighted (IVW) method assumes that all ratio estimates provide independent evidence of the causal effect and that all genetic variants are valid instruments. No intercept term is included in the regression model (Burgess and Thompson, 2017); 2) MR–Egger considers an intercept term interpreted as the average pleiotropic effect of the genetic variants included in the analyses. If the pleiotropic effects are distributed independently of the genetic associations with the risk factor (InSIDE assumption: INstrument Strength Independent of Direct Effect), the MR–Egger estimate is a consistent estimate of the causal effect as both sample size and the number of genetic variants increase (Burgess and Thompson, 2017; Hartwig et al., 2017); 3) Mode-based estimation (MBE; simple mode, weighted mode) consistently estimates the true causal effect under the assumption that across all instruments, the most frequent value of bias due to pleiotropy is 0 [ZEro-modal pleiotropy assumption (ZEMPA)] (Hartwig et al., 2017). Simple MBE is less accurate than weighted MBE, but simple MBE is less prone to bias due to violations of the InSIDE assumption; 4) median-based estimators are consistent even when up to 50% of the instruments are invalid. The weighted median estimator has similar efficiency to the IVW method, but the simple median estimator is less efficient than either the IVW or the weighted median method (Bowden et al., 2016). The penalized weighted median estimator is robust in the case of IV heterogeneity (Rees et al., 2019); 5) The robust-adjusted profile score (MR RAPS) provides an overall estimator that is robust to systematic and idiosyncratic pleiotropy (some genetic instruments have a large effect on the outcome) (Zhao et al., 2020); 6) MR PRESSO (see above) (Verbanck et al., 2018).
In the case of IV heterogeneity, as indicated by Cochran’s Q statistic, two methods robust to heterogeneity were used in addition to the penalized weighted median method (Rees et al., 2019): 7) the contamination mixture method has a good overall performance (the lowest mean squared error), with up to 40% invalid instruments compared to other robust methods. The contamination mixture method identifies distinct subgroups of genetic variants with mutually similar causal estimates (Burgess et al., 2020); 8) MR-Lasso extends the IVW model to include an intercept term for each genetic variant. These intercept terms represent associations between genetic variants and the outcome that bypasses the risk factor. The causal effect is estimated by weighted linear regression, with the intercept terms subjected to lasso penalization. Lasso penalization shrinks the intercept of the valid instruments to zero (Rees et al., 2019).
Forest and scatter plots were used to visualize the combined results of single and multi-SNP analyses. The scatter plots show single SNP effects on the exposure against single SNP effects on the outcome with corresponding standard deviations and estimated regression lines of the multi-SNP analyses. We created funnel plots to examine the relationship between study accuracy and effect size (Haycock et al., 2016). Asymmetry in the funnel plot indicates a violation of MR assumptions (Katikireddi et al., 2018). To assess whether a single SNP had a disproportionately large effect on the regression coefficients, we performed a leave-one-out analysis in the IVW regression framework (Burgess and Thompson, 2017).
Power analysis to estimate the probability of finding a true effect was implemented using sample size, the proportion of cases in the study, and the proportion of variance explained (SNP heritability) (Brion et al., 2013).
2.2 Multivariable Mendelian Randomization Analysis—Assessing the Effect of BMI and Other Causes of Pleiotropy
An association of BMI with AAM and depression has been established by previous research (Day et al., 2017; Magnus et al., 2020). To identify other potential causes of horizontal pleiotropy, we submitted all the SNPs associated with AAM (n = 343) to the PhenoScanner database (Staley et al., 2016; Kamat et al., 2019) to establish significant phenotypical associations with these SNPs (p < 1 × 10⁻⁵) in Europeans. Thereby, and by an additional review of the literature including GWASs on the relationship between identified phenotypes and MDD, we also included educational attainment (EdAtt) and white blood cell count (WBC) for MVMR analyses as covariates.
To estimate the effects of these pleiotropic phenotypes in the association between AAM and depression, we performed MVMR using three different methods (Burgess and Thompson, 2015): 1) the inverse-variance method uses a multivariable weighted linear regression; 2) multivariable MR-Lasso extends the multivariable IVW model to include an intercept term for each genetic variant; and 3) the multivariable median method is similar to the univariable weighted median method, except that it relies on quantile regression (Burgess and Thompson, 2015).
To test the IV strength, we calculated the conditional F-statistics FTS. Furthermore, we calculated the Q-statistic to test for heterogeneity. In contrast to the univariate case, a p-value < 0.05 indicates that excessive heterogeneity in the MVMR model can be rejected and that the selected SNPs can predict the exposure phenotypes (Sanderson et al., 2020). We could not consider correlations between exposure phenotypes because individual-level genetic data were not available to us.
2.3 Sensitivity Analyses
We excluded SNPs that were strongly associated with potentially pleiotropic phenotypes from the univariable MR analysis addressing the relationship between AAM and depression risk. For this purpose, we calculated an F-statistic using the formula F = (beta/se)2 for each SNP defining the IV for AAM separately for BMI, EdAtt, and WBC. In line with previous studies (Swerdlow et al., 2016; Burgess et al., 2017b), we excluded SNPs with F > 10 from the analysis, assuming that these SNPs are also strong instruments for potentially pleiotropic phenotypes.
2.4 Data Sources for Mendelian Randomization Analyses and Selection of the Genetic Instruments
2.4.1 Age at Menarche
We performed MR analyses based on the GWAS by Day et al. (2017), which comprised 40 studies from the ReproGen consortium, 23andMe, and the UK Biobank. The data from 329,345 women of European ancestry were included. The women were asked to report when the first menstruation/period (menarche) occurred. The regression model included age at study visit and other study-specific covariates. There were 389 independent SNPs (p < 5 × 10⁻⁸) associated with AAM. The per-allele effect sizes were expressed in years and ranged from ∼1 week to 5 months. Depending on the study, these 389 independent SNPs explained 7.2–7.4% of the trait variance (Day et al., 2017). The total chip-captured SNP-based heritability (h2SNP) for AAM estimated on the UK Biobank data was 32%.
2.4.2 Depression
We used the latest GWAS of 807,553 individuals (246,363 cases and 561,190 controls) by Howard et al. (2019) as data source for depression as the outcome variable. The authors meta-analyzed the data from the three largest genome-wide association studies of depression. The phenotyping of depression differed in these three studies: 1) self-reported clinical diagnosis of depression by Hyde et al. (2016); 2) spectrum of depression phenotypes obtained from a structured clinical interview or based on broader criteria by Wray et al. (2018); and 3) self-reported help-seeking for problems with nerves, anxiety, tension, or depression (broad depression) by Howard et al. (2018). The overlapping samples were excluded. Altogether, 102 independent variants were identified. The proportion of women in the GWASs was found to be 48% by Hyde et al. (2016) and 54% by Howard et al. (2018). The proportion of males and females was not reported by Wray et al. (2018). The regression model on the UK Biobank data included sex, age, genotyping array, and the first eight principal components for population structure (Howard et al., 2019). The regression model on the 23andMe data included the covariate age, sex, and the top five principal components (Hyde et al., 2016). The genome-wide SNP-based heritability (h2SNP) was 8.9% (Howard et al., 2019).
2.4.3 BMI
We used the most recent GWAS on the BMI, where separate analyses were performed for sexes (Pulit et al., 2019). A total of 806,834 individuals of European ancestry were included in the analysis, of which 434,794 were females. The SNP-based heritability (h2SNP) for females was 35.5% for all the SNPs and 30.0% for SNP, with a mean allele frequency below 1% (Pulit et al., 2019). The covariates included in the regression model for BMI are not reported by the authors.
2.4.4 Educational Attainment
To our knowledge, the most recent and largest GWAS on EdAtt was conducted by Lee et al. (2018). This analysis was based on data from 1,131,881 individuals of European ancestry and identified 1,271 independent genome-wide significant SNPs. The SNP-based heritability was 12.2%. EdAtt was measured at the age of at least 30 by the number of years of schooling completed. The phenotype was constructed by mapping each major educational qualification that can be identified from the survey measure of the cohort to an International Standard Classification of Education (ISCED) category and imputing years-of-education equivalent for each ISCED category (Lee et al., 2018). Across all cohorts, the sample-size-weighted mean of educational years was 16.8 (SD = 4.2) of schooling. The following covariates were considered in the regression model: first ten principal components, standardized controls, including a third-order polynomial for the year of birth, sex, and their interactions, and a vector of study-specific controls.
2.4.5 Total White Blood Cell Count
We used the data from the latest GWAS on blood parameters for which summary statistics were made available (Chen et al., 2020). We used the results on the WBC of 562,132 participants of European descent. Information on the proportion of men and women is not published. The common SNPs explained 19% of the variance (h2SNP). WBCs were measured at a scale of 10–9 cells/L. The blood-cell phenotypes were corrected for sex, age, age squared, the first 10 genetic principal components, and other cohort-specific covariates (e.g., recruitment center) using the linear regression analysis. A rank-based inverse normal transformation of the residuals from the regression analysis was applied.
2.5 Statistical Analysis
Analyses were performed using the software “R” (3.5.1 and 4.1.1) and the R packages “TwoSampleMR” (0.4.26; https://github.com/MRCIEU/TwoSampleMR) (Hemani et al., 2018), “Mendelian Randomization” (0.5.1; https://CRAN.R-project.org/package=MendelianRandomization), “MVMR” (0.3; https://github.com/WSpiller/MVMR) (Sanderson et al., 2020), and “MR Practicals” (0.0.1; https://github.com/WSpiller/MRPracticals). MR PRESSO was conducted with the R package “rondolab/MR-PRESSO” (1.0; https://github.com/rondolab/MR-PRESSO) (Verbanck et al., 2018).
We followed the “STROBE-MR: Guidelines for strengthening the reporting of Mendelian randomization studies for the two-sample MR” recommendations reporting our results (Skrivankova et al., 2021).
3 Results
3.1 Univariable Mendelian Randomization
In the analysis on the causal effect of AAM on the risk for depression, 343 SNPs could be included as IV for AAM (for the harmonized data, see Supplementary Table S4. The F-test indicated a strong IV (F = 62,655.97). We found a significant causal effect of AAM on the risk for depression with almost all methods (except MR–Egger without bootstrapping and simple mode; Figure 1; Supplementary Table S1). Egger’s intercept was not significant (intercept = 2.1 × 10⁻⁴, SE = 0.001, p = 0.85). In contrast, MR PRESSO detected evidence of pleiotropy (global test 840.45, p = 1 × 10⁻⁴). In addition, the heterogeneity test indicated a potential problem (based on MR Egger: Q (df = 341) = 835.13, p = 2.22 × 10–42; based on IVW Q (df = 342) = 835.21, p = 3.49 × 10−43), but all the methods robust to heterogeneity (penalized weighted median, MR Lasso, and contamination mixture method) showed a significant causal effect of AAM on the risk for depression (Figure 1; Supplementary Table S1). The scatter plot, funnel plot, and forest plot for the leave-one-out analysis indicated no violation of MR assumptions or an undue impact of single SNPs on the results (Supplementary Figures S1–S3). Power analysis showed that our MR had a power of 80% to detect an OR below 0.975 or above 1.026 and a power of 100% to detect an OR below 0.955 or above 1.043 regarding depression per one-year change in AAM (Supplementary Figure S4).
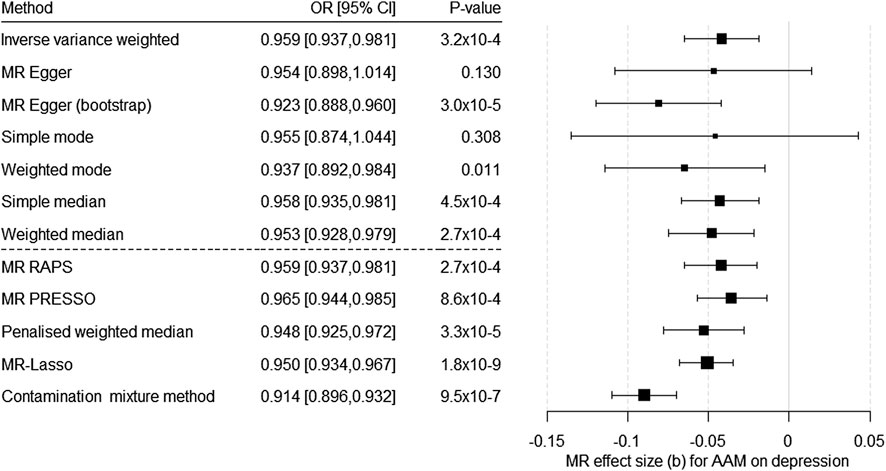
FIGURE 1. Results of the multiple-SNP Mendelian randomization (MR) analyses regarding the effect of age at menarche (AAM) on the risk for depression. OR = odds ratio, CI = confidence interval, b = unstandardized causal estimate of the change in risk for depression per 1-year change in age of menarche.
3.2 Multivariable Mendelian Randomization: Effect of AAM on Depression Adjusted for BMI, Educational Attainment, and Total White Blood Cell Count
By searching the PhenoScanner database for SNPs associated with AAM (Staley et al., 2016; Kamat et al., 2019), we identified 25 SNPs associated with different measures of intelligence, EdAtt, or both. Five SNPs (rs11210871, rs11209943, rs15092139, rs1054442, and rs1131017) were associated with different measures of intelligence and EdAtt. Five SNPs were associated only with intelligence but not with EdAtt, and there were 15 SNPs associated only with EdAtt. However, considering the SNP-based overlap between intelligence and EdAtt, the larger number of EdAtt-related SNPs, and the broader conception of EdAtt, also including aspects of socioeconomic status (Thomson, 2018), EdAtt was chosen for further MVMR analysis.
Strikingly often (N = 25), AAM-related SNPs were associated with different fractions of leukocytes (neutrophils, lymphocytes, monocytes, basophils, and eosinophils, but also the total WBC). Based on an additional literature review, we decided that EdAtt (Magnus et al., 2020; Yuan et al., 2021) and WBC (Magnus et al., 2020; Sealock et al., 2021) also needed consideration in our MVMR model, while other phenotypes, such as alcohol intake and smoking, were considered downstream outcomes of AAM (Hingson et al., 2006; Barrington-Trimis et al., 2020).
Considering 318 SNPs as IV for AAM and for BMI, EdAtt, and WBC as potential pleiotropic phenotypes (Supplementary Table S5) in the multivariable MR (MVMR), we found a significant causal effect of AAM on the risk for depression independent of BMI, EdAtt, and WBC (Table 1; Figure 2). The effect estimate for EdAtt, as covariable in the model on the effect of AAM on depression risk, was significant with all the three MVMR methods, whereas the effect estimate for the BMI was not significant. The effect estimate for WBC was significant only with the multivariable IVW method. The Q-statistic confirmed the validity of the IV [Q (df = 313) = 737.45; p = 2.8 × 10–36] as there was no evidence of significant heterogeneity. The conditional F-test showed that the IV was sufficiently strong for AAM (FTS = 20.39) but not for BMI (FTS = 9.23), EdAtt (FTS = 5.36), or WBC (FTS = 6.30).
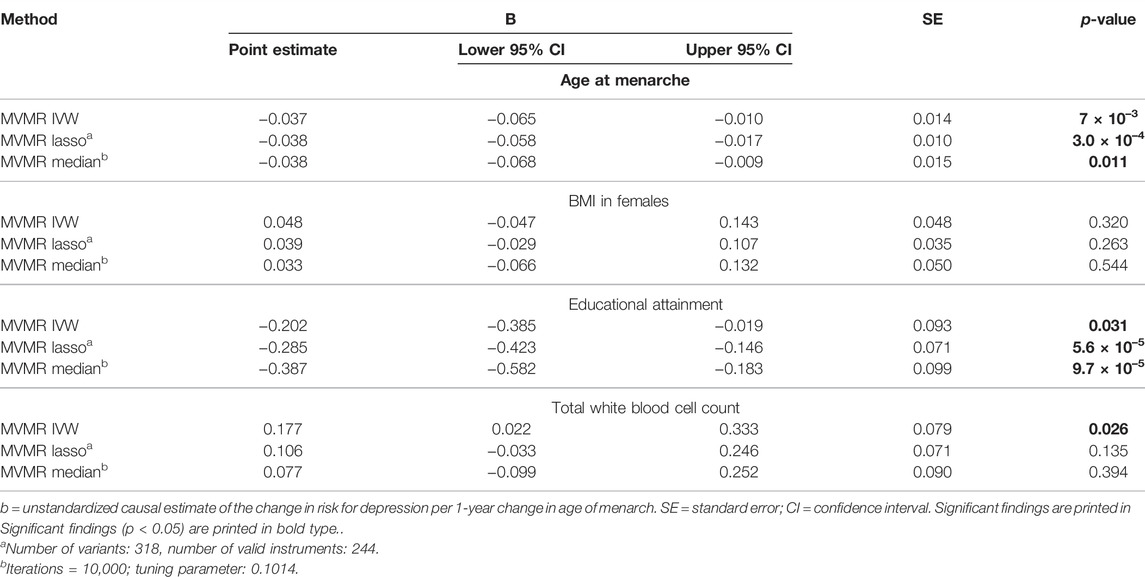
TABLE 1. Results of the multivariable MR (MVMR) analyses of the causal effect of age at menarche on the risk for depression adjusted for BMI in females, educational attainment, and total white blood cell count calculated using three different methods.
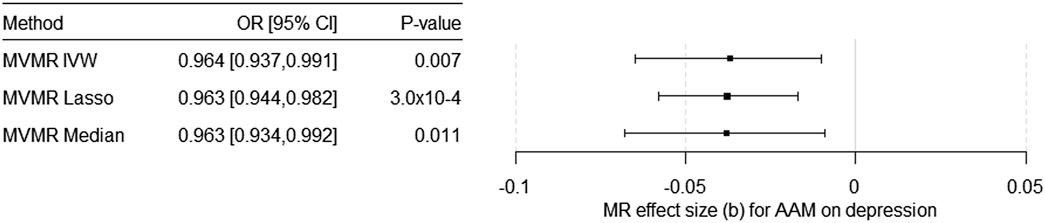
FIGURE 2. Results of the multivariable MR (MVMR) analyses of the causal effect of age at menarche (AAM) on the risk for depression adjusted for BMI in females, educational attainment, and total white blood cell count calculated using three different methods. OR = odds ratio, CI = confidence interval, b = unstandardized causal estimate of the change in risk for depression per 1-year change in age of menarche.
3.3 Sensitivity Analyses
3.3.1 Excluding SNPs Associated With BMI
BMI was not a strong instrument in the MVMR, but previous studies have convincingly shown that BMI is, nevertheless, a potential cause of horizontal pleiotropy in the association between AAM and the risk for depression. Therefore, we conducted a sensitivity analysis by excluding all the BMI-related SNPs with F > 10 from the IV. Thus, the IV could be built using 263 SNPs (for harmonized data, see Supplementary Table S6). Egger’s intercept (= 5.8 × 10⁻⁴, SE = 0.001) was not significant (p = 0.644). In contrast, MR-PRESSO detected SNPs with pleiotropic effects (global test = 560.14, p = 1 × 10⁻⁵). Consistent with the MR-PRESSO results, heterogeneity continued to be a potential problem [Cochran’s Q-statistic based on MR–Egger: Q (df = 261) = 554.70, p = 2.7 × 10⁻²³; based on IVW: Q (df = 262) = 555.15, p = 3.6 × 10⁻²³]. The scatter plot, funnel plot, and forest plot for the leave-one-out analysis showed no violation of the MR assumptions or the excessive influence of individual SNPs on the results (Supplementary Figures S5–S7). The robust methods confirmed the causal effect of AAM on the risk for depression (Figure 3A; Supplementary Table S2).
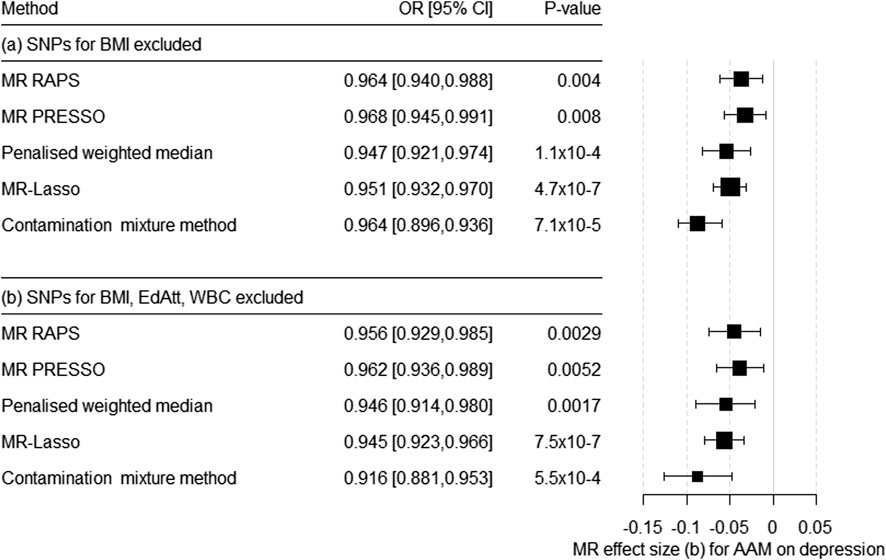
FIGURE 3. Results of the multiple-SNP Mendelian randomization (MR) analysis with robust methods regarding the effect of age at menarche (AAM) on the risk for depression. (a) SNPs associated with BMI were excluded (IV with n = 263 SNPs), (b) SNPs associated with BMI, educational attainment (EdAtt), and white blood cell count (WBC) were excluded (IV with n = 185 SNPs). OR = odds ratio, CI = confidence interval, b = unstandardized causal estimate of the change in risk for depression per 1-year change in age of menarche.
3.3.2 Excluding SNPs Associated With BMI, Educational Attainment, and Total White Blood Cell Count
Since educational attainment and WBC were also weak instruments in the MVMR, we conducted an additional univariate MR. Here, we excluded all the SNPs that were strong instruments for BMI, EdAtt, and/or WBC (F > 10). Thus, we were able to include 185 SNPs as IV for AAM (Supplementary Table S7). Egger’s intercept was not significant (= 3.0 × 10⁻⁵, p = 0.984). However, MR PRESSO identified SNPs with a pleiotropic effect (global test 347.18, p = 1 × 10⁻⁵). The heterogeneity tests were significant: based on MR-Egger—Q (df = 183) = 343.6, p = 6.8 × 10⁻¹² and based on IVW—Q (df = 184) = 343.6, p = 9.3 × 10⁻¹². Again, all robust methods suggested a significant causal effect of AAM on the risk for depression (Figure 3B; Supplementary Tables S3, Supplementary Figures S8–S10).
Eventually, pleiotropic SNPs identified by MR PRESSO by the previous step of analysis (rs10933, rs12571664, and rs2546959) were subjected to the PhenoScanner database to assess which other phenotypes, apart from BMI (or other body composition phenotypes), EdAtt, and WBC, might be causes of pleiotropy. The SNP rs10933 is located in a region associated (p < 1 × 10⁻⁵) with schizophrenia (Ripke, 2014), bipolar disorder (Sklar, 2011), intelligence, and some hematological traits (Astle et al., 2016). The region around SNP rs2546959 is associated with the “seen doctor for nerves, anxiety, tension, or depression”-phenotype detected by the Neale Lab (UK Biobank; http://www.nealelab.is/uk-biobank). According to the PhenoScanner database, the region around rs12571664 only showed associations with AAM and body size. Thus, there was no compelling evidence of phenotypes to pursue by further analyses.
4 Discussion
Observational studies suggest a robust contribution of AAM to depression, but there is also evidence of (residual) confounding. MR studies allow for causal conclusions, but findings in this regard have been ambiguous, primarily related to power issues in the previous MR analyses. In the present two-sample MR study with sufficient power to detect even small effects, an earlier AAM proved to be causal for an increased risk for depression, independent of the pleiotropic phenotypes BMI, EdAtt, and WBC, even when using multiple methods to account for heterogeneity of the IV (penalized weighted median, MR Lasso, and contamination mixture method), systematic and idiosyncratic pleiotropy (MR RAPS), and horizontal pleiotropy (MR PRESSO, exclusion of SNPs showing a relevant association with the potentially pleiotropic phenotypes, and MVMR).
4.1 Age at Menarche and Depression—Increased Lifetime Risk
Considering that no GWASs on depression in different age classes (e.g., children, adolescents, and adults) are available but the MR approach assesses the cumulative lifetime effects of an exposure on an outcome (Lawlor, 2016), two assumptions must be met for our conclusions to hold. First, the genetic architecture of depression, and second, the pathway(s) from AAM to depression should not change throughout the life course.
Regarding the first assumption, a meta-analysis on the heritability of depression from childhood to young adulthood found an increase in its heritability during adolescence (Bergen et al., 2007). This is in line with a more recent twin study including almost 50,000 twin pairs studied longitudinally from ages 3 to 63 (Nivard et al., 2015). However, a change in the heritability of depression does not necessarily imply a different regulation of its (genetic) underpinnings. Instead, the results from twin and adoption studies on the relative contribution of genetic and environmental influences on the heritability of depression over time suggest that this observation is likely explained within the framework of active genome-environment correlation, resulting in more opportunities during adolescence to express genetically determined dispositions, a decrease in shared environmental variance, a combination of both, and/or a reduction of measurement error related to more reliable information provided by more mature subjects (Silberg et al., 1999; Bergen et al., 2007; Nivard et al., 2015). Moreover, it has been suggested that phenotypical continuity regarding depression is mainly driven by genetic factors (Nivard et al., 2015). Consistent with this, a genome-wide association meta-analysis addressing internalizing symptoms suggested not only that (additive) genetic effects appear to be stable from early childhood to adolescence by overlapping SNP-based heritability estimates over age but also a high genetic correlation between childhood internalizing symptoms and adult depression (rg > 0.7) (Jami et al., 2022). The latter finding of a high but not perfect genetic correlation could be related to observing different (genetic) depression trajectories during earlier life. Rice et al. (2019) identified two trajectories of depressive symptoms from childhood to early adulthood, one commencing in later, one in earlier adolescence. However, only late-adolescent depression was related to a polygenic MDD risk score, while early-adolescent depression was linked to a higher (genetic) ADHD and schizophrenia risk. Thus, part of the phenotypical variance in depression during childhood and adolescence seems to be associated with different genetic pathways, even though the pathway leading to increased ADHD and schizophrenia is less common (Rice et al. 2019).
Regarding the second assumption, the finding of the one-sample MR study by Sequeira et al. (2017) showed that AAM only affects depression at age 14 but not thereafter, which could be interpreted to indicate that the relationship between AAM and depression is less stable than implied by our results. This would be consistent with the observation that the severity of depressive symptoms returned to early pubertal baseline levels in young adults in a large longitudinal study of (up to) 14,500 boys and girls (Natsuaki et al., 2009). However, as previously discussed, the study by Sequeira et al. (2017) was likely affected by insufficient power at depression assessments after age 14. Moreover, a plethora of longitudinal studies suggest that depressive symptoms peak not until (mid to) late adolescence and do not return to prepubertal or early pubertal baseline levels, (Harlow et al., 1999; Mendle et al., 2018; Copeland et al., 2019; Kwong et al., 2019), and this also applies regarding the effect of early menarche on depression (Mendle et al., 2018; Copeland et al., 2019).
4.2 Pathways From Age at Menarche to Depression
We observed significant heterogeneity in the causal estimates of our IV. Day et al. (2017) identified 389 independent signals for AAM, many of which are implicated in a complex and hierarchical network of genes governing the onset of puberty (Lomniczi et al., 2013). However, these SNPs also related to potentially pleiotropic phenotypes in the relationship between AAM and depression, including BMI, EdAtt, and WBC. BMI and AAM are closely intertwined (Day et al., 2017), as metabolic cues originating from adipose tissue essentially control the reactivation of the reproductive axis during puberty (Vazquez et al., 2019) and BMI also relates to depression (Bahrami et al., 2020). Moreover, the PhenoScanner search revealed that EdAtt and WBC are related to AAM, and both have been implicated in the etiology of depression (Sealock et al., 2021; Yuan et al., 2021), rendering these phenotypes likely causes of horizontal pleiotropy in the relationship between AAM and depression. Nevertheless, even when accounting for potential horizontal pleiotropy introduced by these phenotypes, there was a causal effect of AAM on the risk for depression, consistent across different approaches.
Interestingly, previous GWAS on the genetic underpinnings of AAM did not identify SNPs related to the biologically most plausible pathway from AAM to depression, that is, gonadal hormone levels. There is suggestive evidence for an impact of estradiol on depressive symptoms, not only from animal studies but also studies in pubescent adolescents (Brooks-Gunn and Warren, 1989; Ge and Natsuaki, 2009; Schulz et al., 2009). However, consistent with findings from GWASs, there are also conflicting results from observational studies (Golub and Harrington, 1981; Copeland et al., 2019; Morssinkhof et al., 2020), and a more recent one-sample MR study does not support a causal effect of estrogen levels on depressive symptoms (Au Yeung et al., 2016). Moreover, neither is there evidence of increased androgen levels in female MDD patients (de Wit et al., 2021) nor are testosterone levels in females likely causally related to depression (Maharjan et al., 2021). Whether upstream mechanisms of estrogen secretion are important in this regard remains to be determined but cannot be excluded. For example, LH receptors are expressed not only in testicular and ovarian tissue but also in the hippocampus (Bohm-Levine et al., 2020), a brain region pivotal to depression (Campbell and Macqueen, 2004). Moreover, depression is marked by altered LH secretion (Grambsch et al., 2004). However, altered pulsatile LH release from the pituitary gland might also be the consequence of increased cortisol levels in depression (Breen et al., 2005; Zorn et al., 2017) and, thus, simply an epiphenomenon of MDD but not its cause.
However, only recently, Magnus et al. (2020) opened up a perspective on the pathways from AAM to depression by a (one-sample) Mendelian randomization phenome-wide association study. Among 17,893 traits, 29 traits were found to be significantly related to AAM, including younger age at the first sexual intercourse, younger age of starting oral contraceptives, younger age at first delivery, and an increased risk of childhood sexual abuse, all of which are known to increase the risk for depression. The authors failed to replicate selected findings, for example, regarding the risk for childhood sexual abuse in an independent sample, but the direction and effect size were consistent. Thus, many of the identified traits could be on a causal pathway originating from (genetically determined) AAM as downstream mechanisms. Thus, the exact mechanisms by which AAM affects depression have yet to be conclusively elucidated but are likely related to the downstream outcomes of AAM.
4.3 Limitations
The analyses in the present study accounted for BMI, but this relied on the GWAS by Pulit et al. (2019) conducted in adults and, thus, the assumption of continuity of its genetic architecture over the life course. A recent meta-analysis of 26 GWASs on childhood BMI, including the data from 61,111 children, identified 25 loci (Vogelezang et al., 2020). In line with our assumption, most of these SNPs (20 of 25) were also related to adult BMI, and there was a genetic correlation between childhood and adult BMI of rg = 0.76. Moreover, the GWAS by Pulit et al. (2019) allowed us to use sex-specific BMI-related findings pertaining only to females.
The genetic instruments for EdAtt, WBS, and depression were not sex-specific, as no such information is available. However, sex was included as a covariate in the regression models of the GWASs of EdAtt and depression. Moreover, regarding depression, a recent study that evaluated between-sex genetic heterogeneity in MDD using GWAS summary statistics from 29 cohorts found a genetic correlation close to one (Trzaskowski et al., 2019), and an even more recent GWAS meta-analysis suggests that for a broad range of neuropsychiatric traits, including MDD, the effect of sex is only small and polygenic (Martin et al., 2021). Thus, the results of our analyses are unlikely to be affected by missing the gender-specific effect estimates.
We were limited to analyzing a linear relationship between AAM and depression as the estimation of nonlinear effects requires individual-level genetic data that were not available to us. However, a nonlinear relationship cannot be excluded. In a study by Day et al. (2015), earlier menarche was associated with a higher risk of all-cause mortality, while later menarche was not protective but likewise harmful. Interestingly, regarding depression, there was no evidence of any relationship, either linear or nonlinear, after correction for multiple testing. However, this may have been an issue of the (non-genetic) statistical approach chosen and/or insufficient power. Nonetheless, even when assuming a curvilinear relationship, this would support the conclusion that earlier AAM was causally related to increased depression risk, even though we could not consider nonlinear effects in the present study.
Two-sample MR assumes independent samples for the instrument variable and the outcome. Violation of this assumption may lead to inflated type 1 error and biased effect estimates. This, however, only applies to continuous but not binary outcomes, as in the present study (Burgess et al., 2016).
As previously mentioned, the covariance between AAM, BMI, EdAtt, and WBC could not be considered in the multivariable MR analysis because individual data were not available. Moreover, our results apply to the Caucasian population only and likely do not generalize to patients with precocious puberty, even though SNPs in genes related to precocious puberty were used as IV as well (Day et al., 2017).
4.4 Implications
The present study provides evidence for a causal contribution of an earlier AAM to a higher risk for depression, which has several implications. First, the results of the present study support conclusions from previous epidemiological studies implicating AAM in depression without the pitfalls of residual confounding and reverse causation. Second, as a consequence, health care providers should be aware of the timing of menarche in women and its potential lifelong implications for mental health. Thus, AAM could be considered a prognostic factor for a clinical risk score assessing the probability of depression during adolescence, also in terms of mental illness prevention, to help guide practitioners identify young women at risk for depression. Third, considering the adverse consequences of an earlier AAM on mental health, this should foster efforts to address risk factors (e.g., BMI, socioeconomic status, paternal absence, migration status, and birth weight) that promote an earlier AAM and/or to promote protective factors, including the duration of schooling and a higher level of educational attainment, to mitigate a genetically determined pathway to depression.
Data Availability Statement
Publicly available datasets analyzed in this study can be found here: https://www.ebi.ac.uk/gwas/. Original data generated and analyzed during this study (i.e., harmonized genetic data) can be found here: https://doi.org/10.6084/m9.figshare.19518982.v4.
Ethics Statement
Ethical review and approval was not required for the study on human participants in accordance with the local legislation and institutional requirements. Written informed consent for participation was not required for this study in accordance with the national legislation and the institutional requirements.
Author Contributions
RH and TP planned the study, performed the analyses, and wrote the manuscript. RN implemented the R-Packages for MR. All other authors participated in scientific discussions and revised the manuscript. All authors approved of the submitted version.
Funding
RH was supported by the UMEA Clinical Scientist Program by the Faculty of Medicine of the University of Duisburg-Essen and the German Research Foundation (DFG). The authors also acknowledge support from the Open Access Publication Fund of the University of Duisburg-Essen. The funders had no role in the study design, data collection and analysis, decision to publish, or manuscript preparation.
Conflict of Interest
The authors declare that the research was conducted in the absence of any commercial or financial relationships that could be construed as a potential conflict of interest.
Publisher’s Note
All claims expressed in this article are solely those of the authors and do not necessarily represent those of their affiliated organizations, or those of the publisher, the editors, and the reviewers. Any product that may be evaluated in this article, or claim that may be made by its manufacturer, is not guaranteed or endorsed by the publisher.
Supplementary Material
The Supplementary Material for this article can be found online at: https://www.frontiersin.org/articles/10.3389/fgene.2022.918584/full#supplementary-material
References
Astle, W. J., Elding, H., Jiang, T., Allen, D., Ruklisa, D., Mann, A. L., et al. (2016). The Allelic Landscape of Human Blood Cell Trait Variation and Links to Common Complex Disease. Cell 167 (5), 1415–1429. doi:10.1016/j.cell.2016.10.042
Au Yeung, S. L., Jiang, C., Cheng, K. K., Xu, L., Zhang, W., Lam, T. H., et al. (2018). Age at Menarche and Depressive Symptoms in Older Southern Chinese Women: A Mendelian Randomization Study in the Guangzhou Biobank Cohort Study. Psychiatry Res. 259, 32–35. doi:10.1016/j.psychres.2017.09.040
Au Yeung, S. L., Jiang, C., Cheng, K. K., Zhang, W., Lam, T. H., Leung, G. M., et al. (2016). Genetically Predicted 17beta-Estradiol, Cognitive Function and Depressive Symptoms in Women: A Mendelian Randomization in the Guangzhou Biobank Cohort Study. Prev. Med. 88, 80–85. doi:10.1016/j.ypmed.2016.03.002
Bahrami, S., Steen, N. E., Shadrin, A., O’Connell, K., Frei, O., Bettella, F., et al. (2020). Shared Genetic Loci between Body Mass Index and Major Psychiatric Disorders: A Genome-wide Association Study. JAMA Psychiatry 77 (5), 503–512. doi:10.1001/jamapsychiatry.2019.4188
Barrington-Trimis, J. L., Braymiller, J. L., Unger, J. B., McConnell, R., Stokes, A., Leventhal, A. M., et al. (2020). Trends in the Age of Cigarette Smoking Initiation Among Young Adults in the US from 2002 to 2018. JAMA Netw. Open 3 (10), e2019022. doi:10.1001/jamanetworkopen.2020.19022
Bergen, S. E., Gardner, C. O., and Kendler, K. S. (2007). Age-related Changes in Heritability of Behavioral Phenotypes over Adolescence and Young Adulthood: a Meta-Analysis. Twin Res. Hum. Genet. 10 (3), 423–433. doi:10.1375/twin.10.3.423
Besser, L. M., Brenowitz, W. D., Meyer, O. L., Hoermann, S., and Renne, J. (2021). Methods to Address Self-Selection and Reverse Causation in Studies of Neighborhood Environments and Brain Health. Int. J. Environ. Res. Public Health 18 (12), 6484. doi:10.3390/ijerph18126484
Bohm-Levine, N., Goldberg, A. R., Mariani, M., Frankfurt, M., and Thornton, J. (2020). Reducing Luteinizing Hormone Levels after Ovariectomy Improves Spatial Memory: Possible Role of Brain-Derived Neurotrophic Factor. Horm. Behav. 118, 104590. doi:10.1016/j.yhbeh.2019.104590
Bowden, J., Davey Smith, G., and Burgess, S. (2015). Mendelian Randomization with Invalid Instruments: Effect Estimation and Bias Detection through Egger Regression. Int. J. Epidemiol. 44 (2), 512–525. doi:10.1093/ije/dyv080
Bowden, J., Davey Smith, G., Haycock, P. C., and Burgess, S. (2016). Consistent Estimation in Mendelian Randomization with Some Invalid Instruments Using a Weighted Median Estimator. Genet. Epidemiol. 40 (4), 304–314. doi:10.1002/gepi.21965
Breen, K. M., Billings, H. J., Wagenmaker, E. R., Wessinger, E. W., and Karsch, F. J. (2005). Endocrine Basis for Disruptive Effects of Cortisol on Preovulatory Events. Endocrinology 146 (4), 2107–2115. doi:10.1210/en.2004-1457
Brion, M.-J. A., Shakhbazov, K., and Visscher, P. M. (2013). Calculating Statistical Power in Mendelian Randomization Studies. Int. J. Epidemiol. 42 (5), 1497–1501. doi:10.1093/ije/dyt179
Brooks-Gunn, J., and Warren, M. P. (1989). Biological and Social Contributions to Negative Affect in Young Adolescent Girls. Child. Dev. 60 (1), 40–55. doi:10.2307/1131069
Burgess, S., Bowden, J., Fall, T., Ingelsson, E., and Thompson, S. G. (2017a). Sensitivity Analyses for Robust Causal Inference from Mendelian Randomization Analyses with Multiple Genetic Variants. Epidemiol. Camb. Mass. 28 (1), 30–42. doi:10.1097/EDE.0000000000000559
Burgess, S., Davey Smith, G., Davies, N. M., Dudbridge, F., Gill, D., Glymour, M. M., et al. (2019). Guidelines for Performing Mendelian Randomization Investigations. Wellcome Open Res. 4, 186. doi:10.12688/wellcomeopenres.15555.1
Burgess, S., Davies, N. M., and Thompson, S. G. (2016). Bias Due to Participant Overlap in Two-Sample Mendelian Randomization. Genet. Epidemiol. 40 (7), 597–608. doi:10.1002/gepi.21998
Burgess, S., Foley, C. N., Allara, E., Staley, J. R., and Howson, J. M. M. (2020). A Robust and Efficient Method for Mendelian Randomization with Hundreds of Genetic Variants. Nat. Commun. 11 (1), 376. doi:10.1038/s41467-019-14156-4
Burgess, S., Small, D. S., and Thompson, S. G. (2017b). A Review of Instrumental Variable Estimators for Mendelian Randomization. Stat. Methods Med. Res. 26 (5), 2333–2355. doi:10.1177/0962280215597579
Burgess, S., and Thompson, S. G. (2017). Interpreting Findings from Mendelian Randomization Using the MR-Egger Method. Eur. J. Epidemiol. 32 (5), 377–389. doi:10.1007/s10654-017-0255-x
Burgess, S., and Thompson, S. G. (2015). Multivariable Mendelian Randomization: the Use of Pleiotropic Genetic Variants to Estimate Causal Effects. Am. J. Epidemiol. 181 (4), 251–260. doi:10.1093/aje/kwu283
Campbell, S., and Macqueen, G. (2004). The Role of the hippocampus in the Pathophysiology of Major Depression. J. Psychiatry Neurosci. 29 (6), 417–426.
Carter, R., Caldwell, C. H., Matusko, N., Antonucci, T., and Jackson, J. S. (2011). Ethnicity, Perceived Pubertal Timing, Externalizing Behaviors, and Depressive Symptoms Among Black Adolescent Girls. J. Youth Adolesc. 40 (10), 1394–1406. doi:10.1007/s10964-010-9611-9
Casanova, F., O’Loughlin, J., Martin, S., Beaumont, R. N., Wood, A. R., Watkins, E. R., et al. (2021). Higher Adiposity and Mental Health: Causal Inference Using Mendelian Randomization. Hum. Mol. Genet. 30 (24), 2371–2382. doi:10.1093/hmg/ddab204
Chan, Y.-M., Feld, A., and Jonsdottir-Lewis, E. (2019). Effects of the Timing of Sex-Steroid Exposure in Adolescence on Adult Health Outcomes. J. Clin. Endocrinol. Metab. 104 (10), 4578–4586. doi:10.1210/jc.2019-00569
Chen, M. H., Raffield, L. M., Mousas, A., Sakaue, S., Huffman, J. E., Moscati, A., et al. (2020). Trans-ethnic and Ancestry-Specific Blood-Cell Genetics in 746,667 Individuals from 5 Global Populations. Cell 182 (5), 1198–1213.e14. doi:10.1016/j.cell.2020.06.045
Copeland, W. E., Worthman, C., Shanahan, L., Costello, E. J., and Angold, A. (2019). Early Pubertal Timing and Testosterone Associated with Higher Levels of Adolescent Depression in Girls. J. Am. Acad. Child Adolesc. Psychiatry 58 (12), 1197–1206. doi:10.1016/j.jaac.2019.02.007
Davies, N. M., Holmes, M. V., and Davey Smith, G. (2018). Reading Mendelian Randomisation Studies: a Guide, Glossary, and Checklist for Clinicians. Bmj 362, k601. doi:10.1136/bmj.k601
Day, F. R., Thompson, D. J., Helgason, H., Chasman, D. I., Finucane, H., Sulem, P., et al. (2017). Genomic Analyses Identify Hundreds of Variants Associated with Age at Menarche and Support a Role for Puberty Timing in Cancer Risk. Nat. Genet. 49 (6), 834–841. doi:10.1038/ng.3841
Day, F. R., Elks, C. E., Murray, A., Ong, K. K., and Perry, J. R. B. (2015). Puberty Timing Associated with Diabetes, Cardiovascular Disease and Also Diverse Health Outcomes in Men and Women: the UK Biobank Study. Sci. Rep. 5, 11208. doi:10.1038/srep11208
de Wit, A. E., Giltay, E. J., de Boer, M. K., Bosker, F. J., Cohn, A. Y., Nolen, W. A., et al. (2021). Plasma Androgens and the Presence and Course of Depression in a Large Cohort of Women. Transl. Psychiatry 11 (1), 124. doi:10.1038/s41398-021-01249-2
Del Greco, M. F., Minelli, C., Sheehan, N. A., and Thompson, J. R. (2015). Detecting Pleiotropy in Mendelian Randomisation Studies with Summary Data and a Continuous Outcome. Stat. Med. 34 (21), 2926–2940. doi:10.1002/sim.6522
Gaysina, D., Richards, M., Kuh, D., and Hardy, R. (2015). Pubertal Maturation and Affective Symptoms in Adolescence and Adulthood: Evidence from a Prospective Birth Cohort. Dev. Psychopathol. 27 (4 Pt 1), 1331–1340. doi:10.1017/s0954579414001448
Ge, X., and Natsuaki, M. N. (2009). In Search of Explanations for Early Pubertal Timing Effects on Developmental Psychopathology. Curr. Dir. Psychol. Sci. 18 (6), 327–331. doi:10.1111/j.1467-8721.2009.01661.x
Golub, S., and Harrington, D. M. (1981). Premenstrual and Menstrual Mood Changes in Adolescent Women. J. Personal. Soc. Psychol. 41 (5), 961–965. doi:10.1037/0022-3514.41.5.961
Grambsch, P., Young, E. A., and Meller, W. H. (2004). Pulsatile Luteinizing Hormone Disruption in Depression. Psychoneuroendocrinology 29 (7), 825–829. doi:10.1016/s0306-4530(03)00146-x
Harlow, B. L., Cohen, L. S., Otto, M. W., Spiegelman, D., and Cramer, D. W. (1999). Prevalence and Predictors of Depressive Symptoms in Older Premenopausal Women: the Harvard Study of Moods and Cycles. Arch. Gen. Psychiatry 56 (5), 418–424. doi:10.1001/archpsyc.56.5.418
Hartwig, F. P., Davey Smith, G., and Bowden, J. (2017). Robust Inference in Summary Data Mendelian Randomization via the Zero Modal Pleiotropy Assumption. Int. J. Epidemiol. 46 (6), 1985–1998. doi:10.1093/ije/dyx102
Haycock, P. C., Burgess, S., Wade, K. H., Bowden, J., Relton, C., and Davey Smith, G. (2016). Best (But Oft-Forgotten) Practices: the Design, Analysis, and Interpretation of Mendelian Randomization Studies. Am. J. Clin. Nutr. 103 (4), 965–978. doi:10.3945/ajcn.115.118216
Hemani, G., Zheng, J., Elsworth, B., Wade, K. H., Haberland, V., Baird, D., et al. (2018). The MR-Base Platform Supports Systematic Causal Inference across the Human Phenome. Elife 7, e34408. doi:10.7554/eLife.34408
Hingson, R. W., Heeren, T., and Winter, M. R. (2006). Age at Drinking Onset and Alcohol Dependence: Age at Onset, Duration, and Severity. Arch. Pediatr. Adolesc. Med. 160 (7), 739–746. doi:10.1001/archpedi.160.7.739
Howard, D. M., Adams, M. J., Adams, M. J., Shirali, M., Clarke, T.-K., Marioni, R. E., et al. (2018). Genome-wide Association Study of Depression Phenotypes in UK Biobank Identifies Variants in Excitatory Synaptic Pathways. Nat. Commun. 9 (1), 1470. doi:10.1038/s41467-018-03819-3
Howard, D. M., Adams, M. J., Clarke, T.-K., Hafferty, J. D., Gibson, J., Shirali, M., et al. (2019). Genome-wide Meta-Analysis of Depression Identifies 102 Independent Variants and Highlights the Importance of the Prefrontal Brain Regions. Nat. Neurosci. 22 (3), 343–352. doi:10.1038/s41593-018-0326-7
Hyde, C. L., Nagle, M. W., Tian, C., Chen, X., Paciga, S. A., Wendland, J. R., et al. (2016). Identification of 15 Genetic Loci Associated with Risk of Major Depression in Individuals of European Descent. Nat. Genet. 48 (9), 1031–1036. doi:10.1038/ng.3623
Jami, E. S., Hammerschlag, A. R., Ip, H. F., Allegrini, A. G., Benyamin, B., Border, R., et al. (2022). Genome-wide Association Meta-Analysis of Childhood and Adolescent Internalizing Symptoms. J. Am. Acad. Child. Adolesc. Psychiatry. doi:10.1016/j.jaac.2021.11.035
Kamat, M. A., Blackshaw, J. A., Young, R., Surendran, P., Burgess, S., Danesh, J., et al. (2019). PhenoScanner V2: an Expanded Tool for Searching Human Genotype-Phenotype Associations. Bioinformatics 35 (22), 4851–4853. doi:10.1093/bioinformatics/btz469
Katikireddi, S. V., Green, M. J., Taylor, A. E., Davey Smith, G., and Munafò, M. R. (2018). Assessing Causal Relationships Using Genetic Proxies for Exposures: an Introduction to Mendelian Randomization. Addiction 113 (4), 764–774. doi:10.1111/add.14038
König, I. R., and Greco, F. M. D. (2018). Mendelian Randomization: Progressing towards Understanding Causality. Ann. Neurol. 84 (2), 176–177. doi:10.1002/ana.25293
Kwong, A. S. F., Manley, D., Timpson, N. J., Pearson, R. M., Heron, J., Sallis, H., et al. (2019). Identifying Critical Points of Trajectories of Depressive Symptoms from Childhood to Young Adulthood. J. Youth Adolesc. 48 (4), 815–827. doi:10.1007/s10964-018-0976-5
Lawlor, D. A. (2016). Commentary: Two-Sample Mendelian Randomization: Opportunities and Challenges. Int. J. Epidemiol. 45 (3), 908–915. doi:10.1093/ije/dyw127
Lawlor, D. A., Harbord, R. M., Sterne, J. A. C., Timpson, N., and Davey Smith, G. (2008). Mendelian Randomization: Using Genes as Instruments for Making Causal Inferences in Epidemiology. Stat. Med. 27 (8), 1133–1163. doi:10.1002/sim.3034
Lee, J. J., Wedow, R., Wedow, R., Okbay, A., Kong, E., Maghzian, O., et al. (2018). Gene Discovery and Polygenic Prediction from a Genome-wide Association Study of Educational Attainment in 1.1 Million Individuals. Nat. Genet. 50 (8), 1112–1121. doi:10.1038/s41588-018-0147-3
Lomniczi, A., Wright, H., Castellano, J. M., Sonmez, K., and Ojeda, S. R. (2013). A System Biology Approach to Identify Regulatory Pathways Underlying the Neuroendocrine Control of Female Puberty in Rats and Nonhuman Primates. Horm. Behav. 64 (2), 175–186. doi:10.1016/j.yhbeh.2012.09.013
Magnus, M. C., Guyatt, A. L., Lawn, R. B., Wyss, A. B., Trajanoska, K., Küpers, L. K., et al. (2020). Identifying Potential Causal Effects of Age at Menarche: a Mendelian Randomization Phenome-wide Association Study. BMC Med. 18 (1), 71. doi:10.1186/s12916-020-01515-y
Maharjan, D. T., Syed, A. A. S., Lin, G. N., and Ying, W. (2021). Testosterone in Female Depression: A Meta-Analysis and Mendelian Randomization Study. Biomolecules 11 (3), 409. doi:10.3390/biom11030409
Martin, J., Khramtsova, E. A., Goleva, S. B., Blokland, G. A. M., Traglia, M., Walters, R. K., et al. (2021). Examining Sex-Differentiated Genetic Effects across Neuropsychiatric and Behavioral Traits. Biol. Psychiatry 89 (12), 1127–1137. doi:10.1016/j.biopsych.2020.12.024
Mendle, J., Ryan, R. M., and McKone, K. M. P. (2018). Age at Menarche, Depression, and Antisocial Behavior in Adulthood. Pediatrics 141 (1), e20171703. doi:10.1542/peds.2017-1703
Morssinkhof, M. W. L., van Wylick, D. W., Priester-Vink, S., van der Werf, Y. D., den Heijer, M., van den Heuvel, O. A., et al. (2020). Associations between Sex Hormones, Sleep Problems and Depression: A Systematic Review. Neurosci. Biobehav. Rev. 118, 669–680. doi:10.1016/j.neubiorev.2020.08.006
Natsuaki, M. N., Biehl, M. C., and Ge, X. (2009). Trajectories of Depressed Mood from Early Adolescence to Young Adulthood: The Effects of Pubertal Timing and Adolescent Dating. J. Res. Adolesc. 19 (1), 47–74. doi:10.1111/j.1532-7795.2009.00581.x
Nivard, M. G., Dolan, C. V., Kendler, K. S., Kan, K.-J., Willemsen, G., van Beijsterveldt, C. E. M., et al. (2015). Stability in Symptoms of Anxiety and Depression as a Function of Genotype and Environment: a Longitudinal Twin Study from Ages 3 to 63 Years. Psychol. Med. 45 (5), 1039–1049. doi:10.1017/s003329171400213x
Platt, J. M., Colich, N. L., McLaughlin, K. A., Gary, D., and Keyes, K. M. (2017). Transdiagnostic Psychiatric Disorder Risk Associated with Early Age of Menarche: A Latent Modeling Approach. Compr. Psychiatry 79, 70–79. doi:10.1016/j.comppsych.2017.06.010
Pulit, S. L., Stoneman, C., Morris, A. P., Wood, A. R., Glastonbury, C. A., Tyrrell, J., et al. (2019). Meta-analysis of Genome-wide Association Studies for Body Fat Distribution in 694 649 Individuals of European Ancestry. Hum. Mol. Genet. 28 (1), 166–174. doi:10.1093/hmg/ddy327
Rees, J. M. B., Wood, A. M., Dudbridge, F., and Burgess, S. (2019). Robust Methods in Mendelian Randomization via Penalization of Heterogeneous Causal Estimates. PLoS One 14 (9), e0222362. doi:10.1371/journal.pone.0222362
Rice, F., Riglin, L., Thapar, A. K., Heron, J., Anney, R., O’Donovan, M. C., et al. (2019). Characterizing Developmental Trajectories and the Role of Neuropsychiatric Genetic Risk Variants in Early-Onset Depression. JAMA Psychiatry 76 (3), 306–313. doi:10.1001/jamapsychiatry.2018.3338
Ripke, S. (2014). Biological Insights from 108 Schizophrenia-Associated Genetic Loci. Nature 511 (7510), 421–427. doi:10.1038/nature13595
Sanderson, E., Spiller, W., and Bowden, J. (2020). Testing and Correcting for Weak and Pleiotropic Instruments in Two-Sample Multivariable Mendelian Randomization. Stat. Med. 40 (25), 5434–5452. doi:10.1101/2020.04.02.021980
Schulz, K. M., Molenda-Figueira, H. A., and Sisk, C. L. (2009). Back to the Future: The Organizational-Activational Hypothesis Adapted to Puberty and Adolescence. Horm. Behav. 55 (5), 597–604. doi:10.1016/j.yhbeh.2009.03.010
Sealock, J. M., Lee, Y. H., Moscati, A., Venkatesh, S., Voloudakis, G., Straub, P., et al. (2021). Use of the PsycheMERGE Network to Investigate the Association between Depression Polygenic Scores and White Blood Cell Count. JAMA Psychiatry 78 (12), 1365–1374. doi:10.1001/jamapsychiatry.2021.2959
Sequeira, M.-E., Lewis, S. J., Bonilla, C., Smith, G. D., and Joinson, C. (2017). Association of Timing of Menarche with Depressive Symptoms and Depression in Adolescence: Mendelian Randomisation Study. Br. J. Psychiatry 210 (1), 39–46. doi:10.1192/bjp.bp.115.168617
Silberg, J., Pickles, A., Rutter, M., Hewitt, J., Simonoff, E., Maes, H., et al. (1999). The Influence of Genetic Factors and Life Stress on Depression Among Adolescent Girls. Arch. Gen. Psychiatry 56 (3), 225–232. doi:10.1001/archpsyc.56.3.225
Sklar, P. (2011). Large-scale Genome-wide Association Analysis of Bipolar Disorder Identifies a New Susceptibility Locus Near ODZ4. Nat. Genet. 43 (10), 977–983. doi:10.1038/ng.943
Skoog, T., and Stattin, H. (2014). Why and under what Contextual Conditions Do Early-Maturing Girls Develop Problem Behaviors? Child. Dev. Perspect. 8 (3), 158–162. doi:10.1111/cdep.12076
Skrivankova, V. W., Richmond, R. C., Woolf, B. A. R., Yarmolinsky, J., Davies, N. M., Swanson, S. A., et al. (2021). Strengthening the Reporting of Observational Studies in Epidemiology Using Mendelian Randomization: The STROBE-MR Statement. Jama 326 (16), 1614–1621. doi:10.1001/jama.2021.18236
Smith-Woolley, E., Rimfeld, K., and Plomin, R. (2017). Weak Associations between Pubertal Development and Psychiatric and Behavioral Problems. Transl. Psychiatry 7 (4), e1098. doi:10.1038/tp.2017.63
Staley, J. R., Blackshaw, J., Kamat, M. A., Ellis, S., Surendran, P., Sun, B. B., et al. (2016). PhenoScanner: a Database of Human Genotype-Phenotype Associations. Bioinformatics 32 (20), 3207–3209. doi:10.1093/bioinformatics/btw373
Swerdlow, D. I., Kuchenbaecker, K. B., Shah, S., Sofat, R., Holmes, M. V., White, J., et al. (2016). Selecting Instruments for Mendelian Randomization in the Wake of Genome-wide Association Studies. Int. J. Epidemiol. 45 (5), 1600–1616. doi:10.1093/ije/dyw088
Thapar, A., Collishaw, S., Pine, D. S., and Thapar, A. K. (2012). Depression in Adolescence. Lancet 379 (9820), 1056–1067. doi:10.1016/s0140-6736(11)60871-4
Thomson, S. (2018). Achievement at School and Socioeconomic Background-An Educational Perspective. Npj Sci. Learn 3, 5. doi:10.1038/s41539-018-0022-0
Trzaskowski, M., Mehta, D., Peyrot, W. J., Hawkes, D., Davies, D., Howard, D. M., et al. (2019). Quantifying Between-Cohort and Between-Sex Genetic Heterogeneity in Major Depressive Disorder. Am. J. Med. Genet. 180 (6), 439–447. doi:10.1002/ajmg.b.32713
Ullsperger, J. M., and Nikolas, M. A. (2017). A Meta-Analytic Review of the Association between Pubertal Timing and Psychopathology in Adolescence: Are There Sex Differences in Risk? Psychol. Bull. 143 (9), 903–938. doi:10.1037/bul0000106
Vaughan, E. B., Van Hulle, C. A., Beasley, W. H., Rodgers, J. L., and D’Onofrio, B. M. (2015). Clarifying the Associations between Age at Menarche and Adolescent Emotional and Behavioral Problems. J. Youth Adolesc. 44 (4), 922–939. doi:10.1007/s10964-015-0255-7
Vazquez, M. J., Velasco, I., and Tena-Sempere, M. (2019). Novel Mechanisms for the Metabolic Control of Puberty: Implications for Pubertal Alterations in Early-Onset Obesity and Malnutrition. J. Endocrinol. 242 (2), R51–r65. doi:10.1530/joe-19-0223
Verbanck, M., Chen, C.-Y., Neale, B., and Do, R. (2018). Detection of Widespread Horizontal Pleiotropy in Causal Relationships Inferred from Mendelian Randomization between Complex Traits and Diseases. Nat. Genet. 50 (5), 693–698. doi:10.1038/s41588-018-0099-7
Vogelezang, S., Bradfield, J. P., Ahluwalia, T. S., Curtin, J. A., Lakka, T. A., Grarup, N., et al. (2020). Novel Loci for Childhood Body Mass Index and Shared Heritability with Adult Cardiometabolic Traits. PLoS Genet. 16 (10), e1008718. doi:10.1371/journal.pgen.1008718
Winer, J. P., Parent, J., Forehand, R., and Breslend, N. L. (2016). Interactive Effects of Psychosocial Stress and Early Pubertal Timing on Youth Depression and Anxiety: Contextual Amplification in Family and Peer Environments. J. Child. Fam. Stud. 25 (5), 1375–1384. doi:10.1007/s10826-015-0318-0
Wray, N. R., Ripke, S., Mattheisen, M., Trzaskowski, M., Byrne, E. M., Abdellaoui, A., et al. (2018). Genome-wide Association Analyses Identify 44 Risk Variants and Refine the Genetic Architecture of Major Depression. Nat. Genet. 50 (5), 668–681. doi:10.1038/s41588-018-0090-3
Yuan, S., Xiong, Y., Michaëlsson, M., Michaëlsson, K., and Larsson, S. C. (2021). Genetically Predicted Education Attainment in Relation to Somatic and Mental Health. Sci. Rep. 11 (1), 4296. doi:10.1038/s41598-021-83801-0
Zhao, Q., Wang, J., Hemani, G., Bowden, J., and Small, D. S. (2020). Statistical Inference in Two-Sample Summary-Data Mendelian Randomization Using Robust Adjusted Profile Score. Ann. Stat. 48 (3), 1742–1769. doi:10.1214/19-aos1866
Keywords: depression, age at menarche, Mendelian randomization, BMI, puberty
Citation: Hirtz R, Hars C, Naaresh R, Laabs B-H, Antel J, Grasemann C, Hinney A, Hebebrand J and Peters T (2022) Causal Effect of Age at Menarche on the Risk for Depression: Results From a Two-Sample Multivariable Mendelian Randomization Study. Front. Genet. 13:918584. doi: 10.3389/fgene.2022.918584
Received: 12 April 2022; Accepted: 06 June 2022;
Published: 12 July 2022.
Edited by:
Manuel Mattheisen, Dalhousie University, CanadaReviewed by:
David J. Vandenbergh, The Pennsylvania State University (PSU), United StatesJaakko Tapio Leinonen, University of Helsinki, Finland
Copyright © 2022 Hirtz, Hars, Naaresh, Laabs, Antel, Grasemann, Hinney, Hebebrand and Peters. This is an open-access article distributed under the terms of the Creative Commons Attribution License (CC BY). The use, distribution or reproduction in other forums is permitted, provided the original author(s) and the copyright owner(s) are credited and that the original publication in this journal is cited, in accordance with accepted academic practice. No use, distribution or reproduction is permitted which does not comply with these terms.
*Correspondence: Raphael Hirtz, cmFwaGFlbC5oaXJ0ekB1ay1lc3Nlbi5kZQ==, b3JjaWQub3JnLzAwMDAtMDAwMy0xMTYyLTQzMDU=