 Shaojie Li†
 Qiuji Wu
 Yahua Zhong
94% of researchers rate our articles as excellent or good
Learn more about the work of our research integrity team to safeguard the quality of each article we publish.
Find out more
ORIGINAL RESEARCH article
Front. Genet., 12 May 2022
Sec. Cancer Genetics and Oncogenomics
Volume 13 - 2022 | https://doi.org/10.3389/fgene.2022.903634
This article is part of the Research TopicEpigenetic Regulation and Non-histone Post-translational Modification in CancerView all 15 articles
Background: N6-methyladenosine (m6A) is the most abundant internal modification pattern in mammals that a plays critical role in tumorigenesis and immune regulations. However, the effect of m6A modification on head and neck squamous cell carcinoma (HNSCC) has not been clearly studied.
Methods: We screened m6A regulators that were significantly correlated with tumor immune status indicated by ImmuneScore using The Cancer Genome Atlas (TCGA) dataset and obtained distinct patient clusters based on the expression of these m6A regulators with the R package “CensusClusterPlus.” We then performed gene set enrichment analysis (GSEA), CIBERSORT, and single-sample gene set enrichment analysis (ssGSEA) to assess the differences in gene function enrichment and tumor immune microenvironment (TIME) among these clusters. We further conducted differently expressed gene (DEG) analysis and weighted gene co-expression network analysis (WGCNA) and constructed a protein–protein interaction (PPI) network to determine hub genes among these clusters. Finally, we used the GSE65858 dataset as an external validation cohort to confirm the immune profiles related to the expression of m6A regulators.
Results: Two m6A readers, YTHDF1 and IGF2BP2, were found to be significantly associated with distinct immune status in HNSCC. Accordingly, patients were divided into two clusters with Cluster 1 showing high expression of YTHDF1 and IGF2BP2 and Cluster 2 showing low expression levels of both genes. Clinicopathologically, patients from Cluster 1 had more advanced T stage and pathological grades than those from Cluster 2. GSEA showed that Cluster 1 was closely related to the RNA modification process and Cluster 2 was significantly correlated with immune regulations. Cluster 2 had a more active TIME characterized by a more relative abundance of CD8+ T cells and CD4+ T cells and higher levels of MHC I and MHC II molecules. We constructed a PPI network composed of 16 hub genes between the two clusters, which participated in the T-cell receptor signaling pathway. These results were externally validated in the GSE65858 dataset.
Conclusions: The m6A readers, YTHDF1 and IGF2BP2, were potential immune biomarkers in HNSCC and could be potential treatment targets for cancer immunotherapy.
M6A is a critical and abundant internal epigenetic modification on both messenger RNA (mRNA) and non-coding RNAs in mammals. M6A modification is mainly found in the 3′ untranslated regions of the RNA. The reversible and dynamic regulation of m6A is mainly mediated by three different kinds of regulators, namely, writers, erasers, and readers (Roundtree et al., 2017; Nombela et al., 2021). Writers and erasers are methyltransferases (such as METTL3, METTL16, and WTAP) and demethylases (such as ALKBH5 and FTO) that methylate and demethylate RNA adenosine at specific N6 positions, respectively. Readers are a group of RNA binding proteins that recognize m6A sites and initiate downstream events such as RNA splicing, maturation, degradation, and translation (Li Y et al., 2019; Zaccara et al., 2019). These proteins include members of the EIF3, IGF2BP family and YTH family. By modulating RNA export, RNA stability, protein expression, and other biological activities, m6A modification plays an essential role in cancer development. In line with these findings, emerging drugs targeting m6A modification, such as a selective inhibitor of FTO, METTL3, and YTHDF2 have shown promising anti-cancer effects (Huang et al., 2015; Visvanathan et al., 2018; Dixit et al., 2021).
The detailed mechanism by which m6A modification impacts cancer pathogenesis remains unclear. A recent study indicated that m6A also has a dual role in tumorigenesis. Liu et al. reported that YTHDF1 promoted ovarian cancer progression via augmenting EIF3C translation (Liu et al., 2020). Li et al. reported that IGF2BP2 prevented SOX2 degradation, leading to colorectal cancer pathogenesis and progression (Li T et al., 2019). Meanwhile, Zhong et al. reported that m6A helped suppress hepatocellular carcinoma through YTHDF2-directed degradation of EGFR (Zhong et al., 2019). Importantly, m6A modification also has a nonnegligible impact on anti-tumor immunity. Overexpression of YTHDF1 enhanced the stability of RNA lysosomal proteases, which led to the degradation of tumor antigens in dendritic cells, disabled CD8+ T cells to bring about immunosurveillance and abolished the effect of immune checkpoint inhibitors (ICIs) (Han et al., 2019). Suppression of METTL3 and METTL14 increased infiltration of CD8+ T cells and secretion of IFN-γ, CXCL9, and CXCL10 in TIME and promoted the response to ICIs in melanoma and pMMR-MSIlow colorectal cancer (Wang et al., 2020). However, research aiming to explore the effect of m6A modification on immune profiles in HNSCC is inadequate.
HNSCC is the sixth most common malignant tumor worldwide. Its occurrence is closely linked to carcinogen exposure and viral infection, especially human papillomavirus (HPV) and Epstein–Barr virus (EBV) (Siegel et al., 2021). HNSCC is a group of heterogeneous cancers, and the majority of patients are presented with locally advanced or metastatic stage, leading to poor prognosis (Argiris et al., 2008; Chow, 2020). ICIs-based immunotherapy has prominently improved the efficacy and survival of advanced HNSCC. However, only a small subset of patients could benefit from immunotherapy. Although a combined positive score (CPS) of PD-L1 expression is mostly used to guide immunotherapy, currently no satisfactory predictive biomarker is available for HNSCC.
Here, we attempted to explore the role of m6A regulators in the immune modulation of HNSCC and tried to identify potential m6A-associated biomarkers of immunotherapy in HNSCC. This study might provide a new way to improve the effect of immunotherapy in HNSCC.
We downloaded the transcriptomic data (HTSeq-FPKM and HTSeq-Counts) and clinical information of an HNSCC cohort from the TCGA-database (https://portal.gdc.cancer.gov/). Data of HTSeq-Counts was used to analyze DEGs, and HTSeq-FPKM was used to conduct ESTIMATE, clustering, CIBERSORT, ssGSEA, and WGCNA. Mann-Whitney U test was performed to compare age and gene expression between two groups. Chi-square test was utilized to compare gender, T stage, N stage, and pathologic stage. Spearman’s coefficient was used to conduct correlation analysis. And a p-value < 0.05 (two-sided) was considered statistically significant. Meanwhile, we conducted an external validation dataset by downloading the expression profiling data of the GSE65858 array from the Gene Expression Omnibus (GEO) database (https://www.ncbi.nlm.nih.gov/geo/).
We employed the ESTIMATE tool embedded in the R package “estimate” that used gene expression signatures to infer the fraction of stromal and immune cells in the tumor samples and to estimate the elements of tumor microenvironment (TME), including StromalScore, ImmuneScore, ESTIMATEScore, and TumorPurity (Yoshihara et al., 2013).
To explore the influence of m6A modification on immune profiles of HNSCC, we calculated the correlation between the expression of m6A modification regulators and ESTIMATE results with Spearman’s coefficient. And then we performed consensus clustering of tumor samples based on the expression of YTHDF1 and IGF2BP2. We accomplished consensus clustering and result visualization with the R package “ConsensusClusterPlus” (Wilkerson and Hayes, 2010). And we examined the efficacy of the above consensus clustering by principal component analysis (PCA) with the R package “factoextra.” The Kaplan–Meier method and log-rank test were utilized to compare overall survival between the two clusters.
We employed the software GSEA (https://www.gsea-msigdb.org/gsea/) to determine different pathways enriched in the two clusters based on the default defined set of genes (Mootha et al., 2003; Subramanian et al., 2005). We selected “c5.go.cc.v7.4.symbols.gmt” from MSigDB Collection as pre-defined ontology gene set, and considered a pathway as significantly enriched pathway with the absolute normalized enrichment score > 1 (|NES| >1) and p value < 0.05.
CIBERSORT, a method excelling in decreasing noise and unknown mixtures and identifying similar cell types, was conducted to recognize the cell composition of solid tumors by using gene expression profiles (Newman et al., 2015). ssGSEA, an extension of GSEA, was used to calculate separate enrichment scores for each pairing of a sample and gene set (Hänzelmann et al., 2013). We applied both strategies to explore the difference and relation of TIME among the clusters of patients with HNSCC.
In order to explore the hub genes that contributed to biological divergences among different patient clusters, we performed an analysis of DEGs and WGCNA successively. First, the R package “limma” enabled us to compare transcriptome data (HTSeq-Counts) to locate DEGs. The screening thresholds were set as |log2FoldChange | > 0.6 and p-value of < 0.05, and the results were visualized by volcano plot and heat map. Then, we conducted WGCNA on the DEGs with the R package “WGCNA,” which was a system biology method to gather closely related genes in special modules and calculate the relationship between the modules and external sample traits (Zhang and Horvath, 2005; Langfelder and Horvath, 2008). We explored the connection of DEGs with clustering and four aspects of ESTIMATE. Finally, we selected the module of genes tightly related to both clustering and ImmuneScore for subsequent analysis.
In order to investigate the above module of genes ulteriorly, we uploaded the gene list to Metascape (http://metascape.org/) for pathway and process enrichment analysis and PPI enrichment analysis (Zhou et al., 2019). Functional enrichment analysis was carried out in various ontology sources, including GO Biological Processes, Reactome Gene Sets, KEGG Pathway, Canonical Pathways, and WikiPathways. PPI enrichment analysis was also performed, and if the number of proteins in the network fell between 3 and 500, the Molecular Complex Detection (MCODE) algorithm would be carried out to separate proteins to build interaction networks more precisely (Bader and Hogue, 2003).
After excluding repeated samples and those without adequate survival information, we got 499 patients of HNSCC with unique samples for the following analysis. To explore whether the expression of m6A regulators impacted HNSCC immune profiles, we extracted the expression of 21 m6A modification regulators (Table 1) and applied the ESTIMATE tool and CIBERSORT algorithm to calculate the ESTIMATE scores and immune cells infiltration of 499 HNSCC patients. By analyzing the correlation between m6A regulators’ expression and the ImmuneScore, we found that YTHDC2 and RBM15 were positively correlated with ImmuneScore, while YTHDF1, YTHDC1, METTL3, METTL16, IGF2BP1-3, HNRNPC, and HNRNPA2B1 were negatively correlated with ImmuneScore (Figure 1). Next, we sorted the absolute values of the ImmuneScores correlated with the 21 m6A regulators (Supplementary Material S1). We selected the first two regulators with the highest ImmuneScores, YTHDF1 and IGF2BP2, to construct an immune-associated signature.

TABLE 1. Summary of common m6A regulators.
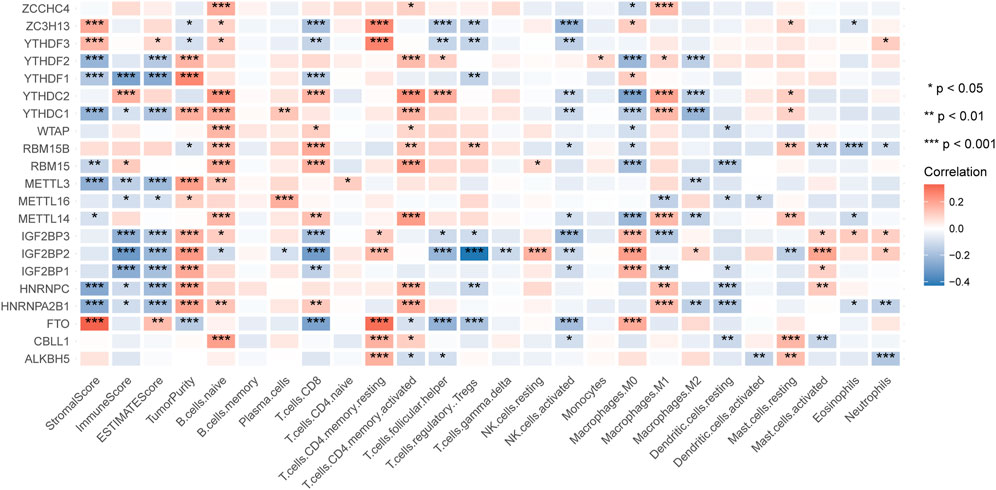
FIGURE 1. The correlation of m6A regulators with the results of ESTIMATE and CIBERSORT.
We extracted the expression data of YTHDF1 and IGF2BP2 of the 499 HNSCC patients and performed consensus clustering, and obtained two clusters of patients (Figure 2A). There were 294 patients in Cluster 1 and 205 patients in Cluster 2. After excluding 106 patients without tumor stage and tumor grade information, the clinical characteristics of the remaining 393 patients were summarized in Table 2. PCA plot indicated the above clustering had good efficiency of distinction (Figure 2B). Cluster 1 had higher expression of YTHDF1 and IGF2BP2 (Figure 2C), and a more advanced T stage and pathological grade than Cluster 2 (Table 2). Expression levels of YTHDF1 and IGF2BP2 were also compared between tumor tissue and normal tissue, and we found that both of them were higher expressed in tumor tissue (Figure 2D). Kaplan–Meier curve (Figure 2E) showed that patients in Cluster 2 had better overall survival than their counterparts in Cluster 1 (HR = 0.65, 95%CI [0.50–0.85], p = 0.0023).
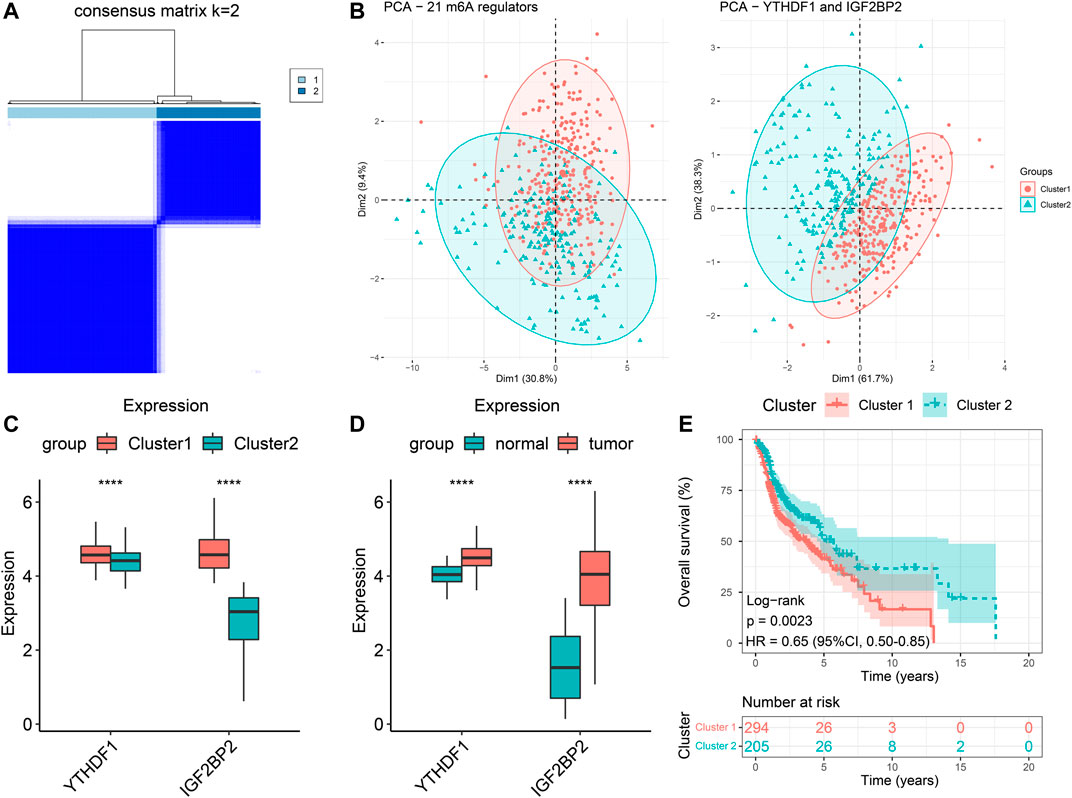
FIGURE 2. Clustering of patients with HNSCC in TCGA cohort based on expression of YTHDF1 and IGF2BP2. (A) Consensus clustering matrix for k = 2. (B) The results of PCA of clustering based on 21 m6A regulators as well as YTHDF1 and IGF2BP2. (C) Comparison the expression levels of YTHDF1 and IGF2BP2 between Cluster 1 and Cluster 2. (D) Comparison of the expression levels of YTHDF1 and IGF2BP2 between tumor samples and normal samples. (E) Kaplan–Meier curves of the overall survival in two clusters. ****p < 0.0001.
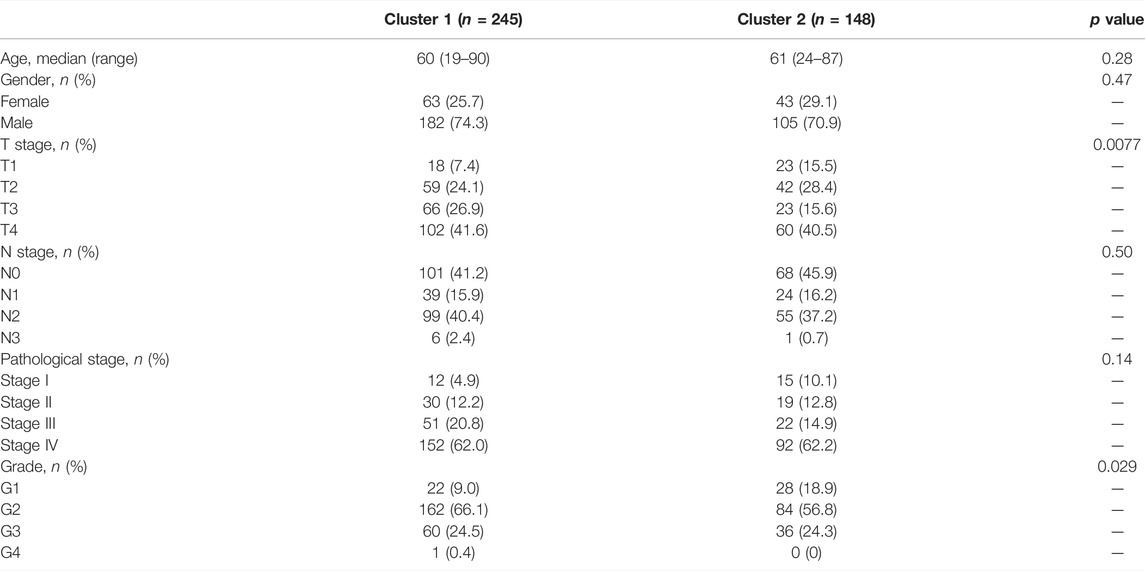
TABLE 2. Summary of clinical characteristics of patients in the two clusters.
GSEA was performed to compare pathway enrichment between the two clusters. We found that biological pathways related to m6A modification including negative regulation of DNA repair, regulation of mRNA catabolic progress, and nuclear export, were enriched in Cluster 1. On the other side, immune-related biological pathways, such as humoral immune response, positive regulation of NK cell-mediated cytotoxicity, and regulation of inflammatory response to an antigenic stimulus, were more enriched in Cluster 2 (Figure 3A). These results indicated that Cluster 2 was closely associated with immune modulation of head and neck cancers. In order to comprehend the difference in immune infiltration profiles between Cluster 1 and Cluster 2, we performed CIBERSORT, ssGSEA, and compared the expression of immune-related genes. The results of CIBERSORT indicated that CD4+ T memory resting cells, resting NK cells, M0 macrophages, and activated mast cells had higher percentages in Cluster 1. Cluster 2 highly expressed plasma cells, CD8+ T cells, regulatory T cells, and resting mast cells (Supplementary Figure S1). Furthermore, the results of ssGSEA were in parallel with the results of CIBERSORT and demonstrated the majority of immune cell types, including activated CD8+ T cells, activated CD4+ T cells, activated B cells, and natural killer cells, were enriched in the TIME of Cluster 2. Therefore, Cluster 2 manifested more active anti-tumor immune cell gathering (Figure 3B). Next, we compared the expression of critical immune-related molecules. Both MHC I and II molecules played a central role in the adaptive immune response. MHC I molecule were encoded by HLA-A and HLA-B genes, and MHC II molecules were encoded by HLA-DP, HLA-DQ, and HLA-DR genes. Cluster 2 had higher levels of MHC I and II molecules compared with Cluster 1. TGFB1 encoded transforming growth factor-β (TGF-β) and FAP coded fibroblast activation protein alpha (FAP), both of which took part in disabling anti-tumor immune cells and impeding infiltration of immune cells. Cluster 2 had lower levels of TGF-β and FAP than Cluster 1 (Figure 3C). These results showed that Cluster 2 had a more immune-stimulatory TIME than Cluster 1.
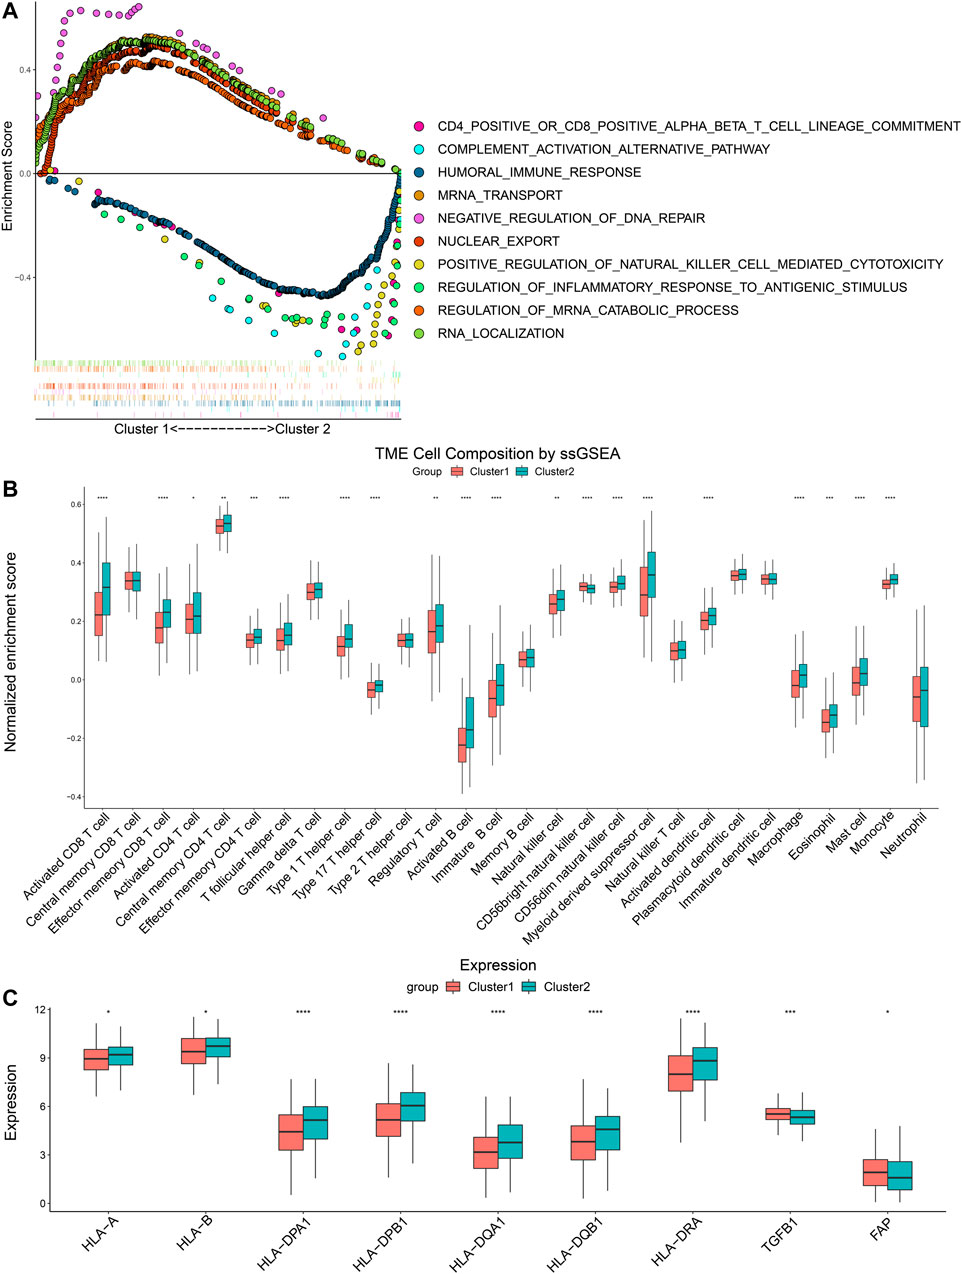
FIGURE 3. Differences of GSEA and immune cells infiltration between two clusters. (A) The tendency of enrichment of biological pathways between two clusters. (B) ssGSEA indicated different immune cells infiltration between two clusters. (C) Comparison of immune-related molecules between Cluster 1 and Cluster 2. *p < 0.05, **p < 0.01, ***p < 0.001, ****p < 0.0001.
Several genes were known to influence biological behavior and response to immunotherapy of HNSCC (Supplementary Material S2). We compared their expression levels between Cluster 1 and Cluster 2 in the TCGA cohort (Figure 4A) and the GEO cohort (Figure 4B). PDCD1, CTLA4, and TNFRSF4 (encoding OX40) were higher expressed in Cluster 2, while the expression of CD276 and EGFR were higher in Cluster 1. But there was no significant difference in the expression of CD274 (encoding PD-L1) between the two clusters. The higher expression of CD276 and EGFR suggested that the HNSCC of Cluster 1 might connect with worse biological behavior.
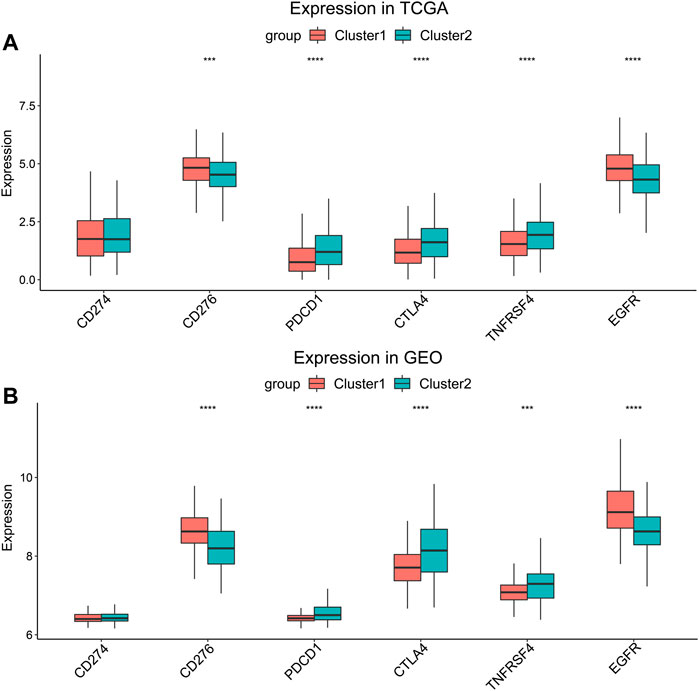
FIGURE 4. Expression level comparison of HNSCC-related genes. (A) TCGA cohort and (B) GEO cohort. ***p < 0.001, ****p < 0.0001.
After removing duplicated samples and extracting mRNA expression from original transcriptome data (HTSeq-Counts), we got a matrix of 499 tumor patients with a unique sample and 18,192 gene expression data. We performed DEG analysis between the two clusters and obtained 1127 DEGs (671 upregulated and 456 downregulated). A volcano plot and heatmap were used to visualize the DEG results (Figures 5A,B). We set 3 as the soft power (Supplementary Figure S2) and then divided the 1127 DEGs into 11 modules by conducting WGCNA (Supplementary Figure S3), and we found that the turquoise module, containing 416 genes, was the most relevant with both clustering (R = 0.38, P = 7e−19) and ImmuneScore (R = 0.86, P = 1e−146) (Figure 5C). These results suggested that DEGs of the turquoise modules played an important role in influencing clustering and immune profiles.
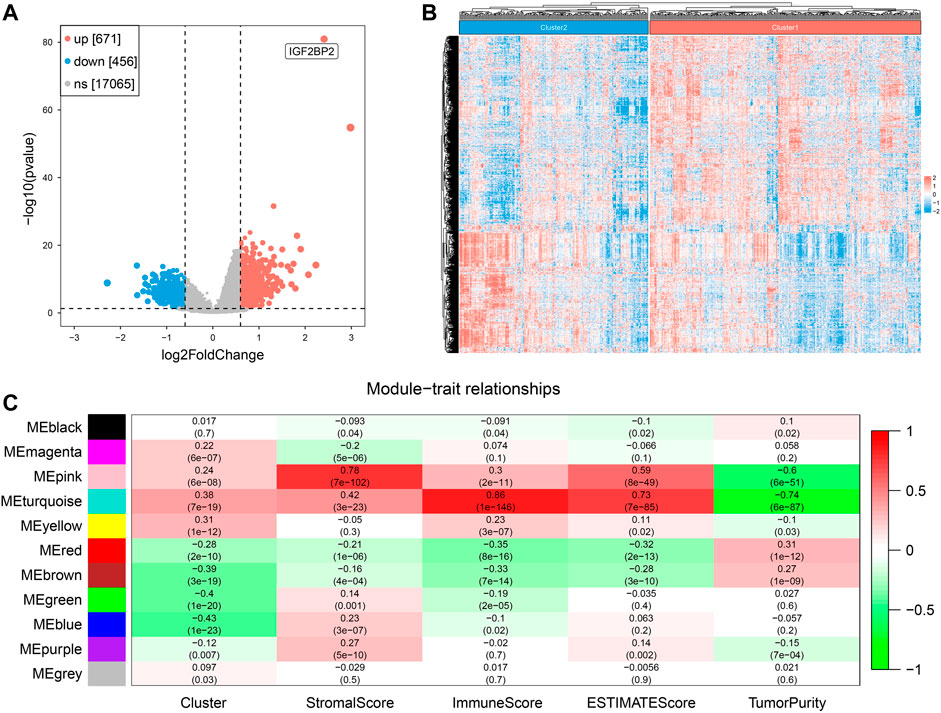
FIGURE 5. Screening of hub genes related to clustering and ImmuneScore in two clusters. (A) The volcano plot for results of differentially expressed genes. (B) The heatmap of differentially expressed genes. (C) Correlation of gene modules with results of clustering and ESTIMATE.
In order to better understand genes in the turquoise model, we uploaded them to Metascape for functional enrichment analysis and constructed the PPI network. The most significant pathways in the functional enrichment analysis were related to immune modulation, including lymphocyte activation, positive regulation of immune response, regulation of immune effector process, and B cell activation (Figures 6A,B). In the PPI network analysis, the MCODE algorithm further divided the whole PPI network into two major MCODEs. The MCODE 1 was related to G alpha (i) signaling events and GPCR ligand binding. The MCODE2 contained 16 genes (PDCD1, CD28, CD247, CD3D, CD3E, CD3G, CD8A, CD8B, HLA-DPB1, HLA-DQA2, HLA-DQB2, GRAP2, TRAT1, SKAP1, ZAP70, and ITK) was tightly correlated with the generation of second messenger molecules and T-cell receptor signaling pathway (Figure 6C).
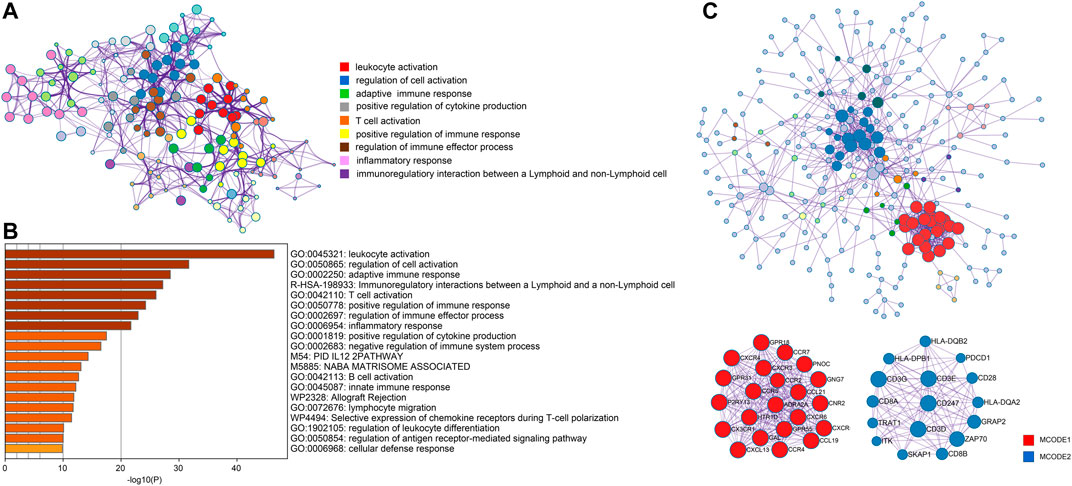
FIGURE 6. Analysis of functional enrichment and construction of PPI network. (A) Selected enriched terms for a network, colored by cluster group ID. (B) Functional enrichment analysis in various ontology sources. (C) Protein-protein interaction network analysis for whole selected genes and two highlighted MCODE components.
To externally validate the significance of the m6A reader-based clustering, we obtained the expression profiling data of the GSE65858 array from the GEO database. The GSE65858 array involved 270 patients with HNSCC. Similarly, we performed consensus clustering in the 270 patients using the R package “ConsensusClusterPlus,” and found that the optimal number of clustering was 2 (Figure 7A). PCA plot indicated the above clustering had good efficiency of distinction (Figure 7B). There were 137 patients in Cluster 1 and 133 patients in Cluster 2, and the latter had significantly lower expression of YTHDF1 and IGF2BP2 (Figure 7C). We also performed CIBERSORT and ssGSEA to estimate TME composition. The results of CIBERSORT showed that, compared with Cluster 1, Cluster 2 had significantly more plasma cells, CD8+ T cells, regulatory T cells, gamma delta T cells, and less activated dendritic cells and activated mast cells (Supplementary Figure S4). In addition, results obtained from ssGSEA indicated that Cluster 2 highly expressed activated CD8+ T cells, activated CD4+ T cells, T helper cells (Type 1 and 17), and activated B cells, indicating that Cluster 2 had a more favorable TIME than Cluster 1 (Figure 7D). A comparison of immune-related molecules was also performed, and we found Cluster 2 had higher expression of MHC II molecule and lower levels of TGF-β and FAP (Figure 7E). The above results from the GEO database confirmed that YTHDF1- and IGF2BP2-based patient clustering showed distinct immune profiles.
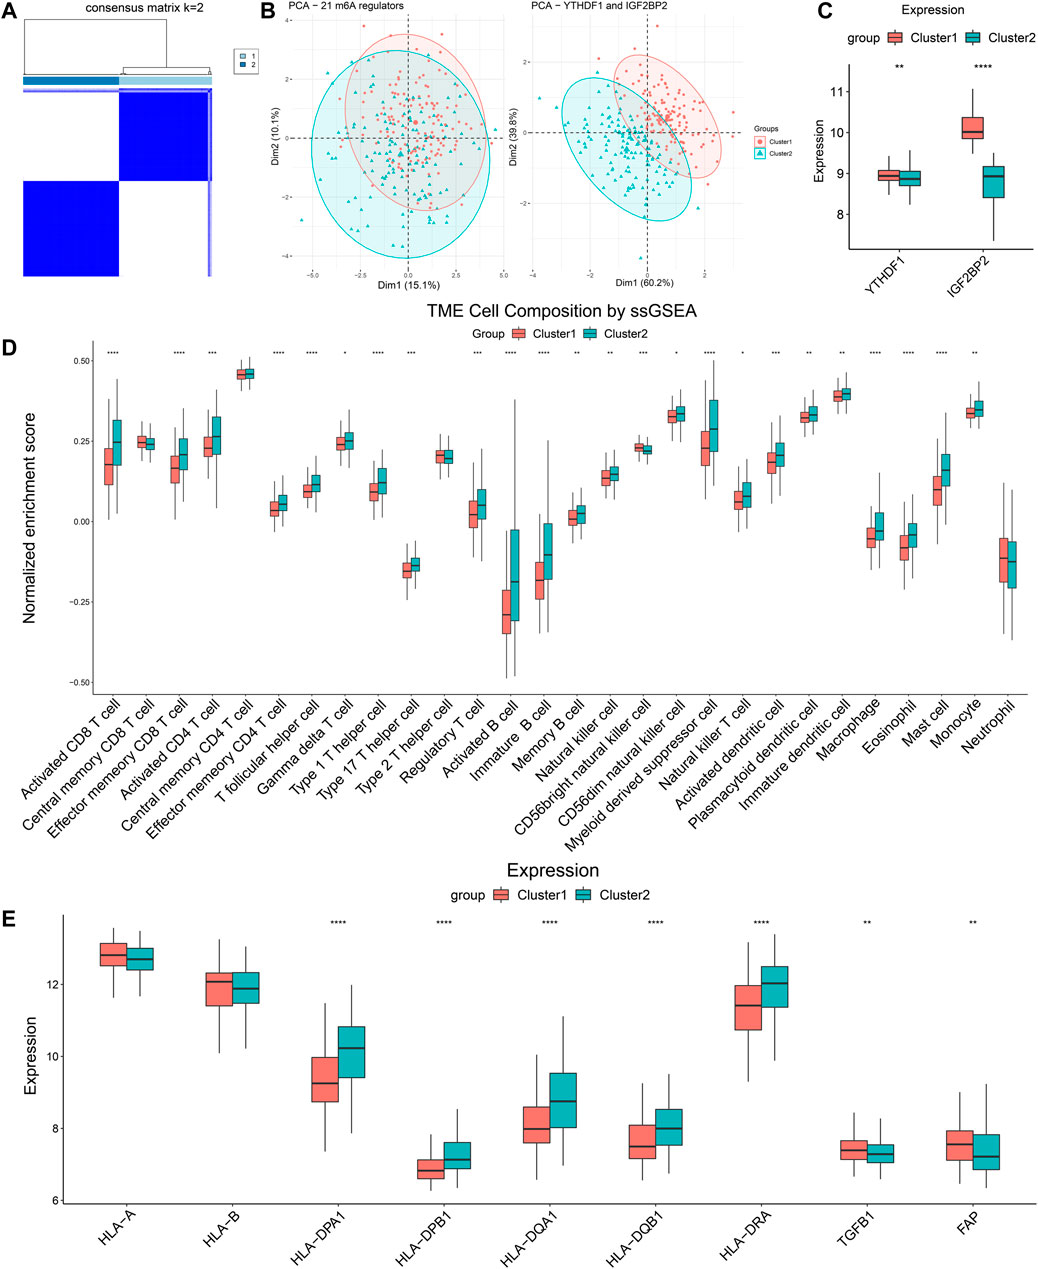
FIGURE 7. Validation of clustering based on YTHDF1 and IGF2BP2 in GSE65858. (A) Consensus clustering matrix for k = 2. (B) The results of PCA of clustering based on 21 m6A regulators as well as YTHDF1 and IGF2BP2. (C) Comparison of expression level of YTHDF1 and IGF2BP2 between Cluster 1 and Cluster 2. (D) ssGSEA indicated different immune cells infiltration between two clusters. (E) Comparison of immune-related molecules between Cluster 1 and Cluster 2. *p < 0.05, **p < 0.01, ***p < 0.001, ****p < 0.0001.
m6A methylation on mRNA is an abundant internal epigenetic modification that has attracted great attention in recent decades, especially in the tumor research area. Exiting research studies had revealed the complex roles of m6A in cancer by regulating the expression of oncogenes and tumor suppressor genes. This effect was cancer-dependent and also varied among different types of m6A regulators. For instance, the m6A writer, METTL3 was found to promote the translation of c-MYC and BCL2 to accelerate leukemia progression by suppressing differentiation and apoptosis in acute myelocytic leukemia (Vu et al., 2017). On the other hand, the m6A eraser, FTO was found to promote the degradation of BNIP3 and inhibited the proliferation and invasion of breast cancer cells (Niu et al., 2019). And the readers, including EIF3, YTH family, and IGF2BP family, mainly regulated the translation and degradation of targeted RNA to participate in m6A modification. Recent studies demonstrated that m6A modification played an important role in regulating the immune response. Targeting and disabling IGF2BPs through circNDUFB2 could prevent the progression of non-small cell lung cancer and activate anti-tumor immunity (Li et al., 2021). YTHDF1 mediated the increase of lysosomal proteases and tumor antigen degradation in dendritic cells and could weaken anti-tumor response and disable CD8+ T cells (Han et al., 2019). However, research about the effect of m6A modification on HNSCC was inadequate.
We utilized transcriptomic data from the TCGA dataset and GEO dataset to establish an m6A regulator-based immune phenotype of HNSCC. Specifically, we found that two readers of m6A, IGF2BP2, and YTHDF1 could effectively indicate immune-stimulatory and immune-suppressive HNSCC. To this end, we scored every patient in the TCGA cohort with the ESTIMATE tool and CIBERSORT algorithm to calculate the correlation of m6A regulators with ESTIMATE scores and immune cells infiltration. The absolute Spearman’s coefficient of ImmuneScore of IGF2BP1, IGF2BP2, IGF2BP3 and YTHDF1 were above 0.2. We selected two with the highest absolute coefficients, IGF2BP2, and YTHDF1 for the following analysis. We found patients with HNSCC could be divided into two clusters with different immune profiles based on the expression of IGF2BP2 and YTHDF1. TME was roughly categorized into three types, namely “infiltrated,” “excluded” and “desert” (Hegde and Chen, 2020). The infiltrated type was characterized by sufficient infiltration of CD8+ T cells and a high level of MHC I molecule. Desert type was featured by the absence of CD8+ T cell infiltration, low level of MHC I molecule, and high level of FAP. According to the expression profiles of immune cells and immune molecules, we tended to consider Cluster 1 as excluded or desert type and Cluster 2 as infiltrated type. In addition, GSEA demonstrated that a number of signal pathways related to immune response were enriched in Cluster 2. Therefore, it was speculated that the TME of Cluster 2 was more favorable for ICIs-based immunotherapy.
Overexpression of EGFR could be detected in over 90% of HNSCC, which was an important signal receptor that brings about tumorigenesis, proliferation, and metastasis through downstream pathways, including PI3K/AKT and MAPK (Nicholson et al., 2001; Citri and Yarden, 2006). CD276, also named B7-H3, was one of the immune checkpoint molecules, which was upregulated in HNSCC and helped tumor cells evade immunological surveillance. High expression of CD276 was related to the occurrence, progression, and metastasis of HNSCC(Wang et al., 2021). Both EGFR and CD276 were found highly expressed in Cluster 1, indicating that HNSCC of Cluster 1 were more likely to correlate with worse biological behavior, poorer clinical result, and insensitivity to ICIs-based immunotherapy. However, EGFR antibodies or CD276 blockade could be considered for HNSCC of Cluster 1.
To further investigate internal influencing factors between the two clusters, we screened DEGs and performed WGCNA to find the module closely related to clustering and ImmuneScores. Successively, we constructed a PPI network, we finally obtained 16 genes (PDCD1, CD28, CD247, CD3D, CD3E, CD3G, CD8A, CD8B, HLA-DPB1, HLA-DQA2, HLA-DQB2, GRAP2, TRAT1, SKAP1, ZAP70, and ITK). These 16 hub genes were all upregulated in Cluster 2. PDCD1 was a receptor of immunosuppression usually expressed in activated T cells. CD28 played an essential role in T cells proliferation, and survival, and provided the second signal for T cell activation (Esensten et al., 2016). CD247, CD3D, CD3E, and CD3G participated in constituting T-cell receptor-CD3 complex (TCR-CD3) to recognize antigens and deliver the first signal for T cell activation (Kuhns et al., 2006). CD8A and CD8B acted as co-receptors for TCR (Rudolph et al., 2006). MHC II molecule was encoded by HLA-DPB1, HLA-DQA2, and HLA-DQB2 and played an important role in antigens binding and cross-presentation. Proteins encoded by ZAP70 and ITK belonged to the tyrosine kinase family, which were critical for signal transduction in T cells (Berg, 2007; Au-Yeung et al., 2018). And proteins encoded by GRAP2, TRAT1, and SKAP1 also played an important role in signal transduction (Raab et al., 2010). It was, therefore, suggested that most of these DEGs were highly relevant to immune response and might contribute to different immune profiles between the two clusters.
There were several limitations in our study. We performed the study based on TCGA and GEO databases without verification using a clinical dataset. Only correlation analysis on phenotype level was conducted. There lacked a demonstration on the protein level. Last but not least, there was a lack of mechanistic study.
In conclusion, our study divided HNSCC into two clusters based on IGF2BP2 and YTHDF1, which provided a simple and feasible tool to identify HNSCC with different immune profiles and helped estimate sensitivity to ICIs-based immunotherapy. We preliminarily explore the possible mechanisms, combined with the previous research works about IGF2BP2 and YTHDF1, and we speculated that they might hamper the expression of specific genes, which were related to antigen recognition, signal transduction, proliferation, and activation of effector T cells. Meanwhile, they might increase the stability of tumorigenic genes, such as EGFR and CD276, and excessively activated downstream signal pathways. The joint effect led to different biologic behavior and immune profiles in the two clusters. The existing study had found knocking down YTHDF1 could enhance the therapeutic efficiency of ICIs in mice (Han et al., 2019). It would be important to determine whether suppressing the expressions of IGF2BP2 and YTHDF1 could modulate the sensitivity to ICI-based immunotherapy. Specific molecular mechanisms awaited further exploration.
The original contributions presented in the study are included in the article/Supplementary Material; further inquiries can be directed to the corresponding author.
Ethical review and approval was not required for the study on human participants in accordance with the local legislation and institutional requirements. Written informed consent from the patients/participants or patients/participants’ legal guardian/next of kin was not required to participate in this study in accordance with the national legislation and the institutional requirements.
Conceptualization: QW, SL, and YZ; methodology: QW, SL, and YZ; software and data analysis: QW, JL, and SL; validation: QW, SL, JL, and YZ; writing, review and editing: QW, SL, JL, and YZ; and supervision: YZ. All authors have read and agreed to the published version of the manuscript.
This study was supported by a grant from the Scientific Research Project of Hubei Provincial Health and Family Planning Commission (Grant No. WJ 2019H060), a grant from the Leading Discipline Construction Project of Oncology of Zhongnan Hospital of Wuhan University, and a grant from the Science, Technology, and Innovation Seed Fund of Zhongnan Hospital of Wuhan University (Grant no. znpy2018123).
The authors declare that the research was conducted in the absence of any commercial or financial relationships that could be construed as a potential conflict of interest.
All claims expressed in this article are solely those of the authors and do not necessarily represent those of their affiliated organizations, or those of the publisher, the editors, and the reviewers. Any product that may be evaluated in this article, or claim that may be made by its manufacturer, is not guaranteed or endorsed by the publisher.
The authors would like to acknowledge the Scientific Research Project of Hubei Provincial Health and Family Planning Commission for their support in their study.
The Supplementary Material for this article can be found online at: https://www.frontiersin.org/articles/10.3389/fgene.2022.903634/full#supplementary-material
CPS, combined positive score; DEG, differently expressed gene; EBV, Epstein–Barr virus; FAP, fibroblast activation protein alpha; GEO, the Gene Expression Omnibus; GSEA, gene set enrichment analysis; HNSCC, head and neck squamous cell carcinoma; HPV, human papillomavirus; ICIs, immune checkpoint inhibitors; m6A, N6-Methyladenosine; MCODE, the Molecular Complex Detection; mRNA, messenger RNA; PCA, principal component analysis; PPI, protein-protein interaction; ssGSEA, single sample GSEA; TCGA, The Cancer Genome Atlas; TGF-β, transforming growth factor-β; TIME, tumor immune microenvironment; TME, tumor microenvironment; WGCNA, weighted gene co-expression network analysis.
Argiris, A., Karamouzis, M. V., Raben, D., and Ferris, R. L. (2008). Head and Neck Cancer. Lancet 371 (9625), 1695–1709. doi:10.1016/s0140-6736(08)60728-x
Au-Yeung, B. B., Shah, N. H., Shen, L., and Weiss, A. (2018). ZAP-70 in Signaling, Biology, and Disease. Annu. Rev. Immunol. 36, 127–156. doi:10.1146/annurev-immunol-042617-053335
Bader, G. D., and Hogue, C. W. (2003). An Automated Method for Finding Molecular Complexes in Large Protein Interaction Networks. BMC Bioinformatics 4, 2. doi:10.1186/1471-2105-4-2
Berg, L. J. (2007). Signalling through TEC Kinases Regulates Conventional versus Innate CD8+ T-Cell Development. Nat. Rev. Immunol. 7 (6), 479–485. doi:10.1038/nri2091
Chow, L. Q. M. (2020). Head and Neck Cancer. N. Engl. J. Med. 382 (1), 60–72. doi:10.1056/nejmra1715715
Citri, A., and Yarden, Y. (2006). EGF-ERBB Signalling: towards the Systems Level. Nat. Rev. Mol. Cel Biol. 7 (7), 505–516. doi:10.1038/nrm1962
Dixit, D., Prager, B. C., Gimple, R. C., Poh, H. X., Wang, Y., Wu, Q., et al. (2021). The RNA m6A Reader YTHDF2 Maintains Oncogene Expression and Is a Targetable Dependency in Glioblastoma Stem Cells. Cancer Discov. 11 (2), 480–499. doi:10.1158/2159-8290.cd-20-0331
Esensten, J. H., Helou, Y. A., Chopra, G., Weiss, A., and Bluestone, J. A. (2016). CD28 Costimulation: From Mechanism to Therapy. Immunity 44 (5), 973–988. doi:10.1016/j.immuni.2016.04.020
Han, D., Liu, J., Chen, C., Dong, L., Liu, Y., Chang, R., et al. (2019). Anti-tumour Immunity Controlled through mRNA m6A Methylation and YTHDF1 in Dendritic Cells. Nature 566 (7743), 270–274. doi:10.1038/s41586-019-0916-x
Hänzelmann, S., Castelo, R., and Guinney, J. (2013). GSVA: Gene Set Variation Analysis for Microarray and RNA-Seq Data. BMC Bioinformatics 14, 7. doi:10.1186/1471-2105-14-7
Hegde, P. S., and Chen, D. S. (2020). Top 10 Challenges in Cancer Immunotherapy. Immunity 52 (1), 17–35. doi:10.1016/j.immuni.2019.12.011
Huang, Y., Yan, J., Li, Q., Li, J., Gong, S., Zhou, H., et al. (2015). Meclofenamic Acid Selectively Inhibits FTO Demethylation of m6A over ALKBH5. Nucleic Acids Res. 43 (1), 373–384. doi:10.1093/nar/gku1276
Kuhns, M. S., Davis, M. M., and Garcia, K. C. (2006). Deconstructing the Form and Function of the TCR/CD3 Complex. Immunity 24 (2), 133–139. doi:10.1016/j.immuni.2006.01.006
Langfelder, P., and Horvath, S. (2008). WGCNA: An R Package for Weighted Correlation Network Analysis. BMC Bioinformatics 9, 559. doi:10.1186/1471-2105-9-559
Li, B., Zhu, L., Lu, C., Wang, C., Wang, H., Jin, H., et al. (2021). circNDUFB2 Inhibits Non-small Cell Lung Cancer Progression via Destabilizing IGF2BPs and Activating Anti-tumor Immunity. Nat. Commun. 12 (1), 295. doi:10.1038/s41467-020-20527-z
Li T, T., Hu, P.-S., Zuo, Z., Lin, J.-F., Li, X., Wu, Q.-N., et al. (2019). METTL3 Facilitates Tumor Progression via an m6A-IGF2BP2-dependent Mechanism in Colorectal Carcinoma. Mol. Cancer 18 (1), 112. doi:10.1186/s12943-019-1038-7
Li Y, Y., Xiao, J., Bai, J., Tian, Y., Qu, Y., Chen, X., et al. (2019). Molecular Characterization and Clinical Relevance of m6A Regulators across 33 Cancer Types. Mol. Cancer 18 (1), 137. doi:10.1186/s12943-019-1066-3
Liu, T., Wei, Q., Jin, J., Luo, Q., Liu, Y., Yang, Y., et al. (2020). The m6A Reader YTHDF1 Promotes Ovarian Cancer Progression via Augmenting EIF3C Translation. Nucleic Acids Res. 48 (7), 3816–3831. doi:10.1093/nar/gkaa048
Mootha, V. K., Lindgren, C. M., Eriksson, K.-F., Subramanian, A., Sihag, S., Lehar, J., et al. (2003). PGC-1α-responsive Genes Involved in Oxidative Phosphorylation Are Coordinately Downregulated in Human Diabetes. Nat. Genet. 34 (3), 267–273. doi:10.1038/ng1180
Newman, A. M., Liu, C. L., Green, M. R., Gentles, A. J., Feng, W., Xu, Y., et al. (2015). Robust Enumeration of Cell Subsets from Tissue Expression Profiles. Nat. Methods 12 (5), 453–457. doi:10.1038/nmeth.3337
Nicholson, R. I., Gee, J. M., and Harper, M. E. (2001). EGFR and Cancer Prognosis. Eur. J. Cancer 37 (Suppl. 4), S9–S15. doi:10.1016/s0959-8049(01)00231-3
Niu, Y., Lin, Z., Wan, A., Chen, H., Liang, H., Sun, L., et al. (2019). RNA N6-Methyladenosine Demethylase FTO Promotes Breast Tumor Progression through Inhibiting BNIP3. Mol. Cancer 18 (1), 46. doi:10.1186/s12943-019-1004-4
Nombela, P., Miguel-López, B., and Blanco, S. (2021). The Role of m6A, m5C and Ψ RNA Modifications in Cancer: Novel Therapeutic Opportunities. Mol. Cancer 20 (1), 18. doi:10.1186/s12943-020-01263-w
Raab, M., Wang, H., Lu, Y., Smith, X., Wu, Z., Strebhardt, K., et al. (2010). T Cell Receptor "Inside-Out" Pathway via Signaling Module SKAP1-RapL Regulates T Cell Motility and Interactions in Lymph Nodes. Immunity 32 (4), 541–556. doi:10.1016/j.immuni.2010.03.007
Roundtree, I. A., Evans, M. E., Pan, T., and He, C. (2017). Dynamic RNA Modifications in Gene Expression Regulation. Cell 169 (7), 1187–1200. doi:10.1016/j.cell.2017.05.045
Rudolph, M. G., Stanfield, R. L., and Wilson, I. A. (2006). How TCRs Bind MHCs, Peptides, and Coreceptors. Annu. Rev. Immunol. 24, 419–466. doi:10.1146/annurev.immunol.23.021704.115658
Siegel, R. L., Miller, K. D., Fuchs, H. E., and Jemal, A. (2021). Cancer Statistics. CA Cancer J. Clin. 71, 7–33.
Subramanian, A., Tamayo, P., Mootha, V. K., Mukherjee, S., Ebert, B. L., Gillette, M. A., et al. (2005). Gene Set Enrichment Analysis: A Knowledge-Based Approach for Interpreting Genome-wide Expression Profiles. Proc. Natl. Acad. Sci. U.S.A. 102 (43), 15545–15550. doi:10.1073/pnas.0506580102
Visvanathan, A., Patil, V., Arora, A., Hegde, A. S., Arivazhagan, A., Santosh, V., et al. (2018). Essential Role of METTL3-Mediated m6A Modification in Glioma Stem-like Cells Maintenance and Radioresistance. Oncogene 37 (4), 522–533. doi:10.1038/onc.2017.351
Vu, L. P., Pickering, B. F., Cheng, Y., Zaccara, S., Nguyen, D., Minuesa, G., et al. (2017). The N6-Methyladenosine (m6A)-Forming Enzyme METTL3 Controls Myeloid Differentiation of normal Hematopoietic and Leukemia Cells. Nat. Med. 23 (11), 1369–1376. doi:10.1038/nm.4416
Wang, L., Hui, H., Agrawal, K., Kang, Y., Li, N., Tang, R., et al. (2020). m6 A RNA Methyltransferases METTL3/14 Regulate Immune Responses to Anti-PD-1 therapyA RNA Methyltransferases METTL3/14 Regulate Immune Responses to Anti-PD-1 Therapy. EMBO J. 39 (20), e104514. doi:10.15252/embj.2020104514
Wang, C., Li, Y., Jia, L., Kim, J. k., Li, J., Deng, P., et al. (2021). CD276 Expression Enables Squamous Cell Carcinoma Stem Cells to Evade Immune Surveillance. Cell Stem Cell 28 (9), 1597–1613. doi:10.1016/j.stem.2021.04.011
Wilkerson, M. D., and Hayes, D. N. (2010). ConsensusClusterPlus: a Class Discovery Tool with Confidence Assessments and Item Tracking. Bioinformatics 26 (12), 1572–1573. doi:10.1093/bioinformatics/btq170
Yoshihara, K., Shahmoradgoli, M., Martínez, E., Vegesna, R., Kim, H., Torres-Garcia, W., et al. (2013). Inferring Tumour Purity and Stromal and Immune Cell Admixture from Expression Data. Nat. Commun. 4, 2612. doi:10.1038/ncomms3612
Zaccara, S., Ries, R. J., and Jaffrey, S. R. (2019). Reading, Writing and Erasing mRNA Methylation. Nat. Rev. Mol. Cel Biol. 20 (10), 608–624. doi:10.1038/s41580-019-0168-5
Zhang, B., and Horvath, S. (2005). A General Framework for Weighted Gene Co-expression Network Analysis. Stat. Appl. Genet. Mol. Biol. 4, 17. doi:10.2202/1544-6115.1128
Zhong, L., Liao, D., Zhang, M., Zeng, C., Li, X., Zhang, R., et al. (2019). YTHDF2 Suppresses Cell Proliferation and Growth via Destabilizing the EGFR mRNA in Hepatocellular Carcinoma. Cancer Lett. 442, 252–261. doi:10.1016/j.canlet.2018.11.006
Keywords: YTHDF1, IGF2BP2, HNSCC, m6A modification, immune microenvironment, immunotherapy
Citation: Li S, Wu Q, Liu J and Zhong Y (2022) Identification of Two m6A Readers YTHDF1 and IGF2BP2 as Immune Biomarkers in Head and Neck Squamous Cell Carcinoma. Front. Genet. 13:903634. doi: 10.3389/fgene.2022.903634
Received: 24 March 2022; Accepted: 13 April 2022;
Published: 12 May 2022.
Edited by:
Zhongxiao Wang, Biogen Idec, United StatesCopyright © 2022 Li, Wu, Liu and Zhong. This is an open-access article distributed under the terms of the Creative Commons Attribution License (CC BY). The use, distribution or reproduction in other forums is permitted, provided the original author(s) and the copyright owner(s) are credited and that the original publication in this journal is cited, in accordance with accepted academic practice. No use, distribution or reproduction is permitted which does not comply with these terms.
*Correspondence: Yahua Zhong, ZG9jdG9yenloNzNAMTYzLmNvbQ==
†These authors have contributed equally to this work
Disclaimer: All claims expressed in this article are solely those of the authors and do not necessarily represent those of their affiliated organizations, or those of the publisher, the editors and the reviewers. Any product that may be evaluated in this article or claim that may be made by its manufacturer is not guaranteed or endorsed by the publisher.
Research integrity at Frontiers
Learn more about the work of our research integrity team to safeguard the quality of each article we publish.