 Tianxiao Chen†
 Honglin Chen
95% of researchers rate our articles as excellent or good
Learn more about the work of our research integrity team to safeguard the quality of each article we publish.
Find out more
ORIGINAL RESEARCH article
Front. Genet. , 08 July 2022
Sec. Evolutionary and Population Genetics
Volume 13 - 2022 | https://doi.org/10.3389/fgene.2022.903267
This article is part of the Research Topic Genetics of Domestication and Diversification Towards Evolution of Crop Plants View all 7 articles
Mung bean (Vigna radiata L.) is an economically important grain legume cultivated in Asian countries. High-density genetic linkage is a valuable and effective tool for mapping quantitative trait loci (QTL). In the current study, a high-resolution genetic map containing 4,180 single-nucleotide polymorphisms (SNPs) was assigned to 11 linkage groups (LGs) and spanning 1,751.39 cM in length was constructed for mung bean, and the average distance between adjacent markers was 0.42 cM. Bruchids (Callosobruchus spp.) cause significant damage to and loss of legume seeds. A locus for bruchid resistance was detected. The gene Vradi05g03810, encoding a probable resistance-specific protein, was found to be the most likely key candidate gene in mung beans. A 69-bp sequence deletion was identified in the coding region by comparing the cDNA sequences of bruchid-resistant and bruchid-susceptible lines. This SNP-based high-density linkage map is one of the first to be constructed across the mung bean genome. This map will not only facilitate the genetic mapping of genes or complex loci that control important agronomic traits but also offer a tool for promoting future genetics and comparative genomic studies in Vigna.
Mung bean (Vigna radiata [L.] R. Wilczek, 2n = 2x = 22) is an important pulse crop that is cultivated in South and Southeast Asia. It is grown on more than 6 million hectares with a global annual production of 3 million tons (Nair et al., 2013). Mung bean is consumed as dry seeds and as bean sprouts. Seeds are valuable sources of protein and carbohydrate, and sprouts are important sources of vitamins and minerals for human nutrition. Because of its high content of protein, iron, and folate, which provide great nutritional health benefits, mung bean is a nutrient-balanced food for cereal-based diets (Tomooka et al., 2000) and has been a common food product in China for thousands of years (Tang et al., 2014).
However, mung bean production is constrained by destructive insect pests. These insect pests limit the yield potential of grain legumes, inflicting losses of billions of dollars worldwide every year. Among insect pests, bruchids (Callosobruchus spp.) are major storage pests that cause serious damage to the seeds of legume grains, including mung bean (Vigna radiata), adzuki bean (Vigna angularis), cowpea (Vigna unguiculata), black gram (Vigna mungo), common bean (Phaseolus vulgaris), chickpea (Cicer arietinum), pigeon pea (Cajanus cajan) and others (Southgate, 1979). Callosobruchus are the most destructive mung bean pest of the various bruchid species, and these bruchids infest the pods in the field and seeds in storage, which causes weight loss and low germination (War et al., 2017). Host plant resistance is an economical and sustainable way to preserve mung bean seeds against destruction by bruchids. Incorporating host plant resistance against bruchids along with good agronomic traits would be a better way to controlling these pests in mung beans. Therefore, breeding resistant varieties and exploring the resistance mechanism are major goals in mung bean breeding programs. However, only a few cultivated varieties of bruchid-resistant mung beans are available (Somta et al., 2007). To determine the bruchid resistance genotype, thousands of mung bean accessions have been screened for bruchid resistance. To date, several mung bean genotypes with resistance to bruchids are available, including three wild (V. radiata var. sublobata) and four cultivated (V. radiata var. radiata) mung bean genotypes. The wild mung bean accession TC 1966 (Fujii and Miyazaki, 1987; Fujii et al., 1989) and cultivated mung bean accessions V1128, V2817, and VC6089A are completely resistant to C. chinensis and C. maculatus. Two wild mung bean accessions, ACC23 and ACC41, are resistant to both bruchid species (Lambrides and Imrie, 2000), while two cultivated accessions, V2709 and V2802, are highly resistant to C. chinensis and C. maculates (Talekar and Lin, 1992; Somta et al., 2008). V2709 has been used to breed the bruchid-resistant varieties Zhonglv No. 3, Zhonglv No. 4, and Zhonglv No. 6. These lines containing the resistance gene from V2709 were confirmed to be safe for human consumption based on animal safety and toxicity tests (Yao et al., 2015).
A major locus conferring resistance to bruchids was identified from two highly resistant wild genotypes, TC1966 and ACC41 (Lambrides and Imrie, 2000), and two highly resistant cultivated genotypes, V2709 and V2802 (Somta et al., 2007). Restriction fragment length polymorphism (RFLP) markers have been developed to map resistance genes in both genotypes (Young et al., 1992; Kaga and Ishimoto, 1998; Miyagi et al., 2004; Mei et al., 2009). The bruchid resistance gene (Br) in TC1966 is located on LG VIII between the RFLP markers pA882 and pM151a (Young et al., 1992). The Br locus in TC1966 has been fine mapped to a 0.7 cM interval between RFLP markers Bng110 and Bng143, and it is only 0.2 cM away from Bng143 (Kaga and Ishimoto, 1998). A few molecular markers for the Br locus in ACC41 have been developed, including the RFLP marker mgM213 (1.3 cM) (Miyagi et al., 2004) and the simple sequence repeat (SSR) markers BM202 (0.7 cM) and Vr2-627 (1.7 cM) (Wang et al., 2016). Seven cleaved amplified polymorphism (CAP) markers have been developed and are closely linked with the Br locus in TC1966 (Chen et al., 2007). V2709 and V2802 are considered to be a single dominant locus with several modifiers (Somta et al., 2007). The expressed sequence tag-simple sequence repeat (EST-SSR) marker DMB-SSR158 cosegregates perfectly with the Br gene in V2802 (Chotechung et al., 2016) and is also tightly linked with the Br locus in TC1966 (Chen et al., 2007; Chen H.-M. et al., 2013). Recently, a polygalacturonase inhibitor gene located on chromosome 5 was reported to possibly be responsible for bruchid resistance in V2802 (Chotechung et al., 2016).
SNPs are widely distributed throughout the mung bean genome, and the ability to obtain thousands of SNPs and construct high-density SNP genetic maps has been made feasible by the rapid development of next-generation sequencing (NGS) technology. Several methods, including restriction-site associated DNA tag sequencing (RAD-seq) (Miller et al., 2007), genotyping-by-sequencing (GBS) (Sonah et al., 2013), and specific-locus amplified fragment sequencing (SLAF-seq) (Sun et al., 2013), have been used to discover SNP markers. A high-density linkage map is essential for fine mapping of QTLs/genes and comparative genomics studies. SLAF-seq is a newly developed high-throughput approach for genome-wide SNP detection and genotyping based on NGS.
In the present study, a high-throughput SLAF-seq strategy was employed to construct an SNP-based genetic map for mung bean, and a bruchid resistance-related QTL was identified. Large-scale SNP analysis allowed the detection of a genomic region containing the major bruchid resistance locus, as well as candidate gene identification. Combined with conventional genetic analysis and expression patterns, we provided evidence that Vradi05g03810, encoding a probable resistance-specific protein, is a candidate gene for bruchid resistance. The objectives of this study were 1) to finely map bruchid resistance loci, 2) to analyse candidate gene(s) based on the SLAF-seq strategy, and 3) to develop markers closely linked to Vradi05g03810 conferring bruchid resistance, which will provide SNPs for marker-assisted selection (MAS) in future breeding programs.
A RIL population consisting of 150 individuals obtained from a cross between the bruchid-susceptible female parent VC2778A and the bruchid-resistant male parent TC 1966, was used for genetic map construction. In the spring of 2014, the seeds of the parents and population were planted in an experimental field of the Chinese Academy of Agricultural Sciences (China, Beijing, 116°46′E, 39°92′N). Young leaves from RIL individuals and the two parents were collected and stored at −80°C until DNA extraction. To confirm the inheritance of bruchid resistance, the mature seeds of VC2778A and TC1966, and those harvested from the RIL population (VC2778A × TC1966) were evaluated against C. chinensis. Together with Zhonglv No.1 (susceptible cultivar) as a control, 30 seeds of the F2 populations were placed separately into plastic dishes, which were replicated three times for each line. Approximately 500 adult bruchid beetles were released into the box. These boxes were incubated at 28°C and 70% relative humidity. Sixty days later, the number of damaged seeds of each line was counted, and the percentage of damaged seeds was used to classify each line as either resistant or susceptible. The ratio of the number of damaged seeds to the total number of seeds tested was used to calculate the bruchid infestation. Lines that exhibited 0–20% damaged seeds were considered highly resistant (HR), those that exhibited 81–100% damaged seeds were considered highly susceptible (HS), and those that exhibited 21–80% damaged seeds were considered moderately resistant (MR) (Chotechung et al., 2016).
DNA was isolated and purified using the CTAB (cetyl trimethyl ammonium bromide) method (Attitalla, 2011). The quantity and quality of extracted DNA were assessed using an ND-1000 spectrophotometer (NanoDrop, Wilmington, DE, United States) (Desjardins and Conklin, 2010) and by electrophoresis in 0.8% agarose gels. A subset of 150 F2 individuals and the two parents were subjected to SLAF library construction and sequencing. Resistant or highly susceptible pools were constructed by mixing equal amounts of DNA from 10 highly resistant individuals or highly susceptible F2 individuals. The DNA isolated from TC1966 and VC2778A and the two DNA pools were used for SLAF library construction and sequencing following a previous report (Sun et al., 2013). We employed a SLAF-seq approach in our experiment. RsaI and HaeIII (New England Biolabs, NEB, United States) were used to digest the genomic DNA. The pooled samples were electrophoresed on a 2% agarose gel, and the fragments between 314 and 394 bp were purified using a QIAquick gel extraction kit (QIAGEN, Hilden, Germany). All the purified products were then diluted and subjected to paired-end sequencing on an Illumina HiSeq 2,500 platform (Illumina, Inc.; San Diego, CA, United States) at Biomarker Technologies Corporation in Beijing.
SLAF-seq data grouping and genotyping were performed as described (Sun et al., 2013). Low-quality reads (quality score <20e) were filtered out by real-time monitoring, and the high-quality clean reads were clustered based on sequence similarity by BLAT. Sequences with more than 95% identity were grouped into one SLAF marker. The alleles of each SLAF were defined according to those of the parents, and individuals were genotyped based on sequence similarity to their parents. Alleles were defined in each SLAF by minor allele frequency (MAF) evaluation. Mung bean is a diploid species, SLAFs with more than four alleles were discarded, and SLAFs with 2–4 alleles were identified as potentially polymorphic. In this study, SLAFs with a sequence depth of less than 200 were defined as low-depth SLAFs and were filtered out in the subsequent analysis. SLAFs with 2, 3, or 4 tags were identified as polymorphic SLAFs and were considered to be potential markers. Polymorphic SLAFs were analyzed based on the population type, which consisted of eight segregation patterns (aa × bb, ab × cd, ef × eg, ab × cc, cc × ab, hk × hk, lm × ll, and nn × np). In our study, an F2 population was used; therefore, the segregation pattern aa × bb was selected for subsequent analysis. A Bayesian approach was used to evaluate the genotyping quality for genotype scoring (Sun et al., 2013).
The high-density linkage map was constructed using HighMap software (Liu et al., 2014). The HighMap strategy was utilized to correct the incorrect SNP marker orders within each LG caused by genotyping errors. MLOD scores >5 between markers confirmed the robustness of markers for each LG. SMOOTH algorithms were used to correct genotyping errors. Using the Kosambi mapping function, recombination percentages were converted to genetic distance. Finally, the map quality was evaluated by heatmaps and haplotype maps.
The 341,502 SLAF markers generated from mung beans were aligned to the genome sequences of the common bean (Phaseolus vulgaris) and adzuki bean (Vigna angularis) using BLASTN (version 2.2.30) (Altschul et al., 1990), with an e-value cut-off of ≤1e−5. Their GenBank assembly accessions were GCA_001517995.1 and GCA_001723775.1, respectively. SLAF markers with query sequence identities >98% and sequence lengths >80 were selected. Syntenic gene blocks within the genome were detected by MCScanX (Wang et al., 2012) and visualized using the jcvi python module.
Equal amounts of genomic DNA from 15 highly resistant and 15 highly susceptible RILs were separately pooled to make resistant and susceptible bulks. The sequence data of the two parents and resistant and susceptible bulks were generated by Illumina HiSeq 2500. A SNP index was calculated. Differences in the genotype frequencies of the pooled samples were determined by the SNP index (Abe et al., 2012), and Δ(SNP-index) values were calculated by subtracting the bruchid susceptibility index from the bruchid resistance index at each SNP position (Takagi et al., 2013).
The genes in the causal region were detected according to the functional annotation of the reference genome of mung bean. The amino acid sequence polymorphisms between VC2778A and TC1966 were screened and aligned back to the reference genome. Only those genes with at least one amino acid difference were considered candidates. The candidates were then compared with the NR to obtain a more detailed functional annotation database.
An InDel marker was identified by comparison of resistance-specific protein (RSP) sequences between the bruchid-resistant and bruchid-susceptible lines, and degenerate primers for amplification were designed by Primer Premier 5.0 based on the sequence differences between TC1966 and VC2778A. The partial sequence of RSP1 was amplified using primers: 5′- TCAAACAGCCAAGCTAAA-3′ and 5′-CGCCTCAATCYTTCTTCTG-3’. PCR reactions were conducted using the following program: 5 min at 95 °C, 30 s at 95 °C, 30 s at 55 °C, and 40 s at 72 °C.
A total of 36.18 GB of high-quality sequence data containing 183.34 M 100-bp paired-end reads were generated after SLAF library construction and sequencing. The average percentage of Q30 bases (a quality score of 30) was 85.94% for all reads, and the average guanine-cytosine (GC) content was 36.96%. The numbers of SLAF markers in the male parent and female parent were 235,157 and 267,294, respectively, with an average depth (the average number of reads in each SLAF) of 27.19-fold and 27.41-fold, and the average depths of each SLAF marker was 26.91-fold and 27.50-fold. For the F2 population progeny, the number of SLAFs ranged from 126,056 to 174,509, with an average value of 148,091 and a mean depth of 5.74-fold, and the individual integrity of the mapped markers (the ratio of known genotypes to total markers) was 95.06%. Overall, a total of 341,502 high-quality SLAF markers were detected, and 179,690 were polymorphic, resulting in a polymorphism rate of 52.62% (Table 1). The 179,690 polymorphic SLAFs harboured a total of 775,853 SNPs. A total of 541,768 SNPs were generated in the male parent, and the average integrity of each SNP marker was 69.82%. A total of 574,722 SNPs were generated in the female parent, with an average integrity of 74.07% for each SNP. In the RIL mapping population, a total of 305,236 SNPs were generated, and the average integrity was 39.34% for each individual. These high-quality SNPs were classified into eight segregation patterns. Since the two parents (TC1966 and VC2778A) used for genetic map construction in the F2 population were homozygous mung bean lines with genotypes of aa and bb, the multiallelic markers with tag numbers larger than 4 were filtered out; 131,340 (16.93%) SNPs fell into this class.
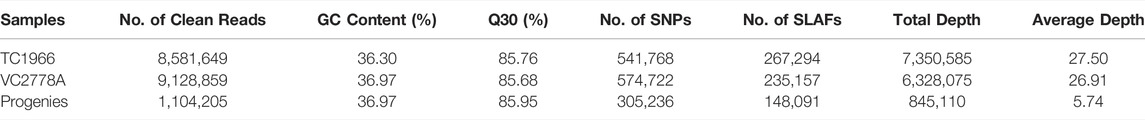
TABLE 1. High-quality data generated by sequencing the SLAF library.
After a five-step filtering process, 4,249 polymorphic SNP markers were used for high-density genetic map construction using HighMap software (Figure 1). A total of 4,180 (98.38%) of the 4,249 SNPs were mapped to the genetic map, and the final map spanned a total of 1,751.39 cM in length with a mean intermarker distance of 0.42 cM. The number of markers mapped to each LG ranged from 113 in LG.3 to 748 in LG.6, with an average of 380 markers per LG. The length of the individual LGs varied from 109.55 to 225.26 cM, with average distances of 0.22–1.06 cM between adjacent markers (Table 2). The largest linkage group, LG.1, harboured 598 markers spanning a length of 225.26 cM, and the average intermarker distance was 0.38 cM. The smallest linkage group, LG.3, contained 113 markers spanning 109.55 cM with an average intermarker distance of 0.98 cM. LG.6 was the densest, whereas LG.11 contained the fewest markers.
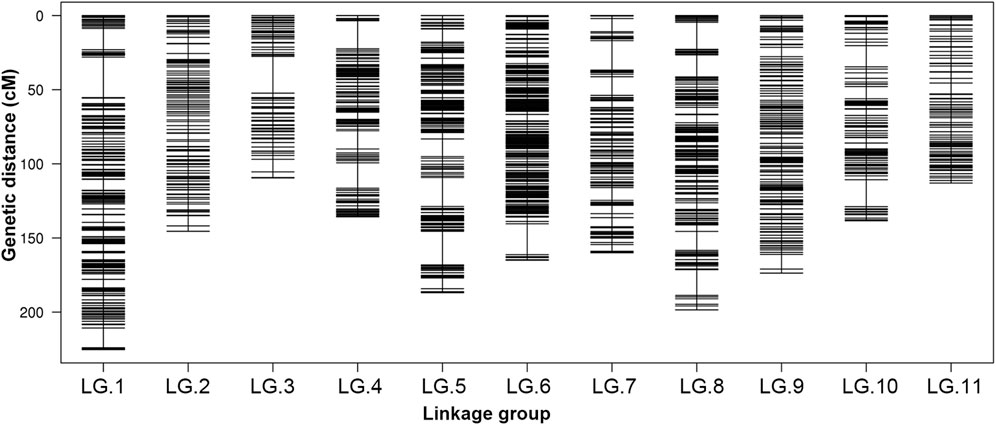
FIGURE 1. Distribution of SLAF markers on 11 LGs of mung bean. A black bar indicates a marker. The x-axis represents linkage group number and the y-axis indicates genetic distance (cM).
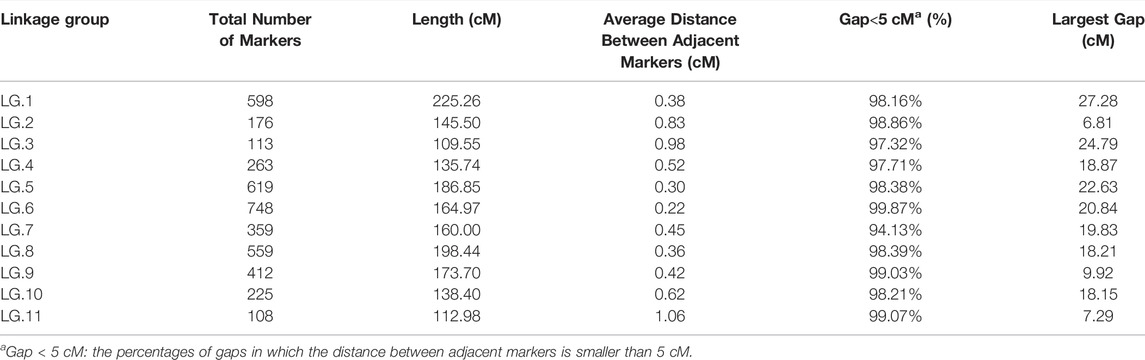
TABLE 2. Summary of the high-density genetic map constructed in mung bean.
The 4,249 SNP markers generated from mung bean were used for comparative analysis with the genome sequences of mung bean (Vigna radiata), adzuki bean (Vigna angularis), and common bean (Phaseolus vulgaris). The total numbers of matched markers containing sequences in mung bean and each of the other species were 4,180 (98.38%) for mung bean, 3,050 (71.78%) for adzuki bean, and 907 (4.30%) for common bean. These results indicated that mung bean is more closely related to adzuki bean than common bean. A Circos plot was generated to show the relationship between mung bean, common bean, and adzuki bean (Supplementary Figure S1), which indicated that the SNP genetic map constructed had sufficient coverage across the mung bean, adzuki bean, and common bean genomes, demonstrating a correspondence between the mapped SNP markers and their genomic locations. Most of the SNPs on the linkage map were in the same order as those on the corresponding physical map of the mung bean genome. The adzuki bean genome showed better compatibility with the physical map of the mung bean than with that of the common bean.
As expected, the seeds of TC1966 and VC2778A differed greatly in their resistance to bruchids. The seeds of TC1966 appeared symptom-free, whereas the susceptible parent, VC2778A, showed worm-eaten symptoms. The percentage of damaged seeds was noncontinuous in the F2 population, ranged from 0 to 100% with a mean of 45.31% (Figure 2).
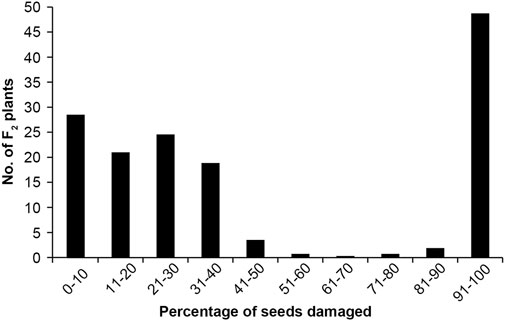
FIGURE 2. Frequency distribution of the percentage of seeds damaged.
SNP-index methods were used for the association analysis in this study. In the Δ(SNP-index) plot, peak regions above the threshold value were defined as those for which the Loess-fitted values were greater than the standard deviations above the genome-wide median. Two candidate regions associated with mung bean bruchid resistance were identified, and the average Δ(SNP-index) value above the threshold was 0.2634 (Figure 3). One candidate region associated with mung bean bruchid resistance spanned 0.25 Mb (5.23–5.48 Mb on chromosome 5 of the mung bean VC 1973A reference genome assembly).
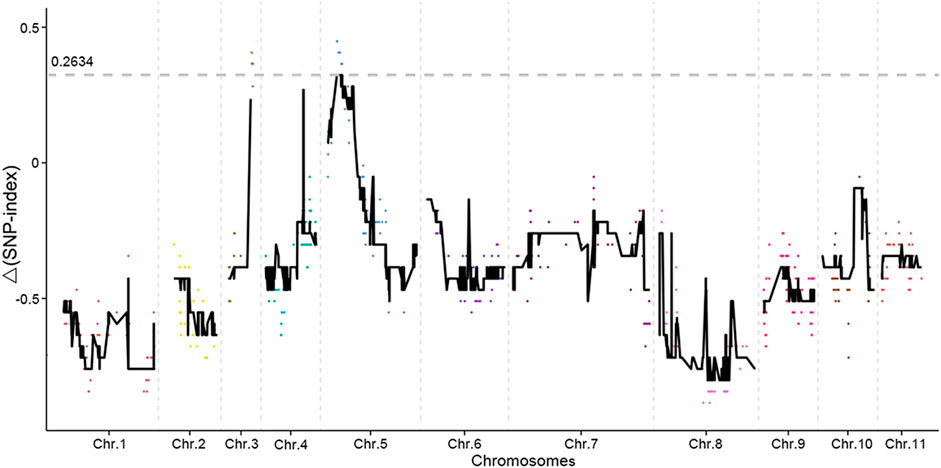
FIGURE 3. Results of genetic association analysis to identify regions of the mung bean genome associated with resistance to bruchid infestation. The x-axis shows the physical positions of the SLAF marker in different chromosomes. The y-axis shows the Δ (SNP-index) of the SLAF marker. Every color dot represents Δ(SNP-index) of the SLAF marker in every chromosome. The black lines are the loess fitting curve of Δ(SNP-index) based on smooth values. The grey dotted line is the threshold of the smooth value of Δ (SNP-index).
A total of 15 genes that encode predicted proteins were detected based on their annotation in the mung bean genome (https://legumeinfo.org/gbrowse_vigra1.0) (Table 3). These genes included seven resistance-specific proteins (RSPs) and two receptor-like protein kinases, while six genes could not be annotated using the known annotation databases. To verify whether these genes were candidate genes, the CDS and genomic DNA sequences were cloned and sequenced from the two parents. CDS comparisons of resistant-specific proteins (Vradi05g03810) showed that the sequences were 1,377 bp in the bruchid-resistant lines TC1966 and VC6089A and 1,308 bp in the bruchid-susceptible lines VC2778A, VC 1973A and Zhonglv No. 1 (Supplementary Figure S2). Moreover, the genomic DNA sequence comparisons of Vradi05g03810 showed that the sequences were 1,806 bp in the bruchid-resistant lines TC1966 and VC6089A and 1,749 bp in the bruchid-susceptible lines VC2778A, VC 1973A and Zhonglv No. 1 (Supplementary Figure S3). The amino acid sequences were significantly different between the two parent lines (Figure 4A). As expected, the InDel marker amplified fragments of 529 bp and 478 bp in TC1966 and VC2778A, respectively, and showed clear polymorphism between the parents (Figure 4B).
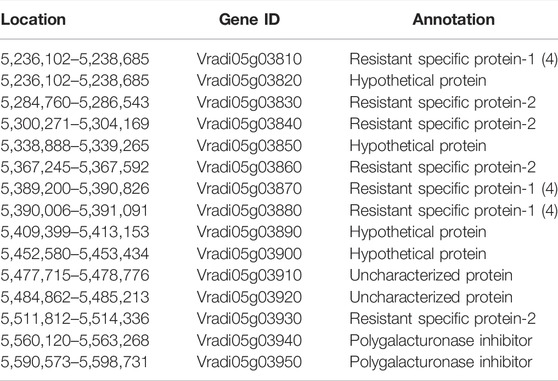
TABLE 3. Annotation of candidate genes for bruchid resistance identified on Chromosome 5 in mung bean.
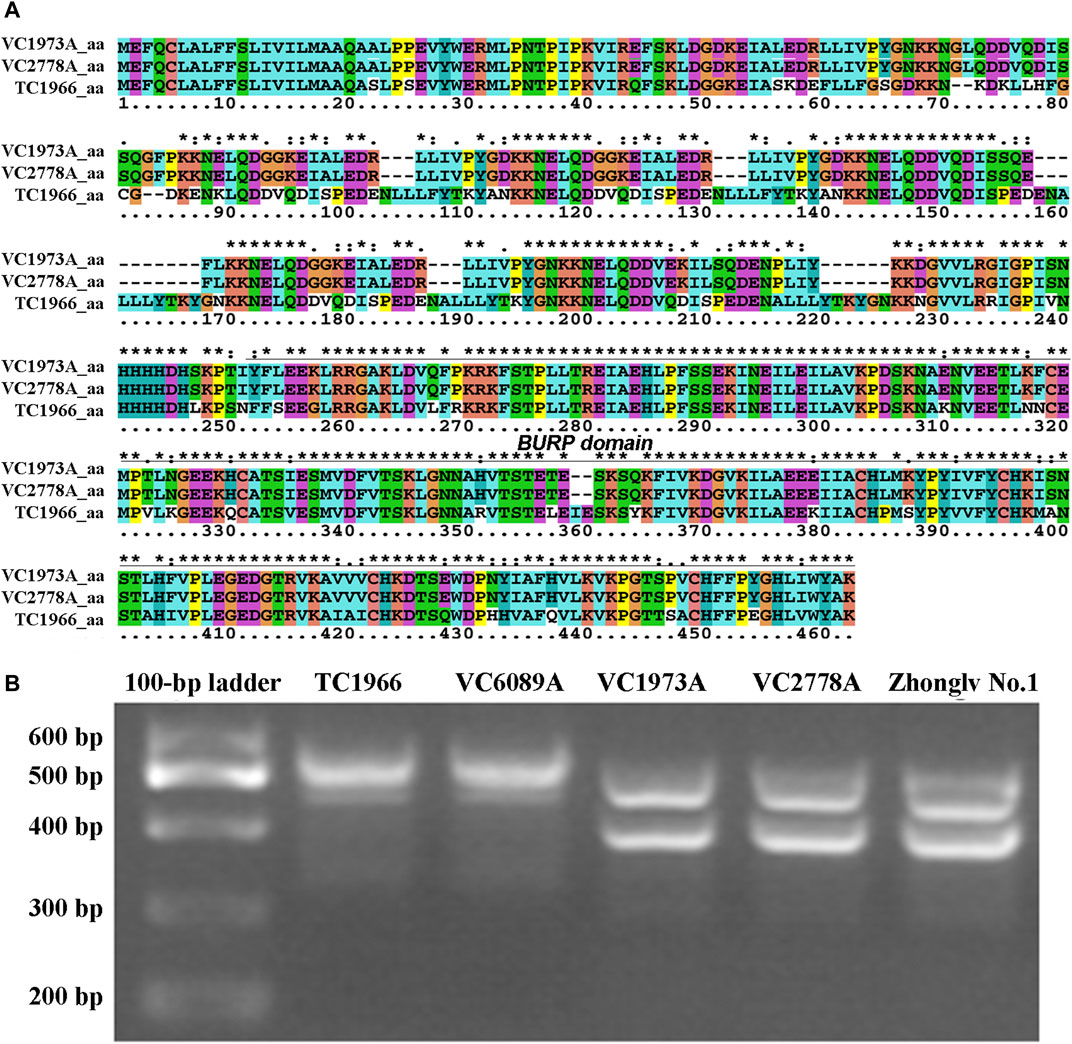
FIGURE 4. Sequence analysis of RSP1 gene. (A) Comparison of the amino acid sequences of bruchid-resistant and susceptible lines. (B) PCR detection of InDel marker in bruchid-resistant lines (TC1966 and VC6089A) and susceptible lines (VC 1973A, VC2778A, and Zhonglv No.1).
High-density linkage maps are essential tools for gene mapping, the identification of candidate genes, and the comparative analysis of synteny (Wang et al., 2011; Xu et al., 2015). However, most genetic maps for mung bean contain only several hundred markers, largely due to genotyping costs and marker discovery technologies (Liu et al., 2014), and the relatively low marker density makes mapping QTLs/genes difficult. Some genetic linkage maps of mung bean have been constructed using several conventional molecular markers, such as RFLPs (Humphry et al., 2002), RAPDs (Lambrides et al., 2000), ISSRs (Khajudparn et al., 2012), and SSRs (Wang et al., 2016). These markers have been used to map genes for mung bean weevil resistance (Young et al., 1992; Kaga and Ishimoto, 1998; Mei et al., 2009) and seed color (Lambrides et al., 2004) and to identify QTLs for seed weight (Humphry et al., 2005; Mei et al., 2009), yellow mosaic India virus (MYMIV) resistance (Kitsanachandee et al., 2013), chasmogamous flower (Chen et al., 2016), hard-seededness (Humphry et al., 2005), powdery mildew resistance (Young et al., 1993; Chaitieng et al., 2002; Humphry et al., 2003; Li et al., 2014), domestication-related traits (Isemura et al., 2012), seed starch content (Masari et al., 2017), phytic acid and phosphorus contents (Sompong et al., 2012), and Cercospora leaf spot resistance (Chankaew et al., 2011).
Many genetic linkage maps have been developed in mung bean. Due to the use of fewer molecular markers in mung beans, there are large distances between adjacent markers in some linkage groups, and some reported linkage groups do not coincide with the number of chromosomes in mung beans. We previously mapped loci for bruchid resistance using a genetic linkage map based on 560 marker sets and 210 RILs derived from a cross between Berken × ACC41 (Wang et al., 2016). However, the low polymorphism rate of available molecular markers and their limited quantity made constructing a high-density genetic linkage map more difficult. In addition, the obtained RFLP and RAPD markers were not sufficient because they were either not polymorphic or not easily obtained. SNPs are highly abundant and distributed throughout the whole genome in various plants. Therefore, the construction of a high-density genetic linkage map in mung beans is preferable.
In this study, an SNP-based high-density genetic linkage map was constructed in mung bean using SLAF sequencing technology. We previously constructed a saturated SSR map in mung bean with 560 SSRs and a mean marker interval of 1.3 cM (Wang et al., 2016). The SNP map developed herein contains 4,180 SNPs, and most were anchored to the VC1973A draft genome. Compared with the previous SSR genetic map, the number of markers (560 SSRs vs. 4,180 SNPs), the marker density (1.3 vs. 0.42 cM), and the total map length (732.9 cM vs. 1,751.39 cM) were improved in the SNP genetic map. Compared with a previously constructed genetic map (Isemura et al., 2012), the number of mapped loci (430 vs. 4,180), the marker density (1.78 vs. 0.42 cM), the total map length (727.6 cM vs. 1,751.39 cM) and the average distance between adjacent markers (1.42 cM (LG.1) to 2.11 cM (LG.9) vs. 0.22 cM (LG.6) to 1.06 cM (LG.11) were improved in our new genetic linkage map. Moreover, the number of markers used in this map was substantially higher than that used in the SNP maps previously constructed to assemble the mung bean draft genome (Kang et al., 2014).
High-density polymorphic SNP markers are currently used in genome-wide genotyping and high-density genetic map construction. Advances in NGS technology have made the detection of large numbers of SNP markers across the whole genome possible, as well as the high-throughput identification and genotyping of SNPs at a relatively low cost. NGS-based genotyping methods, such as RAD-seq (Wu et al., 2014), GBS-seq (Spindel et al., 2013), and SLAF-seq (Sun et al., 2013), allow millions of genome-wide SNPs to be identified across the entire plant genome. To date, whole-genome sequencing of mung bean has been completed, and the most saturated mung bean genetic map, which includes 1,321 SNPs, was constructed through GBS-seq (Kang et al., 2014). Compared with these traditional methods for developing markers, SLAF sequencing is a rapid, accurate, and cost-effective method for developing molecular markers (Sun et al., 2013). The SLAF sequencing method has been successfully used in many plants, including soybean (Li et al., 2014), cucumber (Xu et al., 2015), sesame (Zhang et al., 2013), and orchardgrass (Zhao et al., 2016), for molecular marker development and genetic map construction. SLAF-seq genotyping results can also provide important information for molecular-assisted breeding and genome evolution studies and SLAF-seq is an effective method for genome-wide SNP discovery, genotyping, and the fine mapping of QTLs. This method has recently been used successfully to draft genomes (Huang et al., 2013), study genome evolution (Chen S. et al., 2013), and construct high-density genetic maps in various plant species (Xu et al., 2014; Ma et al., 2015; Zhang et al., 2015; Zhao et al., 2016). The high accuracy and low cost of SLAF-seq make this method accessible for molecular plant breeding. The application of this method to gene mapping in mung bean has not been reported. Therefore, this study is the first attempt to construct a high-density SNP genetic map and identify genes for bruchid resistance in mung bean. In total, 341,502 high-quality SLAF markers were developed, and 179,690 of these were polymorphic. A genetic map containing 4,180 SNP markers was developed in this study, and most of these markers were anchored to the mung bean draft genome. The map is composed of 11 LGs, which corresponds to the chromosome number for mung bean. SLAF-seq is an ideal technology for developing chromosome-specific molecular markers in mung beans due to its high marker quality and quantity when creating a genetic map.
The bruchid is the most devastating storage pest of grain legumes and causes considerable losses to the mung bean industry. Understanding the molecular mechanisms underlying bruchid resistance is the most effective way to reduce grain legume loss and improve the quality of grain legumes. Mapping bruchid resistance-related genes and developing linked markers will facilitate the marker-assisted selection in mung bean breeding. Thus, this map will be important for cultivar improvements. Great efforts have been made to map Br genes in mung beans. Bruchid resistance is controlled by a single dominant locus that was first proposed in TC1966; subsequently additional minor modifier factors were postulated (Sarkar et al., 2011; Chen H.-M. et al., 2013). Bruchid resistance in TC1966 has been mapped previously. The Br gene in TC1966 was mapped between two RFLP markers, Bng143 (Vr05: 5,049,905) and Bng110 (Vr05: 6,780,603), on chromosome 5 of the mung bean reference genome (Kaga and Ishimoto, 1998). Later, the Br gene was mapped between 6,743,539 and 6,745,030 on chromosome 5 and was associated with the RAPD marker fragment OPW02a4 (Chen et al., 2007). Others have located a similar QTL approximately 16 cM away on chromosome 5 (Schafleitner et al., 2016). One major and two minor QTLs in TC1966 have been reported. An SSR marker, DMB-SSR158, is closely linked to the major QTL on chromosome 5, which is located either in or very near the QTL interval on chromosome 5 (Schafleitner et al., 2016). In our study, we identified one major QTL for bruchid resistance, and this QTL was localized within 5.23–5.59 Mb on chromosome 5, which is in agreement with previous reports (Chen et al., 2007).
The nature of the Br gene has been studied. It has been reported that the Br gene may be associated with vignatic acid biosynthesis (Kaga and Ishimoto, 1998), 7S storage globulins (vicilins) (Khan et al., 2003), the cysteine-rich protein VrD1 (Chen et al., 2002), chitinase, beta-1,3-glucanase and peroxidase (Khan et al., 2003). The polygalacturonase inhibitor gene has been suggested to be responsible for bruchid resistance in mung bean (Chotechung et al., 2016). In our study, RSP1 was suggested to be responsible for bruchid resistance, is different from a previous report suggesting that a polygalacturonase inhibitor (PGIP) gene may be responsible for bruchid resistance in mung bean (Chotechung et al., 2016). The RSP1 gene contains conserved motifs for the BURP domain protein. Amino acid sequence alignment showed that there was a significant difference between bruchid-resistance and bruchid-susceptible lines, suggesting that the function of RSP alleles in bruchid-resistance and bruchid-susceptible lines may be different. There are two amino acid deletions and some amino acid substitutions in the BURP domain, and these amino acids may be responsible for bruchid resistance. Further studies that focus on molecular characterization may provide genetic resources to improve the bruchid resistance of mung beans.
In conclusion, we used a cost-effective, high-throughput, and superior quality SLAF-seq strategy to generate an SNP-based genetic map for mung bean. This map contained 4,180 high-quality SNPs and spanned 1,751.39 cM with a mean marker interval of 0.42 cM. The combination of SLAF-seq and SNP index analysis provides an efficient method for identifying genomic regions related to bruchid resistance. An ∼0.36 Mb hotspot region with 15 candidate genes on Chr. 5 was shown to be tightly associated with bruchid resistance. These candidate genes will be validated for their functions via transformation and mutation approaches in the future studies.
The original contributions presented in the study are included in the article/Supplementary Material; further inquiries can be directed to the corresponding authors.
HC and XC designed the project and constructed the genetic population. HC analyzed the data, wrote the article, and reviewed drafts of the article. TC and LH performed the experiments. SW and LW performed some of the fieldwork and C. chinensis infestation test. All authors have read and approved the final manuscript.
This work was funded by the National Key R&D Program of China (2018YFD1000700/2018YFD1000703), the National Natural Science Foundation of China (31401442), the China Agriculture Research System of MOF and MARA-Food Legumes (CARS-08), and the Agricultural Science and Technology Innovation Program (ASTIP) of CAAS.
The authors declare that the research was conducted in the absence of any commercial or financial relationships that could be construed as a potential conflict of interest.
All claims expressed in this article are solely those of the authors and do not necessarily represent those of their affiliated organizations, or those of the publisher, the editors and the reviewers. Any product that may be evaluated in this article, or claim that may be made by its manufacturer, is not guaranteed or endorsed by the publisher.
The Supplementary Material for this article can be found online at: https://www.frontiersin.org/articles/10.3389/fgene.2022.903267/full#supplementary-material
Abe, A., Kosugi, S., Yoshida, K., Natsume, S., Takagi, H., Kanzaki, H., et al. (2012). Genome Sequencing Reveals Agronomically Important Loci in Rice Using MutMap. Nat. Biotechnol. 30, 174–178. doi:10.1038/nbt.2095
Altschul, S. F., Gish, W., Miller, W., Myers, E. W., and Lipman, D. J. (1990). Basic Local Alignment Search Tool. J. Mol. Biol. 215, 403–410. doi:10.1016/s0022-2836(05)80360-2
Attitalla, I. H. (2011). Modified CTAB Method for High Quality Genomic DNA Extraction from Medicinal Plants. Pak. J. Biol. Sci. 14, 998–999. doi:10.3923/pjbs.2011.998.999
Chaitieng, B., Kaga, A., Han, O. K., Wang, X. W., Wongkaew, S., Laosuwan, P., et al. (2002). Mapping a New Source of Resistance to Powdery Mildew in Mungbean. Plant Breed. 121, 521–525. doi:10.1046/j.1439-0523.2002.00751.x
Chankaew, S., Somta, P., Sorajjapinun, W., and Srinives, P. (2011). Quantitative Trait Loci Mapping of Cercospora Leaf Spot Resistance in Mungbean, Vigna Radiata (L.) Wilczek. Mol. Breed. 28, 255–264. doi:10.1007/s11032-010-9478-1
Chen, H. M., Ku, H. M., Schafleitner, R., Bains, T. S., George Kuo, C., Liu, C. A., et al. (2013). The Major Quantitative Trait Locus for Mungbean Yellow Mosaic Indian Virus Resistance Is Tightly Linked in Repulsion Phase to the Major Bruchid Resistance Locus in a Cross between Mungbean [Vigna Radiata (L.) Wilczek] and its Wild Relative Vigna Radiata ssp Sublobata. Euphytica 192, 205–216. doi:10.1007/s10681-012-0831-9
Chen, H. M., Liu, C. A., George Kuo, C., Chien, C. M., Sun, H.-C., Huang, C. C., et al. (2007). Development of a Molecular Marker for a Bruchid (Callosobruchus Chinensis L.) Resistance Gene in Mungbean. Euphytica 157, 113–122. doi:10.1007/s10681-007-9400-z
Chen, J., Somta, P., Chen, X., Cui, X., Yuan, X., and Srinives, P. (2016). Gene Mapping of a Mutant Mungbean (Vigna Radiata L.) Using New Molecular Markers Suggests a Gene Encoding a YUC4-like Protein Regulates the Chasmogamous Flower Trait. Front. Plant Sci. 7, 830. doi:10.3389/fpls.2016.00830
Chen, K. C., Lin, C. Y., Kuan, C. C., Sung, H. Y., and Chen, C. S. (2002). A Novel Defensin Encoded by a Mungbean cDNA Exhibits Insecticidal Activity against Bruchid. J. Agric. Food Chem. 50, 7258–7263. doi:10.1021/jf020527q
Chen S., S., Huang, Z., Dai, Y., Qin, S., Gao, Y., Zhang, L., et al. (2013). The Development of 7E Chromosome-specific Molecular Markers for Thinopyrum Elongatum Based on SLAF-Seq Technology. PLoS One 8, e65122. doi:10.1371/journal.pone.0065122
Chotechung, S., Somta, P., Chen, J., Yimram, T., Chen, X., and Srinives, P. (2016). A Gene Encoding a Polygalacturonase-Inhibiting Protein (PGIP) Is a Candidate Gene for Bruchid (Coleoptera: Bruchidae) Resistance in Mungbean (Vigna Radiata). Theor. Appl. Genet. 129, 1673–1683. doi:10.1007/s00122-016-2731-1
Desjardins, P., and Conklin, D. (2010). NanoDrop Microvolume Quantitation of Nucleic Acids. J. Vis. Exp.(45), 2565. doi:10.3791/2565
Fujii, K., Ishimoto, M., and Kitamura, K. (1989). Patterns of Resistance to Bean Weevils (Bruchidae) in Vigna Radiata-mungo-sublobata Complex Inform the Breeding of New Resistant Varieties. Appl. Entomol. Zool. 24, 126–132. doi:10.1303/aez.24.126
Fujii, K., and Miyazaki, S. (1987). Infestation Resistance of Wild Legumes (Vigna Sublobata) to Azuki Bean Weevil, Callosobruchus Chinensis (L.) (Coleoptera : Bruchidae) and its Relationship with Cytogenetic Classification. Appl. Entomol. Zool. 22, 229–230. doi:10.1303/aez.22.229
Huang, S., Ding, J., Deng, D., Tang, W., Sun, H., Liu, D., et al. (2013). Draft Genome of the Kiwifruit Actinidia Chinensis. Nat. Commun. 4, 2640. doi:10.1038/ncomms3640
Humphry, M. E., Lambrides, C. J., Chapman, S. C., Aitken, E. A. B., Imrie, B. C., Lawn, R. J., et al. (2005). Relationships between Hard-Seededness and Seed Weight in Mungbean (Vigna Radiata) Assessed by QTL Analysis. Plant Breed. 124, 292–298. doi:10.1111/j.1439-0523.2005.01084.x
Humphry, M. E., Magner, T., Mcintyre, C. L., Aitken, E. A. B., and Liu, C. J. (2003). Identification of a Major Locus Conferring Resistance to Powdery Mildew (ErysiphepolygoniDC) in Mungbean (Vigna Radiata L. Wilczek) by QTL Analysis. Genome 46, 738–744. doi:10.1139/g03-057
Humphry, M., Konduri, V., Lambrides, C., Magner, T., Mcintyre, C., Aitken, E., et al. (2002). Development of a Mungbean (Vigna Radiata) RFLP Linkage Map and its Comparison with Lablab (Lablab Purpureus) Reveals a High Level of Colinearity between the Two Genomes. Theor. Appl. Genet. 105, 160–166. doi:10.1007/s00122-002-0909-1
Isemura, T., Kaga, A., Tabata, S., Somta, P., Srinives, P., Shimizu, T., et al. (2012). Construction of a Genetic Linkage Map and Genetic Analysis of Domestication Related Traits in Mungbean (Vigna Radiata). PLoS One 7, e41304. doi:10.1371/journal.pone.0041304
Kaga, A., and Ishimoto, M. (1998). Genetic Localization of a Bruchid Resistance Gene and its Relationship to Insecticidal Cyclopeptide Alkaloids, the Vignatic Acids, in Mungbean (Vigna Radiata L. Wilczek). Mol. Gen. Genet. 258, 378–384. doi:10.1007/s004380050744
Kang, Y. J., Kim, S. K., Kim, M. Y., Lestari, P., Kim, K. H., Ha, B.-K., et al. (2014). Genome Sequence of Mungbean and Insights into Evolution within Vigna Species. Nat. Commun. 5, 5443. doi:10.1038/ncomms6443
Karim Khan, M. M., Khan, A., Ishimoto, M., Kitamura, K., and Komatsu, S. (2003). Proteome Analysis of the Relationship between Bruchid-Resistant and -Susceptible Mungbean Genotypes. Plant Genet. Resour. 1, 115–123. doi:10.1079/pgr200318
Khajudparn, P., Prajongjai, T., Poolsawat, O., and Tantasawat, P. A. (2012). Application of ISSR Markers for Verification of F1 Hybrids in Mungbean (Vigna Radiata). Genet. Mol. Res. 11, 3329–3338. doi:10.4238/2012.september.17.3
Kitsanachandee, R., Somta, P., Chatchawankanphanich, O., Akhtar, K. P., Shah, T. M., Nair, R. M., et al. (2013). Detection of Quantitative Trait Loci for Mungbean Yellow Mosaic India Virus (MYMIV) Resistance in Mungbean (Vigna Radiata (L.) Wilczek) in India and Pakistan. Breed. Sci. 63, 367–373. doi:10.1270/jsbbs.63.367
Lambrides, C. J., Godwin, I. D., Lawn, R. J., and Imrie, B. C. (2004). Segregation Distortion for Seed Testa Color in Mungbean (Vigna Radiata L. Wilcek). J. Hered. 95, 532–535. doi:10.1093/jhered/esh078
Lambrides, C. J., and Imrie, B. C. (2000). Susceptibility of Mungbean Varieties to the Bruchid Species Callosobruchus Maculatus (F.), C. Phaseoli (Gyll.), C. chinensis (L.), and Acanthoscelides Obtectus (Say.) (Coleoptera:Chrysomelidae). Aust. J. Agric. Res. 51, 85–89. doi:10.1071/ar99051
Lambrides, C. J., Lawn, R. J., Godwin, I. D., Manners, J., and Imrie, B. C. (2000). Two Genetic Linkage Maps of Mungbean Using RFLP and RAPD Markers. Aust. J. Agric. Res. 51, 415–425. doi:10.1071/ar99052
Li, B., Tian, L., Zhang, J., Huang, L., Han, F., Yan, S., et al. (2014). Construction of a High-Density Genetic Map Based on Large-Scale Markers Developed by Specific Length Amplified Fragment Sequencing (SLAF-Seq) and its Application to QTL Analysis for Isoflavone Content in Glycine Max. BMC Genomics 15, 1086. doi:10.1186/1471-2164-15-1086
Liu, D., Ma, C., Hong, W., Huang, L., Liu, M., Liu, H., et al. (2014). Construction and Analysis of High-Density Linkage Map Using High-Throughput Sequencing Data. Plos One 9, e98855. doi:10.1371/journal.pone.0098855
Ma, J. Q., Huang, L., Ma, C. L., Jin, J. Q., Li, C. F., Wang, R. K., et al. (2015). Large-Scale SNP Discovery and Genotyping for Constructing a High-Density Genetic Map of Tea Plant Using Specific-Locus Amplified Fragment Sequencing (SLAF-Seq). PLoS One 10, e0128798. doi:10.1371/journal.pone.0128798
Masari, A., Kaewwongwal, A., Somta, P., and Srinives, P. (2017). Inheritance and a Major Quantitative Trait Locus of Seed Starch Content in Mungbean (Vigna Radiata (L.) Wilczek). Euphytica 213. doi:10.1007/s10681-017-1960-y
Mei, L., Cheng, X. Z., Wang, S. H., Wang, L. X., Liu, C. Y., Sun, L., et al. (2009). Relationship between Bruchid Resistance and Seed Mass in Mungbean Based on QTL Analysis. Genome 52, 589–596. doi:10.1139/g09-031
Miller, M. R., Dunham, J. P., Amores, A., Cresko, W. A., and Johnson, E. A. (2007). Rapid and Cost-Effective Polymorphism Identification and Genotyping Using Restriction Site Associated DNA (RAD) Markers. Genome Res. 17, 240–248. doi:10.1101/gr.5681207
Miyagi, M., Humphry, M., Ma, Z. Y., Lambrides, C. J., Bateson, M., and Liu, C. J. (2004). Construction of Bacterial Artificial Chromosome Libraries and Their Application in Developing PCR-Based Markers Closely Linked to a Major Locus Conditioning Bruchid Resistance in Mungbean (Vigna Radiata L. Wilczek). Theor. Appl. Genet. 110, 151–156. doi:10.1007/s00122-004-1821-7
Nair, R. M., Yang, R.-Y., Easdown, W. J., Thavarajah, D., Thavarajah, P., Hughes, J. d. A., et al. (2013). Biofortification of Mungbean (Vigna Radiata) as a Whole Food to Enhance Human Health. J. Sci. Food Agric. 93, 1805–1813. doi:10.1002/jsfa.6110
Sarkar, S., Ghosh, S., Chatterjee, M., Das, P., Lahari, T., Maji, A., et al. (2011). Molecular Markers Linked with Bruchid Resistance in Vigna Radiata Var. Sublobata and Their Validation. J. Plant Biochem. Biotechnol. 20, 155–160. doi:10.1007/s13562-011-0039-4
Schafleitner, R., Huang, S. M., Chu, S. H., Yen, J. Y., Lin, C. Y., Yan, M. R., et al. (2016). Identification of Single Nucleotide Polymorphism Markers Associated with Resistance to Bruchids (Callosobruchus spp.) in Wild Mungbean (Vigna Radiata Var. Sublobata) and Cultivated V. Radiata through Genotyping by Sequencing and Quantitative Trait Locus Analysis. BMC Plant Biol. 16, 159. doi:10.1186/s12870-016-0847-8
Sompong, U., Somta, P., Raboy, V., and Srinives, P. (2012). Mapping of Quantitative Trait Loci for Phytic Acid and Phosphorus Contents in Seed and Seedling of Mungbean (Vigna Radiata (L.) Wilczek). Breed. Sci. 62, 87–92. doi:10.1270/jsbbs.62.87
Somta, C., Somta, P., Tomooka, N., Ooi, P. A.-C., Vaughan, D. A., and Srinives, P. (2008). Characterization of New Sources of Mungbean (Vigna Radiata (L.) Wilczek) Resistance to Bruchids, Callosobruchus Spp. (Coleoptera: Bruchidae). J. Stored Prod. Res. 44, 316–321. doi:10.1016/j.jspr.2008.04.002
Somta, P., Ammaranan, C., Ooi, P. A.-C., and Srinives, P. (2007). Inheritance of Seed Resistance to Bruchids in Cultivated Mungbean (Vigna Radiata, L. Wilczek). Euphytica 155, 47–55. doi:10.1007/s10681-006-9299-9
Sonah, H., Bastien, M., Iquira, E., Tardivel, A., Légaré, G., Boyle, B., et al. (2013). An Improved Genotyping by Sequencing (GBS) Approach Offering Increased Versatility and Efficiency of SNP Discovery and Genotyping. PLoS One 8, e54603. doi:10.1371/journal.pone.0054603
Southgate, B. J. (1979). Biology of the Bruchidae. Annu. Rev. Entomol. 24, 449–473. doi:10.1146/annurev.en.24.010179.002313
Spindel, J., Wright, M., Chen, C., Cobb, J., Gage, J., Harrington, S., et al. (2013). Bridging the Genotyping Gap: Using Genotyping by Sequencing (GBS) to Add High-Density SNP Markers and New Value to Traditional Bi-parental Mapping and Breeding Populations. Theor. Appl. Genet. 126, 2699–2716. doi:10.1007/s00122-013-2166-x
Sun, X., Liu, D., Zhang, X., Li, W., Liu, H., Hong, W., et al. (2013). SLAF-seq: an Efficient Method of Large-Scale De Novo SNP Discovery and Genotyping Using High-Throughput Sequencing. PLoS One 8, e58700. doi:10.1371/journal.pone.0058700
Takagi, H., Abe, A., Yoshida, K., Kosugi, S., Natsume, S., Mitsuoka, C., et al. (2013). QTL-seq: Rapid Mapping of Quantitative Trait Loci in Rice by Whole Genome Resequencing of DNA from Two Bulked Populations. Plant J. 74, 174–183. doi:10.1111/tpj.12105
Talekar, N. S., and Lin, C. P. (1992). Characterization of Callosobruchus Chinensis (Coleoptera: Bruchidae) Resistance in Mungbean. J. Econ. Entomol. 85, 1150–1153. doi:10.1093/jee/85.4.1150
Tang, D., Dong, Y., Ren, H., Li, L., and He, C. (2014). A Review of Phytochemistry, Metabolite Changes, and Medicinal Uses of the Common Food Mung Bean and its Sprouts (Vigna Radiata). Chem. Central J. 8, 4. doi:10.1186/1752-153x-8-4
Tomooka, N., Kashiwaba, K., Vaughan, D. A., Ishimoto, M., and Egawa, Y. (2000). The Effectiveness of Evaluating Wild Species: Searching for Sources of Resistance to Bruchid Beetles in the Genus Vigna Subgenus Ceratotropis. Euphytica 115, 27–41. doi:10.1023/a:1003906715119
Wang, C. M., Bai, Z. Y., He, X. P., Lin, G., Xia, J. H., Sun, F., et al. (2011). A High-Resolution Linkage Map for Comparative Genome Analysis and QTL Fine Mapping in Asian Seabass, Lates calcarifer. BMC Genomics 12, 174. doi:10.1186/1471-2164-12-174
Wang, L., Wu, C., Zhong, M., Zhao, D., Mei, L., Chen, H., et al. (2016). Construction of an Integrated Map and Location of a Bruchid Resistance Gene in Mung Bean. Crop J. 4, 360–366. doi:10.1016/j.cj.2016.06.010
Wang, Y., Tang, H., Debarry, J. D., Tan, X., Li, J., Wang, X., et al. (2012). MCScanX: a Toolkit for Detection and Evolutionary Analysis of Gene Synteny and Collinearity. Nucleic Acids Res. 40, e49. doi:10.1093/nar/gkr1293
War, A. R., Murugesan, S., Boddepalli, V. N., Srinivasan, R., and Nair, R. M. (2017). Mechanism of Resistance in Mungbean [Vigna Radiata (L.) R. Wilczek Var. Radiata] to Bruchids, Callosobruchus spp. (Coleoptera: Bruchidae). Front. Plant Sci. 8, 1031. doi:10.3389/fpls.2017.01031
Wu, K., Liu, H., Yang, M., Tao, Y., Ma, H., Wu, W., et al. (2014). High-Density Genetic Map Construction and QTLs Analysis of Grain Yield-Related Traits in Sesame (Sesamum indicum L.) Based on RAD-Seq Techonology. BMC Plant Biol. 14, 274. doi:10.1186/s12870-014-0274-7
Xu, X., Xu, R., Zhu, B., Yu, T., Qu, W., Lu, L., et al. (2014). A High-Density Genetic Map of Cucumber Derived from Specific Length Amplified Fragment Sequencing (SLAF-Seq). Front. Plant Sci. 5, 768. doi:10.3389/fpls.2014.00768
Xu, X., Lu, L., Zhu, B., Xu, Q., Qi, X., and Chen, X. (2015). QTL Mapping of Cucumber Fruit Flesh Thickness by SLAF-Seq. Sci. Rep. 5, 15829. doi:10.1038/srep15829
Yao, Y., Cheng, X., and Ren, G. (2015). A 90-day Study of Three Bruchid-Resistant Mung Bean Cultivars in Sprague-Dawley Rats. Food Chem. Toxicol. 76, 80–85. doi:10.1016/j.fct.2014.11.024
Young, N. D., Danesh, D., Menancio-Hautea, D., and Kumar, L. (1993). Mapping Oligogenic Resistance to Powdery Mildew in Mungbean with RFLPs. Theor. Appl. Genet. 87, 243–249. doi:10.1007/bf00223772
Young, N. D., Kumar, L., Menancio-Hautea, D., Danesh, D., Talekar, N. S., Shanmugasundarum, S., et al. (1992). RFLP Mapping of a Major Bruchid Resistance Gene in Mungbean (Vigna Radiata, L. Wilczek). Theor. Appl. Genet. 84-84, 839–844. doi:10.1007/bf00227394
Zhang, J., Zhang, Q., Cheng, T., Yang, W., Pan, H., Zhong, J., et al. (2015). High-Density Genetic Map Construction and Identification of a Locus Controlling Weeping Trait in an Ornamental Woody Plant (Prunus mume Sieb. et Zucc). DNA Res. 22, 183–191. doi:10.1093/dnares/dsv003
Zhang, Y., Wang, L., Xin, H., Li, D., Ma, C., Ding, X., et al. (2013). Construction of a High-Density Genetic Map for Sesame Based on Large Scale Marker Development by Specific Length Amplified Fragment (SLAF) Sequencing. BMC Plant Biol. 13, 141. doi:10.1186/1471-2229-13-141
Keywords: mung bean (Vigna radiata L.), SLAF-seq, SNP, genetic map, bruchid resistance
Citation: Chen T, Hu L, Wang S, Wang L, Cheng X and Chen H (2022) Construction of High-Density Genetic Map and Identification of a Bruchid Resistance Locus in Mung Bean (Vigna radiata L.). Front. Genet. 13:903267. doi: 10.3389/fgene.2022.903267
Received: 24 March 2022; Accepted: 24 May 2022;
Published: 08 July 2022.
Edited by:
Aditya Pratap, Indian Institute of Pulses Research (ICAR), IndiaReviewed by:
Manivannan Narayana, Tamil Nadu Agricultural University, IndiaCopyright © 2022 Chen, Hu, Wang, Wang, Cheng and Chen. This is an open-access article distributed under the terms of the Creative Commons Attribution License (CC BY). The use, distribution or reproduction in other forums is permitted, provided the original author(s) and the copyright owner(s) are credited and that the original publication in this journal is cited, in accordance with accepted academic practice. No use, distribution or reproduction is permitted which does not comply with these terms.
*Correspondence: Xuzhen Cheng, Y2hlbmd4dXpoZW5AY2Fhcy5jbg==; Honglin Chen, Y2hlbmhvbmdsaW5AY2Fhcy5jbg==
†These authors have contributed equally to this work and share the first authorship
Disclaimer: All claims expressed in this article are solely those of the authors and do not necessarily represent those of their affiliated organizations, or those of the publisher, the editors and the reviewers. Any product that may be evaluated in this article or claim that may be made by its manufacturer is not guaranteed or endorsed by the publisher.
Research integrity at Frontiers
Learn more about the work of our research integrity team to safeguard the quality of each article we publish.