 Shuo Huang
 Qihan Luo
 Junhao Huang
 Changyu Li
- School of Pharmaceutical Sciences, Zhejiang Chinese Medical University, Hangzhou, China
Renal cell carcinoma (RCC) is the most common type of renal cancer, characterized by the dysregulation of metabolic pathways. RCC is the second highest cause of death among patients with urologic cancers and those with cancer cell metastases have a 5-years survival rate of only 10–15%. Thus, reliable prognostic biomarkers are essential tools to predict RCC patient outcomes. This study identified differentially expressed genes (DEGs) in the gene expression omnibus (GEO) database that are associated with pre-and post-metastases in clear cell renal cell carcinoma (ccRCC) patients and intersected these with metabolism-related genes in the Kyoto encyclopedia of genes and genomes (KEGG) database to identify metabolism-related DEGs (DEMGs). GOplot and ggplot packages for gene ontology (GO) and KEGG pathway enrichment analysis of DEMGs with log (foldchange) (logFC) were used to identify metabolic pathways associated with DEMG. Upregulated risk genes and downregulated protective genes among the DEMGs and seven independent metabolic genes, RRM2, MTHFD2, AGXT2, ALDH6A1, GLDC, HOGA1, and ETNK2, were found using univariate and multivariate Cox regression analysis, intersection, and Lasso-Cox regression analysis to establish a metabolic risk score signature (MRSS). Kaplan-Meier survival curve of Overall Survival (OS) showed that the low-risk group had a significantly better prognosis than the high-risk group in both the training cohort (p < 0.001; HR = 2.73, 95% CI = 1.97–3.79) and the validation cohort (p = 0.001; HR = 2.84, 95% CI = 1.50–5.38). The nomogram combined with multiple clinical information and MRSS was more effective at predicting patient outcomes than a single independent prognostic factor. The impact of metabolism on ccRCC was also assessed, and seven metabolism-related genes were established and validated as biomarkers to predict patient outcomes effectively.
1 Introduction
As the third most lethal tumor of the urinary system after prostate cancer and bladder cancer, renal cell carcinoma (RCC) is getting more attention (Global Burden of Disease Cancer et al., 2022). There are almost 430,000 new RCC patients worldwide each year, of whom approximately 180,000 will die of this disease (Sung et al., 2021). The prevalence and mortality of RCC continue to rise, posing a severe threat to human health (Owens, 2016; Turajlic et al., 2018; Elias et al., 2021).
RCC is a general term for a class of diseases divided into different pathological subtypes based on histological and morphological differences. The most common RCC subtype, clear cell renal cell carcinoma (ccRCC), accounts for approximately 75% of cases, followed by papillary renal cell carcinoma (pRCC), accounting for 18.5% of cases. Other rare subtypes of RCC include renal chromophobe carcinoma and renal collecting duct carcinoma (Ricketts et al., 2018). Recent studies have demonstrated metabolic abnormalities in a large proportion of RCC cases (Linehan et al., 2019; Bobulescu et al., 2021; Qi et al., 2021).
As imaging diagnostic technology and treatment methods continue to develop, it becomes easier to detect tumors early and initiate timely treatment, improving the survival rate of RCC patients. As a result, the proportion of patients with advanced RCC has declined from 30 to 17% (Strizova et al., 2019; Schulz et al., 2021; Tariq et al., 2022). While many small-molecule targeted drugs with immune checkpoint inhibitors have been marketed and put into use, side effects and drug resistance limit their application. In addition, a large proportion of patients receiving immune checkpoint inhibitor therapy have a similar prognosis as those receiving targeted agents. Notably, the prognosis of metastatic RCC patients is still poor, with the 5-years survival rate remaining at 10–15%. Thus, there is an urgent need to find reliable biomarkers to predict RCC patient outcomes (Kabaria et al., 2016; Reed et al., 2019; Lee et al., 2021a; Bedke et al., 2021; Doppalapudi et al., 2021; Ince and Eisen, 2021).
Metabolism is the most fundamental biological process of organism self-renewal. Tumor cells have different metabolic processes than normal cells because they derive most of their energy from glycolysis while normal cells obtain energy through oxidative phosphorylation under normoxic conditions (Fang et al., 2021; Huang et al., 2021; Morrissey et al., 2021; Xing et al., 2021). Using ccRCC as an example, studies have shown that loss of VHL gene function or VHL gene loss on the 3P chromosome exists in more than 90% of hereditary and a large proportion of sporadic ccRCC (Jonasch et al., 2021). This weakens the degradation of targeted HIF1/2 transcription factors, resulting in the accumulation of HIF1/2 transcription factors under normoxic conditions, putting cells in pseudo-hypoxic situations that lead to the remodeling of metabolic processes and upregulation of various growth factors (Bacigalupa and Rathmell, 2020). Metabolic remodeling of the tumor causes metabolic abnormalities at the original location (Li et al., 2014). In addition, tumor cells use exosomes and cytokines to alter cell metabolism in other body regions, weakening the immune response and enabling tumor metastasis (Morrissey et al., 2021).
Since abnormal cell metabolism is an essential marker for tumorigenesis and progression, it was hypothesized that metabolism-related genes could predict RCC patient outcomes (Wettersten et al., 2017). Many studies have assessed the relationship between metabolic markers and outcomes associated with the ccRCC subtype (Hakimi et al., 2016; Wu et al., 2020; Zhang et al., 2021). In contrast, few have explored the relationship between metabolic prognostic markers and other significant RCC subtypes. This study investigated the correlation between the metabolic machinery and the prognosis of ccRCC patients using the Gene Expression Omnibus (GEO, https://www.ncbi.nlm.nih.gov/gds/?term) (Barrett et al., 2013) and the Cancer Genome Atlas (TCGA, https://www.cancer.gov/tcga) databases. A metabolic gene-based risk score signature was established to predict ccRCC patient outcomes effectively. The signature was further validated using pRCC patient data to reveal potential associations between the major subtypes of RCC.
2 Materials and Methods
2.1 KEGG Metabolism-Related Genes Download
The KEGG database was searched using Homo sapiens as the species to identify genes that play a role in metabolic regulation. The number of metabolic pathways was obtained, and metabolic-related pathway-related genes were downloaded using the R package, KEGGREST (Therneau and Grambsch, 2000) and tidyverse (Wickham et al., 2019). All genes in the pathway were collected for further research (Supplementary Table S1).
2.2 GEO Genes Obtained
Gene expression data was downloaded from the GSE66272 dataset and divided into two subsets, GSE66270 (M0) and GSE66271 (M1), based on whether the tumor had metastasized. DEG screening was performed using the limma package (Ritchie et al., 2015) with the screening conditions set as: | log2FC | > 2 and adj. p-value <0.05. Visualization was performed using the ggplot2 package (Wickham, 2016) for the volcano plot. DEGs in the dataset were collected for further study.
2.3 Intersecting Genes by Venn Diagram
The DEGs were divided into the M0 and M1 groups based on the subset in which the genes were located and further subdivided into those with upregulated or downregulated expression. Upregulated DEGs in the M0 and M1 datasets were intersected, and the same action was taken for downregulated DEGs to obtain differentially expressed genes expressed before and after tumor metastasis. The upregulated and downregulated DEGs were each intersected with metabolism-related genes to obtain metabolism-related DEGs (MRGs) in tumors. Visualization was performed using Venny 2.1 (https://bioinfogp.cnb.csic.es/tools/venny/index.html).
2.4 Gene Ontology and Kyoto Encyclopedia of Genes and Genomes Pathway Enrichment Analysis and Protein-Protein Interaction Network Construction
MRGs’ GO and KEGG enrichment analysis was performed using the R package clusterprofiler (Wu et al., 2021), org. Hs.eg.db (Carlson, 2019) and GOplot (Walter et al., 2015) to assess biological processes and pathways in which genes play a role. Enrichment results were filtered by setting adj. p-value < 0.05 as condition, visualized by ggplot2. Protein functions can impact the function and expression of other proteins. Thus, protein-protein interaction (PPI) data were acquired using the STRING database. The filtering condition was set to the minimum required interaction score: highest confidence (0.900). Cytoscape3.8.0 was used to visualize the PPIs.
2.5 Identification of Metabolically Relevant Prognostic Genes in the TCGA-KIRC Cohort
RNAseq data in the level 3 HTSeq-FPKM format was downloaded from the ccRCC project (KIRC) in TCGA. The RNAseq data were converted into the resulting TPM format data, and Log2 (Exp+1) transformation and standardization processing were performed. After excluding abnormal data, univariate Cox regression analysis was performed using the survival package (Therneau, 2022).
The hazard ratio (HR) for selected genes from the univariate Cox regression analysis was visualized using the ggplot2 package with a p-value <0.05. The upregulated risk genes and downregulated protective genes were intersected with DEG Corresponding trends in change using the Venny2.1 tool for further analysis. A total of 23 differentially expressed metabolism genes (DEMGs) were selected. While an HR > 1 indicated that the gene may be a risk gene and be associated with a poor prognosis, an HR < 1 indicated that the gene may have a protective effect and be associated with a good prognosis.
Overall survival (OS) was defined as the time from the beginning of a random assignment to death for any reason (the last follow-up time was for patients lost to follow-up and the end of follow-up was for patients still alive when the study ended). OS is considered the most efficient endpoint in oncology clinical trials and is the preferred endpoint when patient survival can be adequately assessed. Disease-free survival (DFS) was defined as the time between the start of randomization and disease recurrence or death (for any reason). Progression-free interval (PFI) was defined as the time from the randomization date of primary treatment to disease recurrence. To increase the prediction accuracy, KM survival curves were plotted by Cox regression for DEMGs. The OS, DSS, and PFI of the DEMGs were analyzed, and the genes with a Cox regression p-value <0.05 were considered metabolism-related prognostic genes.
The Delong test and plotted receiver operating characteristic (ROC) curves were performed to validate the accuracy of the KM curves selected to predict the OS of ccRCC patients and determine whether the selected genes had potential as ccRCC biomarkers.
2.6 Establishment of a Metabolic Risk Score Signature (MRSS) for Prognosis
To select potential genes that are reliably associated with ccRCC prognosis, the glmnet package and survival package was used to fit the Least Absolute Shrinkage and Selection Operator (LASSO) regression model on 16 DEMGs. The study subjected parameter selection to a 10-fold cross-validation, with partial likelihood biases meeting the minimum criteria.
Subsequently, a multivariate Cox regression analysis was performed to obtain the regression coefficients of independent prognostic factors. The DEMGs with significant OS, DFS, and PFI survival curve differences were identified by combining multivariate Cox regression coefficients (β-Values), the MRSS model was built, and the formula was defined as follows (Exp represents the gene expression level and β represents regression coefficients from the multivariate Cox analysis):
Data processing was performed using the pROC package (Robin et al., 2011) and the area under the ROC curve (AUC) was calculated to test the accuracy of models for predicting 1, 3 and 5-years survival. Data were visualized using the ggplot2 package.
2.7 Metabolism Risk Score Signature Combined With Clinical Information
The TCGA dataset supplied clinical information, including the predictive prognosis factors. Univariate Cox analysis was performed to clarify the correlation between MRSS and OS. Multivariate Cox regression analysis was then used to evaluate whether the established MRSS could be an independent predictor. To evaluate the OS of ccRCC patients as comprehensively as possible, a prognostic nomogram including age, gender, stage and MRSS was created using the RMS package (Harrell, 2020) combined with the survival package. The concordance index (c-index) was used to evaluate the predictive accuracy of the nomogram.
2.8 Validation of the MRSS
To evaluate whether the model applies to other renal tumors, considering that they often have similar anatomic and pathological manifestations to ccRCC, pRCC (TCGA - KIRP) was selected as a validation dataset (n = 326).
Genes involved in building the MRSS mode were filtered out of the dataset and. Their expression was normalized; then, these data were combined with the MRSS calculation formula to calculate a risk score for each patient in the TCGA-KIRP cohort. Based on the median risk score, TCGA-KIRP patients were divided into a high-risk and a low-risk group. KM survival and ROC curves were plotted to assess differences in prognosis for the two groups of patients and whether there was sufficient accuracy in predicting outcomes using the MRSS.
The 1 -, 3 - and 5-years survival probabilities of TCGA-KIRP patients were also compared using a nomogram by combining age, gender, and disease stage. The calibration curve was plotted to verify the model’s performance, and the C-index was used to compare the accuracy of traditional TNM-stage, MRSS, and nomogram prediction.
To assess the prognostic value of the MRSS in ccRCC, the KM-plotter online analysis website (Lánczky and Győrffy, 2021) and the GEPIA database (Tang et al., 2017) contain multiple GEO/TCGA/GTEx datasets were used to plot survival curves. RNA expression of prognostic renal cancer-related genes was collected from the GENT2 website (Park et al., 2019) and visualized. The protein expression of the MRSS-involved genes was analyzed using the PDC000127 dataset from The National Cancer Institute’s Clinical Proteomic Tumor Analysis Consortium (Edwards et al., 2015) (CPTAC, https://proteomics.cancer.gov/programs/cptac).
2.9 Cell Culture
The 786-O ccRCC cell line was gifted by Prof Dahong Zhang from Zhejiang Provincial People’s Hospital. The HK-2 human normal renal tubular epithelial cell line was obtained from the cell bank of the Chinese Academy of Sciences. The 2 cell lines were cultured in Dulbecco’s Modified Eagle Medium (Gibco, United States) supplemented with 10% fetal bovine serum (Gibco, United States) and 1% penicillin-streptomycin (Gibco, United States) at 37 °C in an incubator (Thermo, United States) with 5% CO2 and saturated humidity.
2.10 RNA Extraction and Quantitative Real-Time Polymerase Chain Reaction
Total RNA of the 786-O and HK-2 cells was extracted using the Trizol reagent (Ambion, United States) and dissolved in RNase-free ddH2O (Takara Bio, China) under the manufacturer’s instructions. Next, the RNA samples were utilized for generating cDNA using the PrimeScript™ RT Master Mix Kit (Takara Bio, China). Finally, the cDNA samples were employed for qRT-PCR with the TB Green® Premix Ex Taq™ Kit (Takara Bio, China). The amplification was performed using the CFX96 Real-Time system (BIO-RAD, United States). The primers of RRM2, MTHFD2, AGXT2, ALDH6A1, GLDC, HOGA1, ETNK2 and GAPDH were synthesized by Sangon (Sangon Biotech, China), and the sequences are listed in Supplementary Table S10. GAPDH was applied as an internal control, and the relative expression level of 7 genes was calculated by the 2−ΔΔCT method (Schmittgen and Livak, 2008). The detailed procedure for qRT-PCR is given in Supplementary Table S11.
2.11 Statistical Analysis
Data were summarized and transformed using Excel. Independent prognostic factors were processed using univariate/multivariate Cox regression analysis. All data were further processed and visualized using R (v3.6.3), with a p-value <0.05 considered significant.
3 Results
3.1 Differentially Expressed Gene Analysis
26 samples in the GSE66271 (M1) dataset and 28 in the GSE66270 (M0) dataset were downloaded, with tumors and paracancerous tissues accounting for half of each dataset. All gene expression data were normalized (Figure 1A, 2A) and filtered with |log2FC > 2| and adj. p-value <0.05. Volcano plots (Figure 1B, 2B) were used to assess DEG gene expression broadly, and PCA analysis (Figure 1C, 2C) with a heatmap (Figure 1D, 2D) was used to assess differences in the expression patterns of tumor and paracancerous tissue patterns. Under these conditions, 355 upregulated and 554 downregulated genes were collected from the M1 dataset (Supplementary Table S2), and 630 upregulated and 805 downregulated genes were collected from the M0 dataset (Supplementary Table S3). Genes differentially expressed before and after tumor metastasis were obtained by taking the intersection of up and downregulated genes in the M0 and M1 datasets, respectively. The up and downregulated DEGs were then intersected with metabolic genes from the KEGG database (Supplementary Table S1) to obtain DEMGs expressed in the tumor before and after metastasis. 17 and 72 up and downregulated DEMGs were obtained (Supplementary Table S4), respectively. This process was visualized with a Venn diagram (Figure 3).
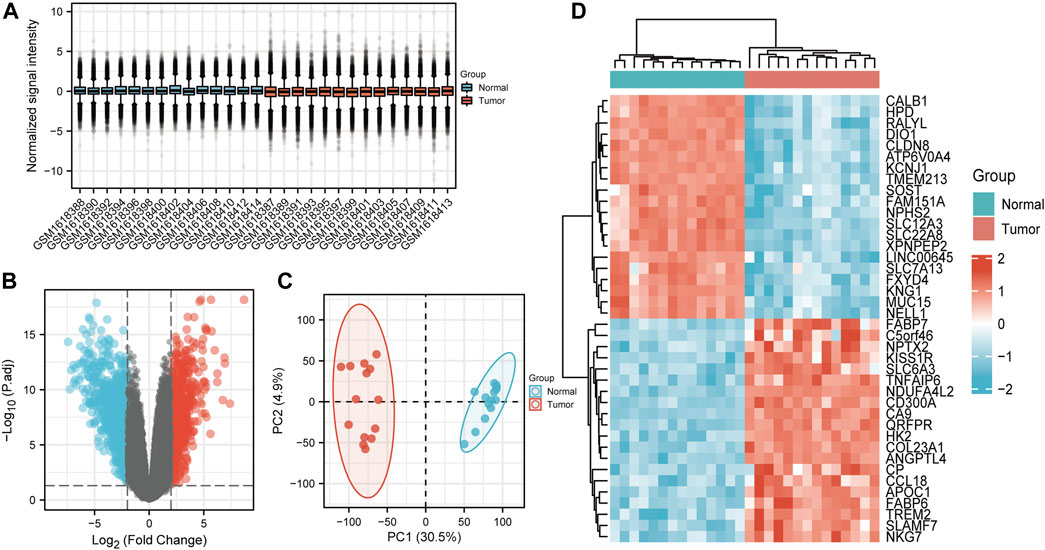
FIGURE 1. GSE66270 (M0) dataset analysis (A) Boxplots show that the median across samples is essentially on a horizontal line, indicating good normalization. (B) Volcano map; Blue and red dots represent up and downregulated genes that were eligible for screening. The current threshold was |logFC| > 2 with adj. p-value <0.05 (C) The samples from each group were separated in the PCA plot The ratio of PC1 and PC2 was high, indicating an obvious difference between groups and meaningful results of subsequent difference analyses should be reliable. (D) Heatmap of significantly differentially expressed genes.
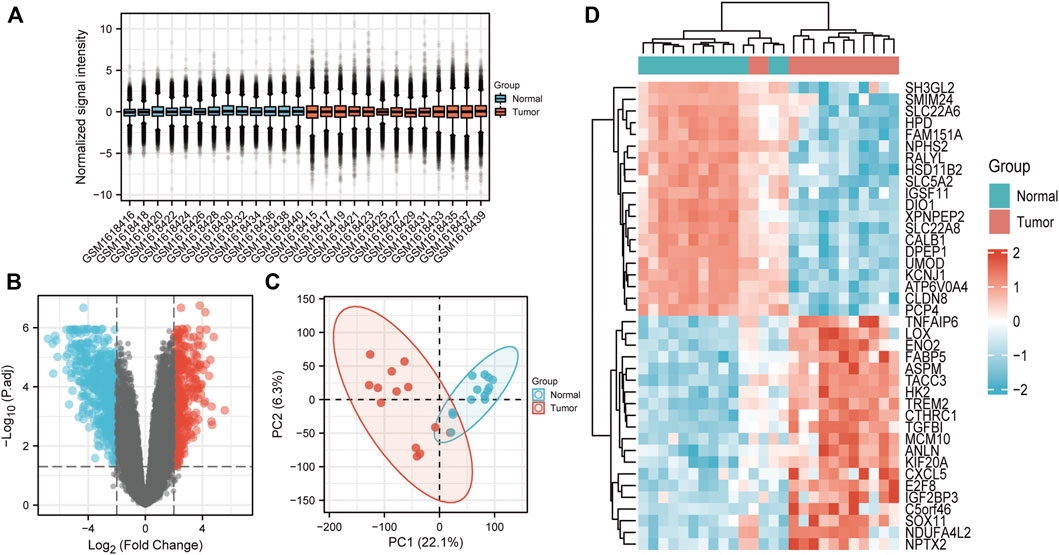
FIGURE 2. GSE66271 (M1) dataset analysis (A) Boxplots. (B) Volcano map; Blue and red dots represent up and downregulated genes. The current threshold was |logFC| >2 with a adj. p-value <0.05 (C) PCA plot indicated an obvious difference between the groups. (D) Heatmap of significantly differentially expressed genes.
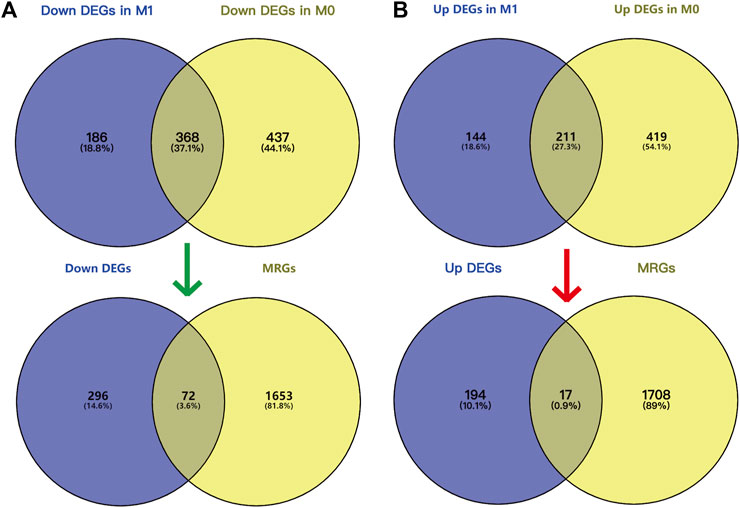
FIGURE 3. Screening DEMGs by intersecting DEGs and MRGs. Venn diagram of DEGs in M0 (A) and M1 (B) datasets and MRGs. GO and KEGG pathway enrichment analysis and PPI network.
GO (Figure 4A) and KEGG pathway enrichment (Figure 4B) analyses were performed to clarify the DEGs’ potential biological processes and signaling pathways. DEG expression was determined using the M1 dataset, and the data (Supplementary Tables S5, S6) were visualized. The plot can be divided into the inner and outer circles. Each column of the inner circle corresponds to an entry, and the height is the relative size of the adj. p-value. The higher the value, the smaller the p. adjust of the ID. The color of the corresponding column represents the Z-score value of the entry. “Up” and “Down” represent the logFC of the molecules corresponding to the entry as positive and negative.
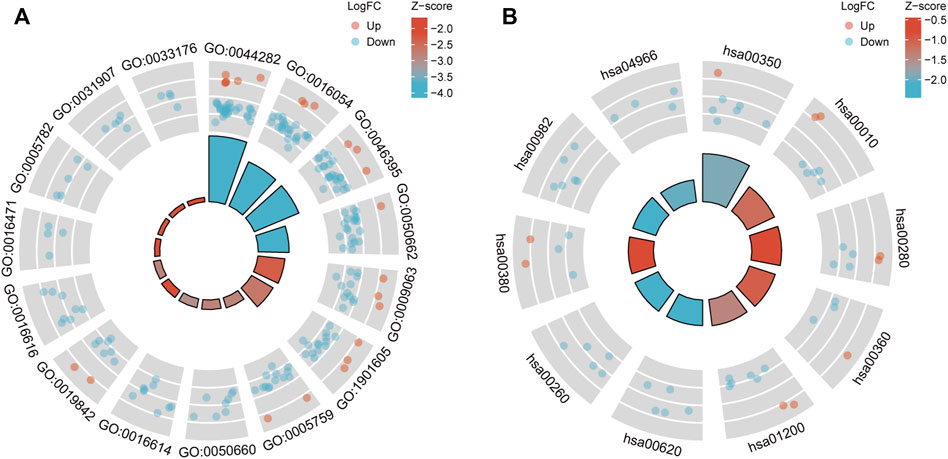
FIGURE 4. Results of GO enrichment (A) and KEGG pathway analyses (B).
Protein coding genes undergo transcription and translation to produce corresponding proteins with genetically determined functions. In contrast, the execution of protein function is not isolated, and there is a mutual connection between individual proteins. The STRING database collected PPI information from the DEMGs, and the “highest confidence (0.900)” was set as the required minimum interaction score. The data were imported into Cytoscape (v3.8.0) for network visualization. The color of the network node represents whether a gene is up or downregulated, and the size of the network node correlates positively with the degree of the node (Figure 5).
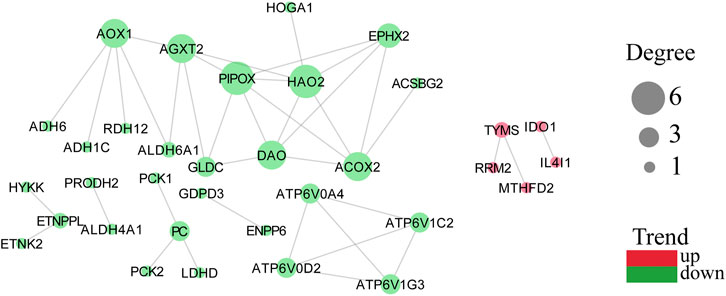
FIGURE 5. PPI network with node degree value with trends. A more considerable degree value of a target represents more association with other targets. Green represents downregulation and red represents upregulation.
3.2 Result of Cox Regression Analysis and Screened Prognostic Related DEMGs
At a screening conditional p-value <0.05, univariate Cox regression analysis results showed that 5 up and 29 downregulated DEMGs were associated with patient prognosis, and gene-disease associations became smaller when the HR approached 1. High expression of risk genes (HR > 1) was associated with poor prognosis, whereas high expression of protective genes (HR < 1) was associated with good prognosis (Figure 6A). The risk genes that were upregulated and protective genes that were downregulated in tumors were of particular interest. By intersection screening, 3 upregulated risk genes and 19 downregulated protective genes were obtained from the DEMGs (Figure 6B, C).
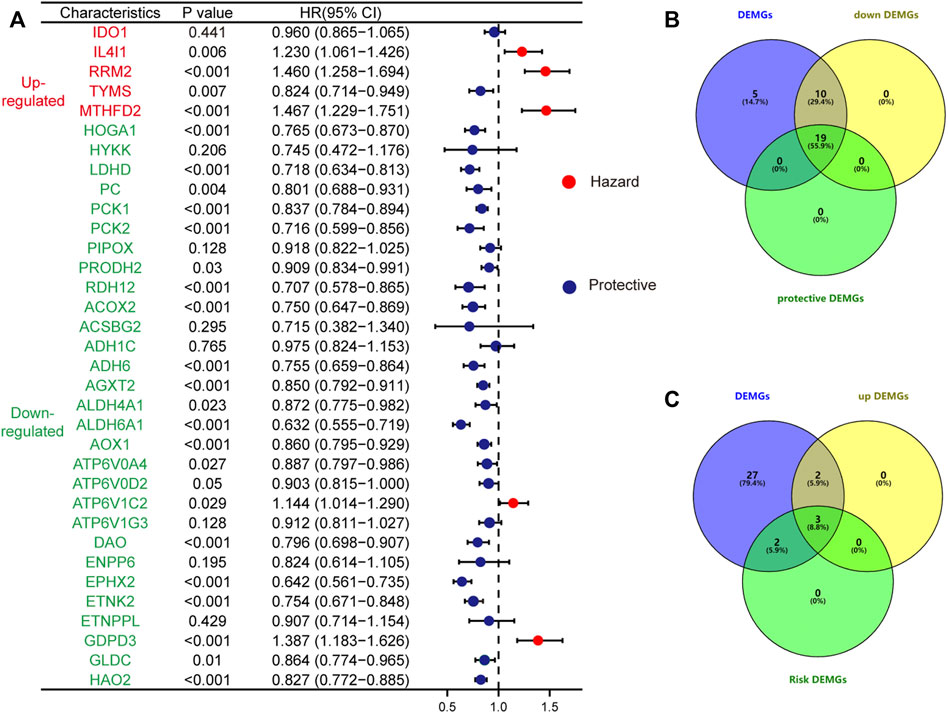
FIGURE 6. The forest plot shows the results of the univariate Cox regression analysis (A); The up-regulated risk genes (B) and down-regulated protective genes (C) in DEMGs were screened by taking the intersection.
To further screen and explore the relationship between the obtained genes and prognosis, the expression of each gene in TCGA-KIRC patients was assessed, duplicates were excluded, and the gene expression levels were divided into a high expression (high) and low expression (low) group according to the median expression level. The patients’ differential OS, DSS, and PFI were analyzed by Cox regression to plot the KM survival curves; Screening resulted in 16 prognostically relevant DEMGs (Table 1) (Supplementary Figures S1, S2). The expression of potential biomarkers under different survival outcomes was explored in the TCGA-KIRC cohort. High expression of risk genes and low expression of protective genes correspond with worse prognostic outcomes (Figure 7A). pRCC is the second most prevalent phenotype among RCC, and similar results were found in the TCGA-KIRP cohort (Figure 7B).

TABLE 1. Significance testing for survival analysis.
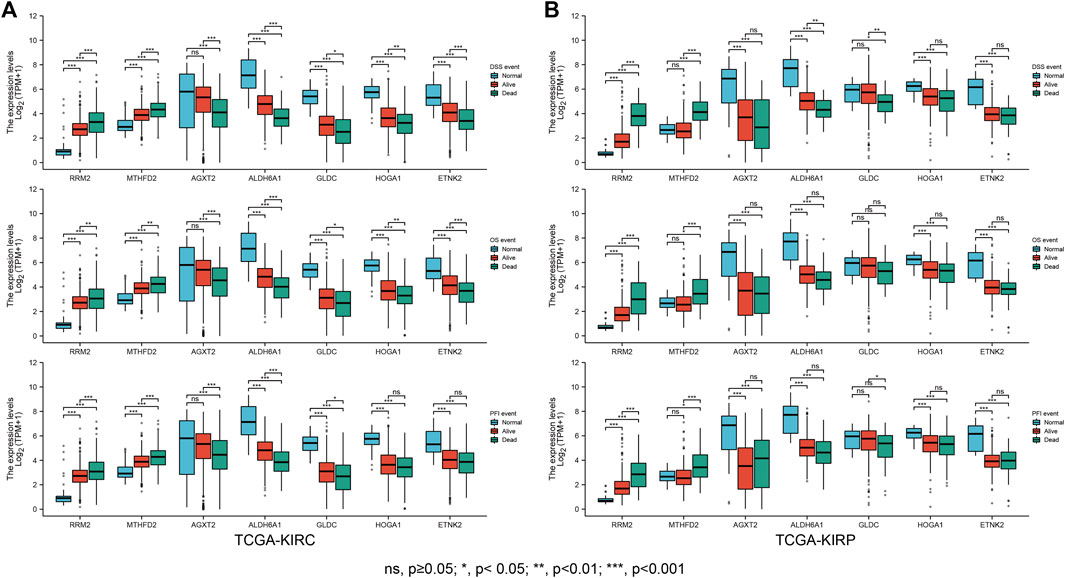
FIGURE 7. Clinical outcome correlation analysis of the DEMGs. Boxplots showed that DEMG expression differed significantly between patients with different clinical outcomes. Compared with normal individuals, patients in the TCGA-KIRC cohort (A) and TCGA-KIRP (B) whose clinical outcome was survival had upregulated risk gene expression and downregulated protective gene expression. This trend was more pronounced in patients with a clinical outcome of death.
Delong’s test was used to test the prediction accuracy of independent DEMGs, and the results were visualized with the pROC package. The area under the ROC curve range (AUC) ranged from 0.5 to 1. The closer the AUC is to 1, the higher the detection accuracy. Conversely, an AUC equal to 0.5 suggests low accuracy of detection. The selected DEMGs all had high accuracy and could predict ccRCC outcomes (Figure 8).
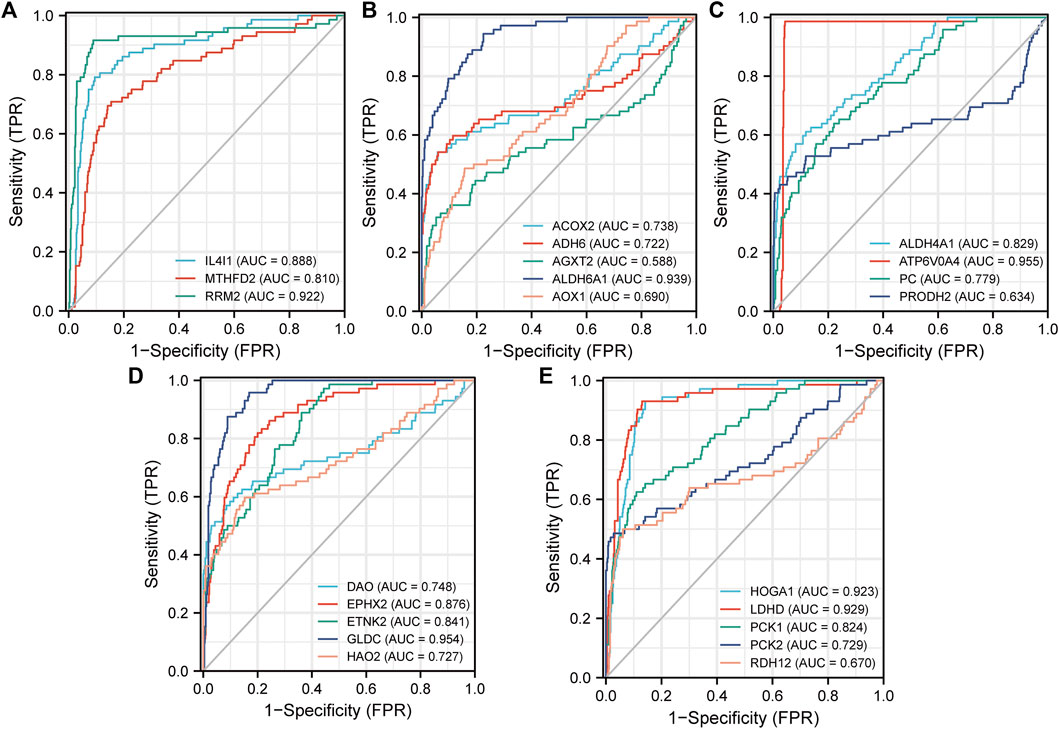
FIGURE 8. ROC curves for the 3 upregulated risk genes (A) and the 19 downregulated protective genes (B)–(E). Construction and Evaluation of the MRSS Prognostic Value.
Lasso Cox regression analysis was performed to test whether the screened DEMGs could serve as a prognostic biomarker for ccRCC (Figures 9A,B). The model achieves the best prediction when 7 is chosen as the penalty coefficient (Figure 9C) (Supplementary Tables S7, S8). We also performed multivariate Cox regression analysis on the 7 metabolism genes, which were still able to enter the equation as a prognostic predictor (Supplementary Table S9). The corresponding regression coefficients of 7 metabolic genes, MTHFD2, RRM2, AGXT2, ALDH6A1, GLDC, HOGA1, and ETNK2 were 0.075, 0.323, - 0.057, - 0.350, - 0.138, - 0.018 and -0.006, respectively (Figure 9D). The formula of the established MRSS was as follows:
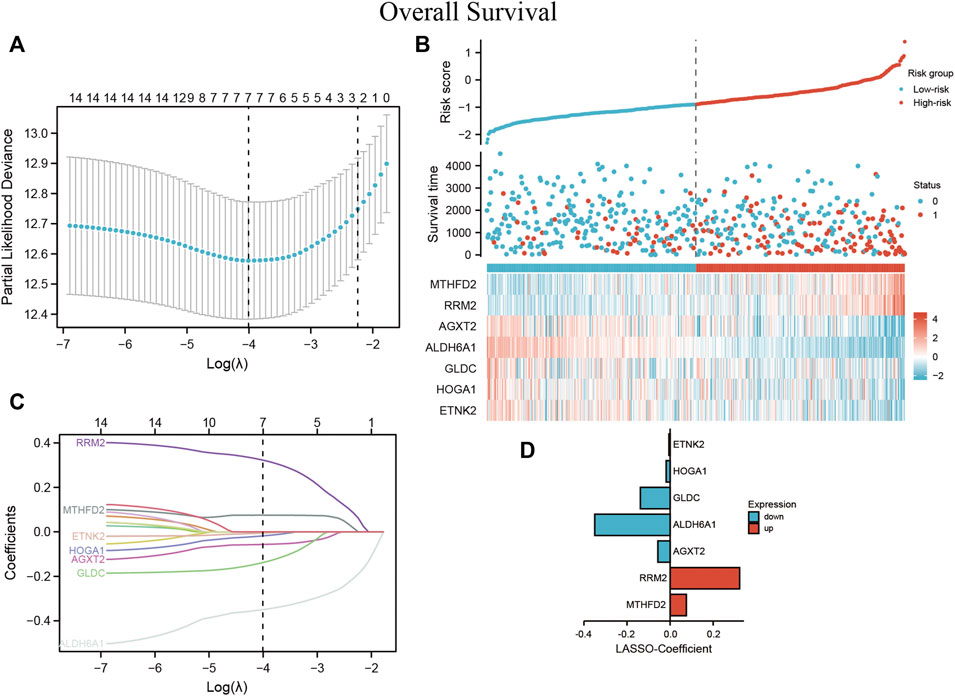
FIGURE 9. MRSS built using ccRCC patient data (A) Optimization of the model parameters by 10-fold cross-validation. (B) The risk score, survival status, and heatmap of 7 DEMGs in the TCGA-KIRC patient cohorts (C) Lasso coefficient profiles of the 16 DEMGs from the survival analysis and (D) coefficient value barplot of each model gene.
3.3 The Value of MRSS in Predicting Clinical Characteristics
Based on the MRSS formula, the risk score of each patient in the TCGA-KIRC cohort was collected, and the patients were subsequently divided into high-risk and low-risk groups based on the median score. Results from the KM survival curve for the prognosis of patients in the high-risk group performed worse than those in the low-risk group (Figure 10A). ROC curves were plotted to evaluate the ability of the established models to predict patient outcomes at 1, 3, and 5 years and the AUC values were 0.716, 0.681, and 0.691, respectively, indicating that the established models were able to predict patient outcomes (Figure 10B).
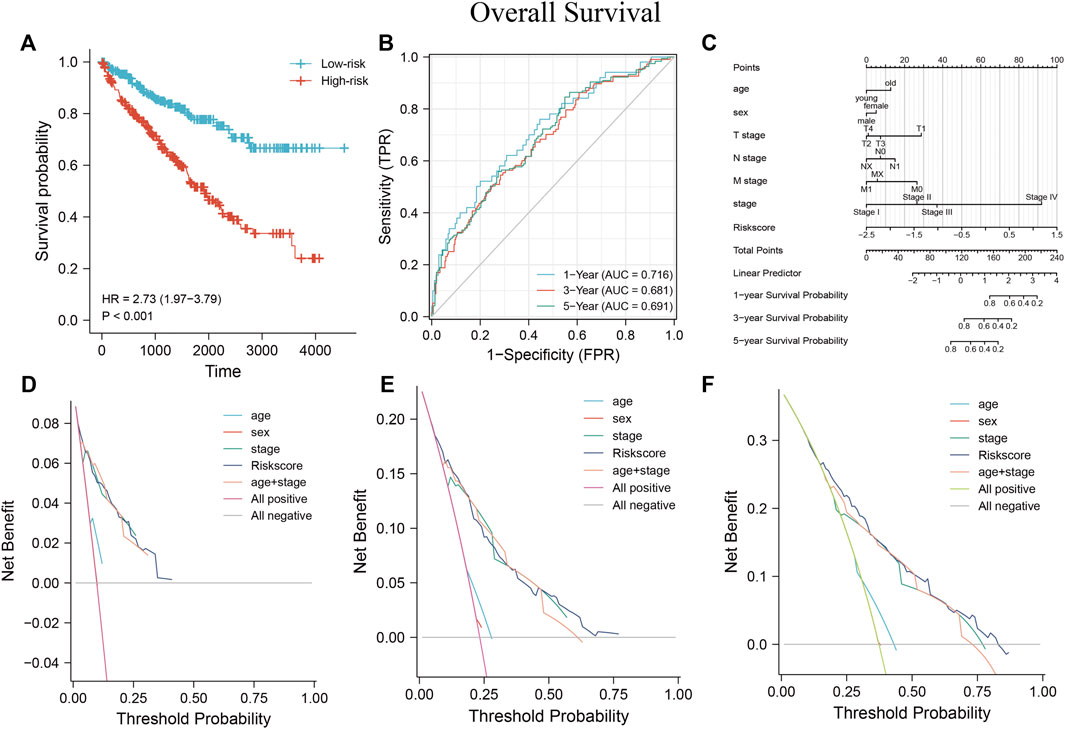
FIGURE 10. Establishment of MRSS and assessment of its predictive value using nomograms (A) OS survival curves were significantly different between the high- and low-risk groups in the TCGA-KIRC dataset. (B) Time-dependent ROC curves showed that MRSS predicted patients 1 -, 3 - and 5-years OS with sufficient accuracy (C) Nomogram for predicting patient outcome in the TCGA-KIRC cohort incorporating multiple clinicopathologic factors. DCA curves to examine the clinical application of MRSS, nomogram, and independent clinicopathological factors at 1- (D), 3- (E), and 5-years (F).
Univariate and multivariate Cox regression analyses determined whether the established MRSS had prognostic significance. The univariate Cox regression analysis showed that risk scores, TNM stage, cancer stage, and serum calcium concentration may be reliable prognostic indicators. Furthermore, the risk score was the only significant predictor in the multivariate Cox regression analysis. These results suggested that the established MRSS model could be a valuable biomarker for predicting ccRCC outcomes (Table 2).
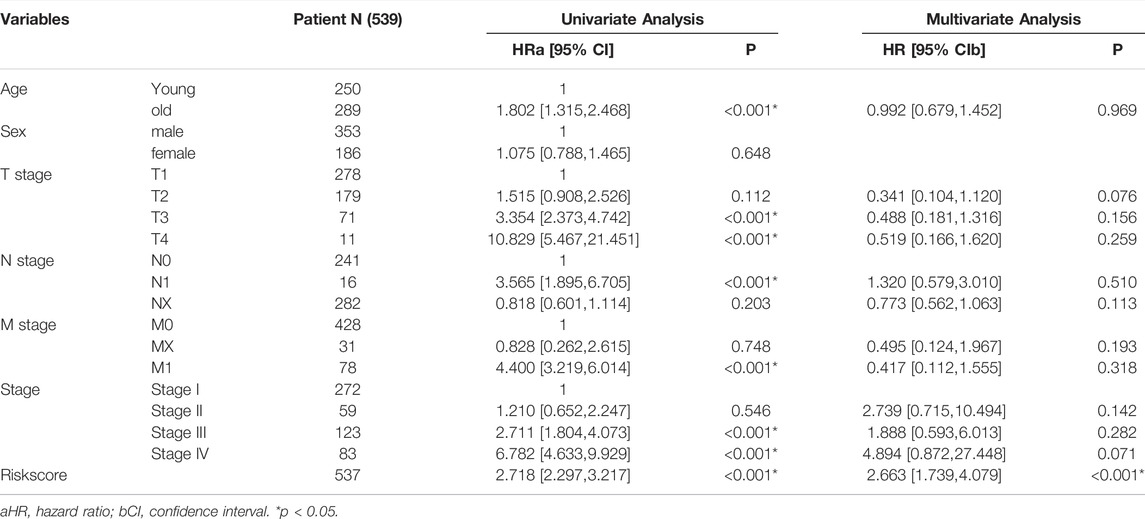
TABLE 2. Univariate and multivariate Cox regression analysis of clinicopathological factors associated with OS of ccRCC patients.
The nomogram is a standard clinical tool to evaluate patient prognosis, combining different prognostic factors and variables to comprehensively assess the probability of clinical events within a certain period. Compared with traditional disease staging, the user-friendly nomogram brings higher accuracy and is more accessible to understand prognoses by digitizing various factors and simple calculations (Balachandran et al., 2015). Several factors showed prognostic correlation, so a nomogram containing a variety of pathological factors was established, including the MRSS model. The nomogram (Figure 10C) showed that many prognostic factors were digitally assigned, and ccRCC patient outcomes could be reliably predicted by calculating the score.
The consistency index (c-index) refers to the proportion of all patient pairs whose predicted results are consistent with actual observations. The c-index was used to evaluate the predictive ability of various characteristics. The nomogram c-index that combined multiple clinicopathological factors was the highest at 0.771 and slightly weaker at MRSS, with a c-index of 0.769 compared with 0.755 in the conventional TNM stage c-index (Table 3). As a result, the model outperformed conventional TNM stage prediction but was weaker than the comprehensive nomogram. Consistent with the c-index, the nomogram that incorporated multiple clinicopathological factors performed best in the DCA curve (Figures 10D–F).
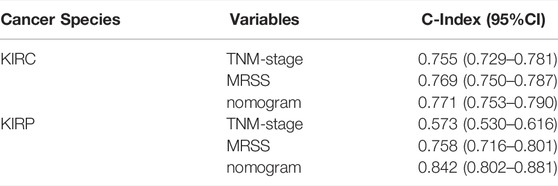
TABLE 3. C-index.
3.4 Validation of Other Kidney Cancer Species
According to the WHO classification of urinary cancers, ccRCC, characterized by malignant tumors composed of clear or eosinophilic cytoplasmic cells, is the largest pathological renal cancer subtype, accounting for 60–85% of cases. The second most common RCC is pRCC, which originates from tubular epithelial cells and accounts for 18.5% of reported RCC cases.
The model in this study was validated using representative pRCC and clinical data from the TCGA-KIRP cohort. A risk score was calculated for each patient in the TCGA-KIRP cohort using the previously established MRSS formula. The cohort was divided into high- and low-risk groups based on the median patient risk score.
Survival analysis showed that the low-risk group had a better prognosis than the high-risk group (Figure 11A) (p = 0.001; HR = 2.84, 95% CI = 1.50–5.38). Time-dependent ROC analysis curves showed good agreement between the actual OS of the model built-in patients in predicting OS (Figure 11B, 0.828, 0.743, and 0.707 in 1, 3, and 5 years, respectively). A predictive nomogram was developed using standard clinical features and MRSS for predicting the likelihood of 1, 3, and 5-years prognostic survival in patients with pRCC (Figure 11C). The calibration curve showed that the predictive effect of the model on patient survival outcomes fitted well with the actual observation (Figure 11D). C-index and DCA curve results consistently revealed that the predictive effect of MRSS on the prognostic survival probability of pRCC was better than that of conventional TNM staging, and the nomogram had the best predictive effect (Figures 11E–G).
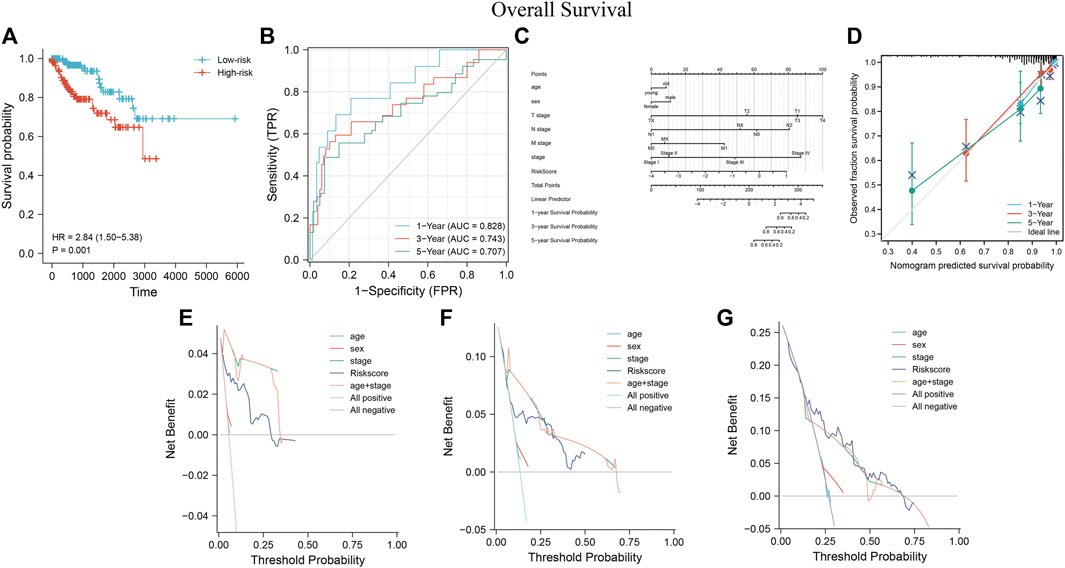
FIGURE 11. The predictive performance of MRSS using the TCGA-KIRP cohort (A) OS survival curves show that the low-risk group has better prognostic outcomes than the high-risk group. (B) Time-dependent ROC curve analysis of MRSS at 1, 3, and 5 years (C) Nomogram used to predict 1-, 3-, and 5-years survival probabilities for patients in the TCGA-KIRP cohort. (D) Calibration curves were used to evaluate the fitting effect of the nomogram on the prediction of patient survival probability at 1, 3, and 5 years with the actual outcomes. DCA curve of the nomogram, MRSS, and pathology-based tumor staging to evaluate the survival prediction of patients in the TCGA-KIRP cohort at 1(E), 3(F), and 5(G) years.
To further investigate the prognostic value of the established model, GENT2 (Figure 12A) and CPTAC (Figure 12B) databases were used to examine the expression of each gene in the MRSS model at the transcription and protein levels; we also tested transcript levels in cultured cells (Figure 12C). Consistent with the TCGA database, the respective genes composing MRSS maintained similar transcription and protein expression. The GEPIA database (Supplementary Figure S3A) and Kaplan-Meier plot (Supplementary Figure S3B) results showed that the expression of each gene in MRSS was highly correlated with the prognosis of ccRCC patients, and the respective independent genes could serve as potential biomarkers.
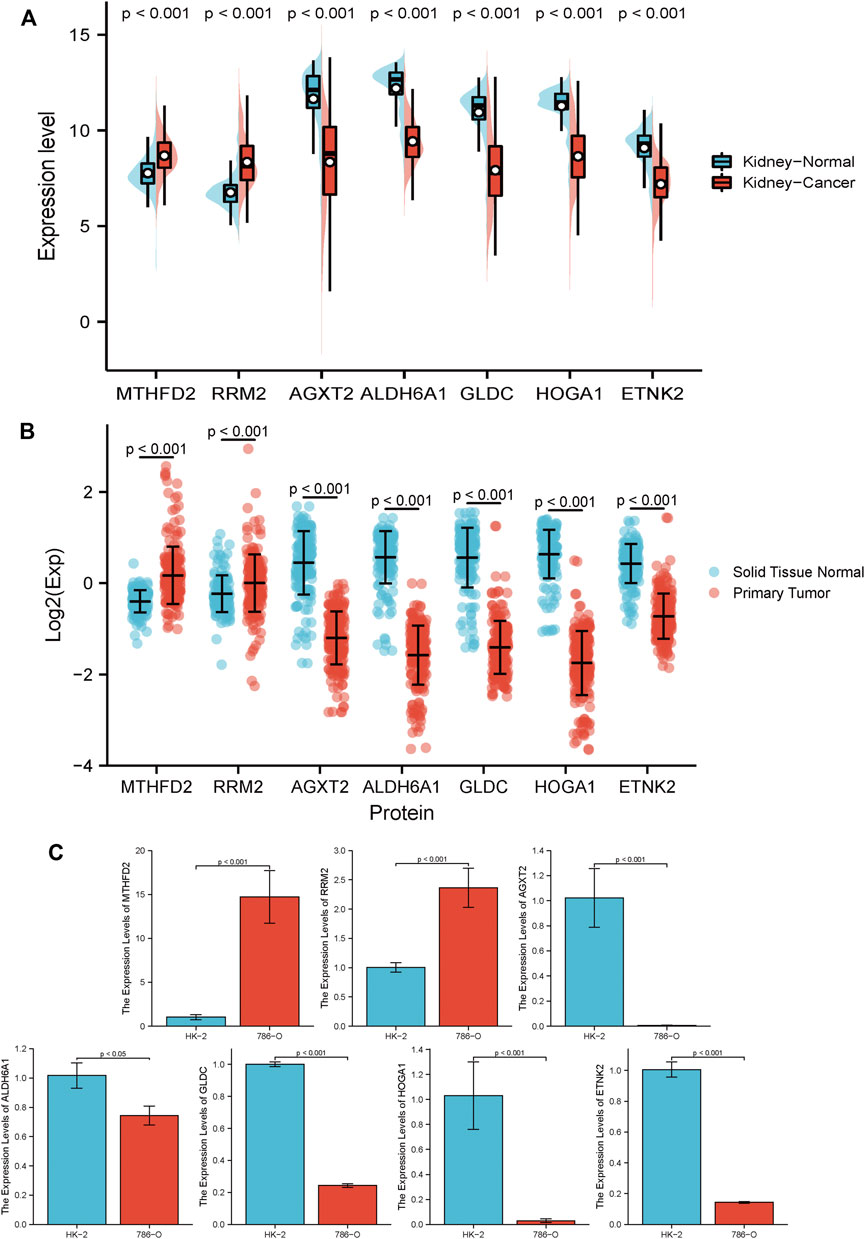
FIGURE 12. RCC biomarker expression at the transcript and protein level (A) 7 independent biomarkers had different transcript expressions in tumor and normal tissues. (B) 7 independent biomarkers had different protein expression in tumor and normal tissues. (C) 2 risky genes, RRM2 and MTHFD2, significantly increased in 786-O cells compared with HK-2 cells at the transcript level. The remaining 5 protective genes, AGXT2, ALDH6A1, GLDC, HOGA1, and ETNK2, were significantly down-regulated in 786-O cells compared to HK-2 cells at the transcript level. All results are expressed as mean ± SD, n = 6 per group.
4 Discussion
RCC, also known as renal adenocarcinoma, is a highly malignant tumor in the urinary system that accounts for 80–90% of malignant renal tumors. This disease has a high degree of heterogeneity, because it is associated with mild symptoms in its early stages and is thus usually diagnosed and treated once it has advanced (Hsieh et al., 2017; Motzer et al., 2022). Kidney cancer is the third most common cancer of the genitourinary system, second only to prostate and bladder cancer, accounting for 2–3% of malignant tumors in adults (MacLennan et al., 2012). The incidence and mortality of RCC are rising each year, drawing worldwide attention (Mokdad et al., 2017).
Past studies have explored the molecular mechanisms of common RCC subtypes such as ccRCC and pRCC. The findings suggest that genes associated with kidney cancer, including VHL, MET, FH, FLCN, TSC1, TSC2, and SDH, are involved in metabolic pathways linked to oxygen and iron or nutrient sensing, thus characterizing kidney cancer as a cellular metabolic disease (Linehan et al., 2010). Indeed, the carcinogenic process of ccRCC, the primary subtype of RCC, is closely related to metabolism. A hallmark of ccRCC is metabolic remodeling, including stabilization of HIF1/2 transcription factors resulting from VHL mutations, which create pseudohypoxia, increase glycolysis and angiogenic growth factor secretion, and elevate expression of proteins, including CCND1, PDK1, LDH, and GLUT1, that are associated with glucose metabolism regulation and cell proliferation (Linehan et al., 2010; Linehan et al., 2019; Xiao et al., 2020).
More patients show no significant prognostic improvement following applied tumor immunotherapy, suggesting that reliable biomarkers for predicting treatment outcomes should remain a significant focus of oncology research efforts (Motzer et al., 2018; Motzer et al., 2019; Rini et al., 2019; Braun et al., 2021). The current study aims to establish reliable biomarkers associated with metabolism to effectively predict the prognostic outcome of ccRCC patients. The role of metabolism-related genes in the development and metastasis of ccRCC was used to construct a prediction model by analyzing and validating it using the TCGA-KIRP cohort and external datasets. Since the two pathological subtypes, ccRCC, and pRCC, account for more than 90% of RCC case reports, they were used to assess the efficacy of the established prediction model in RCC.
Human-derived genes using metabolic terms were downloaded from the KEGG database, and the GSE66272 dataset was downloaded from GEO. Since the GEO dataset has pre- and post-tumor metastasis subsets, we separated these into the GSE66270 and GSE66271 datasets to find DEGs. These genes were intersected to obtain differentially expressed before and after metastasis. The DEGs were crossed with metabolism-related genes to obtain DEMGs before and after tumor metastasis. GO and KEGG pathway enrichment analysis results showed that DEMGs were associated with multiple metabolism-related biological processes and pathways. The TCGA-KIRC cohort was then selected as the data cohort to elucidate the correlation between metabolism and ccRCC. Using univariate Cox regression analysis on the DEMGs, the HRs of DEMGs for ccRCC were obtained. Of these, upregulated risk genes and downregulated protective genes were selected to coincide with tumor progression.
The prognosis-related ROC curves of each gene were plotted to assess the relationship between prognosis-relevant DEMGs and the OS, DSS, and PFI by KM patient survival curves. The prognosis-related DEMGs were selected for further model construction. MRSS predictive prognosis was developed using Lasso-Cox regression analysis of the selected genes. These included the RRM2 gene, which encodes a ribonucleotide reductase subunit and provides raw materials for DNA synthesis. Deregulated cell proliferation dramatically increases DNA replication in cancer cells, increasing the demand for raw materials needed for DNA synthesis. Studies indicate that RRM2 is involved in cytogenetic material synthesis and promotes the growth and metastasis of various cancers (Dawany et al., 2011; Das et al., 2021). In contrast, silencing RRM2 gene expression induced cell cycle arrest and inhibited cell proliferation (Yang et al., 2017). Moreover, RRM2 promoted RCC cell acquired resistance to VEGF tyrosine kinase inhibitors, inhibiting the effect of PD-1 blocker immunotherapy (Xiong et al., 2021).
MTHFD2 encodes a bifunctional methylenetetrahydrofolate dehydrogenase/cyclohydrolase, a mitochondrial enzyme that participates in one-carbon metabolism, and studies indicate that in RCC, MTHFD2 can remodel metabolism through RNA methylation. In contrast, knockdown of MTHFD2 expression reduced xenograft tumor growth (Green et al., 2019). This may be associated with modulation of the NADPH to NADP ratio in cancer cells, depleting GSH, and triggering cancer cell apoptosis (Yang et al., 2022). MTHFD2 is also a metabolic checkpoint linking purine metabolism to autoimmune responses (Sugiura et al., 2022). It is highly expressed in various cancers, playing a role in metabolic remodeling and regulating of the cell cycle in the mitochondria and nucleus, respectively (Lee et al., 2021b; Liu et al., 2021; Yao et al., 2021; Ren et al., 2022).
AGXT2 is a multifunctional mitochondrial aminotransferase with diverse cellular physiological functions predominantly expressed in kidney cells and hepatocytes. Its substrates are biomarkers for renal, cardiovascular, and metabolic diseases (Rodionov et al., 2014; Ye et al., 2021).
ETNK2 is an ethanolamine kinase that has enhanced expression in gastric, non-small cell lung, and prostate cancers (Miwa et al., 2021). ETNK2 promotes liver metastasis of gastric cancer by inhibiting the p53-Bcl2 apoptotic pathway, resulting in a poor prognosis. Phosphatidylethanolamine synthesis in non-small cell lung cancer is significantly enhanced by ETNK2, whereas reduced ETNK2 expression in prostate cancer results from the loss of TET2 targeted demethylation (Kamdar et al., 2019; Lesko et al., 2021).
HOGA1 encodes the mitochondrial 4-hydroxy-2-oxoglutarate aldolase, and mutations cause oxalate accumulation in the kidney and primary hyperoxaluria type 3 (Ventzke et al., 2017).
GLDC primarily regulates glycine metabolism and is an essential metabolic enzyme for protein and amino acid metabolism. GLDC also promotes non-small cell lung cancer progression by inducing glycolysis with pyrimidine metabolism. GLDC inhibition impairs pyruvate metabolism in cancer cells, resulting in loss of their metabolic energy source (Zhang et al., 2012; Woo et al., 2018). GLDC upregulation induces autophagy in HCC cells and inhibits liver cancer metastasis. High GLDC expression in neuroblastoma cells prevents the accumulation of toxic metabolites. In contrast, GLDC inhibition in glioblastoma causes an accumulation of glycine and results in reduced cell viability, indicating that glycine catabolism by GLDC is critical for proliferation and tumorigenesis (Alptekin et al., 2019; Abdollahi et al., 2021). However, GLDC was significantly decreased in ccRCC, while overexpression suppressed the proliferation and migration of tumor cells (Chen et al., 2020).
Previous studies indicate that the ALDH6A1 gene is related to the aldehyde dehydrogenase family of proteins, and the mitochondrial methylmalonate semialdehyde dehydrogenase encoded by ALDH6A1 functions in the valine and pyrimidine catabolic pathways. There is an inverse correlation between ALDH6A1 expression and both RCC progression and patient outcomes (Perroud et al., 2009). A similar trend was reported during collecting duct cancer and the progression of liver cancer (Wach et al., 2019; Shin et al., 2020). Studies have also shown that ALDH6A1 was positively expressed in breast cancer stem cells, and gradually decreased during tumor progression (Johansson et al., 2015; Xu et al., 2021). These results indicate that the same trends occur in the progression of different cancer types, suggesting that ALDH6A1 may be involved in tumor initiation and progression.
PRCC is the second most common RCC subtype, histologically resembling ccRCC in anatomic location and sharing many similar oncogenic factors (Guimarães-Teixeira et al., 2021; Tian et al., 2021; Weng et al., 2021). As a result of possible similarities in anatomical location, causative factors, and histological type, TCGA-KIRP data was used as a validation cohort to evaluate the predictive value of MRSS.
Results of the survival analysis were used to divide patients into a high-risk and low-risk group based on the median risk score calculated by MRSS. There was a significant difference in the OS of the two groups of patients, indicating that MRSS may have the potential to become an effective biomarker for predicting ccRCC and pRCC outcomes. Furthermore, the ROC curve drawn by Delong’s test results indicated that the model was in good agreement with the observed patient prognosis. The nomogram with age, gender, pathological stage, and TNM stage as covariates showed that the established model remained a reasonable independent predictor. To better decipher the power of the model in predicting disease outcomes, nomograms that combined multiple clinical variables were developed to score the survival probability of each patient. DCA curve and c-index results showed that MRSS had a higher predictive accuracy than traditional TNM staging for this outcome. However, nomograms that integrated multiple clinical variables still performed best. Interestingly, the MRSS constructed as a biomarker could reliably predict ccRCC and pRCC patient outcomes, indicating that the model was robust and broadly applicable. These findings may expand the horizons of RCC treatment.
In RCC and other carcinoma research, biomarkers for predicting outcomes have become widely used (Huang et al., 2016; Mo et al., 2018; Qu et al., 2018; Wei et al., 2019). At the time of preparation of this manuscript, the existing literature had established and published studies on metabolic risk models for ccRCC (Liu et al., 2020; Guo et al., 2021). The number of metabolic genes associated with prognosis was different from those shown here due to varying screening criteria. However, however, the RRM2 and ALDH6A1 genes were included in the results, indicating that the model was reliable and robust.
This study explored a potential association between metabolism and ccRCC. The predictive effect of the established biomarkers based on the seven metabolic genes was verified as reliable and stable for patients with ccRCC and pRCC. The established model could serve as an independent prognostic biomarker, provide potential therapeutic targets for the clinical treatment of RCC, including ccRCC and pRCC, and add a dimension for correlation studies.
Data Availability Statement
The datasets presented in this study can be found in online repositories. The names of the repository/repositories and accession number(s) can be found below: https://www.ncbi.nlm.nih.gov/geo/, GSE66270; https://www.ncbi.nlm.nih.gov/geo/, GSE66271; https://portal.gdc.cancer.gov/projects/TCGA-KIRC, TCGA-KIRC; https://portal.gdc.cancer.gov/projects/TCGA-KIRP, TCGA-KIRP; https://proteomic.datacommons.cancer.gov/pdc/study/PDC000127, PDC000127.
Author Contributions
SH and QL contributed equally to this work and should be considered co-first authors. SH and QL conceived the idea of this research and co-authored this article; JH, JW, and SW collected the necessary experimental data for this research and provided reference data processing methods for this research. CH and PQ reviewed this paper and gave guidance, and the project chaired by CL funded this research.
Funding
This work was funded by the National Natural Science Foundation of China (82074304, 81673839).
Conflict of Interest
The authors declare that the research was conducted in the absence of any commercial or financial relationships that could be construed as a potential conflict of interest.
Publisher’s Note
All claims expressed in this article are solely those of the authors and do not necessarily represent those of their affiliated organizations, or those of the publisher, the editors and the reviewers. Any product that may be evaluated in this article, or claim that may be made by its manufacturer, is not guaranteed or endorsed by the publisher.
Supplementary Material
The Supplementary Material for this article can be found online at: https://www.frontiersin.org/articles/10.3389/fgene.2022.902064/full#supplementary-material
References
Abdollahi, P., Vandsemb, E. N., Elsaadi, S., Røst, L. M., Yang, R., Hjort, M. A., et al. (2021). Phosphatase of Regenerating Liver-3 Regulates Cancer Cell Metabolism in Multiple Myeloma. FASEB J. 35 (3), e21344. doi:10.1096/fj.202001920RR
Alptekin, A., Ye, B., Yu, Y., Poole, C. J., van Riggelen, J., Zha, Y., et al. (2019). Glycine Decarboxylase Is a Transcriptional Target of MYCN Required for Neuroblastoma Cell Proliferation and Tumorigenicity. Oncogene 38 (50), 7504–7520. doi:10.1038/s41388-019-0967-3
Bacigalupa, Z. A., and Rathmell, W. K. (2020). Beyond Glycolysis: Hypoxia Signaling as a Master Regulator of Alternative Metabolic Pathways and the Implications in Clear Cell Renal Cell Carcinoma. Cancer Lett. 489, 19–28. doi:10.1016/j.canlet.2020.05.034
Balachandran, V. P., Gonen, M., Smith, J. J., and DeMatteo, R. P. (2015). Nomograms in Oncology: More Than Meets the Eye. Lancet Oncol. 16 (4), e173–e180. doi:10.1016/s1470-2045(14)71116-7
Barrett, T., Wilhite, S. E., Ledoux, P., Evangelista, C., Kim, I. F., Tomashevsky, M., et al. (2013). NCBI GEO: Archive for Functional Genomics Data Sets-Uupdate. Nucleic Acids Res. 41 (Database issue), D991–D995. doi:10.1093/nar/gks1193
Bedke, J., Albiges, L., Capitanio, U., Giles, R. H., Hora, M., Lam, T. B., et al. (2021). The 2021 Updated European Association of Urology Guidelines on Renal Cell Carcinoma: Immune Checkpoint Inhibitor-Based Combination Therapies for Treatment-Naive Metastatic Clear-cell Renal Cell Carcinoma Are Standard of Care. Eur. Urol. 80 (4), 393–397. doi:10.1016/j.eururo.2021.04.042
Bobulescu, I. A., Pop, L. M., Mani, C., Turner, K., Rivera, C., Khatoon, S., et al. (2021). Renal Lipid Metabolism Abnormalities in Obesity and Clear Cell Renal Cell Carcinoma. Metabolites 11 (9). doi:10.3390/metabo11090608
Braun, D. A., Bakouny, Z., Hirsch, L., Flippot, R., Van Allen, E. M., Wu, C. J., et al. (2021). Beyond Conventional Immune-Checkpoint Inhibition - Novel Immunotherapies for Renal Cell Carcinoma. Nat. Rev. Clin. Oncol. 18 (4), 199–214. doi:10.1038/s41571-020-00455-z
Carlson, M. org.Hs.eg.db: Genome Wide Annotation for Human. 2019.
Chen, Y., Gu, D., Wen, Y., Yang, S., Duan, X., Lai, Y., et al. (2020). Identifying the Novel Key Genes in Renal Cell Carcinoma by Bioinformatics Analysis and Cell Experiments. Cancer Cell. Int. 20, 331. doi:10.1186/s12935-020-01405-6
Das, B., Jain, N., and Mallick, B. (2021). piR-39980 Mediates Doxorubicin Resistance in Fibrosarcoma by Regulating Drug Accumulation and DNA Repair. Commun. Biol. 4 (1), 1312. doi:10.1038/s42003-021-02844-1
Dawany, N. B., Dampier, W. N., and Tozeren, A. (2011). Large-scale Integration of Microarray Data Reveals Genes and Pathways Common to Multiple Cancer Types. Int. J. Cancer 128 (12), 2881–2891. doi:10.1002/ijc.25854
Doppalapudi, S. K., Leopold, Z. R., Thaper, A., Kaldany, A., Chua, K., Patel, H. V., et al. (2021). Clearing up Clear Cell: Clarifying the Immuno-Oncology Treatment Landscape for Metastatic Clear Cell RCC. Cancers (Basel) 13 (16). doi:10.3390/cancers13164140
Edwards, N. J., Oberti, M., Thangudu, R. R., Cai, S., McGarvey, P. B., Jacob, S., et al. (2015). The CPTAC Data Portal: A Resource for Cancer Proteomics Research. J. Proteome Res. 14 (6), 2707–2713. doi:10.1021/pr501254j
Elias, R., Tcheuyap, V. T., Kaushik, A. K., Singla, N., Gao, M., Reig Torras, O., et al. (2021). A Renal Cell Carcinoma Tumorgraft Platform to Advance Precision Medicine. Cell. Rep. 37 (8), 110055. doi:10.1016/j.celrep.2021.110055
Fang, Z., Sun, Q., Yang, H., and Zheng, J. (2021). SDHB Suppresses the Tumorigenesis and Development of ccRCC by Inhibiting Glycolysis. Front. Oncol. 11, 639408. doi:10.3389/fonc.2021.639408
Global Burden of Disease Cancer Kocarnik, J. M., Compton, K., Dean, F. E., Fu, W., Gaw, B. L., et al. (2022). Cancer Incidence, Mortality, Years of Life Lost, Years Lived with Disability, and Disability-Adjusted Life Years for 29 Cancer Groups from 2010 to 2019: A Systematic Analysis for the Global Burden of Disease Study 2019. JAMA Oncol. 8 (3), 420–444. doi:10.1001/jamaoncol.2021.6987
Green, N. H., Galvan, D. L., Badal, S. S., Chang, B. H., LeBleu, V. S., Long, J., et al. (2019). MTHFD2 Links RNA Methylation to Metabolic Reprogramming in Renal Cell Carcinoma. Oncogene 38 (34), 6211–6225. doi:10.1038/s41388-019-0869-4
Guimarães-Teixeira, C., Barros-Silva, D., Lobo, J., Soares-Fernandes, D., Constâncio, V., Leite-Silva, P., et al. (2021). Deregulation of N6-Methyladenosine RNA Modification and its Erasers FTO/ALKBH5 Among the Main Renal Cell Tumor Subtypes. J. Pers. Med. 11 (10). doi:10.3390/jpm11100996
Guo, X., Sun, Z., Jiang, S., Jin, X., and Wang, H. (2021). Identification and Validation of a Two-Gene Metabolic Signature for Survival Prediction in Patients with Kidney Renal Clear Cell Carcinoma. Aging 13 (6), 8276–8289. doi:10.18632/aging.202636
Hakimi, A. A., Reznik, E., Lee, C.-H., Creighton, C. J., Brannon, A. R., Luna, A., et al. (2016). An Integrated Metabolic Atlas of Clear Cell Renal Cell Carcinoma. Cancer Cell. 29 (1), 104–116. doi:10.1016/j.ccell.2015.12.004
Harrell, F. E. (2020). Rms: R Functions for Biostatistical/epidemiologic Modeling, Testing, Estimation, Validation, Graphics, Prediction, and Typesetting by Storing Enhanced Model Design Attributes in the Fit. [Available from: https://hbiostat.org/R/rms.
Hsieh, J. J., Purdue, M. P., Signoretti, S., Swanton, C., Albiges, L., Schmidinger, M., et al. (2017). Renal Cell Carcinoma. Nat. Rev. Dis. Prim. 3, 17009. doi:10.1038/nrdp.2017.9
Huang, J., Zhao, X., Li, X., Peng, J., Yang, W., and Mi, S. (2021). HMGCR Inhibition Stabilizes the Glycolytic Enzyme PKM2 to Support the Growth of Renal Cell Carcinoma. PLoS Biol. 19 (4), e3001197. doi:10.1371/journal.pbio.3001197
Huang, Y.-q., Liang, C.-h., He, L., Tian, J., Liang, C.-s., Chen, X., et al. (2016). Development and Validation of a Radiomics Nomogram for Preoperative Prediction of Lymph Node Metastasis in Colorectal Cancer. Jco 34 (18), 2157–2164. doi:10.1200/jco.2015.65.9128
Ince, W., and Eisen, T. (2021). Combination Therapies in Clinical Trials for Renal Cell Carcinoma: How Could They Impact Future Treatments? Expert Opin. Investigational Drugs 30 (12), 1221–1229. doi:10.1080/13543784.2021.2014814
Johansson, H. J., Sanchez, B. C., Forshed, J., Stål, O., Fohlin, H., Lewensohn, R., et al. (2015). Proteomics Profiling Identify CAPS as a Potential Predictive Marker of Tamoxifen Resistance in Estrogen Receptor Positive Breast Cancer. Clin. Proteom 12 (1), 8. doi:10.1186/s12014-015-9080-y
Jonasch, E., Walker, C. L., and Rathmell, W. K. (2021). Clear Cell Renal Cell Carcinoma Ontogeny and Mechanisms of Lethality. Nat. Rev. Nephrol. 17 (4), 245–261. doi:10.1038/s41581-020-00359-2
Kabaria, R., Klaassen, Z., and Terris, M. K. (2016). Renal Cell Carcinoma: Links and Risks. Int. J. Nephrol. Renov. Dis. 9, 45–52. doi:10.2147/IJNRD.S75916
Kamdar, S., Isserlin, R., Van der Kwast, T., Zlotta, A. R., Bader, G. D., Fleshner, N. E., et al. (2019). Exploring Targets of TET2-Mediated Methylation Reprogramming as Potential Discriminators of Prostate Cancer Progression. Clin. Epigenet 11 (1), 54. doi:10.1186/s13148-019-0651-z
Lánczky, A., and Győrffy, B. (2021). Web-Based Survival Analysis Tool Tailored for Medical Research (KMplot): Development and Implementation. J. Med. Internet Res. 23 (7), e27633. doi:10.2196/27633
Lee, L.-C., Peng, Y.-H., Chang, H.-H., Hsu, T., Lu, C.-T., Huang, C.-H., et al. (2021). Xanthine Derivatives Reveal an Allosteric Binding Site in Methylenetetrahydrofolate Dehydrogenase 2 (MTHFD2). J. Med. Chem. 64 (15), 11288–11301. doi:10.1021/acs.jmedchem.1c00663
Lee, S. H., Park, J. S., Kim, H., Kim, D., Lee, S. H., Ham, W. S., et al. (2021). Glycolysis on F-18 FDG PET/CT Is Superior to Amino Acid Metabolism on C-11 Methionine PET/CT in Identifying Advanced Renal Cell Carcinoma at Staging. Cancers (Basel) 13 (10). doi:10.3390/cancers13102381
Lesko, J., Triebl, A., Stacher-Priehse, E., Fink-Neuböck, N., Lindenmann, J., Smolle-Jüttner, F.-M., et al. (2021). Phospholipid Dynamics in Ex Vivo Lung Cancer and Normal Lung Explants. Exp. Mol. Med. 53 (1), 81–90. doi:10.1038/s12276-020-00547-x
Li, B., Qiu, B., Lee, D. S. M., Walton, Z. E., Ochocki, J. D., Mathew, L. K., et al. (2014). Fructose-1,6-bisphosphatase Opposes Renal Carcinoma Progression. Nature 513 (7517), 251–255. doi:10.1038/nature13557
Linehan, W. M., Schmidt, L. S., Crooks, D. R., Wei, D., Srinivasan, R., Lang, M., et al. (2019). The Metabolic Basis of Kidney Cancer. Cancer Discov. 9 (8), 1006–1021. doi:10.1158/2159-8290.cd-18-1354
Linehan, W. M., Srinivasan, R., and Schmidt, L. S. (2010). The Genetic Basis of Kidney Cancer: a Metabolic Disease. Nat. Rev. Urol. 7 (5), 277–285. doi:10.1038/nrurol.2010.47
Liu, M., Pan, Q., Xiao, R., Yu, Y., Lu, W., and Wang, L. (2020). A Cluster of Metabolism-Related Genes Predict Prognosis and Progression of Clear Cell Renal Cell Carcinoma. Sci. Rep. 10 (1), 12949. doi:10.1038/s41598-020-67760-6
Liu, X., Liu, S., Piao, C., Zhang, Z., Zhang, X., Jiang, Y., et al. (2021). Non‐metabolic Function of MTHFD2 Activates CDK2 in Bladder Cancer. Cancer Sci. 112 (12), 4909–4919. doi:10.1111/cas.15159
MacLennan, S., Imamura, M., Lapitan, M. C., Omar, M. I., Lam, T. B. L., Hilvano-Cabungcal, A. M., et al. (2012). Systematic Review of Oncological Outcomes Following Surgical Management of Localised Renal Cancer. Eur. Urol. 61 (5), 972–993. doi:10.1016/j.eururo.2012.02.039
Miwa, T., Kanda, M., Shimizu, D., Umeda, S., Sawaki, K., Tanaka, H., et al. (2021). Hepatic Metastasis of Gastric Cancer Is Associated with Enhanced Expression of Ethanolamine Kinase 2 via the P53-Bcl-2 Intrinsic Apoptosis Pathway. Br. J. Cancer 124 (8), 1449–1460. doi:10.1038/s41416-021-01271-7
Mo, F., Lin, D., Takhar, M., Ramnarine, V. R., Dong, X., Bell, R. H., et al. (2018). Stromal Gene Expression Is Predictive for Metastatic Primary Prostate Cancer. Eur. Urol. 73 (4), 524–532. doi:10.1016/j.eururo.2017.02.038
Mokdad, A. H., Dwyer-Lindgren, L., Fitzmaurice, C., Stubbs, R. W., Bertozzi-Villa, A., Morozoff, C., et al. (2017). Trends and Patterns of Disparities in Cancer Mortality Among US Counties, 1980-2014. JAMA 317 (4), 388–406. doi:10.1001/jama.2016.20324
Morrissey, S. M., Zhang, F., Ding, C., Montoya-Durango, D. E., Hu, X., Yang, C., et al. (2021). Tumor-derived Exosomes Drive Immunosuppressive Macrophages in a Pre-metastatic Niche through Glycolytic Dominant Metabolic Reprogramming. Cell. Metab. 33 (10), 2040–2058. doi:10.1016/j.cmet.2021.09.002
Motzer, R. J., Jonasch, E., Agarwal, N., Alva, A., Baine, M., Beckermann, K., et al. (2022). Kidney Cancer, Version 3.2022, NCCN Clinical Practice Guidelines in Oncology. J. Natl. Compr. Canc Netw. 20 (1), 71–90. doi:10.6004/jnccn.2022.0001
Motzer, R. J., Penkov, K., Haanen, J., Rini, B., Albiges, L., Campbell, M. T., et al. (2019). Avelumab Plus Axitinib versus Sunitinib for Advanced Renal-Cell Carcinoma. N. Engl. J. Med. 380 (12), 1103–1115. doi:10.1056/nejmoa1816047
Motzer, R. J., Tannir, N. M., McDermott, D. F., Arén Frontera, O., Melichar, B., Choueiri, T. K., et al. (2018). Nivolumab Plus Ipilimumab versus Sunitinib in Advanced Renal-Cell Carcinoma. N. Engl. J. Med. 378 (14), 1277–1290. doi:10.1056/nejmoa1712126
Park, S. J., Yoon, B. H., Kim, S. K., and Kim, S. Y. (2019). GENT2: an Updated Gene Expression Database for Normal and Tumor Tissues. BMC Med. Genomics 12 (Suppl. 5), 101. doi:10.1186/s12920-019-0514-7
Perroud, B., Ishimaru, T., Borowsky, A. D., and Weiss, R. H. (2009). Grade-dependent Proteomics Characterization of Kidney Cancer. Mol. Cell. Proteomics 8 (5), 971–985. doi:10.1074/mcp.m800252-mcp200
Qi, X., Li, Q., Che, X., Wang, Q., and Wu, G. (2021). The Uniqueness of Clear Cell Renal Cell Carcinoma: Summary of the Process and Abnormality of Glucose Metabolism and Lipid Metabolism in ccRCC. Front. Oncol. 11, 727778. doi:10.3389/fonc.2021.727778
Qu, L., Wang, Z.-l., Chen, Q., Li, Y.-m., He, H.-w., Hsieh, J. J., et al. (2018). Prognostic Value of a Long Non-coding RNA Signature in Localized Clear Cell Renal Cell Carcinoma. Eur. Urol. 74 (6), 756–763. doi:10.1016/j.eururo.2018.07.032
Reed, J. P., Posadas, E. M., and Figlin, R. A. (2019). Developments in the Use of Tyrosine Kinase Inhibitors in the Treatment of Renal Cell Carcinoma. Expert Rev. Anticancer Ther. 19 (3), 259–271. doi:10.1080/14737140.2019.1573678
Ren, X., Rong, Z., Liu, X., Gao, J., Xu, X., Zi, Y., et al. (2022). The Protein Kinase Activity of NME7 Activates Wnt/β-Catenin Signaling to Promote One-Carbon Metabolism in Hepatocellular Carcinoma. Cancer Res. 82 (1), 60–74. doi:10.1158/0008-5472.can-21-1020
Ricketts, C. J., De Cubas, A. A., Fan, H., Smith, C. C., Lang, M., Reznik, E., et al. (2018). The Cancer Genome Atlas Comprehensive Molecular Characterization of Renal Cell Carcinoma. Cell. Rep. 23 (12), 3698. doi:10.1016/j.celrep.2018.06.032
Rini, B. I., Plimack, E. R., Stus, V., Gafanov, R., Hawkins, R., Nosov, D., et al. (2019). Pembrolizumab Plus Axitinib versus Sunitinib for Advanced Renal-Cell Carcinoma. N. Engl. J. Med. 380 (12), 1116–1127. doi:10.1056/nejmoa1816714
Ritchie, M. E., Phipson, B., Wu, D., Hu, Y., Law, C. W., Shi, W., et al. (2015). Limma Powers Differential Expression Analyses for RNA-Sequencing and Microarray Studies. Nucleic Acids Res. 43 (7), e47. doi:10.1093/nar/gkv007
Robin, X., Turck, N., Hainard, A., Tiberti, N., Lisacek, F., Sanchez, J.-C., et al. (2011). pROC: an Open-Source Package for R and S+ to Analyze and Compare ROC Curves. BMC Bioinforma. 12, 77. doi:10.1186/1471-2105-12-77
Rodionov, R. N., Jarzebska, N., Weiss, N., and Lentz, S. R. (2014). AGXT2: a Promiscuous Aminotransferase. Trends Pharmacol. Sci. 35 (11), 575–582. doi:10.1016/j.tips.2014.09.005
Schmittgen, T. D., and Livak, K. J. (2008). Analyzing Real-Time PCR Data by the Comparative CT Method. Nat. Protoc. 3 (6), 1101–1108. doi:10.1038/nprot.2008.73
Schulz, S., Woerl, A.-C., Jungmann, F., Glasner, C., Stenzel, P., Strobl, S., et al. (2021). Multimodal Deep Learning for Prognosis Prediction in Renal Cancer. Front. Oncol. 11, 788740. doi:10.3389/fonc.2021.788740
Shin, H., Cha, H.-J., Lee, M. J., Na, K., Park, D., Kim, C.-Y., et al. (2020). Identification of ALDH6A1 as a Potential Molecular Signature in Hepatocellular Carcinoma via Quantitative Profiling of the Mitochondrial Proteome. J. Proteome Res. 19 (4), 1684–1695. doi:10.1021/acs.jproteome.9b00846
Strizova, Z., Bartunkova, J., and Smrz, D. (2019). The Challenges of Adoptive Cell Transfer in the Treatment of Human Renal Cell Carcinoma. Cancer Immunol. Immunother. 68 (11), 1831–1838. doi:10.1007/s00262-019-02359-z
Sugiura, A., Andrejeva, G., Voss, K., Heintzman, D. R., Xu, X., Madden, M. Z., et al. (2022). MTHFD2 Is a Metabolic Checkpoint Controlling Effector and Regulatory T Cell Fate and Function. Immunity 55 (1), 65–81. doi:10.1016/j.immuni.2021.10.011
Sung, H., Ferlay, J., Siegel, R. L., Laversanne, M., Soerjomataram, I., Jemal, A., et al. (2021). Global Cancer Statistics 2020: GLOBOCAN Estimates of Incidence and Mortality Worldwide for 36 Cancers in 185 Countries. CA A Cancer J. Clin. 71 (3), 209–249. doi:10.3322/caac.21660
Tang, Z., Li, C., Kang, B., Gao, G., Li, C., and Zhang, Z. (2017). GEPIA: a Web Server for Cancer and Normal Gene Expression Profiling and Interactive Analyses. Nucleic Acids Res. 45 (W1), W98–W102. doi:10.1093/nar/gkx247
Tariq, A., Kwok, M., Pearce, A., Rhee, H., Kyle, S., Marsh, P., et al. (2022). The Role of Dual Tracer PSMA and FDG PET/CT in Renal Cell Carcinoma (RCC) Compared to Conventional Imaging: A Multi-Institutional Case Series with Intra-individual Comparison. Urol. Oncol. 40 (2), 66–e9. doi:10.1016/j.urolonc.2021.11.006
Therneau, T. M. (2022). A Package for Survival Analysis in R. R package version 3.3-1. Available at: https://CRAN.R-project.org/package=survival.
Therneau, T. M., and Grambsch, P. M. (2000). Modeling Survival Data: Extending the Cox Model. New York, NY: Springer.
Tian, X., Xu, W.-H., Wu, J.-L., Gan, H.-L., Wang, H.-K., Gu, W.-J., et al. (2021). Clear Cell Papillary Renal Cell Carcinoma Shares Distinct Molecular Characteristics and May Be Significantly Associated with Higher Risk of Developing Second Primary Malignancy. Pathol. Oncol. Res. 27, 1609809. doi:10.3389/pore.2021.1609809
Turajlic, S., Swanton, C., and Boshoff, C. (2018). Kidney Cancer: The Next Decade. J. Exp. Med. 215 (10), 2477–2479. doi:10.1084/jem.20181617
Ventzke, A., Feldkötter, M., Wei, A., Becker, J., Beck, B. B., and Hoppe, B. (2017). Systematic Assessment of Urinary Hydroxy-Oxo-Glutarate for Diagnosis and Follow-Up of Primary Hyperoxaluria Type III. Pediatr. Nephrol. 32 (12), 2263–2271. doi:10.1007/s00467-017-3731-3
Wach, S., Taubert, H., Weigelt, K., Hase, N., Köhn, M., Misiak, D., et al. (2019). RNA Sequencing of Collecting Duct Renal Cell Carcinoma Suggests an Interaction between miRNA and Target Genes and a Predominance of Deregulated Solute Carrier Genes. Cancers (Basel) 12 (1). doi:10.3390/cancers12010064
Walter, W., Sánchez-Cabo, F., and Ricote, M. (2015). GOplot: an R Package for Visually Combining Expression Data with Functional Analysis: Fig. 1. Bioinformatics 31 (17), 2912–2914. doi:10.1093/bioinformatics/btv300
Wei, J.-H., Feng, Z.-H., Cao, Y., Zhao, H.-W., Chen, Z.-H., Liao, B., et al. (2019). Predictive Value of Single-Nucleotide Polymorphism Signature for Recurrence in Localised Renal Cell Carcinoma: a Retrospective Analysis and Multicentre Validation Study. Lancet Oncol. 20 (4), 591–600. doi:10.1016/s1470-2045(18)30932-x
Weng, S., DiNatale, R. G., Silagy, A., Mano, R., Attalla, K., Kashani, M., et al. (2021). The Clinicopathologic and Molecular Landscape of Clear Cell Papillary Renal Cell Carcinoma: Implications in Diagnosis and Management. Eur. Urol. 79 (4), 468–477. doi:10.1016/j.eururo.2020.09.027
Wettersten, H. I., Aboud, O. A., Lara, P. N., and Weiss, R. H. (2017). Metabolic Reprogramming in Clear Cell Renal Cell Carcinoma. Nat. Rev. Nephrol. 13 (7), 410–419. doi:10.1038/nrneph.2017.59
Wickham, H., Averick, M., Bryan, J., Chang, W., McGowan, L., François, R., et al. (2019). Welcome to the Tidyverse. Joss 4 (43), 1686. doi:10.21105/joss.01686
Woo, C. C., Kaur, K., Chan, W. X., Teo, X. Q., and Lee, T. H. P. (2018). Inhibiting Glycine Decarboxylase Suppresses Pyruvate-To-Lactate Metabolism in Lung Cancer Cells. Front. Oncol. 8, 196. doi:10.3389/fonc.2018.00196
Wu, T., Hu, E., Xu, S., Chen, M., Guo, P., Dai, Z., et al. (2021). clusterProfiler 4.0: A Universal Enrichment Tool for Interpreting Omics Data. Innovation 2 (3), 100141. doi:10.1016/j.xinn.2021.100141
Wu, Y., Wei, X., Feng, H., Hu, B., Liu, B., Luan, Y., et al. (2020). An Eleven Metabolic Gene Signature-Based Prognostic Model for Clear Cell Renal Cell Carcinoma. Aging (Albany NY) 12 (22), 23165–23186. doi:10.18632/aging.104088
Xiao, Y., Thakkar, K. N., Zhao, H., Broughton, J., Li, Y., Seoane, J. A., et al. (2020). The M 6 A RNA Demethylase FTO Is a HIF-independent Synthetic Lethal Partner with the VHL Tumor Suppressor. Proc. Natl. Acad. Sci. U.S.A. 117 (35), 21441–21449. doi:10.1073/pnas.2000516117
Xing, Q., Zeng, T., Liu, S., Cheng, H., Ma, L., and Wang, Y. (2021). A Novel 10 Glycolysis-Related Genes Signature Could Predict Overall Survival for Clear Cell Renal Cell Carcinoma. BMC Cancer 21 (1), 381. doi:10.1186/s12885-021-08111-0
Xiong, W., Zhang, B., Yu, H., Zhu, L., Yi, L., and Jin, X. (2021). RRM2 Regulates Sensitivity to Sunitinib and PD-1 Blockade in Renal Cancer by Stabilizing ANXA1 and Activating the AKT Pathway. Adv. Sci. (Weinh) 8 (18), e2100881. doi:10.1002/advs.202100881
Xu, K., Wang, R., Xie, H., Hu, L., Wang, C., Xu, J., et al. (2021). Single-cell RNA Sequencing Reveals Cell Heterogeneity and Transcriptome Profile of Breast Cancer Lymph Node Metastasis. Oncogenesis 10 (10), 66. doi:10.1038/s41389-021-00355-6
Yang, C., Gao, S., Dagnæs-Hansen, F., Jakobsen, M., and Kjems, J. (2017). Impact of PEG Chain Length on the Physical Properties and Bioactivity of PEGylated Chitosan/siRNA Nanoparticles In Vitro and In Vivo. ACS Appl. Mat. Interfaces 9 (14), 12203–12216. doi:10.1021/acsami.6b16556
Yang, S., Wong, K. H., Hua, P., He, C., Yu, H., Shao, D., et al. (2022). ROS-responsive Fluorinated Polyethyleneimine Vector to Co-deliver shMTHFD2 and shGPX4 Plasmids Induces Ferroptosis and Apoptosis for Cancer Therapy. Acta Biomater. 140, 492–505. doi:10.1016/j.actbio.2021.11.042
Yao, S., Peng, L., Elakad, O., Küffer, S., Hinterthaner, M., Danner, B. C., et al. (2021). One Carbon Metabolism in Human Lung Cancer. Transl. Lung Cancer Res. 10 (6), 2523–2538. doi:10.21037/tlcr-20-1039
Ye, J., Dai, Y., Mao, H., Zheng, W., and Zhang, J. (2021). Prognostic Value of Asymmetric Dimethylarginine in Patients with Coronary Artery Disease: A Meta-Analysis. Nitric Oxide 109-110, 50–56. doi:10.1016/j.niox.2021.03.002
Zhang, W. C., Shyh-Chang, N., Yang, H., Rai, A., Umashankar, S., Ma, S., et al. (2012). Glycine Decarboxylase Activity Drives Non-small Cell Lung Cancer Tumor-Initiating Cells and Tumorigenesis. Cell. 148 (1-2), 259–272. doi:10.1016/j.cell.2011.11.050
Keywords: prognostic biomarker, clear cell renal cell carcinoma, papillary renal cell carcinoma, metabolic-related genes, renal cance
Citation: Huang S, Luo Q, Huang J, Wei J, Wang S, Hong C, Qiu P and Li C (2022) A Cluster of Metabolic-Related Genes Serve as Potential Prognostic Biomarkers for Renal Cell Carcinoma. Front. Genet. 13:902064. doi: 10.3389/fgene.2022.902064
Received: 22 March 2022; Accepted: 07 June 2022;
Published: 07 July 2022.
Edited by:
Min Tang, Jiangsu University, ChinaReviewed by:
Youwen Zhang, University of South Carolina, United StatesChen Mo, Harvard Medical School, United States
Copyright © 2022 Huang, Luo, Huang, Wei, Wang, Hong, Qiu and Li. This is an open-access article distributed under the terms of the Creative Commons Attribution License (CC BY). The use, distribution or reproduction in other forums is permitted, provided the original author(s) and the copyright owner(s) are credited and that the original publication in this journal is cited, in accordance with accepted academic practice. No use, distribution or reproduction is permitted which does not comply with these terms.
*Correspondence: Changyu Li, bGN5emNtdUBzaW5hLmNvbQ==
†These authors contributed equally to this work and should be considered co-first authors