 Rui Miao1
 Xin Dong1Xiao-Ying Liu2Sio-Long Lo1Xin-Yue Mei1Qi Dang1Jie Cai1
 Shao Li3
 Kuo Yang3
 Sheng-Li Xie4
 Yong Liang5*
- 1Institute of Systems Engineering, Macau University of Science and Technology, Avenida Wai Long, Taipa, China
- 2Computer Engineering Technical College, Guangdong Polytechnic of Science and Technology, Zhuhai, China
- 3MOE Key Laboratory of Bioinformatics, TCM-X Center/Bioinformatics Division, BNRIST/Department of Automation, Tsinghua University, Beijing, China
- 4Guangdong-HongKong-Macao Joint Laboratory for Smart Discrete Manufacturing, Guangzhou, China
- 5Peng Cheng Laboratory, Shenzhen, China
Previous research shows that each type of cancer can be divided into multiple subtypes, which is one of the key reasons that make cancer difficult to cure. Under these circumstances, finding a new target gene of cancer subtypes has great significance on developing new anti-cancer drugs and personalized treatment. Due to the fact that gene expression data sets of cancer are usually high-dimensional and with high noise and have multiple potential subtypes’ information, many sparse principal component analysis (sparse PCA) methods have been used to identify cancer subtype biomarkers and subtype clusters. However, the existing sparse PCA methods have not used the known cancer subtype information as prior knowledge, and their results are greatly affected by the quality of the samples. Therefore, we propose the Dynamic Metadata Edge-group Sparse PCA (DM-ESPCA) model, which combines the idea of meta-learning to solve the problem of sample quality and uses the known cancer subtype information as prior knowledge to capture some gene modules with better biological interpretations. The experiment results on the three biological data sets showed that the DM-ESPCA model can find potential target gene probes with richer biological information to the cancer subtypes. Moreover, the results of clustering and machine learning classification models based on the target genes screened by the DM-ESPCA model can be improved by up to 22–23% of accuracies compared with the existing sparse PCA methods. We also proved that the result of the DM-ESPCA model is better than those of the four classic supervised machine learning models in the task of classification of cancer subtypes.
Introduction
As the most difficult-to-cure malignant disease in the world, how to defeat cancer has received extensive attention from researchers (Siegel et al., 2016; Siegel et al., 2019). The latest research shows that each type of cancer can derive many subtypes, which may be one of the reasons why personalized cancer treatment is needed (Nguyen et al., 2008; Cancello et al., 2010; Houssami et al., 2012; Symmans et al., 2017; and Waks and Winer, 2019). For example, the ceritinib capsule is a targeted drug for lung cancer (the target gene is ALK) (Cooper et al., 2015; Raedler, 2015). However, existing studies have shown that it only has a good effect on a small number of lung cancer patients. The reason for this problem is that only 35–36% of lung cancer patients are caused by ALK gene mutations, which means that the ceritinib capsule is only effective for one subtype of lung cancer (Deeks, 2016). Therefore, the identification and recognition of potential target genes corresponding to cancer subtypes have become an important task in cancer research (Banerji et al., 2012; Calon et al., 2015; and De Cecco et al., 2015).
With the rapid development of the high-throughput sequencing technology, there are a lot of biological data that have been collected from many large-scale projects, which provides a basis to establish machine learning models for biomarker screening. At present, there are two types of machine learning models for screening target genes of potential cancer subtypes. One is the supervised classification models. Gene expression data sets of cancer are usually high-dimensional and with high noise and small sample sizes, which easily lead to overfitting of supervised machine learning models (Gao et al., 2019; Lee et al., 2020). Moreover, the other problem with the supervised models is that the gene probes screened by these models may not have good biological interpretation, and different models may screen out very different gene probes in the same data set (Xie et al., 2019; Yang et al., 2019). The other type is the unsupervised biomarker extraction models. The principle of these models is to perform cancer subtype clustering and target gene screening based on potential patterns of samples. Among them, the sparse principal component analysis (sparse PCA) methods are widely used methods of unsupervised biomarker extraction, which can capture the linear relationship of variables to best explain the latent patterns of cancer subtypes. Moreover, the potential target genes screened by the sparse PCA methods may tend to have good biological interpretability (Shen et al., 2009; Shen et al., 2012; and Min et al., 2018).
Currently, researchers have proposed some sparse PCA and joint latent variable methods for identifying driver genes of cancer or biomarkers of cancer subtypes. For example, in 2009, Shen et al. (2009) proposed a cancer subtype clustering model (iCluster) based on joint latent variable of data. In 2011, SAN et al. (Navarro Silvera et al., 2011) used PCA and logistic regression to analyze the risk factors of esophageal cancer and gastric cancer. Shen et al. (2013) further extended the iCluster model with LASSO, elastic net, and fusion LASSO methods to allow feature selection in an integrated clustering environment. The overall goal of these models is to obtain joint clustering of samples and identify cluster-related features across data sets. In 2015, Sill et al. (2015) proposed a sparse PCA method (S4VDPCA) with stable selection ability to process the medulloblastoma brain gene expression data set and revealed that the genes determined by the first two sparse PC loadings significantly participated in the marrow and several key pathways between the molecular subgroups of blastoma. In 2018, Min et al. (2018) proposed an edge group sparse PCA model (ESPCA) which effectively enhanced the potential gene selection ability of sparse PCA. Existing research shows that structured sparse models similar to ESPCA can effectively improve the biological interpretability and feature selection capabilities of the models (Min et al., 2016; Min et al., 2019; Vinga, 2021).
However, the existing sparse PCA methods still have three main issues. First, all these methods are reference-free methods, which means that they do not consider the known subtype classification information of the cancer data set (Reis-Filho and Pusztai, 2011; Dai et al., 2015). The existing research works have shown that reference-free sparse PCA methods may discard some potential biomarkers in the process of sparseness (Kim et al., 2019). The second one is that the samples of the biological data contain a lot of noise (Teng, 2003; Linck and Battey, 2019), which will affect the final results of the model and eventually lead researchers to find the wrong potential target gene. The third issue is that most of the existing sparse PCA methods use the greedy optimization principle to select target gene probes, which will make the model fall quickly into a local optimum.
In order to solve the three problems mentioned mentioned above, this article proposes the DM-ESPCA model, which uses the dynamic gene network, meta-learning approach, and random sampling algorithm based on the greedy principle (Figure 1). The purpose of the dynamic gene network is to enhance the feature selection ability of the model to screen out potential target genes that are more relevant to the cancer subtype. The meta-learning approach is an efficient machine learning framework, which uses a small number of high-quality samples to adjust the parameters of the machine learning model to reduce the errors caused by the noise data. We also proposed a random sampling algorithm based on the greedy principle to obtain a better solution in the process of sparseness.
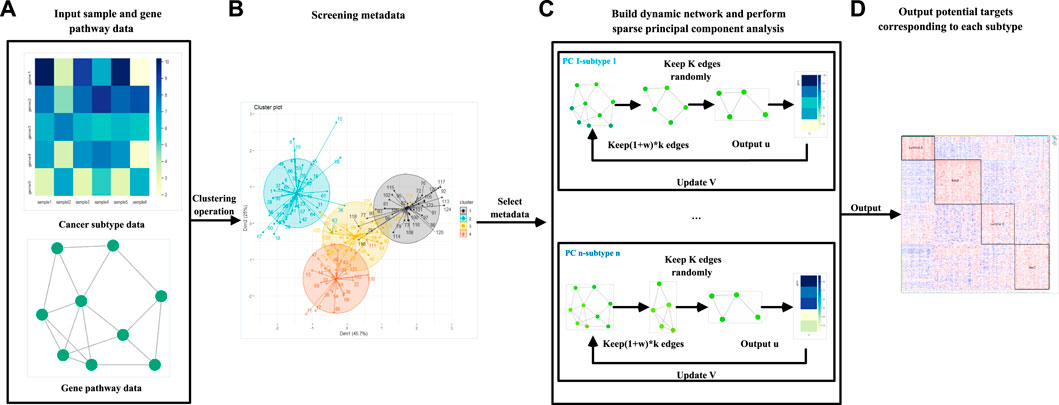
FIGURE 1. Flow chart of the DM-ESPCA model. (A) The DM-ESPCA model requires input gene expression and pathway data. (B) The DM-ESPCA model selects meta-data by clustering all samples. (C) Workflow of the DM-ESPCA model to screen targeted genes. The DM-ESPCA model will generate a dynamic gene network for each subtype. (D) Finally, this model will output the screened genes.
The steps of the DM-ESPCA model are as follows: 1) filter meta-data for each subtype in the cancer data set; 2) based on meta-data, use known subtype classification information as prior knowledge to calculate the correlation degree of each gene probe corresponding to each subtype; 3) use the quantitative value of correlation as a parameter to generate a unique biological network for each subtype; and 4) build the DM-ESPCA model using the dynamic gene network to screen biomarkers for each subtype.
This article conducted experiments on three data sets, and the results showed that the DM-ESPCA model is better than the existing sparse PCA methods. The heat maps and bio-enrichment analyses show that the potential target genes screened by the DM-ESPCA model have higher correlations and richer biological information with the corresponding cancer subtypes. The results of re-clustering and the accuracies of machine learning classification models based on the potential target genes screened by the DM-ESPCA model can be improved by up to 23 and 22%, respectively.
Materials and Methods
Data Sets
In this experiment, we used three cancer data sets to test the performance of the DM-ESPCA model, including two breast cancer data sets and one gastric cancer data set. All these data sets were assayed with the Human Genome U133 Plus 2.0 microarray (HG-U133_Plus_2). This gene chip contains 54,675 probes (Carlson et al., 2016). The following is a detailed introduction to the data sets (Table 1):

TABLE 1. Details of the three data sets.
First, we used a breast cancer subtype data set, numbered E-GEOD-45827 (BCI, https://www.ebi.ac.uk/arrayexpress/experiments/E-GEOD-45827/). Since breast cancer is a kind of malignant cancer, its incidence rate ranks first among female malignant cancers all year round and is still increasing year by year (DeSantis et al., 2014; Fan et al., 2014). Therefore, the analysis of breast cancer data sets is greatly significant. Meanwhile, breast cancer has a clear subtype division, which is mainly divided into four subtypes, including Basal, Her2, Luminal A, and Luminal B (Tran and Bedard, 2011). The BCI data set we used in this experiment contains 155 samples (Supplementary Fig.1.A).
Next, we used another breast cancer data set, numbered E-GEOD-65194 (BCII, https://www.ebi.ac.uk/arrayexpress/experiments/E-GEOD-65194/). The purpose of using the BCII data set is to verify whether our proposed model can correctly classify the subtypes and whether it has sufficient stability in the same cancer but different batches of data collection. Here, the BCII data set also has four subtypes, including TNBC, Her2, Luminal A, and Luminal B. Based on the existing studies, TNBC and Basal can easily be regarded as the same subtype (Wiese et al., 2013). We obtained BCII with 178 samples (Supplementary Fig.1.B).
Finally, we conducted an experiment using a gastric cancer data set, numbered E-GEOD-35809 (GC, https://www.ebi.ac.uk/arrayexpress/experiments/E-GEOD-35809/). Gastric cancer is also a common malignant cancer (Crew and Neugut, 2006). Its incidence rate remains high in the global incidence statistics of malignant cancers (Hartgrink et al., 2009). In addition, the existing studies have found that gastric cancer also has multiple subtypes. The data set used in this experiment includes three subtypes: proliferative, invasive, and metabolic (Supplementary Figure 1C) (Lei et al., 2013; Zeng et al., 2018). The purpose of using gastric cancer data is to test whether the DM-ESPCA model can be applied to different cancer subtypes’ research.
In this study, we used a mixed model of GC-RMA to preprocess all these three data sets to reduce the negative impact of the batch. Specifically, we discarded all the probes with a log2 intensity of less than 4.
Gene Pathway Data Sets
The basic network data set used by the DM-ESPCA model is obtained from the following database: Pathway Commons database (http://www.pathwaycommons.org/).
Totally, the BCI and BCII data sets retained the same 29,873 gene probes, and the corresponding relationship network retained 1,239,154 edges. The GC data set retained 28,838 gene probes, and 1,181,312 edges were retained in the corresponding relationship network.
Methods
In this section, we first introduced the general sparse PCA framework (SPCA). Then, we introduced the ESPCA model. Finally, we proposed the DM-ESPCA model which includes meta-data selection, the dynamic gene network, and the random sampling algorithm based on the greedy principle.
SPCA
Suppose there is a gene matrix
where
where
where
where
ESPCA
In 2018, Min et al. proposed the edge group sparse PCA (ESPCA), which uses known genome structures as prior knowledge (Min et al., 2018). The ESPCA model is transformed from a traditional point sparse to a group sparse which effectively improves the feature screening ability of sparse PCA. Suppose
where
where
DM-ESPCA
On the basis of SPCA and ESPCA models, we propose the DM-ESPCA model. Compared to existing models, the DM-ESPCA model has three main improvements. First, the DM-ESPCA model generates independent dynamic network weights for each PC based on known cancer subtype classification information and integrates the weights into the sparse PCA framework which enhances the model’s cancer subtype target selection capabilities. Second, in the process of generating the dynamic network weights of the DM-ESPCA model, the DM-ESPCA model improves the sample quality and noise of the data set by selecting a subset of meta-data. It ensures the accuracy and reliability of the dynamic network weights. Third, the DM-ESPCA model improves the traditional greedy algorithm and proposes a random sampling algorithm based on the greedy principle, which improves the local optimal solution of the model. Next, we introduce the details of meta-data selection, the dynamic network, and the random sampling algorithm based on the greedy principle modules in the order of model construction (Figure 2).
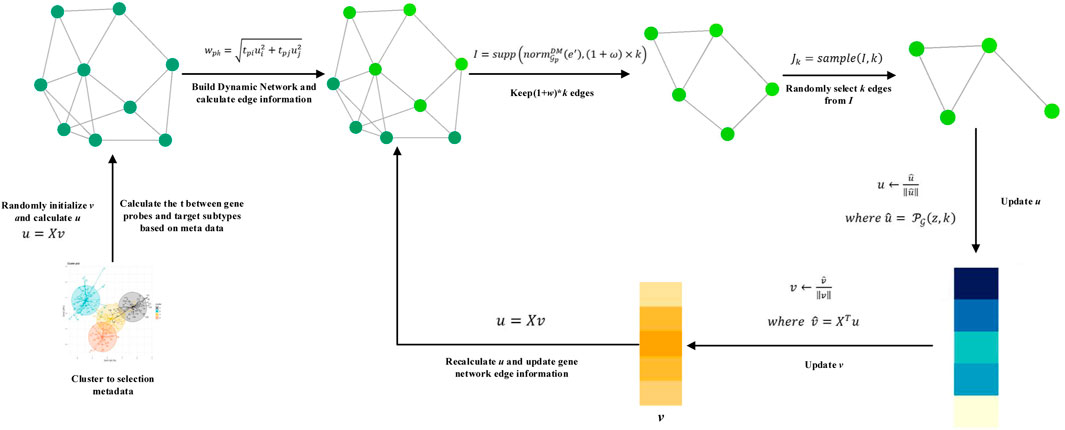
FIGURE 2. Algorithm of the DM-ESPCA model.
Meta-data Selection
The cancer subtype data sets are inevitably noisy, which will mislead the results of machine learning models (since the cancer subtype data sets are inevitably noisy and mislead the results of machine learning models). To solve this problem, the establishment of the dynamic network is based on meta-data (high-quality samples) after preprocessing, not all samples. Here, we adopt the idea of meta-learning to initialize model parameters with high-quality samples as much as possible and guide the operation of the entire model. It should be stated that the idea of meta-learning here means that the model uses a batch of high-quality sample data sets to guide the training of the model based on all samples (Shu et al., 2019). It does not refer to the multi-task meta-learning training mode similar to the MAML model (Finn et al., 2017). The following content is the steps for selecting meta-data from the cancer subtype data set:
First, we use all gene probes to cluster the subtype data sets which adopt the K-means algorithm.
According to the known clustering information, we select h samples closest to the cluster center point in each cancer subtype.
We repeat clustering multiple times, and the final result is that the samples are stably selected each time.
Dynamic Meta-data Network
Existing sparse PCA methods are all reference-free methods. Even in the ESPCA model, its used weights of the biological networks for the principal components are the same. In this article, we pre-calculate the correlation weights of each gene probe and each cancer subtype based on general biological knowledge and meta-data. These weights are used to establish a dynamic biological network for each cancer subtype, thereby enhancing the model’s gene screening ability.
Here, we presented the DM-ESPCA model as formulas 8 and 12. First, we assume that
where
Then, we adopted formula 9 to pre-calculate the correlation weight
where
Therefore, the weight of the
Here, the dynamic network of the
where
Finally, the sparse model of this article can be represented as
where
Random Sampling Algorithm Based on the Greedy Principle
To solve sparse PCA methods, the key issue is how to solve a projection problem with fixed
In algorithm 1,
where
Finally, we use formulas 14, 15 to update vectors
Algorithm 1. Random sampling algorithm based on the greedy principle sparse projection for the dynamic network
In order to ensure the convergence of the algorithm, when the model completes the edge sparse projection, we use the parameter
Results
The experiments are divided into two steps. First, we use three sparse PCA methods including DM-ESPCA, ESPCA, and SPCA models to perform unsupervised sparse PCA on the cancer data sets. This step will allow each model to screen the subset of the potential target genes for each cancer subtype. We adopted three indicators including heat map, the cluster results, and p-value to evaluate the gene subset screen by each model. We also conducted a bio-enrichment analysis (Zhou et al., 2019) to count the key biological pathways corresponding to these gene subsets, such as the GO biological process (GO-BP), KEGG, and so forth, to determine whether these gene subsets are related to the cancer subtypes.
In order to further compare these gene subsets screened by the three sparse PCA methods, we used all samples based on the gene subsets to build four machine learning classification models, such as the K-Nearest Neighbor (KNN) model, the Support Vector Machines (SVM), the Logistic Regression, and the Random Forest model (Hearst et al., 1998; Liaw and Wiener, 2002; Peterson, 2009). In addition, we also built four machine learning models based on all genes, which was performed to compare whether the DM-ESPCA model is better than the classic supervised learning model in classification tasks. In sections 3.1–3.3, we only illustrate the results of the KNN model, and the results of other models are in the supplementary materials. Four classic statistical indicators, including precision, recall, F1-score, and accuracy, are used to evaluate the classification results. All machine learning experiments use the 5-fold cross-validation approach, and the final results are the averages of five runs. (The detail of indicators is in the Supplementary Materials.)
Application to the BCI Data Set
In Figure 3A of the heat map analysis, we can find that the DM-ESPCA model can clearly distinguish the four breast cancer subtypes with clear boundaries. However, the gene probes screened by the ESPCA and SPCA models could not distinguish these four subtypes well (Supplementary Figure S2, S3). Table 2 summarizes these clustering results, where the clustering accuracy of the DM-ESPCA model reached 82.3%, which is 14.61% higher than the results of the ESPCA model and 21.6% higher than that of the results of the SPCA model (Supplementary Table S1). These results showed that the DM-ESPCA model had a relatively strong distinguishing ability for the four subtypes of breast cancer, especially in Luminal B subtypes. In addition, according to the p-values shown in Figure 7A and Supplementary Figure S10, the performance of the DM-ESPCA model was significantly better than that of the ESPCA and SPCA models in the correlation of Luminal A subtype. Moreover, the average p-values of select genes in all subtypes are very low, which means that the results of our proposed model are highly related to breast cancer (Supplementary Table S2).
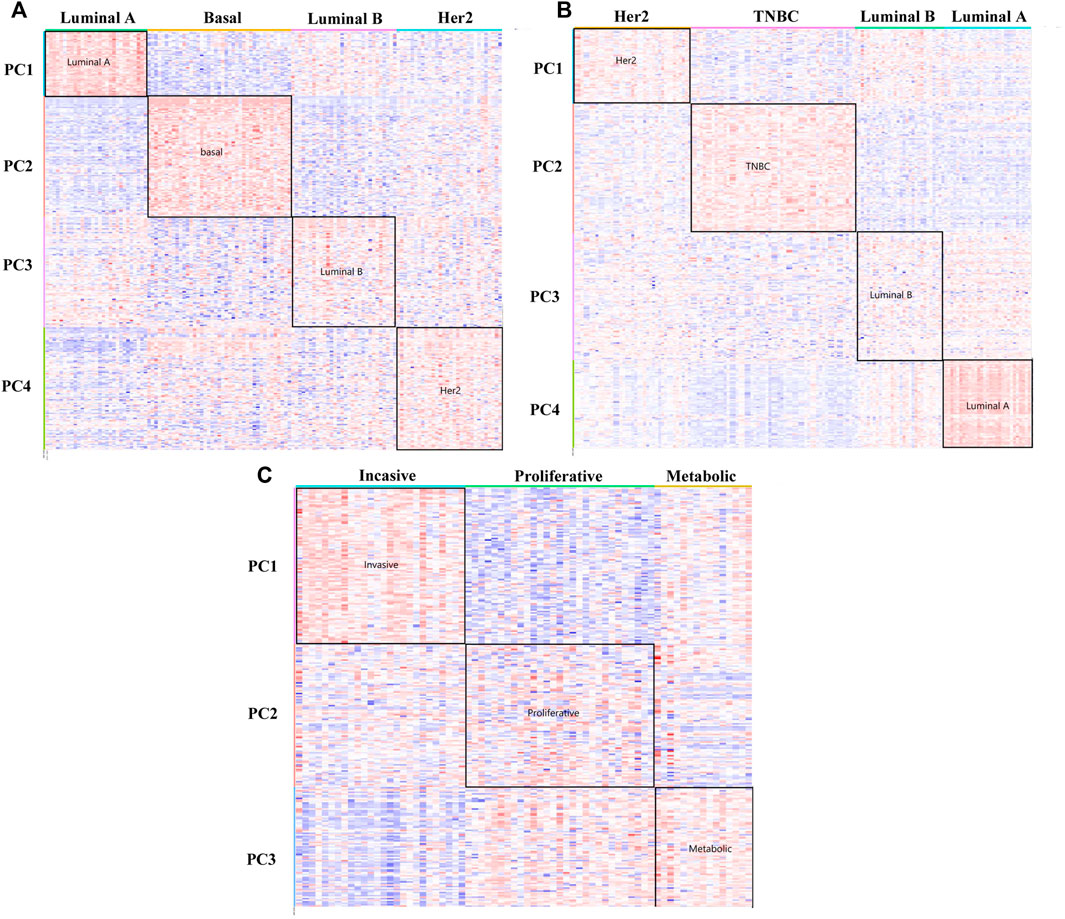
FIGURE 3. Heat maps of the DM-ESPCA model. (A) Result of the BCI data set. (B) Result of the BCII data set. (C) Result of the GC data set. The row is the gene probs; different color blocks of rows indicate genes selected by different PC loadings. The column is the samples. The color of each block in the heat maps is the expression value of the genes.

TABLE 2. Clustering results obtained by the three sparse PCA methods.
In order to further verify the gene screening ability of the DM-ESPCA model, we conducted a bio-enrichment analysis. It can be seen from Table 3 that the DM-ESPCA model can find genes related to breast cancer in all four subtypes, but the ESPCA and SPCA models can only be found in three subtypes. From Figures 4, 5, we can see that the DM-ESPCA model can find 1,286 biological pathways in the GO-BP and KEGG data sets. These results are much better than that of the ESPCA and SPCA models.

TABLE 3. Number of PCs that can find gene probes related to the target cancer for each model.
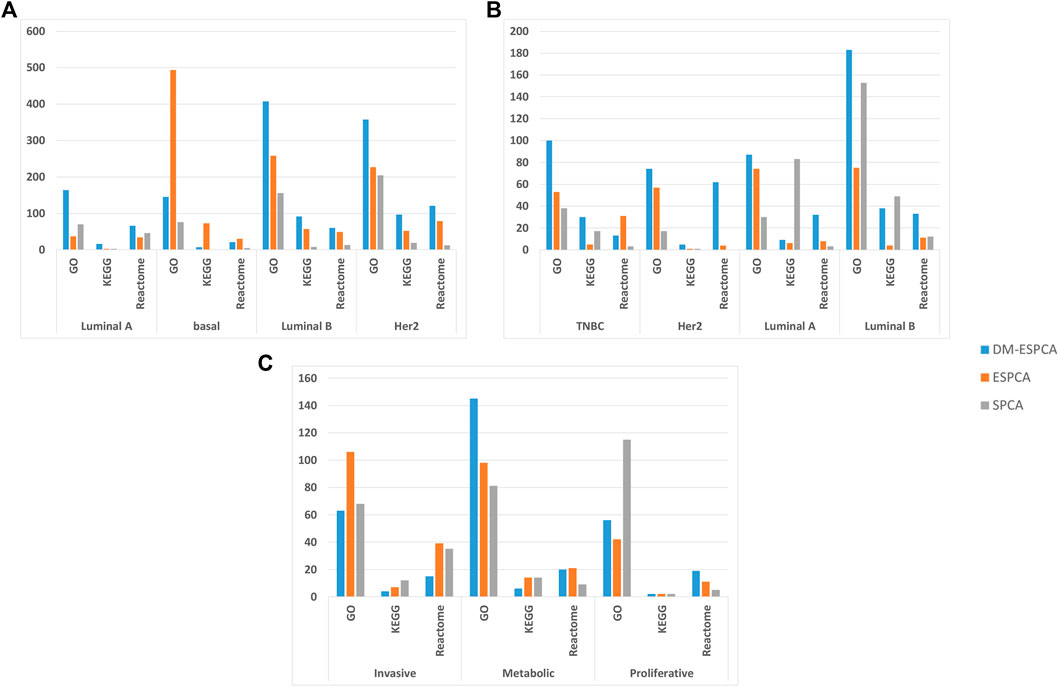
FIGURE 4. Pathway numbers with screened genes of GO, KEGG, and Reactome in the bio-enrichment analysis; (A) number of pathways in the BCI data set; (B) number of pathways in the BCII data set; (C) number of pathways in the GC data set. The blue bar is the DM-ESPCA model, the orange bar is the ESPCA model, and the gray one is the SPCA model.
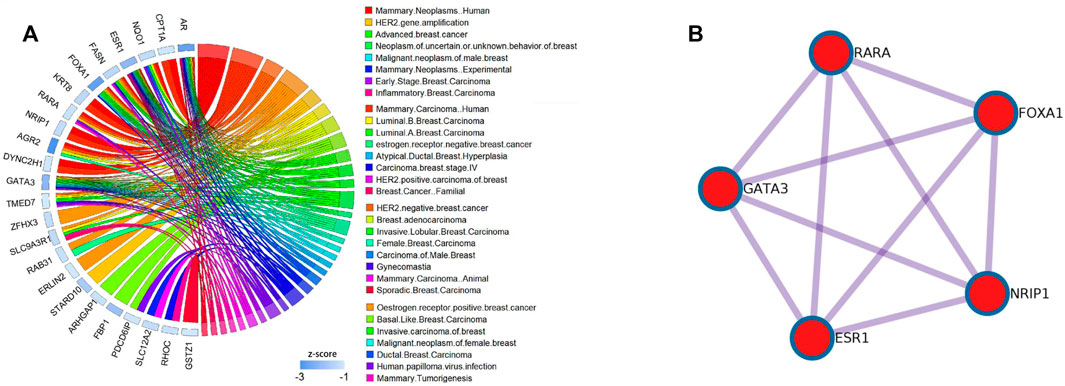
FIGURE 5. Results of the DisGeNET dataset and PPI pathways of the Basal subtype in the BCI dataset; (A) relationship between the diseases and gene selected by the DM-ESPCA model of the Basal subtype in the BCI dataset.The blue bar shows the z-score of each gene.Data collected from the DisGeNET dataset. (B) KeyPPI pathways of part of the gene selected by the DM-ESPCA data set.
Among the results of the enrichment analysis, the basal subtype results of the DM-ESPCA model are particularly encouraging. First, in the PPI networks, it found multiple key target protein sites. Among them, ESR1, NRIP1, FOXA1, RARA, and GATA3 are highly correlated with the gene pathway R-HSA-9018519 of estrogen-dependent gene expression (Figure 6B). The secretion of estrogen is one of the important causes of breast cancer. We also found that the z-scores of the aforementioned gene probes are generally high (Supplementary Figure S8). Next, in the DisGeNET set, the potential target gene probes screened by the DM-ESPCA model are related to 32 known breast cancer disease signatures (Figure 6A). Among them, the gene probes ARHGAP1, ESR1, FBP1, GATA3, FOXA1, PDCD6IP, AR, FASN, RARA, and TMED7 are directly related to the basal-like breast carcinoma and HER2-negative breast cancer with the data set numbers C3642347 and C4733095 (Supplementary Table S3). Finally, the enrichment analysis results of the PaGenBase data set show that the gene set found by the DM-ESPCA model is highly correlated with breast cells (Supplementary Table S4). In general, the results of the gene enrichment analysis clearly prove that DM-ESPCA has a strong ability to select target genes of breast cancer subtypes.
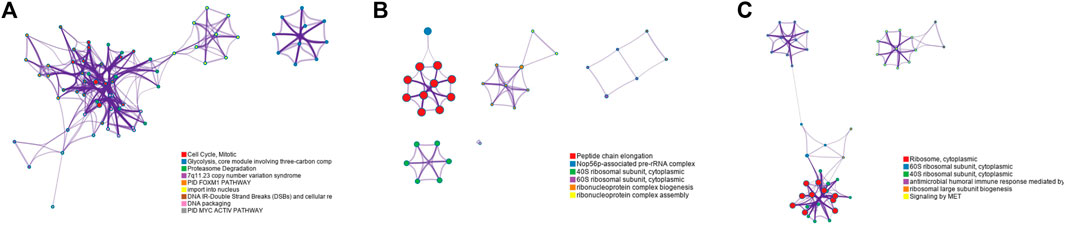
FIGURE 6. Functional pathways collected from the BCI data set Luminal A subtype; (A) results of GO-BP in the DMESPCA model; (B) results of GO-BP in the ESPCA model; and (C) results of GO-BP in the SPCA model.
The gene subset selected by the DM-ESPCA model also achieved the best classification results; the accuracy reached 97%, the precision reached 98%, the recall reached 97%, and the F1-score reached 97% (Figure 7B, Supplementary Table S5). Simultaneously, the classification accuracy based on the gene subset selected by the ESPCA model and its precision, recall, and F1-score only reached 77, 79, 76, and 76%, respectively. The classification accuracy based on the gene subset selected by the SPCA model and its precision, recall, and F1-score only reached 75, 74, 71, and 74%, respectively. It is worth noting that even if we use all genes to build four supervised machine learning models, the best result of precision, recall, and F1-score only reached 85, 86, 85, and 85% (Logistic Regression model), which is much lower than the result of the DM-ESPCA model.
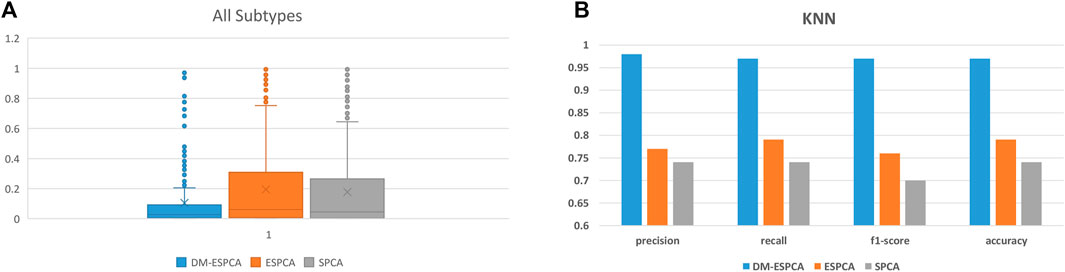
FIGURE 7. Boxplots and classification comprehensive indicators of the BCI data set; (A) p-values of selected genes in all subtypes. (B) Results of KNN in three sparse PCA methods and the use of all genes.
In summary, these results demonstrated that the DM-ESPCA model can identify more biologically relevant gene sets than the ESPCA and SPCA models. In classification tasks, the DM-ESPCA model is better than ESPCA, SPCA, and classic supervised learning models. From the perspective of model construction, it is expected that the DM-ESPCA model can obtain better results than ESPCA and SPCA in heat map, cluster analysis, correlation analysis, enrichment analysis, and classification experiments. Because the dynamic network takes known cancer subtype classification information as prior knowledge, this enables the DM-ESPCA model to select cancer targets that are more relevant to the corresponding cancer subtype. The screening of meta-data further alleviates the problem of sample quality in the data, and the random sampling algorithm based on the greedy principle improves the local optimal solution problem of the traditional greedy algorithm. In addition, we believe that the dimensional challenges and overfitting problems of the data prevent the machine learning model (use all gene probes) from achieving a better performance, which is the same point of view as existing research works.
Application to the BCII Data Set
In order to further verify the stability of the DM-ESPCA model in the same type but different batches of cancer subtype data sets, we also used the BCII data set to conduct the experiments, which showed similar results compared with the BCI data set. According to Figure 3B, the DM-ESPCA model could distinguish four breast cancer subtypes well, and the boundary corresponding to each subtype was very clear. In contrast, the heat map results of the ESPCA and SPCA models were worse in the BCII data set, and they were difficult to judge the boundary of the subtype (Supplementary Figure S4, S5). In Table 2, the cluster accuracy of the DM-ESPCA model reached 82.3%; however, the cluster accuracies of the ESPCA and SPCA models only reached 75.1 and 59.8%, respectively. Similar to the results in the BCI data set, the Lumina B subtype was difficult to distinguish; the DM-ESPCA model could relatively accurately divide all samples into four subtypes, including the Lumina B subtype. Neither the ESPCA model nor the SPCA model could cluster Lumina B subtypes well (Supplementary Table S6). Besides, in Supplementary Fig.11, the DM-ESPCA model outperformed the ESPCA and the SPCA models in p-values, especially the correlation of a comprehensive Luminal A subtype (Supplementary Table S7). These meant that the genetic points screened by the DM-ESPCA model had a higher correlation with cancer subtypes, which was more conducive to the analysis by biological researchers.
An enrichment analysis showed that the DM-ESPCA model selected gene probes containing the largest number of biological pathways (Figure 4B). In addition, the DM-ESPCA model can find gene probes known to be related to breast cancer diseases in the DisGeNET set among all four principal components (Table 3). In comparison, the ESPCA model can only find genes related to breast cancer in two principal components, while the SPCA model can find genes related to breast cancer in three principal components. Especially in the Luminal B subtype, the DM-ESPCA model can find 13 gene probes related to eight breast cancer disease entries which show a very high correlation with breast cancer (Supplementary Figure S9).
Finally, based on Supplementary Fig.12, the optimal classification results were obtained by the KNN method based on the gene subset selected by the DM-ESPCA model. Its accuracy, precision, recall, and F1-score reached 90, 90, 89, and 88%, respectively. In comparison, these four classification indicators of the model based on the gene subset selected by the ESPCA model could only reach 86, 86, 80, and 80%, respectively, while these four classification indicators of the model based on the gene subset selected by the SPCA model could only reach 82, 82, 80, and 80%, respectively (Supplementary Table S8). The best results of precision, recall, and F1-score for the supervised machine learning model which used all genes only reached 85, 87, 85, and 85% (Logistic Regression model), which is lower than the result of the DM-ESPCA model, 5, 3, 4, and 3%.
Based on the results of the BCII data set, we can see that in the same cancer subtype, but in different data batches, the performance of the DM-ESPCA model was very stable.
Application to the GC DataSet
To verify the applicability of the DM-ESPCA model in different cancer data, we used a gastric cancer data set for experimentation. Based on the result of the heat map (Figure 3C, Supplementary Figure S6, S7), the DM-ESPCA model performed well, especially in subtypes Invasive and Metabolic. In Table 1, the clustering accuracy of the DM-ESPCA model reached 84.23%. Compared with the ESPCA and SPCA models, the clustering accuracy of the DM-ESPCA model increased by 9 and 6%, respectively (Supplementary Table S9). Meanwhile, based on Supplementary Fig.13, the p-values of the DM-ESPCA model have had significant improvements compared with other models (Supplementary Table S10).
In addition, it can be seen from Figure 3C, the DM-ESPCA model has more number of GO, KEGG, and Reactome pathways than the comparison methods in bio-enrichment analysis. In particular, the DM-ESPCA model is the only one that can find genetic probes related to all subtypes of gastric cancer. However, neither ESPCA nor SPCA can find genes related to gastric cancer in the three subtypes (Table 3).
Based on Supplementary Fig.14, the optimal classification results were obtained by the KNN method based on the gene subset selected by the DM-ESPCA model. Its accuracy, precision, recall, and F1-score reached 95, 96, 95, and 95%, respectively. In comparison, these four classification indicators of the model based on the gene subset selected by the ESPCA model could only reach 76, 72, 77, and 73%, respectively. While these four classification indicators of the model based on the gene subset selected by the SPCA model could only reach 86, 86, 86, and 86%, respectively (Supplementary Table S11). The best results of precision, recall, and F1-score for the supervised machine learning model which used all genes only reached 90, 93, 90, and 91%, respectively (Logistic Regression model), which is also lower than the result of the DM-ESPCA model. In summary, whether in the same cancer data sets with different batches or in different cancer data sets, the DM-ESPCA model performed better than the existing sparse PCA methods. Therefore, we believe that the DM-ESPCA model could reliably and stably screen the gene probes corresponding to the cancer subtypes.
Ablation Experiment
In order to further verify the influence of three main modules of DM-ESPCA, which include the random sampling algorithm based on the greedy principle, the dynamic network, and the meta-data selection module on model performance, we performed ablation experiments based on the BCI data set (Table 4, Supplementary Table S12). As shown in Table 4, non-
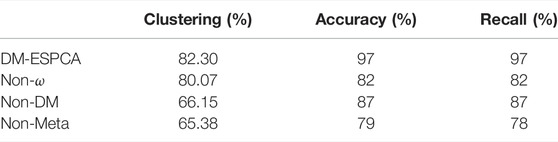
TABLE 4. Result of the ablation experiment.
Discussion
Since the beginning of the 21st century, with the development of the gene sequencing technology, researchers have discovered that the same cancer can be divided into different subtypes, which also explains that the same drug is only effective for some cancer patients but not for other patients. Therefore, how to find target genes corresponding to cancer subtypes has gradually become an important task of cancer research.
The traditional screening models for potential targets of cancer subtypes have three main problems. The first problem is that no known subtype classification information can be used. In this study, we have shown that if researchers can integrate the known subtype classification information as prior knowledge to carry out cancer subtype screening models and establish a dynamic gene network, then the screening ability of potential cancer subtype targets of the model can be greatly enhanced. The second is that the experiment’s sample quality is uneven, and low-quality samples will affect the final results of analyses. In this article, we used the idea of meta-learning to screen high-quality samples. The third point is that most of the existing models adopt the greedy principle, which will make the model quickly fall into a local optimum. We designed a new random sampling algorithm to improve the model, which may find better target genes.
Based on the aforementioned ideas, this article proposes the DM-ESPCA model, which is based on meta-learning, the dynamic gene network, and sparse PCA to screen the corresponding potential target gene probes for each cancer subtype. The bio-enrichment analysis shows that the DM-ESPCA model can directly find gene probes related to the corresponding cancer subtype. Moreover, all indicators indicate that the DM-ESPCA model can reveal more modules related to biology. Even in the task of classification of cancer subtypes, the DM-ESPCA model is superior to the existing supervised learning model. In summary, we believe that the DM-ESPCA model is a good extension of the PCA-based methods. This model can provide an effective tool for researchers to find target genes corresponding to cancer subtypes.
Although the experiment has achieved good results, the DM-ESPCA model can still be extended. We have proved that the idea of meta-learning reduces the errors caused by the noise data. However, the results of the gastric cancer data set are not very satisfactory. The reason may mean that there is still noise in the meta-data. We would consider using more powerful statistical methods to filter the meta-data. In addition, the random sampling algorithm based on the greedy principle proposed in this article can also be further improved. There are many optimization principles for NP-hard problems that can be considered. This may further improve the feature selection ability of the proposed model. In addition, it is worth noting that there are many multi-omics cancer subtype target screening models. Compared with single omics, multi-omics data can provide different views of the same batch of samples, which may lead to new and interesting biological discoveries. In theory, the DM-ESPCA model can be extended to a multi-omics model. However, how to solve the multi-omics joint sparse PCA problem still needs to be further discussed.
Data Availability Statement
The original contributions presented in the study are included in the article/Supplementary Material, further inquiries can be directed to the corresponding author.
Author Contributions
RM, XD, and YL contributed to conception and design of the study. X-YL organized the database. RM and XD performed the statistical analysis. RM, XD, S-LL, X-YM, and S-LX wrote the first draft of the manuscript. QD, JC, SL, and KY wrote sections of the manuscript. All authors contributed to manuscript revision, read, and approved the submitted version.
Funding
The authors wish to thank editors and reviewers. This work was supported in part by the Macau Science and Technology Development Funds Grant No.0158/2019/A3 and 0056/2020/ AFJ from the Macau Special Administrative Region of the People’s Republic of China and the Key Project for University of Educational Commission of Guangdong Province of China Funds (Natural, Grant No. 2019GZDXM005)
Conflict of Interest
The authors declare that the research was conducted in the absence of any commercial or financial relationships that could be construed as a potential conflict of interest.
Publisher’s Note
All claims expressed in this article are solely those of the authors and do not necessarily represent those of their affiliated organizations or those of the publisher, the editors, and the reviewers. Any product that may be evaluated in this article or claim that may be made by its manufacturer is not guaranteed or endorsed by the publisher.
Supplementary Material
The Supplementary Material for this article can be found online at: https://www.frontiersin.org/articles/10.3389/fgene.2022.869906/full#supplementary-material
References
Banerji, S., Cibulskis, K., Rangel-Escareno, C., Brown, K. K., Carter, S. L., Frederick, A. M., et al. (2012). Sequence Analysis of Mutations and Translocations across Breast Cancer Subtypes. Nature 486, 405–409. doi:10.1038/nature11154
Calon, A., Lonardo, E., Berenguer-Llergo, A., Espinet, E., Hernando-Momblona, X., Iglesias, M., et al. (2015). Stromal Gene Expression Defines Poor-Prognosis Subtypes in Colorectal Cancer. Nat. Genet. 47, 320–329. doi:10.1038/ng.3225
Cancello, G., Maisonneuve, P., Rotmensz, N., Viale, G., Mastropasqua, M. G., Pruneri, G., et al. (2010). Prognosis and Adjuvant Treatment Effects in Selected Breast Cancer Subtypes of Very Young Women. Ann. Oncol. 21, 1974–1981. doi:10.1093/annonc/mdq072
Carlson, M., Falcon, S., Pages, H., and Li, N. (2016). hgu133plus2. Db: Affymetrix Human Genome U133 Plus 2.0 Array Annotation Data (Chip Hgu133plus2). R. Package Version 3.
Cooper, M. R., Chim, H., Chan, H., and Durand, C. (2015). Ceritinib. Ann. Pharmacother. 49, 107–112. doi:10.1177/1060028014553619
Crew, K. D., and Neugut, A. I. (2006). Epidemiology of Gastric Cancer. Wjg 12, 354. doi:10.3748/wjg.v12.i3.354
Dai, X., Li, T., Bai, Z., Yang, Y., Liu, X., Zhan, J., et al. (2015). Breast Cancer Intrinsic Subtype Classification, Clinical Use and Future Trends. Am. J. Cancer Res. 5, 2929–2943. doi:10.1534/g3.114.014894
De Cecco, L., Nicolau, M., Giannoccaro, M., Daidone, M. G., Bossi, P., Locati, L., et al. (2015). Head and Neck Cancer Subtypes with Biological and Clinical Relevance: Meta-Analysis of Gene-Expression Data. Oncotarget 6, 9627–9642. doi:10.18632/oncotarget.3301
Deeks, E. D. (2016). Ceritinib: a Review in ALK-Positive Advanced NSCLC. Targ Oncol. 11, 693–700. doi:10.1007/s11523-016-0460-7
DeSantis, C., Ma, J., Bryan, L., and Jemal, A. (2014). Breast Cancer Statistics, 2013. CA A Cancer J. Clinicians 64, 52–62. doi:10.3322/caac.21203
Fan, L., Strasser-Weippl, K., Li, J.-J., St Louis, J., Finkelstein, D. M., Yu, K.-D., et al. (2014). Breast Cancer in China. Lancet Oncol. 15, e279–e289. doi:10.1016/s1470-2045(13)70567-9
Finn, C., Abbeel, P., and Levine, S. (2017). “Model-agnostic Meta-Learning for Fast Adaptation of Deep Networks,” in International conference on machine learning (PMLR), 1126–1135.
Gao, F., Wang, W., Tan, M., Zhu, L., Zhang, Y., Fessler, E., et al. (2019). DeepCC: a Novel Deep Learning-Based Framework for Cancer Molecular Subtype Classification. Oncogenesis 8, 44–12. doi:10.1038/s41389-019-0157-8
Hartgrink, H. H., Jansen, E. P., van Grieken, N. C., and van de Velde, C. J. (2009). Gastric Cancer. The Lancet 374, 477–490. doi:10.1016/s0140-6736(09)60617-6
Hearst, M. A., Dumais, S. T., Osuna, E., Platt, J., and Scholkopf, B. (1998). Support Vector Machines. IEEE Intell. Syst. Their Appl. 13, 18–28. doi:10.1109/5254.708428
Houssami, N., Macaskill, P., von Minckwitz, G., Marinovich, M. L., and Mamounas, E. (2012). Meta-analysis of the Association of Breast Cancer Subtype and Pathologic Complete Response to Neoadjuvant Chemotherapy. Eur. J. Cancer 48, 3342–3354. doi:10.1016/j.ejca.2012.05.023
Kim, Y., Bismeijer, T., Zwart, W., Wessels, L. F. A., and Vis, D. J. (2019). Genomic Data Integration by WON-PARAFAC Identifies Interpretable Factors for Predicting Drug-Sensitivity In Vivo. Nat. Commun. 10 (1), 1–12. doi:10.1038/s41467-019-13027-2
Lee, S., Lim, S., Lee, T., Sung, I., and Kim, S. (2020). Cancer Subtype Classification and Modeling by Pathway Attention and Propagation. Bioinformatics 36, 3818–3824. doi:10.1093/bioinformatics/btaa203
Lei, Z., Tan, I. B., Das, K., Deng, N., Zouridis, H., Pattison, S., et al. (2013). Identification of Molecular Subtypes of Gastric Cancer with Different Responses to PI3-Kinase Inhibitors and 5-fluorouracil. Gastroenterology 145, 554–565. doi:10.1053/j.gastro.2013.05.010
Lin, Z., Yang, C., Zhu, Y., Duchi, J., Fu, Y., Wang, Y., et al. (2016). Simultaneous Dimension Reduction and Adjustment for Confounding Variation. Proc. Natl. Acad. Sci. U.S.A. 113, 14662–14667. doi:10.1073/pnas.1617317113
Linck, E., and Battey, C. J. (2019). Minor Allele Frequency Thresholds Strongly Affect Population Structure Inference with Genomic Data Sets. Mol. Ecol. Resour. 19, 639–647. doi:10.1111/1755-0998.12995
Min, W., Liu, J., and Zhang, S. (2016). Network-regularized Sparse Logistic Regression Models for Clinical Risk Prediction and Biomarker Discovery. Ieee/acm Trans. Comput. Biol. Bioinform 15, 944–953. doi:10.1109/TCBB.2016.2640303
Min, W., Liu, J., and Zhang, S. (2018). Edge-group Sparse PCA for Network-Guided High Dimensional Data Analysis. Bioinformatics 34, 3479–3487. doi:10.1093/bioinformatics/bty362
Min, W., Liu, J., and Zhang, S. (2019). Group-Sparse SVD Models via $ L_1 $ L 1-and $ L_0 $ L 0-norm Penalties and Their Applications in Biological Data. IEEE Trans. Knowledge Data Eng. 33, 536–550.
Navarro Silvera, S. A., Mayne, S. T., Risch, H. A., Gammon, M. D., Vaughan, T., Chow, W.-H., et al. (2011). Principal Component Analysis of Dietary and Lifestyle Patterns in Relation to Risk of Subtypes of Esophageal and Gastric Cancer. Ann. Epidemiol. 21, 543–550. doi:10.1016/j.annepidem.2010.11.019
Nguyen, P. L., Taghian, A. G., Katz, M. S., Niemierko, A., Abi Raad, R. F., Boon, W. L., et al. (2008). Breast Cancer Subtype Approximated by Estrogen Receptor, Progesterone Receptor, and HER-2 Is Associated with Local and Distant Recurrence after Breast-Conserving Therapy. Jco 26, 2373–2378. doi:10.1200/jco.2007.14.4287
Raedler, L. A. (2015). Zykadia (Ceritinib) Approved for Patients with Crizotinib-Resistant ALK-Positive Non–small-cell Lung Cancer. Am. Health Drug benefits 8, 163.
Reis-Filho, J. S., and Pusztai, L. (2011). Gene Expression Profiling in Breast Cancer: Classification, Prognostication, and Prediction. The Lancet 378, 1812–1823. doi:10.1016/s0140-6736(11)61539-0
Rutenbar, R. A. (1989). Simulated Annealing Algorithms: An Overview. IEEE Circuits Devices Mag. 5, 19–26. doi:10.1109/101.17235
Shen, R., Wang, S., and Mo, Q. (2013). Sparse Integrative Clustering of Multiple Omics Data Sets. Ann. Appl. Stat. 7, 269–294. doi:10.1214/12-AOAS578
Shen, R., Mo, Q., Schultz, N., Seshan, V. E., Olshen, A. B., Huse, J., et al. (2012). Integrative Subtype Discovery in Glioblastoma Using iCluster. PloS one 7, e35236. doi:10.1371/journal.pone.0035236
Shen, R., Olshen, A. B., and Ladanyi, M. (2009). Integrative Clustering of Multiple Genomic Data Types Using a Joint Latent Variable Model with Application to Breast and Lung Cancer Subtype Analysis. Bioinformatics 25, 2906–2912. doi:10.1093/bioinformatics/btp543
Shu, J., Xie, Q., Yi, L., Zhao, Q., Zhou, S., Xu, Z., et al. (2019). Meta-weight-net: Learning an Explicit Mapping for Sample Weighting. Adv. Neural Inf. Process. Syst. 32.
Siegel, R. L., Miller, K. D., and Jemal, A. (2016). Cancer Statistics, 2016. CA: a Cancer J. clinicians 66, 7–30. doi:10.3322/caac.21332
Siegel, R. L., Miller, K. D., and Jemal, A. (2019). Cancer Statistics, 2019. CA A. Cancer J. Clin. 69, 7–34. doi:10.3322/caac.21551
Sill, M., Saadati, M., and Benner, A. (2015). Applying Stability Selection to Consistently Estimate Sparse Principal Components in High-Dimensional Molecular Data. Bioinformatics 31, 2683–2690. doi:10.1093/bioinformatics/btv197
Symmans, W. F., Wei, C., Gould, R., Yu, X., Zhang, Y., Liu, M., et al. (2017). Long-term Prognostic Risk after Neoadjuvant Chemotherapy Associated with Residual Cancer burden and Breast Cancer Subtype. Jco 35, 1049–1060. doi:10.1200/jco.2015.63.1010
Teng, C.-M. (2003). “Applying Noise Handling Techniques to Genomic Data: A Case Study,” in Third IEEE International Conference on Data Mining (IEEE), 743–746.
Tran, B., and Bedard, P. L. (2011). Luminal-B Breast Cancer and Novel Therapeutic Targets. Breast Cancer Res. 13, 221. doi:10.1186/bcr2904
Van Laarhoven, P. J. M., and Aarts, E. H. L. (1987). Simulated Annealing, Simulated Annealing: Theory and Applications. Germany: Springer, 7–15. doi:10.1007/978-94-015-7744-1_2
Vinga, S. (2021). Structured Sparsity Regularization for Analyzing High-Dimensional Omics Data. Brief. Bioinform. 22, 77–87. doi:10.1093/bib/bbaa122
Waks, A. G., and Winer, E. P. (2019). Breast Cancer Treatment. Jama 321, 288–300. doi:10.1001/jama.2018.19323
Wiese, D. A., Thaiwong, T., Yuzbasiyan-Gurkan, V., and Kiupel, M. (2013). Feline Mammary Basal-like Adenocarcinomas: a Potential Model for Human Triple-Negative Breast Cancer (TNBC) with Basal-like Subtype. BMC cancer 13, 403. doi:10.1186/1471-2407-13-403
Xie, T., Wang, Z., Zhao, Q., Bai, Q., Zhou, X., Gu, Y., et al. (2019). Machine Learning-Based Analysis of MR Multiparametric Radiomics for the Subtype Classification of Breast Cancer. Front. Oncol. 9, 505. doi:10.3389/fonc.2019.00505
Yang, Z. Y., Liu, X. Y., Shu, J., Zhang, H., Ren, Y. Q., Xu, Z. B., et al. (2019). Multi-view Based Integrative Analysis of Gene Expression Data for Identifying Biomarkers. Sci. Rep. 9, 13504–13515. doi:10.1038/s41598-019-49967-4
Yuan, X.-T., and Zhang, T. (2013). Truncated Power Method for Sparse Eigenvalue Problems. J. Machine Learn. Res. 14, 899–925.
Zeng, W., Rao, N., Li, Q., Wang, G., Liu, D., Li, Z., et al. (2018). Genome-wide Analyses on Single Disease Samples for Potential Biomarkers and Biological Features of Molecular Subtypes: a Case Study in Gastric Cancer. Int. J. Biol. Sci. 14, 833–842. doi:10.7150/ijbs.24816
Keywords: Cancer subtype, biomarkers, sparse PCA, DM-ESPCA model, meta-data, dynamic network
Citation: Miao R, Dong X, Liu X-Y, Lo S-L, Mei X-Y, Dang Q, Cai J, Li S, Yang K, Xie S-L and Liang Y (2022) Dynamic Meta-data Network Sparse PCA for Cancer Subtype Biomarker Screening. Front. Genet. 13:869906. doi: 10.3389/fgene.2022.869906
Received: 05 February 2022; Accepted: 31 March 2022;
Published: 09 May 2022.
Edited by:
Pietro Zoppoli, University of Naples Federico II, ItalyCopyright © 2022 Miao, Dong, Liu, Lo, Mei, Dang, Cai, Li, Yang, Xie and Liang. This is an open-access article distributed under the terms of the Creative Commons Attribution License (CC BY). The use, distribution or reproduction in other forums is permitted, provided the original author(s) and the copyright owner(s) are credited and that the original publication in this journal is cited, in accordance with accepted academic practice. No use, distribution or reproduction is permitted which does not comply with these terms.
*Correspondence: Yong Liang, eW9uZ2xpYW5ncmVzZWFyY2hAZ21haWwuY29t