
95% of researchers rate our articles as excellent or good
Learn more about the work of our research integrity team to safeguard the quality of each article we publish.
Find out more
ORIGINAL RESEARCH article
Front. Genet. , 03 May 2022
Sec. Livestock Genomics
Volume 13 - 2022 | https://doi.org/10.3389/fgene.2022.866176
This article is part of the Research Topic Small Ruminant Breeding in the Age of Genomics View all 8 articles
 David R. Notter1*
 Marzieh Heidaritabar2
 Joan M. Burke3
 Masoud Shirali4,5
 Brenda M. Murdoch6
 James L. M. Morgan7†
 Gota Morota1
 Tad S. Sonstegard8
 Gabrielle M. Becker6Gordon L. Spangler9†
 Michael D. MacNeil10,11James E. Miller12
Estimated breeding values (EBV) for fecal egg counts (FEC) at 42–90 days of age (WFEC) and 91–150 days of age (PFEC) for 84 progeny-tested Katahdin sires were used to identify associations of deregressed EBV with single-nucleotide polymorphisms (SNP) using 388,000 SNP with minor-allele frequencies ≥0.10 on an Illumina high-density ovine array. Associations between markers and FEC EBV were initially quantified by single-SNP linear regression. Effects of linkage disequilibrium (LD) were minimized by assigning SNP to 2,535 consecutive 1-Mb bins and focusing on the effect of the most significant SNP in each bin. Bonferroni correction was used to define bin-based (BB) genome- and chromosome-wide significance. Six bins on chromosome 5 achieved BB genome-wide significance for PFEC EBV, and three of those SNP achieved chromosome-wide significance after Bonferroni correction based on the 14,530 total SNP on chromosome 5. These bins were nested within 12 consecutive bins between 59 and 71 Mb on chromosome 5 that reached BB chromosome-wide significance. The largest SNP effects were at 63, 67, and 70 Mb, with LD among these SNP of r2 ≤ 0.2. Regional heritability mapping (RHM) was then used to evaluate the ability of different genomic regions to account for additive variance in FEC EBV. Chromosome-level RHM indicated that one 500-SNP window between 65.9 and 69.9 Mb accounted for significant variation in PFEC EBV. Five additional 500-SNP windows between 59.3 and 71.6 Mb reached suggestive (p < 0.10) significance for PFEC EBV. Although previous studies rarely identified markers for parasite resistance on chromosome 5, the IL12B gene at 68.5 Mb codes for the p40 subunit of both interleukins 12 and 23. Other immunoregulatory genes are also located in this region of chromosome 5, providing opportunity for additive or associative effects.
Improvement in genetically mediated resistance to gastrointestinal nematodes (GIN) is a potentially important component of an integrated management strategy to reduce the impact of parasitism in small ruminants (Maqbool et al., 2017). Genetic evaluation of GIN resistance is relatively straightforward in areas of high parasite challenge, most commonly using measurements of fecal egg counts (FEC) in young lambs to derive estimated breeding values (EBV) that can be used in the selection of breeding animals (Brown et al., 2007; Notter, 2013).
The Katahdin breed was derived in the US from crosses among Caribbean hair sheep and various temperate wool breeds (Wildeus, 1997). The Katahdin has greater GIN parasite resistance than other US breeds (Vanimisetti et al., 2004) and significant levels of additive genetic variation in FEC in lambs at weaning and postweaning ages (Ngere et al., 2018). As a result, resistance to GIN parasites has become a signature trait of this breed, especially in the warm, humid conditions that are typical of the southeastern United States. GIN parasites are endemic in most flocks in this region, allowing direct measurements of FEC to be used for genetic evaluation of parasite resistance. However, the Katahdin breed has several “easy-care” traits in addition to parasite resistance (e.g., freedom from wool, high twinning rates, good mothering ability) and has led the US sheep industry in numbers of sheep registered and transferred for a majority of the last 10 years. As a result, Katahdins have expanded in recent years into areas of less consistent parasite challenge, and Katahdin flocks are now found in areas where genetic evaluation of GIN resistance using phenotypic measurements of FEC is not always possible. This situation is not a concern for flocks that have customers located only in arid regions that rarely experience high levels of parasitism. However, many potential customers are attracted to the Katahdin breed for their resilience to sporadic and less predictable parasite challenges. Some Katahdin breeders also wish to ensure that they can market animals in areas of both high and low parasite challenge.
In common with other disease and fitness traits, genome-based selection appears to be a valuable option for screening prospective breeding animals for parasite resistance in regions or years when parasite challenge is not adequate to support genetic evaluations based only on phenotypic measurements (Bishop and Woolliams, 2014). Use of genomic information also allows breeders who cannot, or prefer to not, collect FEC to evaluate their animals for parasite resistance.
A substantial number of studies have attempted to identify genetic markers for GIN parasite resistance (see Benavides et al., 2016 for review and references in Table 1). These studies have involved both tropical hair sheep (e.g., Marshall et al., 2012; Berton et al., 2017) and temperate wool breeds (e.g., Riggio et al., 2013; Pickering et al., 2015; Al Kalaldeh et al., 2019) and consistently identified significant or suggestive associations between various sorts of genetic markers and measures of parasite resistance such as FEC, packed cell volume, Faffa Malan chart (FAMACHA) scores, and circulating immunoglobulin levels in response to artificial or natural GIN infection. However, marker studies involving either specific candidate genes and genomic regions or, more recently, large-scale screening of the entire genome using single-nucleotide polymorphisms (SNP) have not identified consistent associations with parasite resistance, even in studies involving the same breeds (e.g., Silva et al., 2011; Marshall et al., 2012; Becker et al., 2020; Becker et al., 2022). These inconsistencies suggest that large, breed-specific studies will be necessary to identify sets of genetic markers that can be relied upon to predict FEC EBV with acceptable reliability. This situation is further exacerbated by the large number of global sheep breeds, their often-modest population sizes, and the diverse production conditions that are typical of small ruminant production.

TABLE 1. Candidate genes.
Progeny-tested sires with high-accuracy EBV provide a unique resource for study of the association between genomic markers and animal breeding values. These sires are normally the most accurately evaluated individuals in the breed and are anticipated to have the greatest impact on future generations. The current study therefore utilized a group of progeny-tested Katahdin sires to assess associations between SNP markers and FEC EBV. The study used a two-step strategy for this analysis. Step 1 (the validation phase) involved the evaluation of five a priori candidate regions of the genome that were previously implicated in GIN parasite resistance. Step 2 (the discovery phase) then applied a genome-wide association study (GWAS) to identify previously unknown or less commonly reported regions that appeared to influence parasite resistance in these Katahdin sires.
Estimated breeding values (EBV) for fecal egg counts (FEC) at 42–90 days of age (weaning FEC EBV; WFEC) and 91–150 days of age (postweaning FEC EBV; PFEC) for progeny-tested Katahdin sires from the US National Sheep Improvement Program (NSIP) were screened to identify sires with prediction accuracies (i.e., predicted correlations between actual and predicted breeding values) of 0.60 or more for WFEC or PFEC.
Fecal samples were collected from the rectums of grazing Katahdin lambs, refrigerated for up to 7 days, and sent to the Virginia-Maryland Regional College of Veterinary Medicine or the Louisiana State University School of Veterinary Medicine for determination of FEC using the McMaster method (Whitlock, 1948). Samples taken at 42–90 days of age came from suckling lambs. Samples taken at 91–150 days of age came from a mixture of weaned and unweaned lambs, depending on the management of the participating flocks. Management groups were defined by the flock, year, season (based on 30-d rolling birth date windows), and lamb sex, and an optional producer-supplied management code that was used to identify other flock-specific management differences among otherwise contemporary lambs. The FEC were recorded as eggs per gram of feces (epg) but normalized by cube-root transformation before analysis, and FEC EBV on the cube-root scale were derived from a multi-trait animal model (Brown et al., 2007). Estimated heritabilities were 0.27 for WFEC and 0.50 for PFEC, and corresponding additive genetic and residual correlations between WFEC and PFEC were 0.81 and 0.07, respectively (Notter, 2013). No other additive direct or maternal correlations between WFEC or PFEC and other traits were included in the prediction model. Resulting FEC EBV on the cube-root scale were further transformed for reporting to a predicted percentage of the mean FEC EBV, but analyses for the current study used FEC EBV expressed on the cube-root scale. See Notter (2013) and Brown et al. (2007) for additional details of NSIP procedures for recording and analysis of FEC and reporting of FEC EBV.
Screening of Katahdin EBV released on 15 September 2015, identified 329 progeny-tested sires with accuracies of FEC EBV of 0.60 or greater for WFEC and (or) PFEC, and 86 of these rams were located for DNA sampling. Eight additional young rams that were anticipated to produce progeny in 2016 were also sampled. DNA samples were obtained from archived DNA (Gene Check, Inc., Greeley, CO) or from ear tissue or jugular blood that was processed using standard laboratory procedures at the USDA ARS Beltsville Agricultural Research Center, Beltsville, MD. Ten rams were subsequently excluded from the study based on the yield and quality of the DNA, the presence of inconsistencies in the pedigree file, or because anticipated data from 2016 lambs were not submitted to NSIP, leaving 84 progeny-tested rams for further analysis. The FEC EBV for these sires were based on FEC records for 3,272 lambs from 14 flocks. Of these lambs, 1,469 had both weaning and postweaning FEC records, 647 had only WFEC, and 1,156 had only PFEC. The median number of progeny with FEC data was 31 per sire, with a range of 3–149 lambs. Most sires had progeny in only one flock, but 11 sires each had progeny in two flocks, two sires each had progeny in three flocks, and three sires each had progeny in four flocks. Comparisons of EBV for rams evaluated in different flocks therefore in most cases relied on pedigree connections among the flocks.
Based on NSIP Katahdin EBV released on 17 January 2019, means for WFEC and PFEC EBV for the sampled sires were -8.3 and -14.3%, respectively, with ranges of -96.6–241.5% for WFEC and -99.9–387.9% for PFEC. Averages (ranges) for accuracies of FEC EBV were 0.82 (0.50–0.94) for WFEC and 0.86 (0.52–0.96) for PFEC. If reported FEC EBV expressed on the cube-root scale were converted to the original (epg) scale, the reported FEC EBV ranges corresponded to ranges in EBV on the original scale of −483–1,208 epg for WFEC and −499–1,939 epg for PFEC.
The High-Density (600 K) Illumina Ovine SNP BeadChip (Illumina, Inc., San Diego, CA, United States; Kijas et al., 2014) was applied to DNA from the 84 progeny-tested sires. Raw data were analyzed using GenomeStudio V2011.1 and Genotyping Module V.1.9.4. All the 84 rams had call rates of >99% and were included in the final analyses.
The SNP used for this study were required to have minor allele frequencies (MAF) of at least 0.10. This minimum MAF was chosen, in part, because of the small number of sires in the study. A SNP allele with MAF of 0.10 has an expected frequency of homozygous individuals of 0.01, corresponding to less than one individual in our sample of 84 sires. Also, because the Katahdin is a relatively recently formed composite breed, we wished to focus on SNP alleles and associated quantitative trait locus (QTL) alleles that were likely to have originated in the different parental breeds and anticipated to still be segregating at high frequencies. The distribution of MAF before removing alleles with MAF <0.10 is shown in Figure 1. After screening on MAF, an additional 163 duplicate variants were identified and removed, leaving approximately 388,000 SNP for use in the analysis.
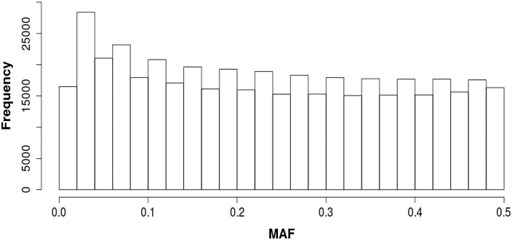
FIGURE 1. Distribution of minor allele frequencies (MAF).
The effect of each SNP was initially evaluated by regressing WFEC and PFEC EBV on the number of occurrences of the most common allele for each SNP (0, 1, or 2) using a single-marker GWAS model. Before analysis, FEC EBV on the cube-root scale were deregressed, to adjust for differences in accuracy of prediction of EBV using procedure described by Garrick et al. (2013). An additive pedigree relationship matrix (A) was incorporated into the analysis using a pedigree file (n = 737) derived from NSIP Katahdin data. The statistical model for each SNP and FEC EBV was:
where Y is a vector of deregressed FEC EBV, β is a vector containing estimates of the intercept and marker effect, a is a vector of additive polygenic random effects with a ∼ N(0, A
The small number of progeny-tested rams and large number of SNP led to high risk of type I error. Interpretation of results therefore initially focused on five regions of the genome that were considered to have high a priori probabilities of containing previously reported genes associated with resistance to gastrointestinal nematodes (Table 1). Three of these regions, identified from the literature, were associated with the interferon gamma gene (IFNγ) on ovine chromosome 3 (Coltman et al., 2001; Beh et al., 2002; Marshall et al.,2009; Sallé et al., 2012; Dominik et al., 2010); the gene for the MHC DR beta chain (DRB1) within the ovine major histocompatibility complex on chromosome 20 (Schwaiger et al., 1995; Janßen et al., 2002; Davies et al., 2006; Marshall et al., 2009; Sallé et al., 2012); and a region on chromosome 6 that included genes for toll-like receptors (TLR) 1, 6, and 10 (Beh et al., 2002; Gutiérrez-Gil et al., 2009). A fourth candidate region on chromosome 2 was associated with FEC in a sample of Katahdin lambs and contained the DIS3 like 3′-5′ exoribonuclease 2 gene (DIS3L2; Becker et al., 2020). The final candidate region was located at 6.8 Mb on chromosome 25 and suggested as a candidate region for parasite resistance by G. L. Spangler (unpublished) based on a mutation in the interferon regulatory factor 2 binding protein 2 (IRF2BP2) gene that was associated with a hair coat in a hair x wool composite sheep breed (Demars et al., 2017). A nearby gene for an RNA regulatory element, TAR (HIV-1) RNA Binding Protein 1 (TARBP1) has been associated with human atutoimmune diseases (Towns and Begley, 2012) and is located at 6.6 Mb on ovine chromosome 25. Each candidate region was defined by a 1-Mb region surrounding the most likely candidate gene(s) in each region (Table 1). To analyze effects of these candidate regions, the genome was subdivided into 2,540 adjacent “bins” of approximately 1 Mb. The effect of a candidate region on FEC EBV was defined as the effect of the most significant individual SNP in the region and tested using Model 1 at p < 0.05 following Bonferroni correction of p = 0.05/5 = 0.01.
After testing effects of the a priori regions, bins containing these regions were excluded from further consideration. Screening of SNP effects on WFEC and PFEC for the remaining 2,535 bins was based on the most-significant SNP within each bin. A Bonferroni correction of p = 0.05/2535 = 1.96 × 10⁻⁵ was used to define bin-based (BB) genome-wide significance. Bin-based chromosome-wide significance was defined as p = 0.05/bi where bi was the number of non-candidate bins on chromosome i.
The final step in the analysis involved regional heritability mapping (RHM; Nagamine et al., 2012; Shirali et al., 2016) to assess the impact of individual regions of the genome on additive variance in deregressed FEC using Genome-wide Complex Trait Analysis (GCTA) software (version 1.93.0; Yang et al., 2011). For RHM, a series of windows containing 1 Mb, 100 sequential SNP, or 500 sequential SNP were selected, with 0.5 Mb, 50 SNP, or 250 SNP overlaps, respectively, between adjacent windows. A whole-genome relationship matrix was constructed from SNP with MAF ≥0.1 using GCTA, and regional genomic relationship matrixes were constructed for each window. Contributions of SNP effects in each window to FEC EBV were evaluated as:
where Y is a vector of deregressed FEC EBV, μ is the population mean, Z and Q are incidence matrices for the whole (without the window) and the regional random effects, respectively, and e is a vector of residuals. The distributions and covariance structures of g and r were g ∼ N(0, G
A single-marker GWAS was also conducted using GCTA with a genomic relationship matrix constructed using SNP with MAF ≥0.1. Each SNP was fitted as a fixed effect using Model 1, and results were compared with those obtained from the bin-based analysis. Genome-wide significance was tested for each SNP at p ≤ 0.05 after Bonferroni correction based on the 388,000 SNP with MAF ≥0.10.
None of the SNP within the five candidate regions had even a nominally significant association with FEC EBV (p > 0.10).
For WFEC, four bins on chromosome 5 and two bins on chromosome 16 achieved BB genome-wide significance, and an additional 59 bins contained SNP with BB chromosome-wide significance. These bins included four additional bins on chromosome 5 and four additional bins on chromosome 16. The remaining 51 bins with BB chromosome-wide significance were scattered among 20 chromosomes, and none were adjacent. For PFEC, six bins on chromosome 5 achieved BB genome-wide significance. No other bins reached this level of significance. However, 48 additional bins, including 13 bins on chromosome 5 and seven bins on chromosome 16, had at least one SNP with BB chromosome-wide significance for PFEC. The remaining 28 bins that reached BB chromosome-wide significance for PFEC EBV were scattered among 16 different chromosomes, and none were adjacent. QQ plots of the distribution of significance levels for SNP for PFEC and WFEC are shown in Figure 2. Based on these patterns of BB significance, further analysis was restricted to sites on chromosomes 5 and 16.
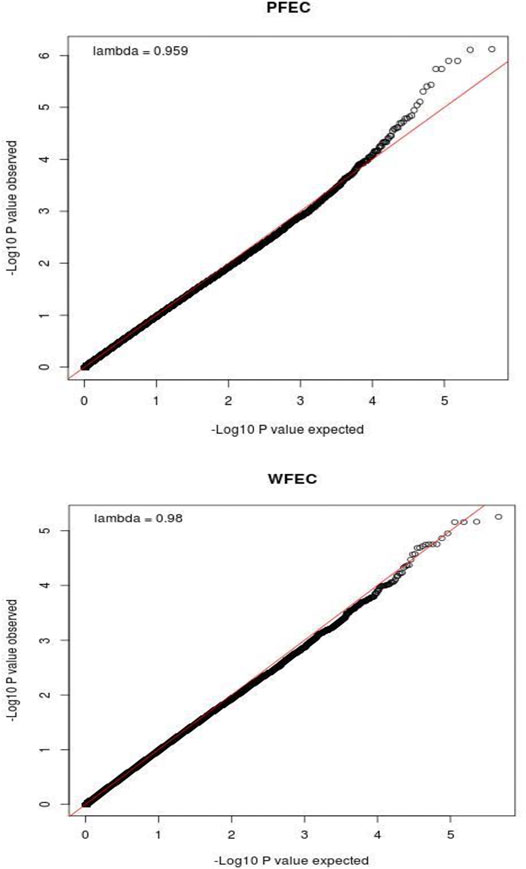
FIGURE 2. QQ plots showing the relationship between observed and expected values for -Log10(P) for postweaning (PFEC) and weaning (WFEC) fecal egg count EBV from the single-SNP genome-wide association study using a pedigree-based relationship matrix. P is the nominal significance level for each SNP.
Several options for SNP pruning or clumping (Marees et al., 2018) were considered in PLINK as alternatives to the bin-based approach. However, as reported by Kijas et al. (2014) for other sheep breeds, generally low levels of LD were observed among SNP in the HD Illumina array. As a result, the pruning and clumping strategies produced only modest reductions in the effective number of independent SNP, yielded Bonferroni-corrected significance levels intermediate to those obtained for the bin-based and individual-SNP analyses and will not be discussed further.
For PFEC EBV (Figure 3), the 19 bins on chromosome 5 that achieved BB chromosome-wide significance included 12 consecutive bins between 59.6 and 71.0 Mb. These bins were imbedded in a larger region that contained 16 bins with BB chromosome-wide significance in a total of 19 bins between 56.1 and 75.0 Mb. Nominal significance levels for the 16 bins ranged from 7.56 × 10⁻⁷ to 3.46 × 10⁻⁴. For WFEC EBV (Figure 3), eight bins on chromosome 5 contained at least one SNP with BB chromosome-wide significance and included six consecutive bins that were a subset of the 12 bins that contained a SNP with BB chromosome-wide significance for PFEC EBV. The eight total bins on chromosome 5 that reached BB chromosome-wide significance for WFEC EBV were likewise nested within the 19-bin region identified for PFEC EBV.
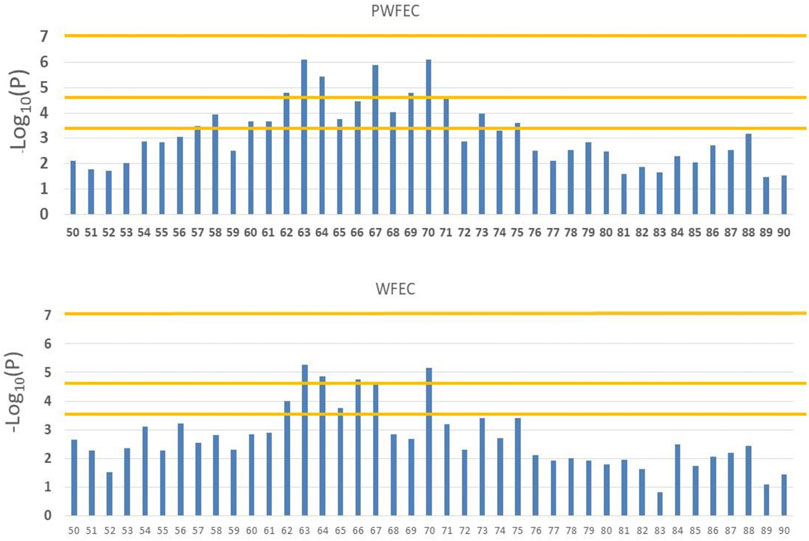
FIGURE 3. Manhattan plots for associations between SNP in bins 50 through 90 on chromosome 5 and weaning (WFEC) and postweaning (PFEC) fecal egg count EBV. Horizontal lines indicate chromosome-wide significance with 2,540 bins (bottom line), genome-wide significance with 2,540 bins (middle line), and genome-wide significance with 458,625 SNP (top line).
Three SNP on chromosome 5 reached chromosome-wide significance at p < 0.05 for PFEC EBV after a more conservative Bonferroni correction based on the 14,530 SNP with MAF ≥0.10 on chromosome 5 (i.e., p = 0.05/14,539 = 3.44 × 10⁻⁶), but none of the SNP on chromosome 5 reached this level of significance for WFEC EBV. Genome-wide significance after Bonferroni correction based on the total of 388,000 SNP with MAF ≥0.10 (p < 1.29 × 10⁻⁷) was not achieved for any individual SNP; the most significant SNP associated with PFEC had a nominal significance level of p = 7.56 × 10⁻⁷.
Individual tests of significance did not consider clumping of SNP with large effects on chromosome 5. After excluding SNP from chromosomes 5 and 16 (i.e., those considered to potentially contain SNP with significant associations with FEC EBV), the probability of obtaining BB chromosome-wide significance for PFEC EBV for two adjacent bins was 1.27 × 10⁻³ for the remaining 2,355 bins. Three adjacent bins with BB chromosome-wide significance did not occur. The estimated likelihood of obtaining 12 consecutive bins with BB chromosome-wide significance was therefore (1.27 × 10⁻³)11 = 1.39 × 10⁻³². This result suggested that the pattern of SNP effects on chromosome 5 differed from that expected under the assumption of a random pattern of BB chromosome-wide significance among adjacent bins. For WFEC EBV, after excluding bins on chromosomes 5 and 16, the probability of BB chromosome-wide significance for pairs of adjacent bins was 4.66 × 10⁻³, and the predicted probability of obtaining six consecutive bins with BB chromosome-wide significance was (4.66 × 10⁻³)5 = 2.20 × 10⁻¹². These results indicated an association with FEC EBV across six to 12 adjacent bins on chromosome 5.
Minor allele frequencies for SNP with the highest nominal significance levels in the 12 bins on chromosome 5 shown in Figure 3 averaged 0.30 and ranged from 0.11 to 0.44, with MAF for 11 of the 12 SNP of >0.21. The average frequency of homozygotes for the minor alleles was 0.33 and ranged from 0.04 to 0.70. The SNP effects for these loci were all negative, indicating that the minor allele was consistently favorable (i.e., reduced FEC EBV).
Linkage disequilibrium (LD) among SNP and associated functional loci can account for clustering of significant SNP. Use of BB statistics reduced, but did not necessarily remove, potential effects of LD among SNP in adjacent bins. For the 12 consecutive bins on chromosome 5 that exhibited BB chromosome-wide significance for PFEC EBV (Figure 3), the largest effects were exhibited for SNP in bins located at 63, 67, and 70 Mb, with lower significance levels for SNP in surrounding bins. Figure 4 shows LD between the most-significant SNP in each of these 12 bins and the most-significant SNP in bins 63, 67, and 70. In agreement with previous results from this high-density ovine SNP array (Kijas et al., 2014), LD on chromosome 5 declined relatively rapidly as the distance between markers increased. The LD between the most-significant markers in bins 63, 67, and 70 were r2 = 0.2 or less, indicating that associations between SNP in these regions and PFEC EBV were not explained by LD among the 12 most relevant markers and associated LD of these markers with a single large functional variant. Instead, the observed patterns of LD and associated significance levels for these markers suggested the presence of three functional sites within the 12 bins. Low levels of LD for these markers also indicated that an attempt to identify unique marker haplotypes across this 12-bin region would not be informative.
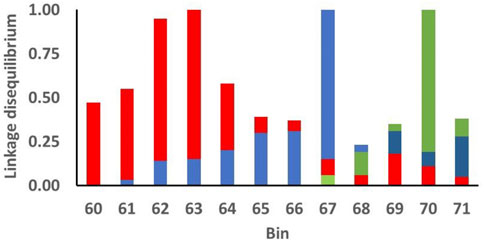
FIGURE 4. Linkage disequilibrium (r2) among the most significant markers for postweaning fecal egg count estimated breeding values (PFEC EBV) in each of the indicated 1-Mb bins on chromosome 5. The x-axis indicates the position (Mb) of each bin on chromosome 5. Bins originating at 63, 67, and 70 Mb contained the individual SNP markers with the most significant associations with the PFEC EBV (Figure 3). For each color, the top of the bar of that color for each bin designates the linkage disequilibrium between the most significant marker in the bin and the most significant marker in bins 63 (red), 67 (blue), and 70 (green). For example, the most significant SNP in bin 71 has LD of 0.04 with the most significant SNP in bin 63 (top of the red bar), LD of 0.28 with the most significant SNP in bin 67 (top of the blue bar), and 0.35 with the most significant SNP in bin 70 (top of the green bar).
Justification for significant effects on FEC EBV for SNP on chromosome 16 was less compelling than that for SNP on chromosome 5. However, BB chromosome-wide significance across adjacent SNP on chromosome 16 and the tendency for SNP on chromosome 16 with BB chromosome-wide significance to have a greater influence on WFEC, compared to PFEC EBV, motivated further consideration of SNP effects on chromosome 16. Bin-based chromosome-wide significance was observed for WFEC EBV for four adjacent bins located between 46.9 and 50.0 Mb on chromosome 16, with nominal significance levels of 1.91 × 10⁻⁵–2.01 × 10⁻⁴. Two of these bins reached BB genome-wide significance. Three adjacent bins in the interval reached BB chromosome-wide significance for PFEC EBV, with nominal significance levels of 2.34 × 10⁻⁴–4.38 × 10⁻⁴. None of these SNP individually reached genome-wide significance based on the 388,000 SNP with MAF ≥0.10 or chromosome-wide significance based on the 9,749 SNP with MAF ≥0.10 on chromosome 16. However, based on probabilities of obtaining adjacent SNP with BB chromosome-wide significance defined in the preceding section, the likelihood of obtaining four consecutive bins with BB chromosome-wide significance for WFEC EBV was (4.66 × 10⁻³)3 = 1.01 × 10⁻⁸. The likelihood of obtaining three consecutive bins with BB chromosome-wide significance for PFEC EBV was (1.27 × 10⁻³)2 = 1.61 × 10⁻⁶. These results suggest a possible association with WFEC EBV across four bins on chromosome 16 but, at best, only a marginal association with PFEC EBV for three adjacent bins in the same region.
Estimates of SNP-based genomic heritabilities for deregressed FEC EBV from Model 2 were 0.90 ± 0.23 for WFEC (p = 0.001) and 0.87 ± 0.23 (p = 0.001) for PFEC. The high estimates of heritability were consistent with the high accuracies of the FEC EBV. For an average EBV accuracy of 0.84, the corresponding heritability of the EBV (i.e., of the progeny mean FEC) was expected to be the square root of the accuracy, or 0.92, which was consistent with the observed values. Results of the SSGWAS using the genomic relationship matrix and all SNP with MAF ≥0.10 were consistent with the BB GWAS. None of the SNP reached the Bonferroni-corrected 5% significance level for WFEC or PFEC EBV. The Q-Q and Manhattan plots for the SSGWAS are shown in Supplementary Figures S1, S2.
The RHM detected one 500-SNP window located between 65.9 and 69.9 Mb on chromosome 5 that reached Bonferroni-corrected genome-wide significance for PFEC EBV. Five additional adjacent, overlapping windows on chromosome 5 achieved suggestive significance for PFEC EBV, and one of the windows achieved suggestive significance for WFEC EBV (Table 2). All six of these regions were within the region of interest identified by the BB analysis (Figure 3). The RHM also identified a 500-SNP region on chromosome 16 that reached a suggestive level of significance for WFEC EBV and corresponded to regions identified by the BB analysis (Table 2). Three overlapping regions on chromosome 20 also achieved suggestive significance for WFEC EBV (Table 2). This region was not previously identified in the BB analysis and did not correspond to the candidate region on chromosome 20 in Table 1.
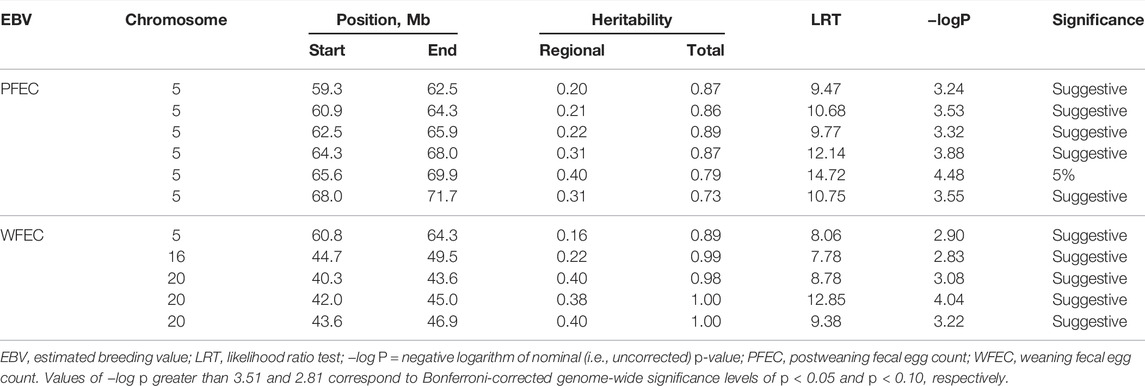
TABLE 2. Summary statistics of the regional heritability analysis using 500-SNP windows.
This study provided evidence of an association between PFEC EBV in progeny-tested Katahdin rams and a series of SNP on ovine chromosome 5. The study involved only 84 rams, but FEC EBV were derived from 3,272 phenotyped progeny from 14 flocks.
For PFEC, nominal significance levels of 7.56 × 10⁻⁷–3.46 × 10⁻⁴ and Bonferroni-corrected chromosome-wide BB significance levels of p < 0.05 were achieved for the most significant SNP in 12 adjacent 1-Mb bins on chromosome 5. However, after Bonferroni adjustment, none of the SNP achieved genome-wide significance in either the bin-based analysis in ASREML or the individual-SNP analysis in GCTA. Results of single-marker regression analysis do not, however, explicitly consider clumping of significant, or near-significant, SNP in specific regions of the genome. Localization of influential SNP in specific regions can result from linkage of closely associated SNP with one or more QTL. However, the presence of apparently influential SNP across a 12-Mb region on chromosome 5 could not be explained by simple LD with a single influential QTL. For an additive model of QTL effects, patterns of LD across this region (Figure 4) instead indicated the presence of three potential QTL within the region.
Regional heritability mapping was used to assess associations between specific regions of the genome and PFEC EBV. Regional heritability mapping is inferior to single-marker GWAS for detection and localization of individual QTL but facilitates identification of potentially important regions of the genome. Regional heritability mapping has been shown to be superior to single-marker GWAS for detection of genomic regions that contain multiple QTL with small to modest individual additive or epistatic effects (Uemoto et al., 2013; Shirali et al., 2016). Results of RHM indicated that the region of interest on chromosome 5 accounted for a substantial proportion of the observed variation in PFEC EBV. An association with parasite resistance in sheep has not been previously reported for this region of chromosome 5. However, a study of Katahdin lambs using a 50K Illumina SNP array (Becker et al., 2020) identified a SNP at 73.0 Mb on ovine chromosome 5 that achieved an association with FEC with a nominal significance level of 5.23 × 10⁻⁶ from a single-locus linear regression model. However, this SNP had only a suggestive genome-wide significance level (p < 0.10) in those data.
The power of RHM to detect putative QTL loci was demonstrated in an analysis of EBV for milk production using 2,590 Japanese Holstein bulls (Gervais et al., 2017). In that study, single-SNP regression identified significant SNP for milk and fat yield only on chromosome 14, in the region known to be associated with the DGAT1 gene (Grisart et al., 2002). No significant SNP were identified for protein yield. By contrast, RHM identified a significant region common to all three traits on bovine chromosome 14, as well as significant regions for fat yield on chromosome 5 and protein yield on chromosome 18.
In sheep, Al Kalaldeh et al. (2019) analyzed FEC in a multi-breed population of 7,339 Australian lambs. Single-SNP regression identified only three significant SNP, all within a 3.4 Mb region on chromosome 2 and with false-discovery rates (FDR) of 0.02–0.03. Regional heritability mapping with 200, 500 or 1,000 SNP windows all confirmed a significant association with FEC for corresponding regions on chromosome 2. The 1,000-SNP RHM allowed coalescence of the previously identified SNP into a single 12.2 Mb region with a FDR of ≤0.003. The RHM also identified three progressively overlapping 1,000-SNP windows in a 9.7 Mb region of chromosome 6 with FDR of ≤0.019.
Comprehensive meta-analyses of GWAS of parasite resistance in sheep have not yet been conducted. However, Riggio et al. (2014) used RHM for meta-analysis of three studies involving Scottish Blackface (Riggio et al., 2013), Sarda x Lacaune (Sechi et al., 2009), and Martinik Blackbelly x Romane (Sallé et al., 2012) lambs. The studies differed in the type of infection (natural versus artificial) and the predominant helminth genera (predominantly Strongyle nematodes versus a combination of Strongyle and Nematodirus species). The RHM supported a role for a region within the ovine MHC on chromosome 20 across the three studies. A significant region was also identified on chromosome 14 but appeared to be specific to Nematodirus FEC.
In the current study, large minor-allele frequencies in the region of interest on chromosome 5 suggested that favorable SNP alleles were either segregating at relatively high frequencies in more than one parent breed or were derived primarily from one of the ancestral breeds. Minor allele effects were consistently negative (i.e., favorable for FEC) within the region of interest, and, based on these results, we hypothesized, but could not test further, that favored chromosome segments on chromosome 5 may have originated in the parasite-resistant hair sheep ancestor of the Katahdin breed. We acknowledge, however, that the power to detect informative markers is positively associated with MAF and that our design simply may not have been able to detect informative markers that were present at lower MAF.
The region between 59.6 and 71.0 Mb on chromosome 5 that was identified in our study contains several candidate genes that may affect innate and acquired immunity. Among well-characterized functional genes, IL12B at 68.5 Mb on chromosome 5 codes for the p40 subunit of both interleukin (IL)-12 and IL-23. Structural changes in IL12B thus can affect the function of both IL-12 and IL-23. These cytokines promote T-helper (Th) type 1 cell differentiation and secretion of IFNγ (Watford et al., 2004). Changes in IL12B that result in down-regulation of IFNγ may therefore favor Th2 cell differentiation. Administration of anti-IL-23 antibodies prevented implantation of intestinal nematodes in mice (Gomez-Samblas et al., 2018).
Hair sheep lambs of primarily St. Croix ancestry that were artificially infected with H. contortus at 120–150 days of age and compared to lambs of a composite (50% Dorset, 25% Rambouillet, 25% Finnish Landrace) wool-sheep line had lower expression of IL12A (i.e., the p35 subunit of IL-12 and IL-23) in abomasal tissue and lower expression of IFNγ in lymph nodes at 3 days after infection (MacKinnon et al., 2009). These results, and those of the current study, suggest that stimulation of a Th2 immune response and down-regulation of IFNγ may be achieved by the action of genetic variants that influence secretion of IL-12 and IL-23.
A second functional gene, IL17B, is located at 58.2 Mb on chromosome 5, just outside the core 12-bin region on chromosome 5 associated with PFEC EBV but within the larger 19-bin region that contained 16 SNP markers that achieved BB chromosome-wide significance. IL17B codes for IL-17B, which is a member of the IL-17 cytokine superfamily (Bie et al., 2017) and is involved in the Th17 pattern of T-cell differentiation. The role of IL-17 and associated Th17 cells in sheep is gradually emerging (McRae et al., 2015). In mice, a Th17 immune response was required for the hypercontractility of intestinal muscle involved in expulsion of Trichinella spiralis from the gastrointestinal tract (Steel et al., 2019).
The region in question also contains regulatory genes that may influence immune function. The early B-cell transcription factor (Ebf-1) gene at 73.2 Mb 5 codes for early B-cell transcription factor 1 (EBF1). In the mouse, EBF1 is essential for B-cell commitment, development and maintenance, and immune responses were severely reduced by Ebf1 inactivation (Vilagos et al., 2012). SNP variants in Ebf1 were likewise associated with IL-12 p40 blood levels in humans with Stage I melanoma, and SNP in both IL17B and Ebf1 were associated with melanoma susceptibility and patient outcomes (Fang et al., 2015). Ebf1 regulates genes by activation and repression, modulating chromatin structure, and histone dimethylation (Treiber et al., 2010; Hagman et al., 2012; Boller and Grosschedl, 2014).
Larp1, at 63.7 Mb on ovine chromosome 5, interacted with Mtorc1 to influence T-cell metabolism and differentiation and control early B-cell development, survival, and metabolism in mice (Iwata et al., 2016). Differences in expression of the CCR4-NOT transcription complex subunit 8 (Cnot8) gene, located at 63.8 Mb on ovine chromosome 5, were observed in association with intestinal inflammation associated with inflammatory bowel disease in humans (Yuan et al., 2017).
The hydroxytryptamine receptor 4 (Htr4) gene is located at 57.6 Mb on ovine chromosome 5. Hydroxytryptamine (5-HT), commonly known as serotonin, is stored at peripheral sites in mast cells and released following cross-linking with immunoglobulin E. Stimulation of HTR4 enhanced release of IL-1β and IL-8 and reduced secretion of IL-12 and TNF-α in mature human dendritic cells (Idzko et al., 2004).
The inducible T-cell kinase (Itk) gene is located at 66.1 Mb on ovine chromosome 5 and is essential for various T-cell functions, especially during a Th2 response in mice (Broussard et al., 2006) and humans (Ghosh et al., 2018). A key role has also been shown for Itk in production of both IFNγ and IL-4 by natural killer cells in mice (Au-Yeung and Fowell, 2007). Expression of the cytoplasmic FMR1 interacting protein 2 (Cyfip2) gene, which is adjacent to Itk at 66.4 Mb on chromosome 5, was associated with T-cell adhesion in humans (Mayne et al., 2004).
Another interesting candidate gene is glutamate ionotropic receptor AMPA type subunit 1 (Gria1). Gria1 is located at 62.5 Mb on ovine chromosome 5 and associated with asparaginase hypersensitivity in humans (Chen et al., 2010). The context of that study was to investigate the genetic basis for allergic reactions which occur in up to 45% of patients receiving asparaginase derived from Escherichia coli or Erwinia chrysanthemi for treatment of childhood acute lymphoblastic leukemia. Asparaginase is present in the cuticle of several helminth parasites and was proposed as a vehicle for inducing immunity to Dirofilaria immitis, which causes heartworm disease in dogs (Chandrashekar and Tsuji, 2000). These studies provide a potential mechanism whereby genetic variation in asparaginase sensitivity could influence parasite immunity.
In contrast to results for chromosome 5, no obvious candidate genes were present in the region of chromosome 16 associated with WFEC EBV. The region between 46.7 and 51.7 Mb contains genes that code for three members of the cadhedrin superfamily (Cdh9, Cdh10, and Cdh12) which, in common with other protocadhedrins, mediate cell-cell adhesion. Protocadhedrins have not been shown to have an explicit role in parasite immunity but are involved in cellular apoptosis (Pancho et al., 2020).
In the current study, power to detect significant marker associations with FEC by GWAS was limited by the small number of available sires but was to some extent compensated for by use of EBV (rather than individual phenotypes) to reduce residual errors associated with individual observations and by focusing on SNP with relatively high MAF. The latter approach excluded rare genomic variants from consideration but was justified in this relatively recently formed composite breed in order to focus on the impacts of higher-frequency alleles contributed by parasite-resistant and parasite-susceptible founder breeds. In addition, RHM provided opportunity to account for apparent clumping of marginally significant individual SNP on chromosome 5, thereby detecting a significant influence on FEC for a candidate region that had not been previously identified but included potentially important functional and regulatory genes. We acknowledge that high Type II error may have accounted, in part, for our failure to detect significant effects for any of our five a priori candidate regions. We also acknowledge that limited power to detect a full spectrum of informative SNP likely contributed to the apparent dominant role of chromosome 5 in accounting for additive variation in PFEC. However, our results nevertheless unambiguously supported an association with GIN resistance in Katahdin sheep for the identified region on chromosome 5. Further study of this region is necessary to identify specific candidate loci that affect parasite resistance. Results in Figure 3 suggest the presence of three separate informative SNP in the region, but more complex causal relationships involving epistatic interactions among structural and regulatory loci may also be present.
Apparent inconsistencies among studies designed to identify informative SNP markers for resistance to GIN in sheep can arise from insufficient power to detect widely distributed QTL variants with small to modest individual effects on GIN resistance or from differences among breeds in the genetic architecture controlling GIN resistance. Our attempt to accommodate our limited number of available progeny-tested sires by a priori identification of candidate regions associated with GIN resistance from the literature was not successful. This outcome was consistent with previous assertions (McManus et al., 2014; Al Kalaldeh et al., 2019) that GIN resistance is mainly under polygenic control. A review of the genetics of helminth resistance in sheep (Karrow et al., 2014) highlights the myriad functional and regulatory pathways that are potentially involved in GIN resistance and provides conceptual support for both polygenic control and potential breed differences in genetic control of GIN resistance. Among livestock species, methods for genomic prediction are most highly developed for milk production in Holstein dairy cattle (Jiang et al., 2019), with predictions of additive genetic merit based on relatively dense SNP arrays to properly identify and weight putative associations with largely anonymous QTL. Yet even here, relatively few influential SNP markers have been unambiguously associated with specific functional or regulatory loci (Weller et al., 2018), and multi-breed genomic evaluations are still being developed (Van Raden et al., 2020; Cesarani et al., 2022). These results suggest that genomic prediction of additive genetic merit for GIN resistance in sheep will require SNP arrays that provide relatively comprehensive coverage of the genome and have sufficient power to address potential breed-specific structuring of informative markers and underlying QTL.
The datasets presented in this study can be found in online repositories. The names of the repository/repositories and accession number(s) can be found below: Animal-GRIN; https://agrin.ars.usda.gov/main_webpage_dev/ars.
Ethical review and approval was not required for the animal study because the study used only DNA collected on private farms and data derived from an industry data base. Written informed consent for participation was not obtained from the owners because the owners collected blood samples from the animals for DNA extraction.
JB, DN, JLM, and JEM contributed to conception and design of the study. JB, JLM, and DN identified the sires and arranged acquisition of DNA samples. TS and GS performed necessary laboratory procedures. GS, TS, MH, BM, and GB assisted with screening and organization of the data. MH, MS, GM, MM, and DN performed the statistical analysis. DN, MH, and MS wrote the first draft of the manuscript, with assistance from JB, TS, GS, and JLM. All authors contributed to manuscript revision and read and approved the submitted version.
This research was funded by the USDA NIFA Organic Agriculture Research and Extension Initiative grants no. 2016-51300-25723 and 2010-51300-21641, and USDA Southern SARE grant no. LS08-204.
The findings and conclusion in this publication are those of the authors and should not be construed to represent any official USDA or US Government determination or policy. Mention of trade names or commercial products in this publication is solely for the purpose of providing specific information and does not imply recommendation or endorsement by the US Department of Agriculture.
Author JLM is the co-owner of Round Mountain Consulting. Author TS is employed by Acceligen. Author MM is the owner of Delta G.
The remaining authors declare that the research was conducted in the absence of any commercial or financial relationships that could be construed as a potential conflict of interest.
All claims expressed in this article are solely those of the authors and do not necessarily represent those of their affiliated organizations, or those of the publisher, the editors and the reviewers. Any product that may be evaluated in this article, or claim that may be made by its manufacturer, is not guaranteed or endorsed by the publisher.
The authors gratefully acknowledge the contributions of the Katahdin sheep breeders who provided DNA samples and the assistance of Gene Check, Inc. to access archived Katahdin DNA. The US National Sheep Improvement Program provided access to, and assisted in screening of, Katahdin estimated breeding values.
The Supplementary Material for this article can be found online at: https://www.frontiersin.org/articles/10.3389/fgene.2022.866176/full#supplementary-material
Al Kalaldeh, M., Gibson, J., Lee, S. H., Gondro, C., and van der Werf, J. H. J. (2019). Detection of Genomic Regions Underlying Resistance to Gastrointestinal Parasites in Australian Sheep. Genet. Sel. Evol. 51, 37. doi:10.1186/s12711-019-0479-1
Au-Yeung, B. B., and Fowell, D. J. (2007). A Key Role for Itk in Both IFNγ and IL-4 Production by NKT Cells. J. Immunol. 179, 111–119. doi:10.4049/jimmunol.179.1.111
Becker, G. M., Burke, J. M., Lewis, R. M., Miller, J. E., Morgan, J. L. M., Rosen, B. D., et al. (2022). Variants within Genes EDIL3 and ADGRB3 Are Associated with Divergent Fecal Egg Counts in Katahdin Sheep at Weaning. Front. Genet. 13, 817319. doi:10.3389/fgene.2022.817319
Becker, G. M., Davenport, K. M., Burke, J. M., Lewis, R. M., Miller, J. E., Morgan, J. L. M., et al. (2020). Genome‐wide Association Study to Identify Genetic Loci Associated with Gastrointestinal Nematode Resistance in Katahdin Sheep. Anim. Genet. 51, 330–335. doi:10.1111/age.12895
Beh, K. J., Hulme, D. J., Callaghan, M. J., Leish, Z., Lenane, I., Windon, R. G., et al. (2002). A Genome Scan for Quantitative Trait Loci Affecting Resistance toTrichostrongylus Colubriformisin Sheep. Anim. Genet. 33, 97–106. doi:10.1046/j.1365-2052.2002.00829.x
Benavides, M. V., Sonstegard, T. S., and Van Tassell, C. (2016). Genomic Regions Associated with Sheep Resistance to Gastrointestinal Nematodes. Trends Parasitol. 32, 470–480. doi:10.1016/j.pt.2016.03.007
Berton, M. P., de Oliveira Silva, R. M., Peripolli, E., Stafuzza, N. B., Martin, J. F., Álvarez, M. S., et al. (2017). Genomic Regions and Pathways Associated with Gastrointestinal Parasites Resistance in Santa Inês Breed Adapted to Tropical Climate. J. Anim. Sci Biotechnol 8, 73. doi:10.1186/s40104-017-0190-4
Bie, Q., Jin, C., Zhang, B., and Dong, H. (2017). IL-17B: A New Area of Study in the IL-17 Family. Mol. Immunol. 90, 50–56. doi:10.1016/j.molimm.2017.07.004
Bishop, S. C., and Woolliams, J. A. (2014). Genomics and Disease Resistance Studies in Livestock. Livestock Sci. 166, 190–198. doi:10.1016/j.livsci.2014.04.034
Boller, S., and Grosschedl, R. (2014). The Regulatory Network of B‐cell Differentiation: a Focused View of Early B‐cell Factor 1 Function. Immunol. Rev. 261, 102–115. doi:10.1111/imr.12206
Broussard, C., Fleischecker, C., Horai, R., Chetana, M., Venegas, A. M., Sharp, L. L., et al. (2006). Altered Development of CD8+ T Cell Lineages in Mice Deficient for the Tec Kinases Itk and Rlk. Immunity 25, 93–104. doi:10.1016/j.immuni.2006.05.011
Brown, D. J., Huisman, A. E., Swan, A. A., Graser, H-U., Woolaston, R. R., Ball, A. J., et al. (2007). Genetic Evaluation for the Australian Sheep Industry. Proc. Assoc. Adv. Anim. Breed. Genet. 17, 187–194.
Cesarani, A., Lourenco, D., Tsuruta, S., Legarra, A., Nicolazzi, E. L., VanRaden, P. M., et al. (2022). Multibreed Genomic Evaluation for Production Traits of Dairy Cattle in the United States Using Single-step Genomic Best Linear Unbiased Predictor. J. Dairy Sci. 1, 1. (In press). doi:10.3168/jds.2021-21505
Chandrashekar, R., and Tsuji, N. (2000). Parasitic Helminth Asparaginase Proteins, Nucleic Acid Molecules, and Uses Thereof. U.S. Patent No 6,165,735. Washington, DC: U.S. Patent and Trademark Office.
Chen, S.-H., Pei, D., Yang, W., Cheng, C., Jeha, S., Cox, N. J., et al. (2010). Genetic Variations in GRIA1 on Chromosome 5q33 Related to Asparaginase Hypersensitivity. Clin. Pharmacol. Ther. 88, 191–196. doi:10.1038/clpt.2010.94
Coltman, D. W., Wilson, K., Pilkington, J. G., Stear, M. J., and Pemberton, J. M. (2001). A Microsatellite Polymorphism in the Gamma Interferon Gene Is Associated with Resistance to Gastrointestinal Nematodes in a Naturally-Parasitized Population of Soay Sheep. Parasitology 122, 571–582. doi:10.1017/s0031182001007570
Davies, G., Stear, M. J., Benothman, M., Abuagob, O., Kerr, A., Mitchell, S., et al. (2006). Quantitative Trait Loci Associated with Parasitic Infection in Scottish Blackface Sheep. Heredity 96, 252–258. doi:10.1038/sj.hdy.6800788
Demars, J., Cano, M., Drouilhet, L., Plisson-Petit, F., Bardou, P., Fabre, S., et al. (2017). Genome-wide Identification of the Mutation Underlying Fleece Variation and Discriminating Ancestral Hairy Species from Modern Woolly Sheep. Mol. Biol. Evol. 34, 1722–1729. doi:10.1093/molbev/msx114
Dominik, S., Hunt, P. W., McNally, J., Murrell, A., Hall, A., and Purvis, I. W. (2010). Detection of Quantitative Trait Loci for Internal Parasite Resistance in Sheep. I. Linkage Analysis in a Romney×Merino Sheep Backcross Population. Parasitology 137, 1275–1282. doi:10.1017/S003118201000020X
Fang, S., Wang, Y., Chun, Y. S., Liu, H., Ross, M. I., Gershenwald, J. E., et al. (2015). Association of Common Genetic Polymorphisms with Melanoma Patient IL-12p40 Blood Levels, Tisk, and Outcomes. J. Invest. Dermatol. 135, 2266–2272. doi:10.1038/jid.2015.138
Garrick, D. J., and Fernando, R. L. (2013). “Implementing a QTL Detection Study (GWAS) Using Genomic Prediction Methodology,” in Genome-Wide Association Studies and Genomic Prediction. Editors C. Gondro, J. Van der Werf, and B. J. Hayes (New York: Springer), 275–298. doi:10.1007/978-1-62703-447-0_11
Gervais, O., Pong-Wong, R., Navarro, P., Haley, C. S., and Nagamine, Y. (2017). Antagonistic Genetic Correlations for Milking Traits within the Genome of Dairy Cattle. Plos One 12, e0175105. doi:10.1371/journal.pone.0175105
Ghosh, S., Drexler, I., Bhatia1, S., Adler, H., Gennery, A. R., and Borkhardt, A. (2018). Interleukin-2-inducible T-Cell Kinase Deficiency—New Patients, New Insight? Front. Immunol. 9, 979. doi:10.3389/fimmu.2018.00979
Gilmour, A., Gogel, R. B. J., Cullis, B. R., and Thompson, R. (2014). ASReml User Guide Release 4.1. Hempstead, UK: VSN International, Ltd.
Gomez-Samblas, M., Bernal, D., Bolado-Ortiz, A., Vilchez, S., Bolás-Fernández, F., Espino, A. M., et al. (2018). Intraperitoneal Administration of the anti-IL-23 Antibody Prevents the Establishment of Intestinal Nematodes in Mice. Sci. Rep. 8, 7787. doi:10.1038/s41598-018-26194-x
Grisart, B., Coppieters, W., Farnir, F., Karim, L., Ford, C., Berzi, P., et al. (2002). Positional Candidate Cloning of a QTL in Dairy Cattle: Identification of a Missense Mutation in the Bovine DGAT1 Gene with Major Effect on Milk Yield and Composition. Genome Res. 12, 222–231. doi:10.1101/gr.224202
Gutiérrez-Gil, B., Pérez, J., Álvarez, L., Martinez-Villadares, M., dela Fuente, L.-F., Bayón, Y., et al. (2009). Quantitative Trait Loci for Resistance to Trichostrongylid Infection in Spanish Churra Sheep. Genet. Sel. Evol. 41, 46. doi:10.1186/1297-9686-41-46
Hagman, J., Ramírez, J., and Lukin, K. (2012). “B Lymphocyte Lineage Specification, Commitment and Epigenetic Control of Transcription by Early B Cell Factor 1,” in Epigenetic Regulation of Lymphocyte Development. Editor C. Murre (Berlin: Spangler), 17–38.
Idzko, M., Panther, E., Stratz, C., Müller, T., Bayer, H., Zissel, G., et al. (2004). The Serotoninergic Receptors of Human Dendritic Cells: Identification and Coupling to Cytokine Release. J. Immunol. 172, 6011–6019. doi:10.4049/jimmunol.172.10.6011
Iwata, T. N., Ramírez, J. A., Tsang, M., Park, H., Margineantu, D. H., Hockenbery, D. M., et al. (2016). Conditional Disruption of Raptor Reveals an Essential Role for mTORC1 in B Cell Development, Survival, and Metabolism. J. Immunol. 197, 2250–2260. doi:10.4049/jimmunol.1600492
Janßen, M., Weimann, C., Gauly, M., and Erhardt, G. (2002). “Associations between Infections with Haemonchus contortus and Genetic Markers on Ovine Chromosome 20,” in Proc. 7th World Congr. Genet. Appl. Livestock Prod., Montpellier, France. CD-ROM Commu.No. 28-09.
Jiang, J., Ma, L., Prakapenka, D., VanRaden, P. M., Cole, J. B., and Da, Y. (2019). A Large-Scale Genome-wide Association Study in U.S. Holstein Cattle. Front. Genet. 10, 412. doi:10.3389/fgene.2019.00412
Karrow, N. A., Goliboski, K., Stonos, N., Schenkel, F., and Peregrine, A. (2014). Review: Genetics of Helminth Resistance in Sheep. Can. J. Anim. Sci. 94, 1–9. doi:10.4141/CJAS2013-036
Kijas, J. W., Porto-Neto, L., Dominik, S., Reverter, A., Bunch, R., McCulloch, R., et al. (2014). Linkage Disequilibrium over Short Physical Distances Measured in Sheep Using a High-Density SNP Chip. Anim. Genet. 45, 754–757. doi:10.1111/age.12197
MacKinnon, K. M., Burton, J. L., Zajac, A. M., and Notter, D. R. (2009). Microarray Analysis Reveals Differences in Gene Expression Profiles of Hair and Wool Sheep Infected with Haemonchus contortus. Vet. Immunol. Immunopath. 130, 210–220. doi:10.1016/j.vetimm.2009.02.013
Maqbool, L., Wani, Z. A., Shahardar, R. A., Allaie, L. M., and Shah, M. M. (2017). Integrated Parasite Management with Special Reference to Gastro-Intestinal Nematodes. J. Parasite Dis. 41, 1–8. doi:10.1007/s12639-016-0765-6
Marees, A. T., de Kluiver, H., Stringer, S., Vorspan, F., Curis, E., Marie‐Claire, C., et al. (2018). A Tutorial on Conducting Genome‐wide Association Studies: Quality Control and Statistical Analysis. Int. J. Meth. Psychiatr. Res. 27, e1608. doi:10.1002/mpr.1608
Marshall, K., Mugambi, J. M., Nagda, S., Sonstegard, T. S., Van Tassell, C. P., Baker, R. L., et al. (2012). Quantitative Trait Loci for Resistance to Haemonchus contortus Artificial challenge in Red Maasai and Dorper Sheep of East Africa. Anim. Genet. 44, 285–295. doi:10.1111/j.1365-2052.2012.02401.x
Marshall, K., Maddox, J. F., Lee, S. H., Zhang, Y., Kahn, L., Graser, H.-U., et al. (2009). Genetic Mapping of Quantitative Trait Loci for Resistance to Haemonchus contortus in Sheep. Anim. Genet. 40, 262–272. doi:10.1111/j.1365-2052.2008.01836.x
Mayne, M., Moffatt, T., Kong, H., McLaren, P. J., Fowke, K. R., Becker, K. G., et al. (2004). CYFIP2 Is Highly Abundant in CD4+ Cells from Multiple Sclerosis Patients and Is Involved in T Cell Adhesion. Eur. J. Immunol. 34, 1217–1227. doi:10.1002/eji.200324726
McManus, C., Paim, T. P., de Melo, C. B., Brasil, B. S. A. F., and Paiva, S. R. (2014). Selection Methods for Resistance to and Tolerance of Helminths in Livestock. Parasite 21, 56. doi:10.1051/parasite/2014055
McRae, K. M., Stear, M. J., Good, B., and Keane, O. M. (2015). The Host Immune Response to Gastrointestinal Nematode Infection in Sheep. Parasite Immunol. 37, 605–613. doi:10.1111/pim.12290
Nagamine, Y., Pong-Wong, R., Navarro, P., Vitart, V., Hayward, C., Rudan, I., et al. (2012). Localising Loci Underlying Complex Trait Variation Using Regional Genomic Relationship Mapping. PLoS One 7, e46501. doi:10.1371/journal.pone.0046501
Ngere, L., Burke, J. M., Morgan, J. L. M., Miller, J. E., and Notter, D. R. (2018). Genetic Parameters for Fecal Egg Counts and Their Relationship with Body Weights in Katahdin Lambs. J. Anim. Sci. 96, 1590–1599. doi:10.1093/jas/sky064
Notter, D. R. (2013). “Selection for Parasite Resistance,” in Proc. XL Reunión de la Asociación Mexicana para la Producción Animal y la Seguridad Alimentaria y IX Seminario Internacional de Producción de Ovinos en el Trópico, Villahermosa, Mexico (Tabasco, Villahermosa, Mexico: Universidad Juárez Autónoma de Tabasco), 3–12. https://www.researchgate.net/profile/David_Notter/files.
Pancho, A., Aerts, T., Mitsogiannis, M. D., and Seuntjens, E. (2020). Protocadherins at the Crossroad of Signaling Pathways. Front. Mol. Neurosci. 13, 117. doi:10.3389/fnmol.2020.00117
Pickering, N. K., Auvray, B., Dodds, K. G., and McEwan, J. C. (2015). Genomic Prediction and Genome-wide Association Study for Dagginess and Host Internal Parasite Resistance in New Zealand Sheep. BMC Genomics 16, 958. doi:10.1186/s12864-015-2148-2
Riggio, V., Matika, O., Pong-Wong, R., Stear, M. J., and Bishop, S. C. (2013). Genome-wide Association and Regional Heritability Mapping to Identify Loci Underlying Variation in Nematode Resistance and Body Weight in Scottish Blackface Lambs. Heredity 110, 420–429. doi:10.1038/hdy.2012.90
Riggio, V., Pong-Wong, R., Salle, G., Usai, M. G., Casu, S., Moreno, C. R., et al. (2014). A Joint Analysis to Identify Loci Underlying Variation in Nematode Resistance in Three European Sheep Populations. J. Anim. Breed. Genet. 131, 426–436. doi:10.1111/jbg.12071
Sallé, G., Jacquiet, P., Gruner, L., Cortet, J., Sauvé, C., Prévot, F., et al. (2012). A Genome Scan for QTL Affecting Resistance to Haemonchus contortus in Sheep. J. Anim. Sci. 90, 4690–4705. doi:10.2527/jas.2012-5121
Schwaiger, F.-W., Gostomski, D., Stear, M. J., Duncan, J. L., McKellar, Q. A., Epplen, J. T., et al. (1995). An Ovine Major Histocompatibility Complex DRB1 Allele Is Associated with Low Faecal Egg Counts Following Natural, Predominantly Ostertagia Circumcinta Infection. Intern. J. Parasitol. 25, 815–822. doi:10.1016/0020-7519(94)00216-b
Sechi, S., Salaris, S., Scala, A., Rupp, R., Moreno, C., Bishop, S. C., et al. (2009). Estimation of (Co)variance Components of Nematode Parasites Resistance and Somatic Cell Count in Dairy Sheep. Ital. J. Anim. Sci. 8, 156–158. doi:10.4081/ijas.2009.s2.156
Shirali, M., Pong-Wong, R., Navarro, P., Knott, S., Hayward, C., Vitart, V., et al. (2016). Regional Heritability Mapping Method Helps Explain Missing Heritability of Blood Lipid Traits in Isolated Populations. Heredity 116, 333–338. doi:10.1038/hdy.2015.107
Silva, M. V. B., Sonstegard, T. S., Hanotte, O., Mugambi, J. M., Garcia, J. F., Nagda, S., et al. (2011). Identification of Quantitative Trait Loci Affecting Resistance to Gastrointestinal Parasites in a Double Backcross Population of Red Maasai and Dorper Sheep. Anim. Genet. 43, 63–71. doi:10.1111/j.1365-2052.2011.02202.x
Steel, N., Faniyi, A. A., Rahman, S., Swietlik, S., Czajkowska, B. I., Chan, B. T., et al. (2019). Tgfβ-Activation by Dendritic Cells Drives Th17 Induction and Intestinal Contractility and Augments the Expulsion of the Parasite Trichinella spiralis in Mice. PLoS Pathog. 15, e1007657. doi:10.1371/journal.ppat.1007657
Towns, W. L., and Begley, T. J. (2012). Transfer RNA Methytransferases and Their Corresponding Modifications in Budding Yeast and Humans: Activities, Predications, and Potential Roles in Human Health. DNA Cel Biol 31, 434–454. doi:10.1089/dna.2011.1437
Treiber, T., Mandel, E. M., Pott, S., Györy, I., Firner, S., Liu, E. T., et al. (2010). Early B Cell Factor 1 Regulates B Cell Gene Metworks by Activation, Repression, and Transcription-independent Poising of Chromatin. Immunity 32, 714–725. doi:10.1016/j.immuni.2010.04.013
Uemoto, Y., Pong-Wong, R., Navarro, P., Vitar, V., Hayward, C., Wilson, J. F., et al. (2013). The Power of Regional Heritability Analysis for Rare and Common Variant Detection: Simulations and Application to Eye Biometrical Traits. Front. Genet. 4, 232. doi:10.3389/fgene.2013.00232
Van Raden, P. M., Tooker, M. E., Chud, T. C. S., Norman, H. D., Megonigal, J. H., Haagen, I. W., et al. (2020). Genomic Predictions for Crossbred Dairy Cattle. J. Dairy Sci. 103, 1620–1631. doi:10.3168/jds.2019-16634
Vanimisetti, H. B., Greiner, S. P., Zajac, A. M., and Notter, D. R. (2004). Performance of Hair Sheep Composite Breeds: Resistance of Lambs to Haemonchus contortus. J. Anim. Sci. 82, 595–604. doi:10.2527/2004.822595x
Vilagos, B., Hoffmann, M., Souabni, A., Sun, Q., Werner, B., Medvedovic, J., et al. (2012). Essential Role of EBF1 in the Generation and Function of Distinct Mature B Cell Types. J. Exp. Med. 209, 775–792. doi:10.1084/jem.20112422
Watford, W. T., Hissong, B. D., Bream, J. H., Kanno, Y., Muul, L., and O’Shea, J. J. (2004). Signaling by IL-12 and IL-23 and the Immunoregulatory Roles of STAT4. Immunol. Rev. 202, 139–156. doi:10.1111/j.0105-2896.2004.00211.x
Weller, J. I., Bickhart, D. M., Wiggans, G. R., Tooker, M. E., O’Connell, J. R., Jiang, J., et al. (2018). Determination of Quantitative Trait Nucleotides by Concordance Analysis between Quantitative Trait Loci and Marker Genotypes of US Holsteins. J. Dairy Sci. 101, 9089–9107. doi:10.3168/jds.2018-14816
Whitlock, H. V. (1948). Some Modifications of the McMaster Worm Egg-Counting Method and Apparatus. J. Counc. Sci. Ind. Res. 21, 177–180.
Wildeus, S. (1997). Hair Sheep Genetic Resources and Their Contribution to Diversified Small Ruminant Production in the United States. J. Anim. Sci. 75, 630–640. doi:10.2527/1997.753630x
Yang, J., Lee, S. H., Goddard, M. E., and Visscher, P. M. (2011). GCTA: a Tool for Genome-wide Complex Trait Analysis. Amer. J. Hum. Genet. 88, 76–82. doi:10.1016/j.ajhg.2010.11.011
Keywords: fecal egg counts, gastrointestinal parasites, genome-wide association, parasite resistance, regional heritability mapping, sheep
Citation: Notter DR, Heidaritabar M, Burke JM, Shirali M, Murdoch BM, Morgan JLM, Morota G, Sonstegard TS, Becker GM, Spangler GL, MacNeil MD and Miller JE (2022) Single Nucleotide Polymorphism Effects on Lamb Fecal Egg Count Estimated Breeding Values in Progeny-Tested Katahdin Sires. Front. Genet. 13:866176. doi: 10.3389/fgene.2022.866176
Received: 30 January 2022; Accepted: 14 April 2022;
Published: 03 May 2022.
Edited by:
Tatiana Deniskova, L.K. Ernst Federal Science Center for Animal Husbandry (RAS), RussiaReviewed by:
Anna M. Johansson, Swedish University of Agricultural Sciences, SwedenCopyright © 2022 Notter, Heidaritabar, Burke, Shirali, Murdoch, Morgan, Morota, Sonstegard, Becker, Spangler, MacNeil and Miller. This is an open-access article distributed under the terms of the Creative Commons Attribution License (CC BY). The use, distribution or reproduction in other forums is permitted, provided the original author(s) and the copyright owner(s) are credited and that the original publication in this journal is cited, in accordance with accepted academic practice. No use, distribution or reproduction is permitted which does not comply with these terms.
*Correspondence: David R. Notter, ZHJub3R0ZXJAdnQuZWR1
†Present addresses: James L. M. Morgan, Round Mountain Consulting, Fayetteville, AR, United States Gordon L. Spangler, Epic Sciences, San Diego, CA, United States
Disclaimer: All claims expressed in this article are solely those of the authors and do not necessarily represent those of their affiliated organizations, or those of the publisher, the editors and the reviewers. Any product that may be evaluated in this article or claim that may be made by its manufacturer is not guaranteed or endorsed by the publisher.
Research integrity at Frontiers
Learn more about the work of our research integrity team to safeguard the quality of each article we publish.