 Lei Li
 Zijia Tao
 Yiqiao Zhao
 Mingyang Li
 Jianyi Zheng
 Zeyu Li
 Xiaonan Chen
94% of researchers rate our articles as excellent or good
Learn more about the work of our research integrity team to safeguard the quality of each article we publish.
Find out more
ORIGINAL RESEARCH article
Front. Genet., 27 April 2022
Sec. Cancer Genetics and Oncogenomics
Volume 13 - 2022 | https://doi.org/10.3389/fgene.2022.864383
This article is part of the Research TopicGenomics of immunoregulation and inflammatory responses in the tumor microenvironmentView all 28 articles
In recent years, methylation modification regulators have been found to have essential roles in various tumor mechanisms. However, the relationships between N6-methyladenosine (m6A) and 5-methylcytosine (m5C) regulators and clear cell renal cell carcinoma (ccRCC) remain unknown. This study investigated these relationships using the data from The Cancer Genome Atlas database. We calculated risk scores using a Lasso regression analysis and divided the patient samples into two risk groups (tumor vs. normal tissues). Furthermore, we used univariate and multivariate Cox analyses to determine independent prognostic indicators and explore correlations between the regulatory factors and immune infiltrating cell characteristics. Finally, quantitative reverse transcriptase–polymerase chain reaction (PCR) and The Human Protein Atlas were used to verify signature-related gene expression in clinical samples. We identified expression differences in 35 regulatory factors between the tumor and normal tissue groups. Next, we constructed a five-gene risk score signature (NOP2 nucleolar protein [NOP2], methyltransferase 14, N6-adenosine-methyltransferase subunit [METTL14], NOP2/Sun RNA methyltransferase 5 [NSUN5], heterogeneous nuclear ribonucleoprotein A2/B1 [HNRNPA2B1], and zinc finger CCCH-type containing 13 [ZC3H13]) using the screening criteria (p < 0.01), and then divided the cases into high- and low-risk groups based on their median risk score. We also screened for independent prognostic factors related to age, tumor grade, and risk score. Furthermore, we constructed a Norman diagram prognostic model by combining two clinicopathological characteristics, which demonstrated good prediction efficiency with prognostic markers. Then, we used a single-sample gene set enrichment analysis and the cell-type identification by estimating relative subsets of RNA transcripts (CIBERSORT) method to evaluate the tumor microenvironment of the regulatory factor prognostic characteristics. Moreover, we evaluated five risk subgroups with different genetic signatures for personalized prognoses. Finally, we analyzed the immunotherapy and immune infiltration response and demonstrated that the high-risk group was more sensitive to immunotherapy than the low-risk group. The PCR results showed that NSUN5 and HNRNPA2B1 expression was higher in tumor tissues than in normal tissues. In conclusion, we identified five m6A and m5C regulatory factors that might be promising biomarkers for future research.
Renal cell carcinoma (RCC) is the most common renal malignancy, resulting in more than 14,000 deaths annually in the United States (Siegel et al., 2018). Clear cell renal cell carcinoma (ccRCC) is the most common subtype (∼70% of cases) with the worst degree of malignancy and prognosis (Jonasch et al., 2021). There has been considerable progress regarding ccRCC treatment. However, overall survival (OS) and relapse-free survival still require improvement (Greef and Eisen, 2016). Therefore, identifying new targets and prognostic biomarkers for ccRCC treatment is crucial.
N-Methyladenosine (m6A) and 5-methylcytosine (m5C) RNA modifications are newly discovered gene expression regulation mechanisms (Chen et al., 2019). These modifications affect the fate of modified RNA and play critical roles in biological processes such as tumor development (Huang et al., 2020). m6A modifications are the most abundant type of RNA modification, occurring in messenger RNA (mRNA), microRNA, and long noncoding RNAs. Furthermore, studies have demonstrated that m6A RNA modifications affect RNA processing, translation, and metabolism. Methyltransferases (writers), demethylases (erasers), and binding-protein (readers) primarily mediate the effects of m6A. The “writers” are responsible for RNA methylation and include methyltransferase-like (METTL) 33, METTL14, KIAA1429, Wilms’ tumor 1-associating protein (WTAP), RNA binding motif protein 15 (RBM15), and zinc finger CCCH-type containing 13 (ZC3H13). The “erasers” specifically target m6A RNA and mainly include AlkB homolog 5, RNA demethylase (ALKBH5), and FTO alpha-ketoglutarate-dependent dioxygenase (FTO). The “readers” connect m6A sites and play a role in special regulatory RNA modifications, including YTH domain-containing (YTHDC) 1, YTHDC2, YTH domain-containing family protein (YTHDF) 1, YTHDF2, insulin-like growth factor binding protein (IGFBP) 1, IGFBP2, IGF2BP3, RNA binding motif protein X-Linked (RBMX), and heterogeneous nuclear ribonucleoprotein C (HNRNPC). m6A downregulation leads to reduced proliferation, self-renewal, survival, and differentiation. Furthermore, m6A methylation regulates all aspects of cellular RNA metabolism, including abundance, alternative splicing, stability, nuclear output, decay, and transformation (Chen et al., 2019; He et al., 2019; Lan et al., 2019).
m5C modifications are another prevalent RNA modification type occurring in mRNA, transfer RNA, ribosomal RNA, and some noncoding RNAs (Squires et al., 2012; Bohnsack et al., 2019; Trixl and Lusser, 2019). Studies have demonstrated that m5C is involved in gene expression related to RNA output, translation, and stabilization processes (Bohnsack et al., 2019; Huang et al., 2019). Writers, readers, and erasers also mediate the effects of m5C. NOP2 nucleolar protein (NSUN) 1–7, DNA methyltransferase (DNMT) 1, 2, 3A, and 3B are writers, regulating the process of RNA methylation modifications. Tet methylcytosine dioxygenase (TET) 2, an eraser, has m5C demethylation activity, removing the m5C modification, and Aly/REF export factor (ALYREF), a reader, recognizes and binds the m5C site on target mRNAs (Huang et al., 2019; Nombela et al., 2021).
Increasing evidence suggests that m6A and m5C regulators have essential roles in tumorigenesis and tumor progression (Chen et al., 2019; Chellamuthu and Gray, 2020). For example, tumorigenesis and proliferation, differentiation, invasion, and migration are related to methylation modifications (Lin et al., 2016; Ma et al., 2017; Liu et al., 2018a). Furthermore, m6A and m5C regulators have been reported as prognostic biomarkers. For instance, in hepatocellular carcinoma, METTL3 is associated with a poor prognosis and inhibits the suppressor of cytokine signaling 2 (i.e., SOCS2) expression through the miR-145/m 6 A/YTHDF2-dependent axis (Yang et al., 2017; Chen et al., 2018). In addition, METTL14 promotes cancer progression by regulating MYB proto-oncogene–transcription factor (i.e., MYB)/MYC proto-oncogene–bHLH transcription factor (i.e., MYC) in acute myeloid leukemia (Weng et al., 2018). m5C research has not become mainstream. However, studies have confirmed increased NSUN2 expression in breast cancer (Frye and Watt, 2006), and NOP2 is a non–small cell lung cancer prognostic biomarker (Sato et al., 1999). Furthermore, NSUN5 is highly expressed in rectal cancer and promotes cancer progression through cell cycle regulation (Jiang et al., 2020).
RNA modifications do not drive tumor progression. However, abnormal expression of modification regulators can lead to changes in the biological behavior of tumors (Nombela et al., 2021). For example, METTL3 is upregulated in breast cancer, which increases hepatitis B X-interacting protein (i.e., HBXIP) mRNA methylation and stability, inducing tumor cell proliferation and survival by inhibiting the tumor suppressor, let −7 g (Cai et al., 2018). METTL3 also regulates integrin subunit beta 1 (ITGB1) expression, thereby affecting the binding of ITGB1 to collagen I. This disruption affects tumor cell migration and promotes bone metastasis in prostate cancer (Li et al., 2020). In cervical cancer, FTO activates the β-catenin pathway, increasing ERCC excision repair 1–endonuclease noncatalytic subunit (i.e., ERCC1) expression, which is associated with worse prognosis (Zhou et al., 2018; Zou et al., 2019). In addition, FTO is overexpressed in lung cancer, promoting cell proliferation and invasion and inhibiting apoptosis by regulating myeloid zinc finger 1 (i.e., MZF1) expression, resulting in a poor prognosis (Liu et al., 2018b). This evidence demonstrates that RNA methylation significantly influences the biological behavior of tumors.
Many studies have explored the regulatory mechanisms among m6A- and m5C-related regulatory factors and various tumors. However, relationships between the clinicopathological characteristics of ccRCC and combined m6A–m5C regulatory factors remain unclear. Therefore, this study combined the gene signatures of m6A with m5C to explore these correlations. We downloaded kidney renal clear cell carcinoma (KIRC) transcriptome and clinical data from The Cancer Genome Atlas (TCGA) to analyze the differentially expressed regulatory factors in ccRCC. Next, we constructed a prognostic risk model using Lasso regression and Cox analyses. Finally, we screened five prognostic regulatory factors as a model signature and combined the independent prognostic factors to construct a nomogram diagram.
Immune cell infiltration plays a decisive role in tumorigenesis and development. Furthermore, cancer cells shape their microenvironment by secreting various cytokines, chemokines, and other factors, leading to the reprogramming of surrounding cells. Therefore, they play a decisive role in tumor survival and progression (Hinshaw and Shevde, 2019). This study also aimed to identify the potential characteristics of m6A- and m5C-related regulatory factors to improve prognostic ccRCC evaluations.
Overall, we combined m6A and m5C to explore the influence of regulatory factors on ccRCC prognoses to provide new ccRCC biomarkers and construct a reliable prognostic model suitable for use in the clinic.
We downloaded the ccRCC transcriptome (HTseq-FPKM) and clinical data from the TCGA-KIRC database (https://portal.gdc.cancer.gov/). We included 611 TCGA samples; 539 were tumor tissue (ccRCC) samples, and 72 were normal tissues samples. We removed all samples with missing data.
We included 23 m6A and 12 m5C regulatory factors based on the literature (Bohnsack et al., 2019; He et al., 2019; Zhang et al., 2021) (m6A: KIAA1429, WTAP, RBM15, RBM15B, METTL16, METTL3, METTL14, ZC3H13, ALKBH5, FTO, FMRP translational regulator 1 [FMR1], heterogeneous nuclear ribonucleoprotein A2/B1 [HNRNPA2B1], HNRNPC, IGFBP1, IGFBP2, IGFBP3, leucine-rich pentatricopeptide repeat-containing [LRPPRC], RBMX, YTHDC1, YTHDC2, YTHDF1, YTHDF2, and YTHDF3; m5C: TET1, TET2, TET3, NSUN2, NSUN3, NSUN4, NSUN5, NSUN6, NOP2, ALYREF, tRNA aspartic acid methyltransferase 1 [TRDMT1], and YBX1). We compared the gene expressions of these regulatory factors between the tumor and normal tissue groups. A p-value of <0.05 and an absolute log2 fold change value ≥ 1 were considered statistically significant.
We randomly divided the 525 ccRCC samples into training (n = 263) and validation (n = 262) groups using a 1:1 ratio and screened the prognostic adjustment factors. We calculated the risk score as follows:
where Exp: individual gene expression; Coef: correlation coefficient.
The samples were classified into high- and low-risk groups based on the median risk score. Next, we used univariate and multivariate Cox regression analyses to determine which pathological features were independent prognostic risk factors. Finally, we prepared receiver operating characteristic (ROC) curves. This process was performed in the training and validation groups.
We selected clinical indicators with a p-value of ≤0.001 in the multivariate Cox regression analysis and the risk score to construct the prognostic nomogram model. The calibration curve and C-index were used to predict the model’s performance. We also created 1-, 3-, and 5-year ROC curves to verify the model’s predictive ability and performed a Kaplan–Meier analysis to evaluate the OS of the low- and high-risk groups (statistical significance was set at p < 0.05).
We used the single-sample gene set enrichment analysis (ssGSEA) algorithm to obtain the relative abundance of TME-infiltrated cells per sample. Next, we used the CIBERSORT algorithm to analyze differences in immune cell infiltration between the high- and low-risk groups. The CIBERSORT software deconvolves the matrix of immune cell subtypes according to linear support vector regression rules (Lee et al., 2013). We downloaded the ccRCC immune scores from the MD Anderson database (http://bioninformatics.mdanderson.org/estimate/) to assess correlations between regulatory factors and immune and matrix scores.
We purchased human ccRCC (769-P) and immortalized proximal tubule epithelial (HK2) cell lines from the Cell Bank of the Chinese Academy of Sciences. 769-P and HK2 cells were cultured in Roswell Park Memorial Institute (i.e., RPMI)-1,640 medium (KeyGEN Biotech, Inc., Nanjing, China) and Dulbecco’s Modified Eagle Medium (i.e., DMEM) (KeyGEN Biotech, Inc.,), respectively, containing 10% fetal bovine serum (Biological Industries, Shanghai, China) at 37°C and 5% carbon dioxide.
We verified the expression levels of the prognostic genes by qRT-PCR analysis. Total RNA was extracted using Trizol reagent (TaKaRa Bio Inc. Shiga, Japan), and complementary DNA was synthesized using PrimeScript RT reagent Kit (TaKaRa, Shiga, Japan). qRT-PCR was performed on 7,500 Real-Time PCR Systems (Applied Biosystems; Thermo Fisher Scientific, Waltham, MA, United States) using SYBR GreenER Supermix (TaKaRa, Shiga, Japan). The PCR conditions comprised an initial melting step at 95°C for 1 min, followed by 35 cycles of 95°C for 90 s, 60°C for 30 s, 72°C for 30 s, and then 72°C for 10 min. We used the 2–ΔΔCt method to analyze the relative expression of the prognostic genes based on the normalized relative expression of the β-actin gene. The primers were as follows: NSUN5: Forward, TGCCTCGATTTGTGCGTGTG, Reverse, GACAGCTGGCCCTGTCCT; GAPDH: Forward, TGACTTCAACAGCGACACCCA, Reverse, CACCC-TGTTGCTGTAGCCAAA; ZC3H13: Forward, TGGTGCTGGAGAAGGATACGA, Reverse, CTATCACATCTAAGGGATCTGGCA; HNRNPA2B1: Forward, GCTTTGGGGATTCACGTGGT, Reverse, CCACTGCCATATCCATCAGATCC. We used The Human Protein Atlas database to analyze NSUN5 and HNRNPA2B1 protein expression in clinical specimens.
All statistical analyses were performed using R (version 3.6.1; R Foundation for Statistical Computing, Vienna, Austria). We created box plots to visualize differential gene expression using the “reshape2” and “ggpubr” packages. We screened the prognostic adjustment factors using a Lasso regression analysis and the “glmnet” package and generated ROC curves using the “survivalROC” package. The survival curve was obtained using the “survminer” package, and we used the “rms” package to calculate the C-index and generate calibration curves. All p-values of <0.05 were considered statistically significant. We indicated the various levels of statistical significance as follows: *p < 0.05, **p < 0.01, and ***p < 0.001.
Figure 1presents a workflow chart, and Table 1 lists the combined (m6A and m5C) regulatory factors. We identified 24 genes that differed between the tumor and normal tissue groups (p < 0.01; Figure 2). The expressions of NSUN4, FMR1, LRPPRC, HNRNPA2B1, ZC3H13, RBM15B, METTL14, YTHDF3, and IGFBP2 were significantly higher in the normal tissue samples than in the tumor tissue samples. The expressions of YTHDC2, NSUN6, RBM15, NSUN2, NOP2, IGFBP3, ALYREF, TET3, FTO, ALKBH5, RBMX, NSUN5, METTL3, and WTAP were significantly higher in the tumor tissue samples than in the normal tissue samples. TET1 expression did not differ among the groups (Supplementary Table S1).
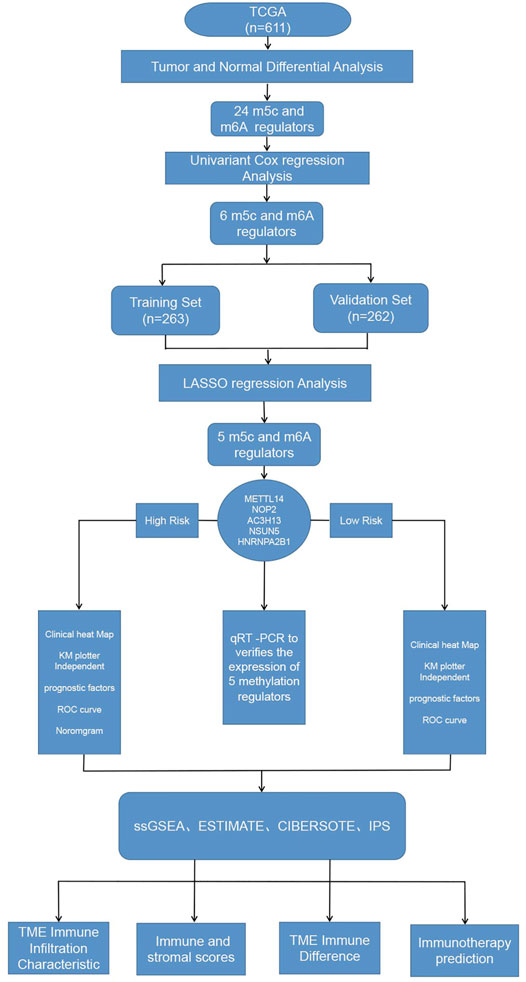
FIGURE 1. Workflow of this study.

TABLE 1. Classification of m6A and m5C combined regulatory factors.
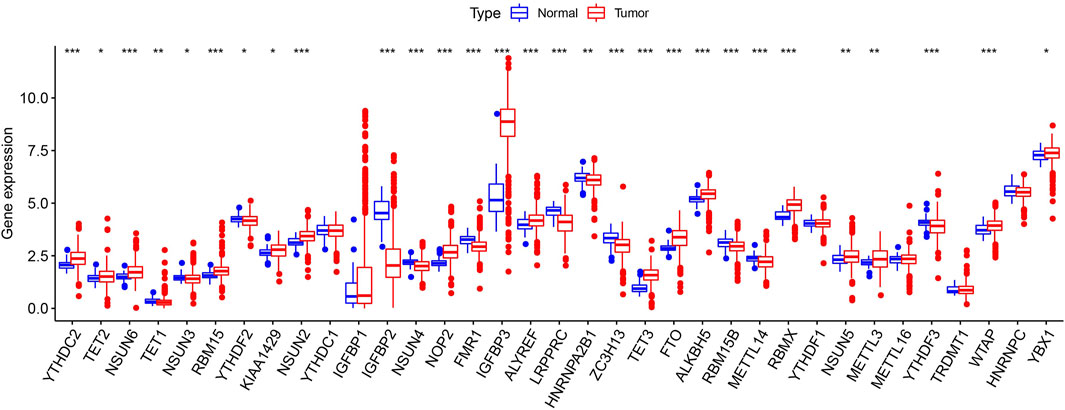
FIGURE 2. Expression pattern of m6A and m5C regulators in TCGA ccRCC cohort. Difference expression of 35 m6A and m5C methylation regulators. *p < 0.05, **p < 0.01, and ***p < 0.001.
We further screened the methylation regulatory factors to explore their prognostic value. We selected 22 regulatory factors as the analysis object (Figure 3A). Univariate Cox regression analysis identified six regulatory factors related to OS (Supplementary Table S2), and the Lasso regression analysis identified five relevant prognostic factors, namely, NOP2, METTL14, NSUN5, HNRNPA2B1, and ZC3H13 (Figures 3B,C; Supplementary Table S3). NSUN5, NOP2, and HNRNPA2B1 were associated with risk (hazard ratio [HR] >1), and METTL14 and ZC3H13 were associated with a protective effect (HR <1). We used these five factors to generate the prognostic risk model.
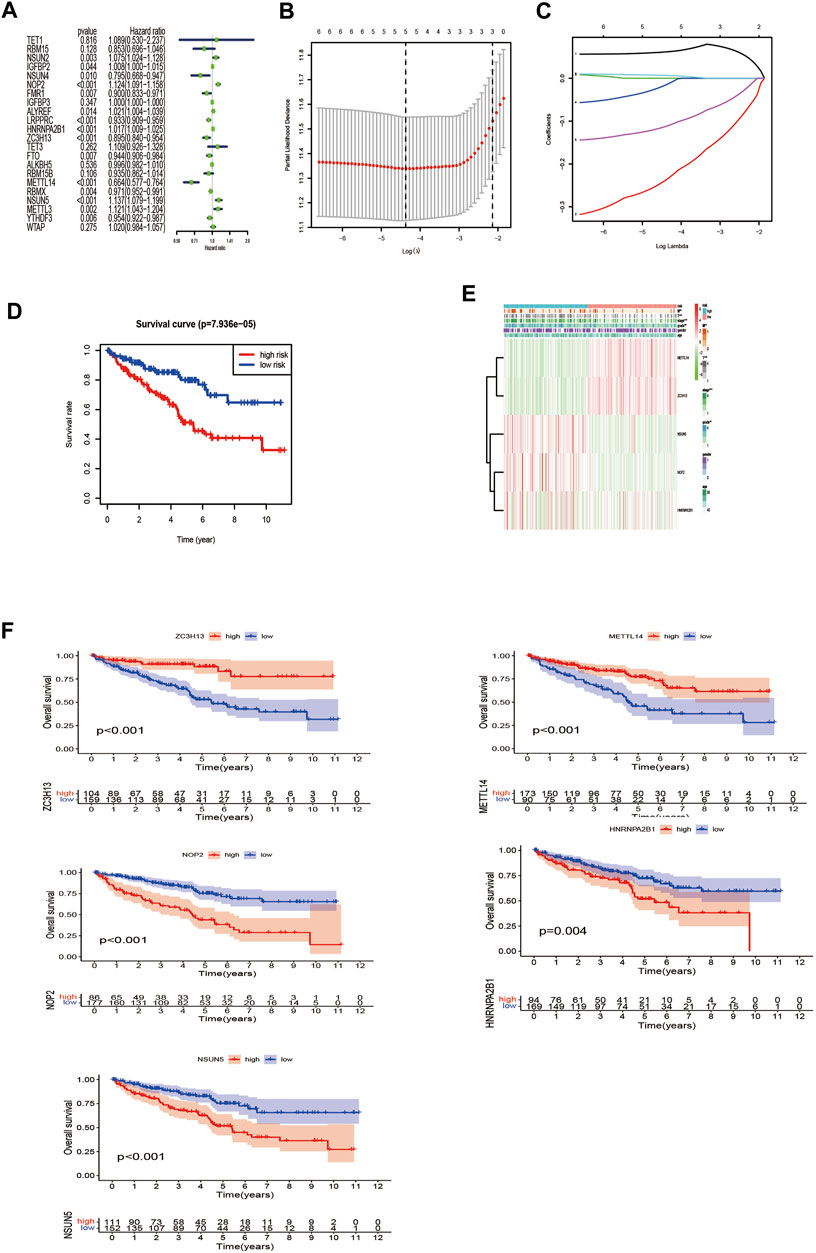
FIGURE 3. Construction of the risk signature according to the m6A and m5C RNA methylation regulators. (A) Forest plot of the univariate Cox regression analysis for the 22 regulators. Identification of six significant regulators (*p < 0.05, **p < 0.01, and ***p < 0.001). (B,C) LASSO coefficient profiles of the six regulators. Cross-validation for tuning parameter selection in the LASSO model. (D) The K–M analysis showed that patients in the low-risk group presented better OS than those in the high-risk group. This analysis was based on the survival information of samples in the training set. The red line represents the high-risk cluster, whereas the blue line indicates the low-risk cluster. (E) The training set of the heat map of the relationship between the gene expression of the corresponding five regulatory factors and clinical features. *p < 0.05, **p < 0.01, and ***p < 0.001. (F) Kaplan–Meier survival curves for OS of five regulatory factors.
Next, we compared the survival rates of the high- and low-risk groups based on the median risk. The survival rate of the low-risk group was distinctly better than that of the high-risk group (Figure 3D). Furthermore, the heat map illustrated relationships among the gene expressions of the five prognostic factors from the training set and various clinical traits and risk scores. The risk score correlated with tumor (T), metastasis (M), stage, and grade. In addition, the highly expressed genes NOP2, HNRNPA2B1, and NSUN5 were highly expressed in the high-risk group, and the low-expressed genes METTL14 and ZC3H13 were highly expressed in the low-risk group (Figure 3E). High expression of NOP2, HNRNPA2B1, and NSUN5 correlated with a poor prognosis, and high METTL14 and ZC3H13 expression correlated with a good prognosis (Figure 3F). These results support the results of our predicted risk genes and protective genes.
The areas under the curve (AUCs) for the 1-, 3-, and 5-year ROC curves were 0.717, 0.701, and 0.723, respectively, using the training set data and the prognostic risk model (Figures 4A–C). We performed the same analysis using the validation set data, finding that the AUCs for the 1-, 3-, and 5-year ROC curves were 0.677, 0.671, and 0.659, respectively (Figures 4D–F). Furthermore, the expression patterns of prognostic regulatory factors in the high- and low-risk groups were almost the same as those in the training set (Figure 5A), and the Kaplan–Meier analysis of the validation set was consistent with the training set results. Patient survival was better in the low-risk group than in the high-risk group (Figure 5B), indicating that these five regulatory factors positively affect the KIRC prognosis prediction. Next, the univariate analysis identified that prognosis was related to the age, grade, stage, T, M, and risk score. The multivariate analysis showed that the age, grade, and risk score were related to the OS (p < 0.05). Therefore, age, grade, and risk score are independent prognostic factors for KIRC OS (Figures 5C,D).
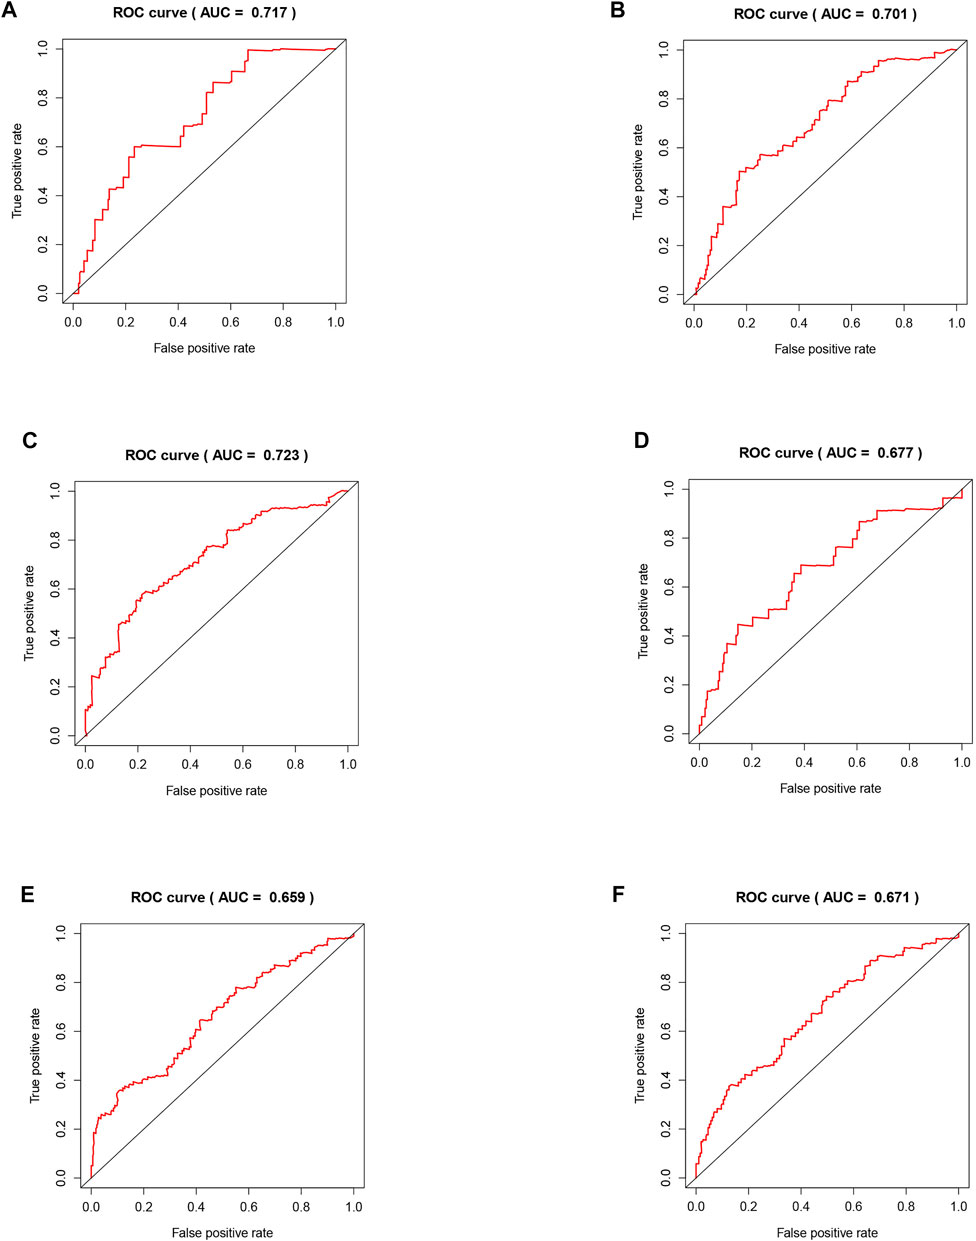
FIGURE 4. Validation of the risk model related to five regulators. (A–C) The training set of the ROC curve for evaluating the prediction efficiency of the prognostic signature. (D–F) The validation set of the ROC curve for evaluating the prediction efficiency of the prognostic signature.
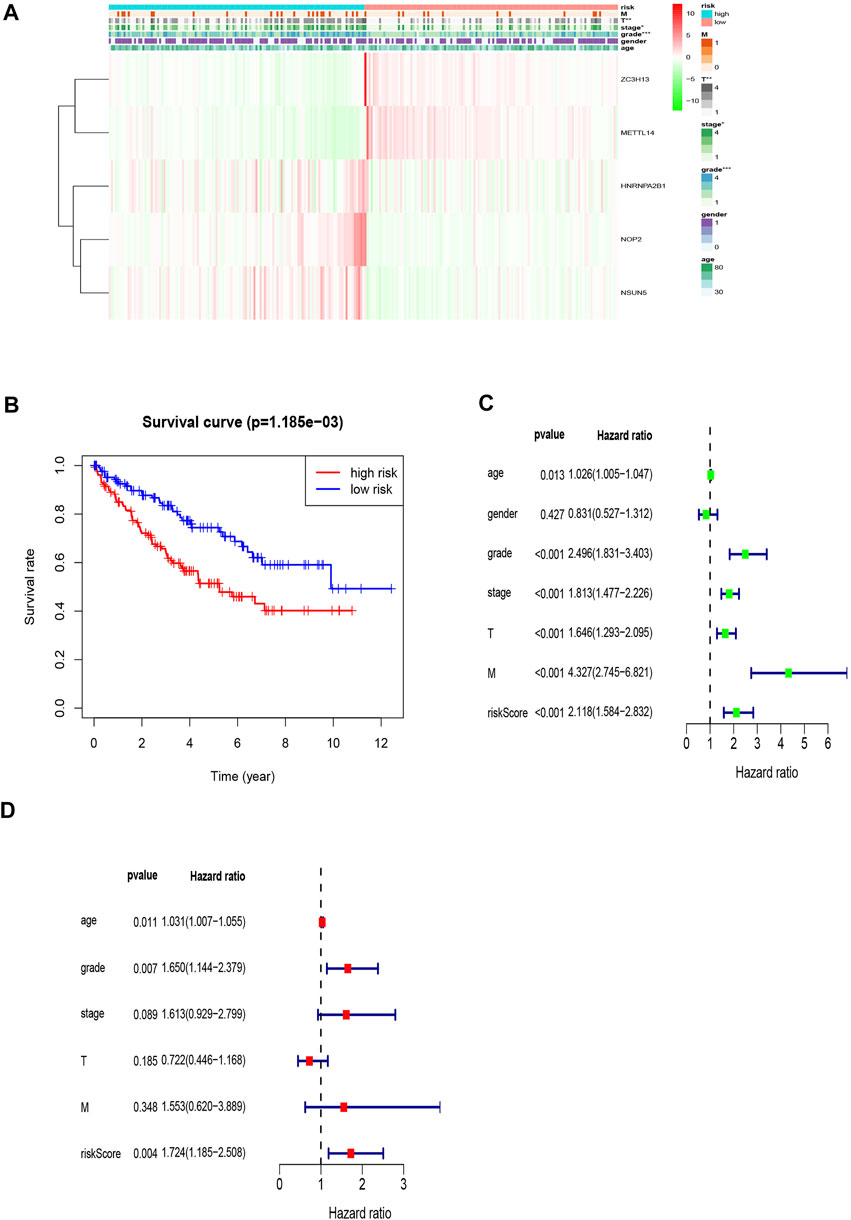
FIGURE 5. Prognostic signature of the five related regulators in the validation set and the training set of independent prognostic factors for KIRC OS. (A) The validation set of the heat map of the relationship between the gene expression of the corresponding five regulatory factors and clinical features. (B) Kaplan–Meier survival curves for OS in the two groups of low and high risk. This analysis was based on the survival information of samples in the validation set. (C,D) Forrest plot of the independent prognostic factors in KIRC.
We used the independent prognostic factors (i.e., age, grade, and risk score) to construct a Norman diagram model (Figure 6A). Next, we constructed a nomogram based on two independent prognostic factors, and then predicted the 1-, 3-, and 5-year OS using the Norman diagram. The C-index was 0.737, and the calibration curve was more consistent with the observed results. The AUCs for 1-, 3-, and 5-year OS ROC curves were 0.746, 0.740, and 0.739, respectively (Figures 6B–D). The calibration graphs displaying the curves illustrate that the nomogram model has a better predictive ability and accuracy (Figures 6E–G). The grade, age, and risk score survival curves indicate that the survival rate of patients in the early stage was much better than those in the late stage (p < 0.001). Furthermore, OS was better in the low-risk group than in the high-risk group (p < 0.001; Figures 6H–J).
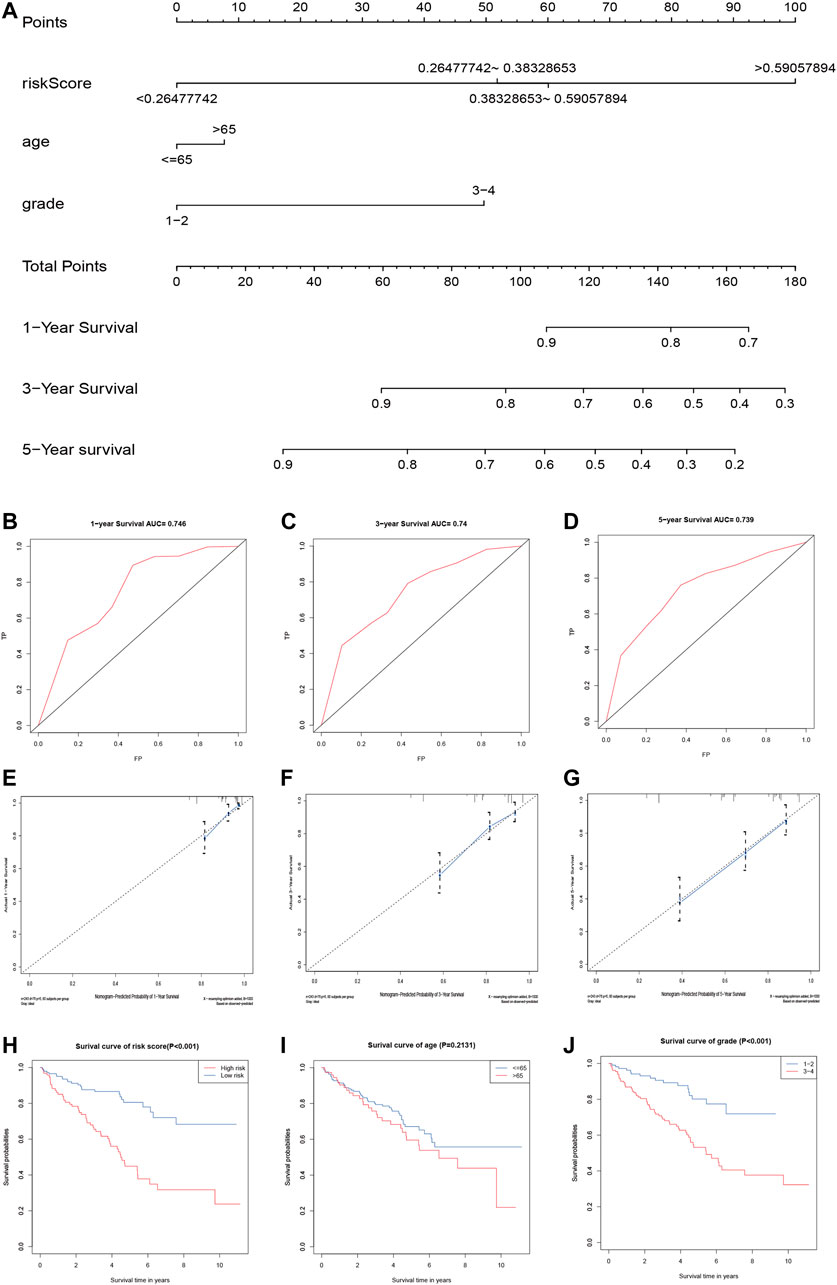
FIGURE 6. Validation of the prognostic signature of the five related regulators. (A) The nomogram of the risk model for predicting the OS probability of ccRCC patients. The whole points projected on the bottom scales indicate the likelihood of 1-, 3-, and 5-year OS. (B–D) AUC of the ROC analysis showed the predicted efficacy of the risk model in the training set. (E–G) The calibration plot for the nomogram predicting 1-, 3-, and 5-year OS. The y-axis indicates the actual survival, as measured by the K–M analysis, while the x-axis shows the nomogram-predicted survival. (H–J) Kaplan–Meier survival curves stratified according to clinicopathological and risk scores.
Tumor infiltration is crucial for tumor development. Therefore, we performed a ssGSEA analysis to evaluate correlation patterns between immune infiltrating cells and the risk score (Figure 7A). There was significant infiltration of eosinophils, immature dendritic cells, mast cells, and neutrophils in the low-risk group and abundant infiltration of the activated cluster of differentiation (CD) 4 +, CD8+ T cells, activated dendritic cells, CD56 dim natural killer (NK) cells, and myeloid-derived suppressor cells (MDSCs) in the high-risk group.
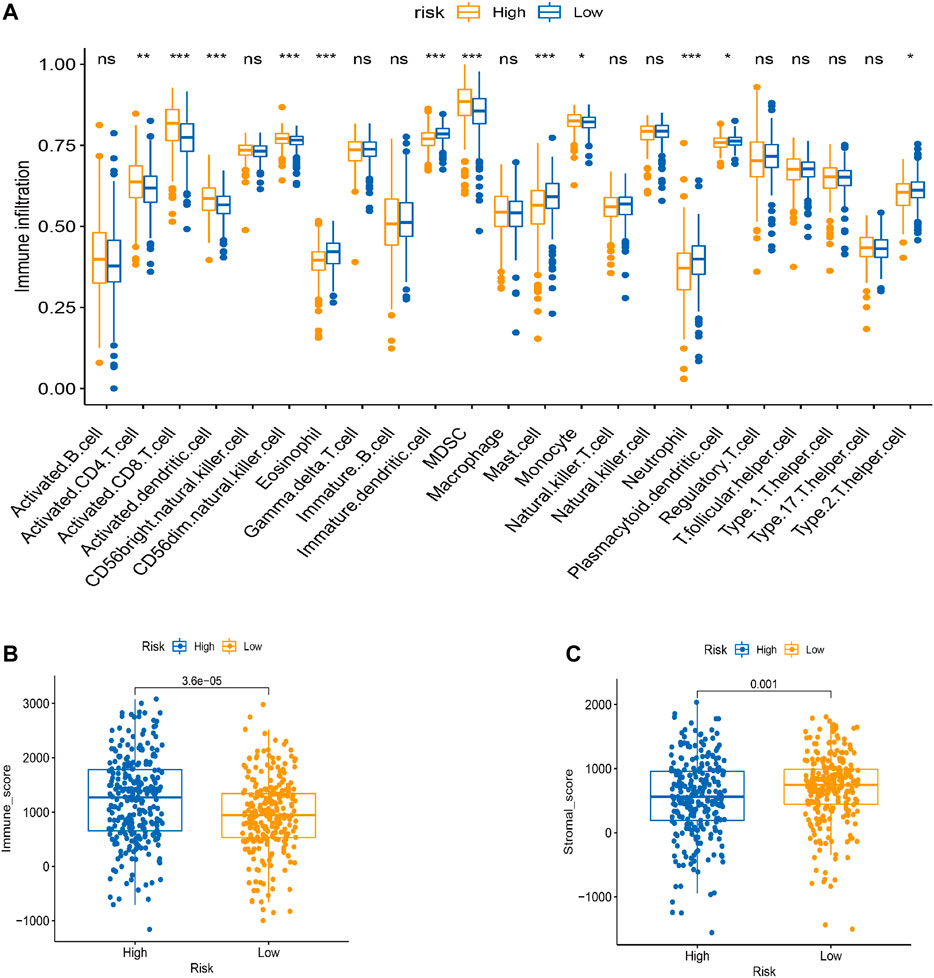
FIGURE 7. TME cell infiltration characteristics in distinct modification patterns. (A) Box plot for the TME cells in distinct risk groups derived from KIRC patients based on the ssGSEA. The asterisks represented the statistical p value (*p < 0.05; **p < 0.01; ***p < 0.001). (B–C) Immune and stromal scores within the low- and high-risk groups. (C) Effect of LRPPRC expression level on the expression of different immunomodulators. *p < 0.05, **p < 0.01, and ***p < 0.001.
Next, we used the estimation of stromal and immune cells in malignant tumor tissues using the expression data (ESTIMATE) algorithm to identify associations between the risk groups and the immune and stromal scores. The immune score was higher in the high-risk group than in the low-risk group, and the stromal score was higher in the low-risk group than in the high-risk group (Figures 7B,C).
The CIBERSORT algorithm identified the types of immune cells in ccRCC (Figure 8), and we found significant compositional differences between the high- and low-risk groups. M0 macrophages, CD4 memory-activated T cells, CD8 T cells, follicular helper T cells, activated NK cells, and regulatory T cells (Tregs) were significantly enriched in both groups. CD4 resting memory T cells, resting mast cells, M2 and M1 macrophages, monocytes, and naïve B cells were more abundant in the low-risk group than in the high-risk group. Memory B cells did not differ between the groups (Figure 9). These results emphasize that immune cell types vary between high- and low-risk groups. Therefore, exploring immune cell infiltration in ccRCC may help elucidate the mechanisms and improve prognosis predictions.
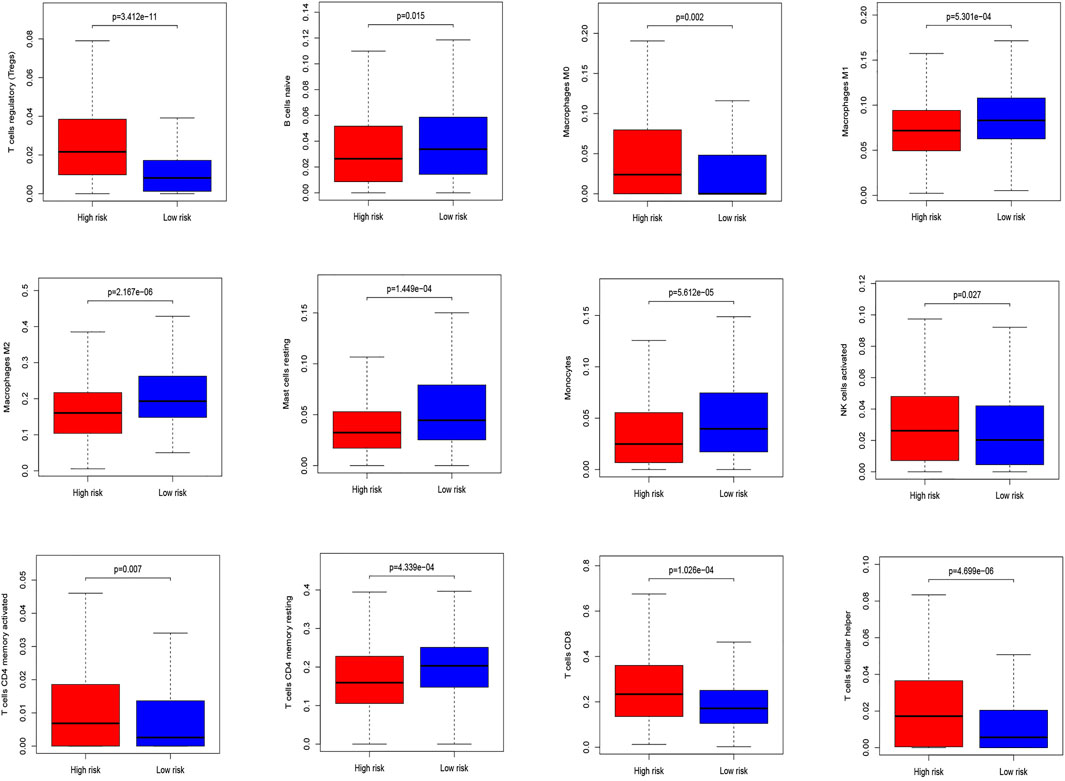
FIGURE 8. Differential analysis of immune cells in two low-risk groups.
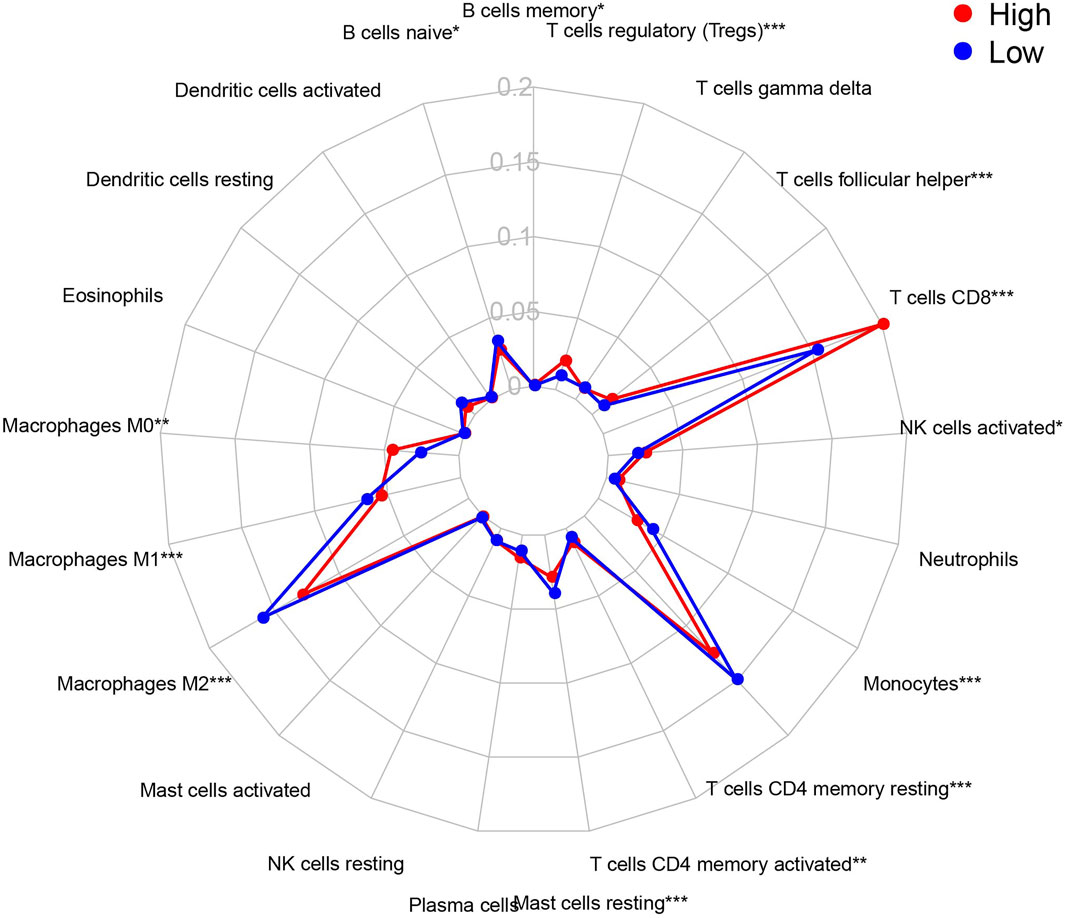
FIGURE 9. Summary of the 21 immune cells’ abundance for different risk groups of training cohort.
Immunotherapy is an emerging ccRCC therapy, and the current first-line treatment involves immune checkpoint inhibitors. Cytotoxic T-lymphocyte-associated protein 4 (CTLA-4) and programmed cell death protein 1 (i.e., PD-1) are the two most important immune checkpoint molecules (ICMs) regarding improved OS (Dunn et al., 2002; Ladányi, 2015; Davis et al., 2019). Other immune checkpoints, such as T-cell immunoglobulin and mucin domain–containing protein 3 (i.e., TIM-3), lymphocyte-activation gene 3 (i.e., LAG-3), and T-cell immunoreceptor with Ig and ITIM domains (i.e., TIGIT), suppress the antitumor immune response (Anderson et al., 2016). Therefore, clarifying the expression correlations of ICMs among risk groups may improve the clinical application of immune checkpoint inhibitors in KIRC. In our study, the immunotherapy score was higher in the high-risk group than in the low-risk group, suggesting that the high-risk group may respond to anti-CTLA-4 treatment (p < 0.001; Figure 10).

FIGURE 10. Low-risk group was more likely to respond to anti-CTLA4 immunotherapy. ICPs: immune checkpoints; ICBs: immune checkpoint inhibitors.
We verified the expression of NSUN5, ZC3H13, METL14, NOP2, and HNRNPA2B1 in ccRCC using the HK2 (epithelial; control) and 769-P (ccRCC) cell lines. METL14 is under-expressed in ccRCC tissues (Wang et al., 2021), and NOP2 expression is higher in tumor tissues than in normal tissues (Li et al., 2021). Furthermore, ZC3H13 expression is low in tumor tissues (Guo et al., 2021). Based on this, we compared the NSUN5 and HNRNPA2B1 protein levels of ccRCC and normal kidney tissues to determine the NSUN5 and HNRNPA2B1 expression status. NSUN5 and HNRNPA2B1 expressions were higher in tumor tissues than in normal tissues (Figure 11A), consistent with our other findings. We also compared NSUN5 and HNRNPA2B1 protein levels between RCC and normal kidney tissues, finding more NSUN5 and HNRNPA2B1 staining in RCC tissues than in normal kidney tissues (Figure 11B).
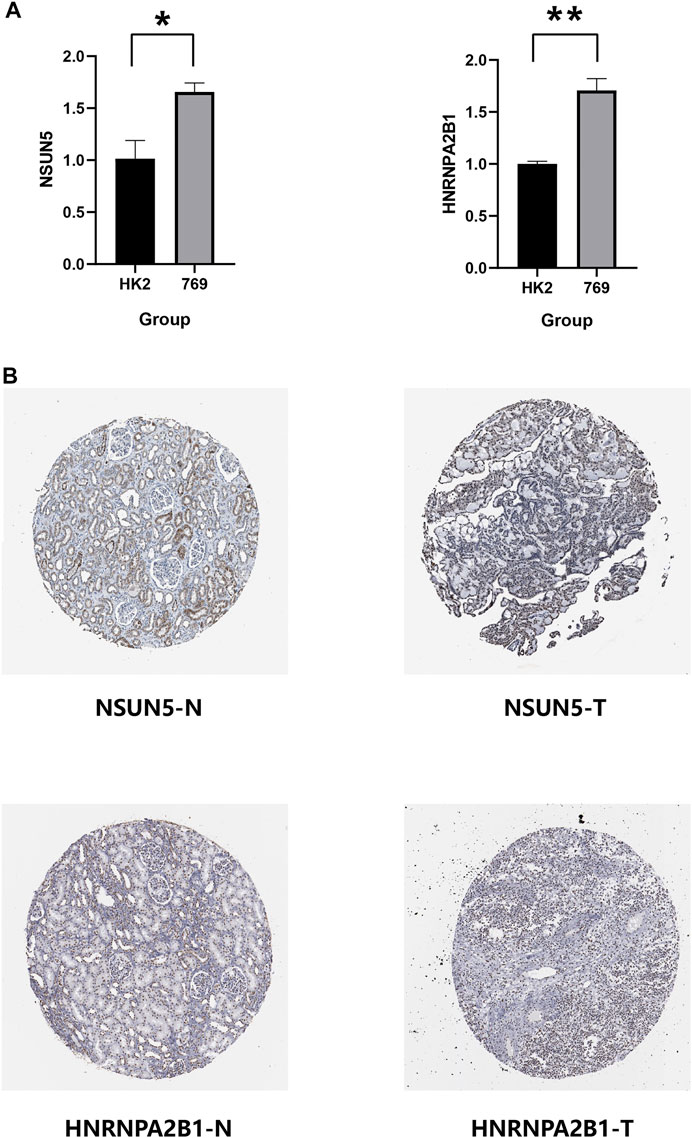
FIGURE 11. Expression level of NSUN5 and HNRNPA2B1 in renal clear cell carcinoma (KIRC). (A) The expression of NSUN5 and HNRNPA2B1 in ccRCC cell lines (HK2,769) was detected by the qRT-PCR assay. *p < 0.05, **p < 0.01, ***p < 0.001, and ****p < 0.0001. (B) Protein expression of NSUN5 and HNRNPA2B1 in KIRC. KIRC, kidney renal clear cell carcinoma.
ccRCC is the third most common renal cancer, accounting for 3% of all adult tumors, and the most common sporadic RCC subtype (Padala and Kallam, 2022). Studies have demonstrated that inhibiting m6A and m5C regulatory factors may have therapeutic benefits for tumors, providing a new direction for tumor treatment. For example, R-2-hydroxyglutarate (R-2HG) sensitivity of leukemia increases with increasing the m6A levels (Su et al., 2018). Furthermore, aurora kinase B (i.e., AURKB) regulates NSUN2 at the protein level, phosphorylated by Ser-139 (Sakita-Suto et al., 2007). To date, the relevant ccRCC markers are insufficient for clinical diagnosis and prognosis because ccRCC is often regulated by multiple genes. Thus, a single prognostic factor cannot accurately predict the clinical prognosis. This study explored the key regulators in ccRCC to provide new avenues for cancer treatment by identifying relevant regulatory factors and developing a new gene signature for more accurate prognosis predictions.
Our main goal was to clarify the relationship between m6A and m5C regulatory factors and determine how these combined factors affect KIRC prognosis and immune infiltrating cells. We used data from the TCGA database, identifying 35 relevant m6A and m5C regulatory factors, most of which were abnormally expressed in KIRC. Using these factors, we constructed a new prognostic model for more accurate prediction of OS in patients with KIRC. We randomly divided the TCGA dataset into two groups (training and validation) to verify the effectiveness of the risk model and introduced clinicopathological factors to improve the model’s reliability.
Immune infiltration analysis found more M0 macrophages, CD4 memory-activated T cells, CD8 T cells, follicular helper T cells, activated NK cells, and Tregs in the high-risk group. The low-risk group had more resting CD4 memory T cells, resting mast cells, M1 and M2 macrophages, monocytes, and naïve B cells. Increased eosinophils may be related to a good prognosis, similar to gastric cancer (Iwasaki et al., 1986). However, it could also indicate a poor prognosis, similar to bladder cancer (Popov et al., 2018). Increased number of mast cells are associated with a poor prognosis in lung, colorectal, gastric, and cervical cancers, and melanoma, but it is associated with a good prognosis in breast and prostate cancers (Rajput et al., 2008; Fleischmann et al., 2009; Kormelink et al., 2009). In addition, CD4+ T cells promote renal cancer cell proliferation by regulating YBX1 (Wang et al., 2018), and MDSCs accumulate in various tumors, promoting vascular survival and improving tumor immunity (De Cicco et al., 2020). Increased follicular helper T cells and Treg have been shown to promote cancer progression, which relates to a poor prognosis (Finotello and Trajanoski, 2017; Long et al., 2019). The role of mast and dendritic cells and their relationship with renal angiogenesis in KIRC remains unclear (Tamma et al., 2019).
Several studies have suggested that M2 and a small subset of M1 macrophages cannot phagocytose tumor cells and help tumor cells escape death and spread to other tissues and organs. These cells are called tumor-associated macrophages (TAMs) (Zhou et al., 2020), and they promote cancer progression and metastasis in human renal cell carcinoma, stimulating tumor inflammation (Hutterer et al., 2013). TAMs have also been shown to promote tumor metastasis, occurrence, and vascular lymphangiogenesis. During the initial stages of tumor development, macrophages either directly promote antitumor responses by killing tumor cells or indirectly recruit and activate other immune cells (Lopez-Yrigoyen et al., 2021). In our study, there were more M0 macrophages in the high-risk group, consistent with other clinical reports (Yi et al., 2021). Previous studies have shown that low-risk groups have more M1 and M2 macrophages and fewer M0 macrophages than high-risk groups. These descriptions are also consistent with our study’s results. Furthermore, the prognostic outcome of the low-risk group is consistent with the previous survival advantage. The specific role of NK cells remains controversial and largely depends on the cancer type (Hinshaw and Shevde, 2019).
Finally, we used the CIBERSORT and ESTIMATE algorithms to generate immune and stromal scores per risk group. The immune score was higher in the high-risk group than in the low-risk group, and the stromal score was higher in the low-risk group than in the high-risk group. Furthermore, the high-risk group was sensitive to anti-CTLA-4. Liu et al. reported that CTLA-4 as an oncogene accelerates ccRCC development with high prognostic value (Liu et al., 2020).
However, our research has limitations. First, we only have internal verification and lack external platform verification. Therefore, the predictive power of the risk model may be limited. Also, additional basic experimental research is needed to determine the detailed mechanisms of these five regulators.
Our study evaluated the combined role of m6A and m5C regulatory factors in regulating the KIRC TME. First, we constructed a new gene signature with five relevant regulatory factors. Then, using this signature, we created a novel prognostic model to stratify KIRC and normal tissue samples based on risk. Finally, we explored the link between the new gene signature and immune infiltration and obtained new potential immune checkpoints. These tools may help clinicians make more personalized and accurate prognosis predictions.
The original contributions presented in the study are included in the article/Supplementary Material, further inquiries can be directed to the corresponding author.
LL: writing—original draft. ZT: conceptualization, methodology, and software. ML: validation, formal analysis. YZ: visualization. JZ: resources, data curation. ZL: writing—review and editing. XC: funding acquisition, project administration, and supervision.
This work was supported by the joint plan of key research and development program of Liaoning Province under Grant No. 2020JH 2/10300137 and 345 Talent Project under Grant No. M0716. The funder had no role in study design, data collection and analysis, decision to publish, or preparation of the manuscript.
The authors declare that the research was conducted in the absence of any commercial or financial relationships that could be construed as a potential conflict of interest.
All claims expressed in this article are solely those of the authors and do not necessarily represent those of their affiliated organizations, or those of the publisher, the editors, and the reviewers. Any product that may be evaluated in this article, or claim that may be made by its manufacturer, is not guaranteed or endorsed by the publisher.
We thank XC, who serves for the Department of Urology, Shengjing Hospital of China Medical University, for his strong guidance and support for this review. He has put forward valuable suggestions for the improvement of this manuscript.
The Supplementary Material for this article can be found online at: https://www.frontiersin.org/articles/10.3389/fgene.2022.864383/full#supplementary-material
Supplementary Table S1 | Different expression of 35 RNA methylation regulators.
Supplementary Table S2 | Multivariate Cox regression on the 24 selected regulatory factors.
Supplementary Table S3 | Five prognostic factors.
Anderson, A. C., Joller, N., and Kuchroo, V. K. (2016). Lag-3, Tim-3, and TIGIT: Co-inhibitory Receptors with Specialized Functions in Immune Regulation. Immunity 44, 989–1004. doi:10.1016/j.immuni.2016.05.001
Bohnsack, K. E., Höbartner, C., and Bohnsack, M. T. (2019). Eukaryotic 5-methylcytosine (m5C) RNA Methyltransferases: Mechanisms, Cellular Functions, and Links to Disease. Genes (Basel) 10, 102. doi:10.3390/genes10020102
Cai, X., Wang, X., Cao, C., Gao, Y., Zhang, S., Yang, Z., et al. (2018). HBXIP-elevated Methyltransferase METTL3 Promotes the Progression of Breast Cancer via Inhibiting Tumor Suppressor Let-7g. Cancer Lett. 415, 11–19. doi:10.1016/j.canlet.2017.11.018
Chellamuthu, A., and Gray, S. G. (2020). The RNA Methyltransferase NSUN2 and its Potential Roles in Cancer. Cells 9 9, 1758. doi:10.3390/cells9081758
Chen, M., Wei, L., Law, C.-T., Tsang, F. H.-C., Shen, J., Cheng, C. L.-H., et al. (2018). RNA N6-Methyladenosine Methyltransferase-like 3 Promotes Liver Cancer Progression through YTHDF2-dependent Posttranscriptional Silencing of SOCS2. Hepatology 67, 2254–2270. doi:10.1002/hep.29683
Chen, X.-Y., Zhang, J., and Zhu, J.-S. (2019). The Role of m6A RNA Methylation in Human Cancer. Mol. Cancer 18, 103. doi:10.1186/s12943-019-1033-z
Davis, E. J., Perez, M. C., Ayoubi, N., Zhao, S., Ye, F., Wang, D. Y., et al. (2019) Clinical Correlates of Response to Anti-PD-1-based Therapy in Patients with Metastatic Melanoma, J. Immunother. 42, 221–227.doi:10.1097/cji.0000000000000258
De Cicco, P., Ercolano, G., and Ianaro, A. (2020). The New Era of Cancer Immunotherapy: Targeting Myeloid-Derived Suppressor Cells to Overcome Immune Evasion. Front. Immunol. 11, 1680. doi:10.3389/fimmu.2020.01680
Dunn, G. P., Bruce, A. T., Ikeda, H., Old, L. J., and Schreiber, R. D. (2002). Cancer Immunoediting: from Immunosurveillance to Tumor Escape. Nat. Immunol. 3, 991–998. doi:10.1038/ni1102-991
Finotello, F., and Trajanoski, Z. (2017). New Strategies for Cancer Immunotherapy: Targeting Regulatory T Cells. Genome Med. 9, 10. doi:10.1186/s13073-017-0402-8
Fleischmann, A., Schlomm, T., Köllermann, J., Sekulic, N., Huland, H., Mirlacher, M., et al. (2009). Immunological Microenvironment in Prostate Cancer: High Mast Cell Densities Are Associated with Favorable Tumor Characteristics and Good Prognosis. Prostate 69, 976–981. doi:10.1002/pros.20948
Frye, M., and Watt, F. M. (2006). The RNA Methyltransferase Misu (NSun2) Mediates Myc-Induced Proliferation and Is Upregulated in Tumors. Curr. Biol. 16, 971–981. doi:10.1016/j.cub.2006.04.027
Greef, B., and Eisen, T. (2016). Medical Treatment of Renal Cancer: New Horizons. Br. J. Cancer 115, 505–516. doi:10.1038/bjc.2016.230
Guo, T., Duan, H., Chen, J., Liu, J., Othmane, B., Hu, J., et al. (2021). N6-Methyladenosine Writer Gene ZC3H13 Predicts Immune Phenotype and Therapeutic Opportunities in Kidney Renal Clear Cell Carcinoma. Front. Oncol. 11, 718644. doi:10.3389/fonc.2021.718644
He, L., Li, H., Wu, A., Peng, Y., Shu, G., and Yin, G. (2019). Functions of N6-Methyladenosine and its Role in Cancer. Mol. Cancer 18, 176. doi:10.1186/s12943-019-1109-9
Hinshaw, D. C., and Shevde, L. A. (2019). The Tumor Microenvironment Innately Modulates Cancer Progression. Cancer Res. 79, 4557–4566. doi:10.1158/0008-5472.can-18-3962
Huang, H., Weng, H., and Chen, J. (2020). m6A Modification in Coding and Non-coding RNAs: Roles and Therapeutic Implications in Cancer. A Modification Coding Non-coding RNAs: Roles Ther. Implications CancerCancer Cel. 37, 270–288. doi:10.1016/j.ccell.2020.02.004
Huang, T., Chen, W., Liu, J., Gu, N., and Zhang, R. (2019). Genome-wide Identification of mRNA 5-methylcytosine in Mammals. Nat. Struct. Mol. Biol. 26, 380–388. doi:10.1038/s41594-019-0218-x
Hutterer, G. C., Pichler, M., Chromecki, T. F., Strini, K. A., Klatte, T., Pummer, K., et al. (2013). Tumour-associated Macrophages Might Represent a Favourable Prognostic Indicator in Patients with Papillary Renal Cell Carcinoma. Histopathology 63, 309–315. doi:10.1111/his.12163
Iwasaki, K., Torisu, M., and Fujimura, T. (1986). Malignant Tumor and Eosinophils: I. Prognostic Significance in Gastric Cancer. Cancer 58, 1321–1327. doi:10.1002/1097-0142(19860915)58:6<1321::aid-cncr2820580623>3.0.co;2-o
Jiang, Z., Li, S., Han, M. J., Hu, G. M., and Cheng, P. (2020). Erratum: High Expression of NSUN5 Promotes Cell Proliferation via Cell Cycle Regulation in Colorectal Cancer. Am. J. Transl Res. 12, 6976–3870.
Jonasch, E., Walker, C. L., and Rathmell, W. K. (2021). Clear Cell Renal Cell Carcinoma Ontogeny and Mechanisms of Lethality. Nat. Rev. Nephrol. 17, 245–261. doi:10.1038/s41581-020-00359-2
Kormelink, T., Abudukelimu, A., and Redegeld, F. (2009). Mast Cells as Target in Cancer Therapy. Cpd 15, 1868–1878. doi:10.2174/138161209788453284
Ladányi, A. (2015). Prognostic and Predictive Significance of Immune Cells Infiltrating Cutaneous Melanoma. Pigment Cel. Melanoma Res. 28, 490–500. doi:10.1111/pcmr.12371
Lan, Q., Liu, P. Y., Haase, J., Bell, J. L., Hüttelmaier, S., and Liu, T. (2019). The Critical Role of RNA m6A Methylation in Cancer. Cancer Res. 79, 1285–1292. doi:10.1158/0008-5472.can-18-2965
Lee, Y.-Y., Kim, T.-J., Kim, J.-Y., Choi, C. H., Do, I.-G., Song, S. Y., et al. (2013). Genetic Profiling to Predict Recurrence of Early Cervical Cancer. Gynecol. Oncol. 131, 650–654. doi:10.1016/j.ygyno.2013.10.003
Li, E., Wei, B., Wang, X., and Kang, R. (2020). METTL3 Enhances Cell Adhesion through Stabilizing Integrin β1 mRNA via an m6A-HuR-dependent Mechanism in Prostatic Carcinoma. Am. J. Cancer Res. 10, 1012–1025.
Li, H., Jiang, H., Huang, Z., Chen, Z., and Chen, N. (2021). Prognostic Value of an m5C RNA Methylation Regulator-Related Signature for Clear Cell Renal Cell Carcinoma. Cmar Vol. 13, 6673–6687. doi:10.2147/cmar.s323072
Lin, S., Choe, J., Du, P., Triboulet, R., and Gregory, R. I. (2016). The M 6 A Methyltransferase METTL3 Promotes Translation in Human Cancer Cells. Mol. Cel. 62, 335–345. doi:10.1016/j.molcel.2016.03.021
Liu, J., Eckert, M. A., Harada, B. T., Liu, S.-M., Lu, Z., Yu, K., et al. (2018a). m6A mRNA Methylation Regulates AKT Activity to Promote the Proliferation and Tumorigenicity of Endometrial Cancer. Nat. Cel Biol 20, 1074–1083. doi:10.1038/s41556-018-0174-4
Liu, J., Ren, D., Du, Z., Wang, H., Zhang, H., and Jin, Y. (2018b). m 6 A Demethylase FTO Facilitates Tumor Progression in Lung Squamous Cell Carcinoma by Regulating MZF1 Expression. Biochem. biophysical Res. Commun. 502, 456–464. doi:10.1016/j.bbrc.2018.05.175
Liu, S., Wang, F., Tan, W., Zhang, L., Dai, F., Wang, Y., et al. (2020). CTLA4 Has a Profound Impact on the Landscape of Tumor-Infiltrating Lymphocytes with a High Prognosis Value in clear Cell Renal Cell Carcinoma (ccRCC). Cancer Cel Int 20, 519. doi:10.1186/s12935-020-01603-2
Long, J., Wang, A., Bai, Y., Lin, J., Yang, X., Wang, D., et al. (2019). Development and Validation of a TP53-Associated Immune Prognostic Model for Hepatocellular Carcinoma. EBioMedicine 42, 363–374. doi:10.1016/j.ebiom.2019.03.022
Lopez-Yrigoyen, M., Cassetta, L., and Pollard, J. W. (2021). Macrophage Targeting in Cancer. Ann. N. Y Acad. Sci. 1499, 18–41. doi:10.1111/nyas.14377
Ma, J. Z., Yang, F., Zhou, C. C., Liu, F., Yuan, J. H., Wang, F., et al. (2017). METTL14 Suppresses the Metastatic Potential of Hepatocellular Carcinoma by Modulating N 6 ‐methyladenosine‐dependent Primary MicroRNA Processing. Hepatology 65, 529–543. doi:10.1002/hep.28885
Nombela, P., Miguel-López, B., and Blanco, S. (2021). The Role of m6A, m5C and Ψ RNA Modifications in Cancer: Novel Therapeutic Opportunities. Mol. Cancer 20, 18. doi:10.1186/s12943-020-01263-w
Padala, S. A., and Kallam, A. (2022) “Clear Cell Renal Carcinoma,” in StatPearls (StatPearls Publishing; Treasure Island (FL)). Copyright © 2022
Popov, H., Donev, I. S., and Ghenev, P. (2018). Quantitative Analysis of Tumor-Associated Tissue Eosinophilia in Recurring Bladder Cancer. Cureus 10, e3279. doi:10.7759/cureus.3279
Rajput, A. B., Turbin, D. A., Cheang, M. C., Voduc, D. K., Leung, S., Gelmon, K. A., et al. (2008). Stromal Mast Cells in Invasive Breast Cancer Are a Marker of Favourable Prognosis: a Study of 4,444 Cases. Breast Cancer Res. Treat. 107, 249–257. doi:10.1007/s10549-007-9546-3
Sakita-Suto, S., Kanda, A., Suzuki, F., Sato, S., Takata, T., and Tatsuka, M. (2007). Aurora-B Regulates RNA Methyltransferase NSUN2. MBoC 18, 1107–1117. doi:10.1091/mbc.e06-11-1021
Sato, G., Saijo, Y., Uchiyama, B., Kumano, N., Sugawara, S.-i., Fujimura, S., et al. (1999). Prognostic Value of Nucleolar Protein P120 in Patients with Resected Lung Adenocarcinoma. Jco 17, 2721. doi:10.1200/jco.1999.17.9.2721
Siegel, R. L., Miller, K. D., and Jemal, A. (2018). Cancer Statistics, 2018. Cancer J. clinicians 68, 7–30. doi:10.3322/caac.21442
Squires, J. E., Patel, H. R., Nousch, M., Sibbritt, T., Humphreys, D. T., Parker, B. J., et al. (2012). Widespread Occurrence of 5-methylcytosine in Human Coding and Non-coding RNA. Nucleic Acids Res. 40, 5023–5033. doi:10.1093/nar/gks144
Su, R., Dong, L., Li, C., Nachtergaele, S., Wunderlich, M., Qing, Y., et al. (2018). R-2HG Exhibits Anti-tumor Activity by Targeting FTO/m6A/MYC/CEBPA Signaling. Cell 172, 90–105. e123. doi:10.1016/j.cell.2017.11.031
Tamma, R., Rutigliano, M., Lucarelli, G., Annese, T., Ruggieri, S., Cascardi, E., et al. (2019) Microvascular Density, Macrophages, and Mast Cells in Human clear Cell Renal Carcinoma with and without Bevacizumab Treatment, Urol. Oncol. 37, 355.e11-355.e19.doi:10.1016/j.urolonc.2019.01.025
Trixl, L., and Lusser, A. (2019). The Dynamic RNA Modification 5-methylcytosine and its Emerging Role as an Epitranscriptomic Mark. Wiley Interdiscip. Rev. RNA, 10, e1510. doi:10.1002/wrna.1510
Wang, Y., Cong, R., Liu, S., Zhu, B., Wang, X., and Xing, Q. (2021). Decreased Expression of METTL14 Predicts Poor Prognosis and Construction of a Prognostic Signature for clear Cell Renal Cell Carcinoma. Cancer Cel Int 21, 46. doi:10.1186/s12935-020-01738-2
Wang, Y., Wang, Y., Xu, L., Lu, X., Fu, D., Su, J., et al. (2018). CD4 + T Cells Promote Renal Cell Carcinoma Proliferation via Modulating YBX1. Exp. Cel. Res. 363, 95–101. doi:10.1016/j.yexcr.2017.12.026
Weng, H., Huang, H., Wu, H., Qin, X., Zhao, B. S., Dong, L., et al. (2018) METTL14 Inhibits Hematopoietic Stem/Progenitor Differentiation and Promotes Leukemogenesis via mRNA m6A Modification, Cell stem cell 22, 191–205.e199.doi:10.1016/j.stem.2017.11.016
Yang, Z., Li, J., Feng, G., Gao, S., Wang, Y., Zhang, S., et al. (2017). MicroRNA-145 Modulates N6-Methyladenosine Levels by Targeting the 3′-Untranslated mRNA Region of the N6-Methyladenosine Binding YTH Domain Family 2 Protein. J. Biol. Chem. 292, 3614–3623. doi:10.1074/jbc.m116.749689
Yi, M., Li, A., Zhou, L., Chu, Q., Luo, S., and Wu, K. (2021). Immune Signature-Based Risk Stratification and Prediction of Immune Checkpoint Inhibitor's Efficacy for Lung Adenocarcinoma. Cancer Immunol. Immunother. 70, 1705–1719. doi:10.1007/s00262-020-02817-z
Zhang, Q., Liu, F., Chen, W., Miao, H., Liang, H., Liao, Z., et al. (2021). The Role of RNA m5C Modification in Cancer Metastasis. Int. J. Biol. Sci. 17, 3369–3380. doi:10.7150/ijbs.61439
Zhou, J., Tang, Z., Gao, S., Li, C., Feng, Y., and Zhou, X. (2020). Tumor-Associated Macrophages: Recent Insights and Therapies. Front. Oncol. 10, 188. doi:10.3389/fonc.2020.00188
Zhou, S., Bai, Z.-L., Xia, D., Zhao, Z.-J., Zhao, R., Wang, Y.-Y., et al. (2018). FTO Regulates the Chemo-Radiotherapy Resistance of Cervical Squamous Cell Carcinoma (CSCC) by Targeting β-catenin through mRNA Demethylation. Mol. carcinogenesis 57, 590–597. doi:10.1002/mc.22782
Keywords: renal clear cell cancer, N6-methyladenose, prognosis, The Cancer Genome Atlas, 5-methylcytosine, tumor microenvironment
Citation: Li L, Tao Z, Zhao Y, Li M, Zheng J, Li Z and Chen X (2022) Prognostic Characteristics and Immune Effects of N6-Methyladenosine and 5-Methylcytosine-Related Regulatory Factors in Clear Cell Renal Cell Carcinoma. Front. Genet. 13:864383. doi: 10.3389/fgene.2022.864383
Received: 28 January 2022; Accepted: 14 March 2022;
Published: 27 April 2022.
Edited by:
William C. Cho, QEH, Hong Kong SAR, ChinaReviewed by:
Ziheng Wang, Affiliated Hospital of Nantong University, ChinaCopyright © 2022 Li, Tao, Zhao, Li, Zheng, Li and Chen. This is an open-access article distributed under the terms of the Creative Commons Attribution License (CC BY). The use, distribution or reproduction in other forums is permitted, provided the original author(s) and the copyright owner(s) are credited and that the original publication in this journal is cited, in accordance with accepted academic practice. No use, distribution or reproduction is permitted which does not comply with these terms.
*Correspondence: Xiaonan Chen, Y2hlbnhuQGNtdS5lZHUuY24=
Disclaimer: All claims expressed in this article are solely those of the authors and do not necessarily represent those of their affiliated organizations, or those of the publisher, the editors and the reviewers. Any product that may be evaluated in this article or claim that may be made by its manufacturer is not guaranteed or endorsed by the publisher.
Research integrity at Frontiers
Learn more about the work of our research integrity team to safeguard the quality of each article we publish.