 Henrique Alberto Mulim1
 Luiz F. Brito2
 Luís Fernando Batista Pinto1José Luis Moletta3Lilian Regina Da Silva4
 Victor Breno Pedrosa1,2,5*
- 1Department of Animal Science, Federal University of Bahia, Salvador, Brazil
- 2Department of Animal Sciences, Purdue University, West Lafayette, IN, United States
- 3Agronomic Institute of Paraná—IAPAR, Ponta Grossa, Brazil
- 4NEOGEN Corporation, Pindamonhangaba, Brazil
- 5Department of Animal Science, State University of Ponta Grossa, Ponta Grossa, Brazil
Purunã is a composite beef cattle breed, developed in Southern Brazil by crossing the Angus, Charolais, Canchim, and Caracu breeds. The goal of this study was to perform the first genetic characterization of the Purunã breed, based on both pedigree and genomic information. For this, 100 randomly selected animals were genotyped, and 11,205 animals born from 1997 to 2019 had pedigree information. The genetic analyses performed were principal component analysis, admixture, phylogenic tree, pedigree and genomic inbreeding, linkage disequilibrium (LD), effective population size (Ne), consistency of the gametic phase, runs of homozygosity (ROH), heterozygosity-enriched regions (HERs), and functional analyses of the ROH and HER regions identified. Our findings indicate that Purunã is more genetically related to the Charolais, Canchim, and Angus breeds than Caracu or Nellore. The levels of inbreeding were shown to be small based on all the metrics evaluated and ranged from −0.009 to 0.029. A low (−0.12–0.31) correlation of the pedigree-based inbreeding compared to all the genomic inbreeding coefficients evaluated was observed. The LD average was 0.031 (±0.0517), and the consistency of the gametic phase was shown to be low for all the breed pairs, ranging from 0.42 to 0.27 to the distance of 20 Mb. The Ne values based on pedigree and genomic information were 158 and 115, respectively. A total of 1,839 ROHs were found, and the majority of them are of small length (<4 Mb). An important homozygous region was identified on BTA5 with pathways related to behavioral traits (sensory perception, detection of stimulus, and others), as well as candidate genes related to heat tolerance (MY O 1A), feed conversion rate (RDH5), and reproduction (AMDHD1). A total of 1,799 HERs were identified in the Purunã breed with 92.3% of them classified within the 0.5–1 Mb length group, and 19 HER islands were identified in the autosomal genome. These HER islands harbor genes involved in growth pathways, carcass weight (SDCBP), meat and carcass quality (MT2A), and marbling deposition (CISH). Despite the genetic relationship between Purunã and the founder breeds, a multi-breed genomic evaluation is likely not feasible due to their population structure and low consistency of the gametic phase among them.
1 Introduction
The characterization of the population structure and genetic diversity is essential for the understanding of the genetic background of environmental adaptation and conservation of cattle genetic resources (Xia et al., 2021). Such characterization and diversity assessment need to be considered when designing or updating breeding programs and conservation strategies that can be applied in purebred and crossbred populations.
The Purunã breed is a composite population developed in Southern Brazil by crossing Angus, Charolais, Canchim, and Caracu, in identical proportions. This was performed to improve key traits of interest and exploit the complementarity among the breeds (Otto et al., 2021), especially for production in pasture-based systems. The background research to generate the Purunã breed started at the Agronomic Institute of Paraná (IAPAR; Ponta Grossa, Paraná, Brazil) at the beginning of the 1980s, when IAPAR researchers estimated the heterosis in the crossbred progenies of Charolais x Caracu and Angus x Canchim (Perotto et al., 2000a; Perotto et al., 2000b). Almost 15 years later, the first results were obtained from this experiment, where the heterosis retained from those crosses resulted in higher hot carcass weight, hot carcass yield, rib-eye area, better carcass conformation from Charolais x Caracu (Perotto et al., 2000b), and higher average weight daily gain in different ages with the crosses of Angus x Canchim (Perotto et al., 2000a).
Based on the first results, IAPAR researchers conducted a second mating to generate another set of animals using the progenies resulting from the previous F1 population. The goal at that point was to combine all favorable characteristics in a composite that presented a heavyweight and produce a high-quality carcass. The hypothesis for using the breeds mentioned earlier was to capture a particular contribution from each breed to create a composite population with higher productive performance and adapted to the tropical and subtropical regions of Brazil. The Angus breed provided traits related to precocity, more docile temperament, and high meat quality (Cristiana and Mirela, 2018; Taye et al., 2018); Charolais provided a higher weight gain and carcass yield (Jahuey-Martínez et al., 2019), and finally, Caracu and Canchim contributed with rusticity, heat tolerance, and parasite resistance (Urbinati et al., 2016; Pires et al., 2021). Such animals are very well adapted to tropical environmental conditions and showed good potential to gain weight (Ito et al., 2010). The characterization of Purunã, defined by the Brazilian Purunã Cattle Breed Association (Ponta Grossa, Paraná, Brazil), is that the animals must present short hair with a shiny aspect, admitting variation on the coat color (red, white, black, and bay), medium-to-large size, and good muscle distribution as shown in Figure 1. Additionally, the animals are expected to be docile and prolific, with sexual precocity and fast carcass finishing.
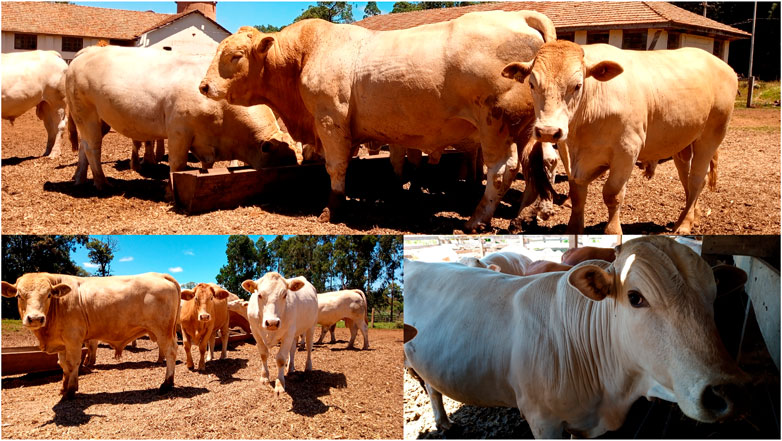
FIGURE 1. Purunã animals from the Agronomic Institute of Paraná (IAPAR, Ponta Grossa, Parana, Brazil).
Some studies in Brazil have evaluated the performance of the Purunã breed for carcass traits (Ito et al., 2010), meat production and quality traits (Missio et al., 2015), growth (Moura et al., 2014), and weight at different time points (Otto et al., 2021). These studies indicate animals slaughtered at 24 months of age, weighed an average of 460 kg, possessed a fat thickness close to 3 mm, and had a substantial concentration of fatty acids in the meat. In addition, estimates of genetic parameters for growth traits have demonstrated heritable estimates (0.05–0.21) for body weights measured at different ages (Otto et al., 2021). However, no previous research to date has evaluated the genetic diversity and population structure of the Purunã breed. Although the crossbreeding increases the genetic variability of a population, their development history and population management across generations could have impacted the genetic diversity of the population formed (Peripolli et al., 2020). Genetic diversity studies play an important role in the constitution of a crossbreeding program since how the variability is controlled may interfere with the heterosis produced and impact the expected hybrid vigor.
Genetic diversity studies are crucial in the initial phase, called pre-breeding, in which it is possible to regenerate, characterize, explore, and promote the conservation of variability of the population (Pontes et al., 2020). The parameters estimated include inbreeding coefficients of the individual animals, the genetic relationship between animals, and overall levels of homozygous and heterozygous regions in the genome as well as their distribution along the chromosomes (Biscarini et al., 2020). Furthermore, linkage disequilibrium needs to be estimated for better implementing genomic selection and for identifying conserved segments of the genome among breeds (Larmer et al., 2014). All these metrics contribute to a better understanding of the genetic events that happen in the population, the impact of decisions made in the past, and the strategies that will be taken in the future. Our goal with this study was to characterize the genetic and genomic diversity and the population structure of a new composite beef cattle breed—Purunã, based on genomic and pedigree information.
2 Material and Method
One hundred animals of the Purunã breed were randomly sampled and genotyped using the GGP Bovine 100K array (GGP, 2021) containing over 100,000 single nucleotide polymorphisms (SNPs). The genetic material was provided by the Agronomic Institute of Paraná (IAPAR, Ponta Grossa, Paraná, Brazil). For the genotype quality control (QC), only autosomal chromosomes were retained and a QC was performed separately for each analysis. For runs of homozygosity (ROH) and heterozygous-enriched regions (HER), we removed SNPs with call rate lower than 0.90, duplicated position, non-autosomes, or without a known position (Ferenčaković et al., 2013; Biscarini et al., 2020). For the other analyses, minor allele frequency (MAF <0.05) and extreme departure from the Hardy-Weinberg equilibrium (HWE <10–6) parameters were also used to filter out SNPs.
For the pedigree database, information from 11,205 animals born between 1997 and 2019 was considered, where 5,224 were males and 5,981 females, and the base population was formed by 3,999 animals. These data were used to create the pedigree database including information on individual animals, sire, dam, sex, and birth date.
2.1 Population Stratification
2.1.1 Principal Component Analysis
To assess the similarities between the Purunã breed and Angus, Canchim, Charolais, and Nellore breeds, we performed a principal component analysis (PCA) by PLINK v1.9 software (Purcell et al., 2007). The genotypes of the Angus, Charolais, and Canchim were retrieved from the WIDDE database (Sempéré et al., 2015), and the Nellore breed genotypes were provided by the Katayama Agropecuaria Ltda breeding company. The PCA was estimated based on the standardized variance of the genomic relationship matrix (G) where the covariance of each SNP was divided by the respective variance, using only the SNPs in common for all breeds (after the QC), as the following equation proposed by (VanRaden, 2008):
where M is a matrix of counts of allele A, pi is the frequency of allele A of ith SNP, and P is a matrix with each row containing the pi values.
2.1.2 Admixture Analysis
The admixture analysis was performed using the ADMIXTURE software (Alexander et al., 2015) to assess the evolutionary history between the Purunã breed and its founder breeds (Angus, Charolais, Canchim, and Nellore). This analysis estimates ancestries by efficiently computing maximum likelihood estimates in a parametric model as (Alexander and Lange, 2011):
where pij is the success probability in the binomial distribution nij ∼ Bin(2, pij) depending on the fraction qik of i’s ancestry attributable to population k and on the frequency fkj of allele 1 in the population k. The matrices Q = (qik) and F = (fkj).
The success of the analysis is dependent on the correct choice of K, which represents the number of ancestral populations. We evaluated K equal to 1 until 20, but only K = 2 and 3 were chosen to be shown here, which have more biological interpretation and K = 3 had the smallest cross-validation error. The “pong” package (Behr et al., 2016) was used to cluster the results and visualize the population structure.
2.1.3 Phylogenetic Tree
To estimate the distance among the populations, we used the hapFLK software (Fariello et al., 2013) based on the approach described by Bonhomme et al. (2010). The neighbor-joining tree was built from the Reynolds’ genetic distances (Reynolds et al., 1983) between pairs of populations. Reynold’s distance was estimated using the co-ancestry coefficient, where this coefficient is the probability that a random pair of genes at the same locus within a randomly chosen population is identical-by-descent, providing a natural measure of genetic drift. It is assumed that the allele frequency is equal to
where p is the frequency,
2.2 Population Structure
2.2.1 Inbreeding Metrics
Six models of inbreeding coefficient estimates were analyzed. The first model was based on pedigree information (FPED), using the ENDOG v4.8 software (Gutiérrez et al., 2010), following the method proposed by Meuwissen and Luo (1992) in which the average F of a given generation t (Ft) was calculated as follows:
in which ΔF is the change in the inbreeding rate from one generation to another, as the following equation:
in which Ft and Ft-1 represent the average inbreeding estimates for the current and the previous generation (Falconer and Mackay, 1996).
The second method was based on the homozygous genotypes observed and expected (FHOM1), calculated as follows (Purcell et al., 2007):
where
The third method was based on genotype additive variance (FGRM), using the following model (VanRaden, 2008):
where xi is the number of reference allele copies of the ith SNP, and pi is the reference allele frequency in the population. Similar to the second method, the methodology FHOM2 was based on homozygous genotypes following the model:
The aforementioned models are all dependent on the genotype allele frequency, and for this reason, a fifth model was a test based on the correlation between uniting gametes (FUNI) using the following model Yang et al. (2010):
The last method was based on the sum of ROH individual length divided by the total length of the autosomal genome (FROH) using the following equation (McQuillan et al., 2008):
where
2.2.2 Linkage Disequilibrium
The linkage disequilibrium (r2) was estimated by PLINK v1.9 software. To observe the r2 decrease along with the increase in the marker distance, we used the binning approach estimating the r2 average of each distance from 10 to 100 kb in each 10 kb, and after the distance of 100 kb in each 100 kb until the distance of 1,000 kb (1 Mb). As a preliminary analysis, we defined that the bins reported in this study were required to have at least 50 pairwise markers to estimate the binned average of r2.
2.2.3 Effective Population Size
Two methodologies were used to estimate the effective population size (Ne). The first method used pedigree information through the following equation:
where Ft and Ft−1 are the average inbreeding of offspring and their parents, respectively (Falconer and Mackay, 1996). The estimate was performed using the POPREP software (Groeneveld et al., 2009).
The second method was performed using genomic information, and investigated with the relationship method between LD variances and Ne through the following formula (Corbin et al., 2012):
where Ne is the effective population size at the tth generation, ct is the recombination rate for the physical distance between the markers, α is the probability for the occurrence of mutation, and r2 is the LD value.
2.2.4 Consistency of the Gametic Phase
The consistency of the gametic phase (CGP) was taken by the square root of r2 values adding the sign from the disequilibrium metric (D), as:
where p(a) is the frequency of the haplotype-a, p(b) is the frequency of the haplotype-b, and pab is the haplotype frequency with allele a on the first locus and allele b on the second locus. The CGP was assumed as the Person correlation between each founder breed and Purunã using the signed-squared-root values. To estimate the CGP, only the SNPs in common (after the quality control) between each breed pair were used to estimate the CGP based on the same distance and bin described in the LD section.
2.3 Proportion of Polymorphic SNPs and Distributions of SNPs by the MAF Range
The proportion of polymorphic SNPs, after QC, was calculated based on the MAF. The distributions of SNPs were calculated on 10 MAF ranges from 0 to 0.5 defined every 0.05 points in MAF.
2.4 Runs of Homozygosity
The PLINK v1.9 software was used for the ROH identification based on the following criteria:
• One heterozygous and one missing SNP were allowed;
• The window of the threshold used was 0.05;
• The gap between consecutive SNPs could not be higher than 1,000 kb;
• The minimum length of an ROH was 500 kb;
• The minimum number of consecutive SNPs that create an ROH must be equal to or greater than 30;
• The density of 1 SNP used in at least 50 kb;
• A sliding genomic window was used with 50 SNPs.
ROHs were classified in the following classes: <2 Mb, 2–4 Mb, 4–8 Mb, 4–16 Mb, and >16 Mb (Lozada-Soto et al., 2021; Mulim et al., 2022). A region found in 36% of the population was considered for future analysis (functional and phylogenetic analysis).
2.5 Heterozygosity-Enriched Regions
The detectRUNS package (Biscarini et al., 2019) was used for the detection of HER following the consecutive-SNPs method. For the SNPs’ consecutive analysis, the following parameters were considered:
• a minimum number of 20 consecutive SNPs constitutes an HER;
• a minimum length of 500 kb;
• a minimum of two homozygous and one missing SNP is allowed; and
• the maximum gap between consecutive SNPs could not be higher than 1,000 kb.
The genomic regions that showed at least 10% of the animals with HER were included in the subsequent functional analyses and phylogenetic tree.
2.6 Functional Analyses
The genomic regions considered as ROH and HER islands were used for genomic annotations. The GALLO package (Fonseca P. A. S. et al., 2020) was used for the annotation of genes in these regions, with the annotated data for Bos taurus from the Ensembl database (www.ensembl.org/Bos_taurus/Info/Index), version ARS-UCD1.2 (Rosen et al., 2020). Subsequently, the WebGestaltR package (Wang et al., 2020) was used for the Gene Ontology (GO) analyses to identify biological processes, molecular functions, and cellular components in which the positional candidate genes are involved in.
3 Results
3.1 Population Stratification
3.1.1 Principal Component Analysis
The PCA among the populations of Purunã, Angus, Canchim, Charolais, and Nellore is presented in Figure 2A. The first principal component (PC1) explained 20.2% of the variation among the populations, while the second principal component (PC2) accounted for 3.2%. As shown in Figure 2A, the animals are grouped within breeds, with no clear mixture between groups, even for composite populations such as Purunã. The breeds closer to the Purunã are Charolais, Canchim, and Angus.
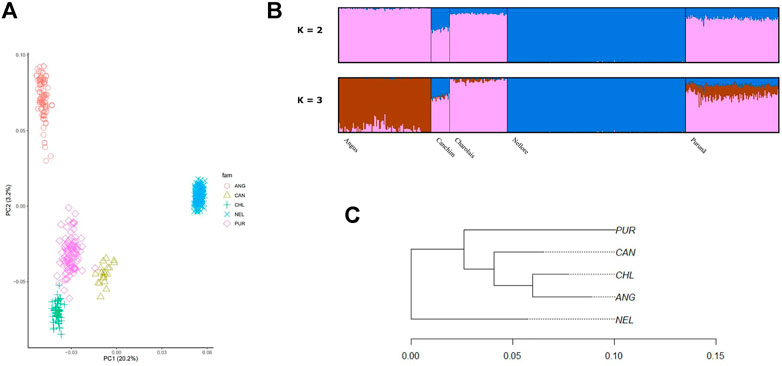
FIGURE 2. Population stratification of the Purunã breed. (A) Principal component analysis (PCA) including Purunã, Angus, Canchim, Charolais, and Nellore breed animals. (B) Admixture analysis of Purunã, Angus, Canchim, Charolais, and Nellore breeds. (C) Phylogenetic tree using Reynold’s distance for the Purunã (PUR), Angus (ANG), Canchim (CAN), Charolais (CHL), and Nellore (NEL) populations.
3.1.2 Admixture Analysis
Figure 2B presented the admixture analysis for Purunã, Angus, Canchim, Charolais, and Nellore populations for K = 2 and 3. For K = 2, two groups were observed and the mixture between them indicates that two distinct founder populations (Bos taurus taurus and Bos taurus indicus) were used when developing the Purunã breed. In average, Angus had 99.2% and 0.9%, Canchim 60.6% and 39.4%, Charolais 89.6% and 10.4%, Nellore 99.8% and 0.2%, and Purunã had 80.8% and 19.2% from ancestral population 1 and 2, respectively. For K = 3, three groups were observed to affect the admixture analysis for the population in the study. This result (K = 3) indicates more contribution from Charolais and Canchim in the Purunã breed, following the Angus breed and a small proportion of the Nellore breed.
3.1.3 Phylogenetic Tree
Figure 2C shows the genomic population tree for the breeds Purunã (PUR), Angus (ANG), Charolais (CHL), Canchim (CAN), and Nellore (NEL). There is a division into groups on the tree but the distance from one group to another is not high (0.05). Nellore appears in one section while Purunã, Canchim, Charolais, and Angus are situated in three other nodes, grouping in accord with clades of breed proximity.
3.2 Population Structure
3.2.1 Inbreeding
The averages of inbreeding coefficients are presented in Table 1.
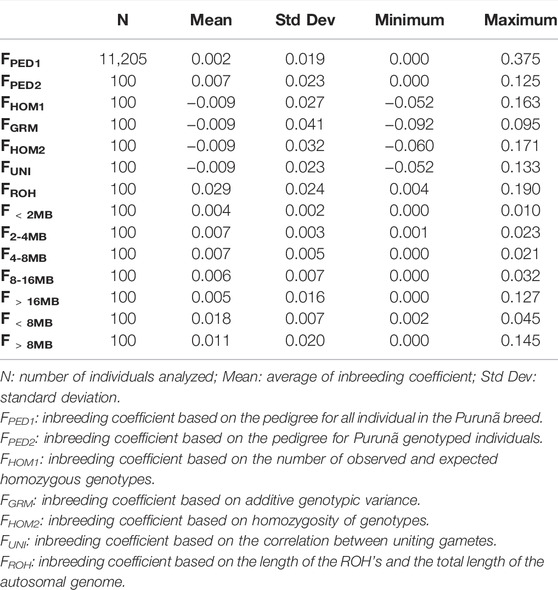
TABLE 1. Inbreeding coefficient estimates with different methodologies for animals of the Purunã breed.
The average for the inbreeding coefficient estimated based on pedigree for all Purunã individuals (FPED2) was 0.002. The methods FHOM1, FHOM2, FUNI, and FGRM were the methods showing the lowest average values (−0.009), while the highest inbreeding coefficient average was obtained by the FROH metric (0.029). The correlations among the inbreeding coefficients method are presented in Figure 3.
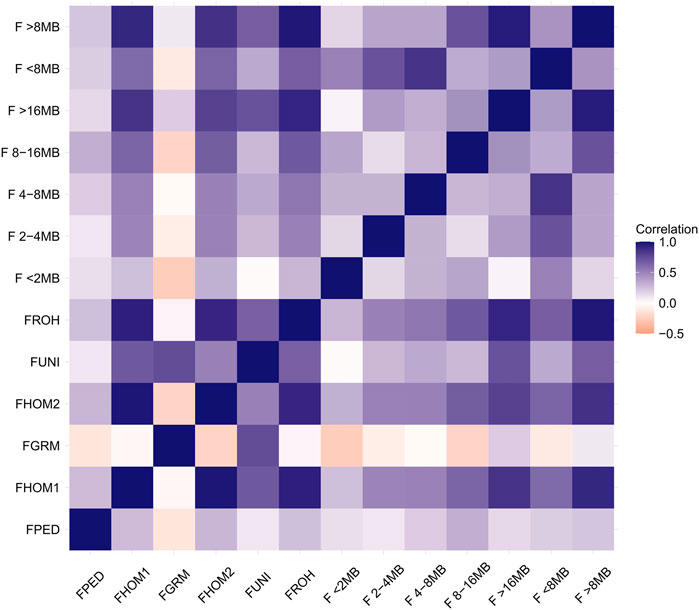
FIGURE 3. Correlation among inbreeding estimation methods.
Strong correlations were found between the methods: FHOM1-FHOM2 (0.97), FHOM1-FROH (0.93), FHOM1-F>16MB (0.85), FHOM1-F>8MB (0.89), FHOM2-FROH (0.90), FHOM2-F>16MB (0.79), and FHOM2-F>8MB (0.85). Low values were found for all correlations among FPED and the other methods. The FGRM method shows a very weak correlation for almost all the methods, except for the FUNI, when the correlation was classified as moderate (0.74). Negative correlations were found for the methods: FGRM-FHOM2 (−0.21), FGRM-F<2MB (−0.24), FGRM-F2–4MB (−0.08), FGRM-F4–8MB (−0.01), FGRM-F8–16MB (−0.21), FGRM-F<8MB (−0.11), and FGRM-FPED (−0.12).
3.2.2 Linkage Disequilibrium
The average LD ranged from 0.43 to 0.04, with a distance between two markers of 10 to 1,000 kb, respectively. The general average of LD was 0.031 (±0.0517) at the average distribution of the markers 4.856 (±2.8890) Mb. The decrease in LD with an increase in the marker distance can be observed in Supplementary Figure S1.
3.2.3 Effective Population Size
The effective population size based on pedigree was 158 for the current generation. On the other hand, the genomic-based Ne differed based on the generation and software used. The SNeP software (Barbato et al., 2015) and the PLINK software enabled the estimation of Ne up to the 13th and 5th generation back, respectively. For the SNeP, in the 13th generation, the Ne was 229, while for the PLINK, the result for the same generation was 207. The Ne estimated for the 5th generation on PLINK was equal to 115.
3.2.4 Consistency of the Gametic Phase
The consistency of the gametic phase between Purunã and Angus, Canchim, Charolais, and Nellore is presented in Table 2.
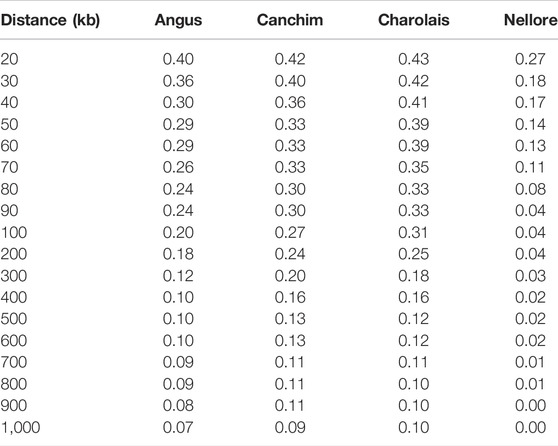
TABLE 2. Consistency of the gametic phase based on Pearson correlation, between the Purunã breed and its founder breeds: Angus, Canchim, Charolais, and Nellore breeds.
The highest correlation, at 20 kb between SNP pairs, between Purunã and the other breeds was found with Charolais (0.43), followed by Canchim (0.42), Angus (0.40), and Nellore (0.27). The distance of 10 kb showed a lower number of pairwise markers than the threshold (<50) used as a criterion. Therefore, these results were not presented.
3.3 Proportion of Polymorphic SNPs and Distribution of SNPs by MAF Range
The proportion of polymorphic SNPs based on the MAF category were as follows: MAF0.00-0.05 3,232 (3.67%); MAF0.05-0.10 2,967 (3.37%); MAF0.10-0.15 4,242 (4.82%); MAF0.15-0.20 5,792 (6.59%); MAF0.20-0.25 7,255 (8.25%); MAF0.25-0.30 9,314 (10.59%); MAF0.30-0.35 11,287 (12.83%); MAF0.35-0.40 13,283 (15.10%); MAF0.40-0.45 14,932 (16.98%); and MAF0.45-0.50 15,652 (17.80%).
3.4 Runs of Homozygosity
A total of 1,839 ROHs were found for the Purunã breed. The distribution along all autosomal genomes can be observed in Figure 4A and the ROH length size division. The length of ROH observed here can be classified as 37.4% for <2 Mb; 25.3% as 2–4 Mb; 17.1% as 4–8 Mb; 7.6% as 8–16 Mb; and only 2.6% ROH greater than 16 Mb. The chromosome that presented the highest amount of ROHs was the BTA5, followed by the BTA1, where the concentration of ROHs >16 Mb was superior compared to all other autosomes. The chromosomes that showed the smallest number of ROHs were the BTA27 and BTA25, representing a small fraction of regions in ROH.
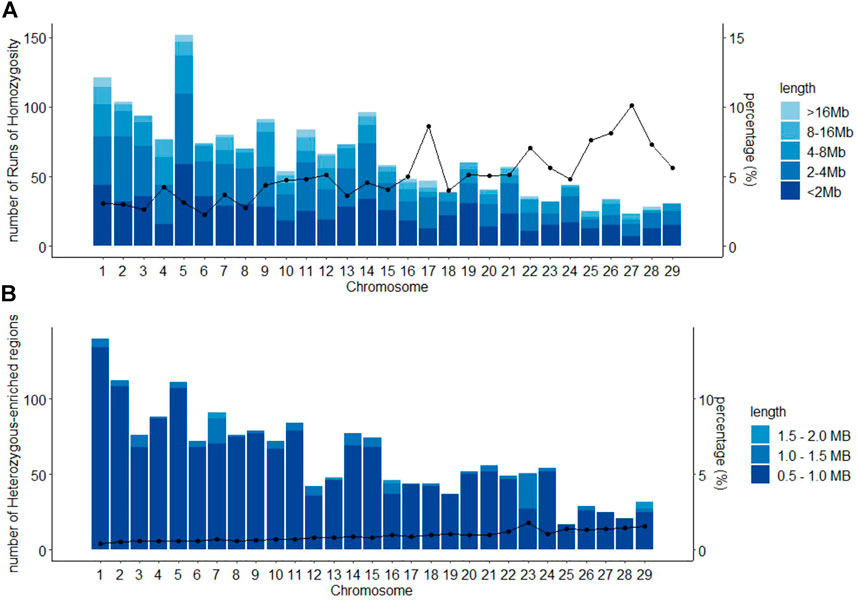
FIGURE 4. Classification of runs of homozygosity ROH (A) and heterozygous-enriched regions HER (B), by chromosome, according to the length size in the Purunã breed, and the average percentage of chromosome covered by ROHs/HERs.
3.5 Heterozygous-Enriched Regions
In total, 1,799 HERs were found in the Purunã breed. The HER pattern distribution along with all autosomal genomes is shown in Figure 4B. Around 92.3% of the HERs found were classified in the length of 0.5–1.0 Mb; 7.0% as 1.0–1.5 Mb; and 0.7% as 1.5–2.0 Mb. No HER greater than 2 Mb was found for Purunã. The chromosome that presented the highest amount of HER was the BTA1, while BTA25 had the smallest number of HER.
3.6 ROH and HER Islands and Functional Analyses
3.6.1 Runs of Homozygosity
With the ROH analysis, we found a common region in homozygosity present in 36% of the animals, despite the fact that Purunã is a recently-developed composite breed. This region is located on BTA5 between 54, 304, 681 bp and 62, 031, 799 bp, and has a length of 7.73 Mb, where 131 SNPs are present in this region. This region is responsible for coding 220 genes, with 181 protein-coding genes, seven pseudogenes, five long non-coding RNA, nine microRNA, ten miscellaneous RNA, six small nucleolar RNA, and two small nuclear RNA. The list of all the genes found in this region is presented in Supplementary Table S1. The significant Gene Ontology (GO) terms (p < 0.05) in which these genes are part of are presented in Table 3.
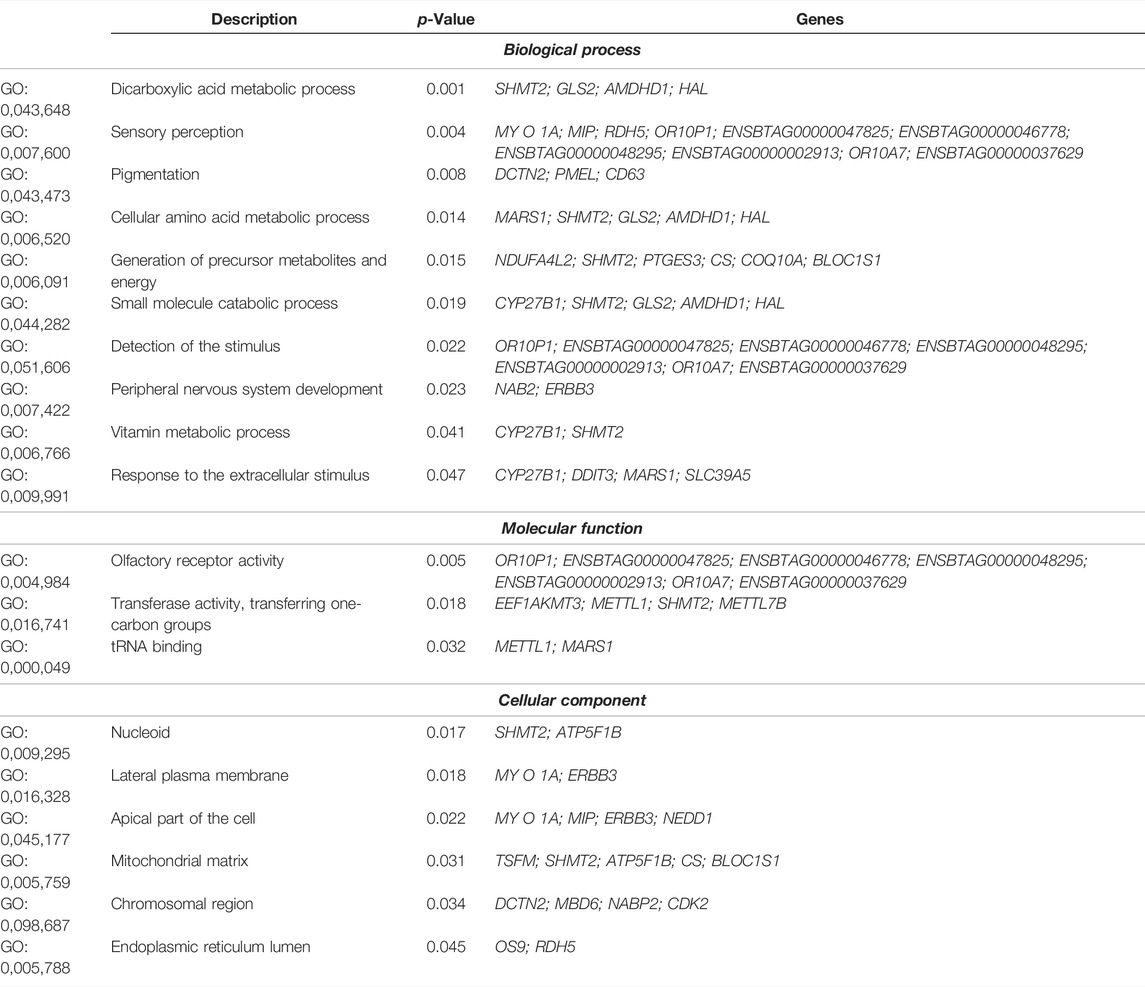
TABLE 3. Significant (p < 0.05) Gene Ontology (GO) terms for the genes located within runs of homozygosity regions in the Purunã breed.
Ten biological processes, three molecular functions, and six cellular components were identified in the significant pathways. Interestingly, pathways linked to animal behavior were found in this region, including sensory perception (GO:0007600), detection of stimulus (GO:0051606), response to extracellular stimulus (GO:0009991), olfactory receptor activity (GO:0004984), and others. To track the origin of this homozygous region in Purunã, we performed a phylogenetic tree analysis, using only the SNPs allocated in this region. Figure 5A shows the phylogenetic tree for the homozygous region found in BTA5. In this particular region, the breeds Purunã, Charolais, and Angus are closer together in comparison to the Canchim and Nellore breed, indicating that Charolais and Angus might have contributed to key behavioral characteristics observed in the Purunã breed.
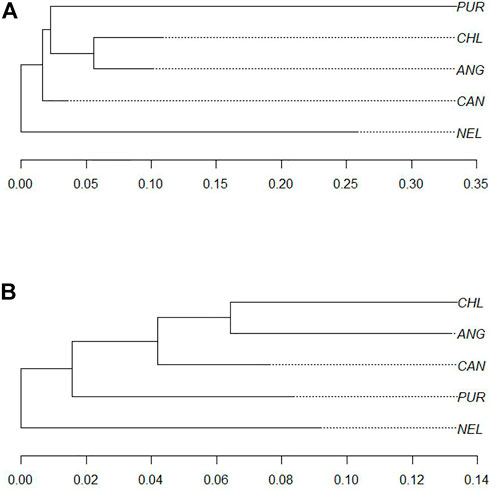
FIGURE 5. Phylogenetic trees. (A) Phylogenetic tree for homozygous regions comparing the Purunã (PUR), Angus (ANG), Canchim (CAN), Charolais (CHL), and Nellore (NEL) populations. (B) Phylogenetic tree for growth pathway in heterozygous-enriched regions comparing the Purunã (PUR), Angus (ANG), Canchim (CAN), Charolais (CHL), and Nellore (NEL) populations.
3.6.2 Heterozygous-Enriched Regions
For the HER analysis, the regions identified in at least 10% of the animals were considered as HER islands and used to verify the candidate genes and pathways. Table 4 presents the HER island found in the Purunã breed.
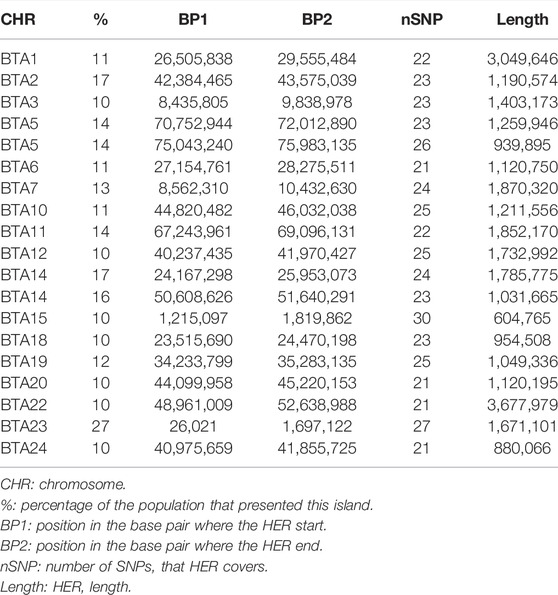
TABLE 4. Heterozygous-enriched regions (HER) which appear in at least 10% of Purunã individuals.
We found 19 HERs distributed in 17 chromosomes, where the BTA5 and BTA14 presented two HERs in each chromosome. The most frequent HER (27% of the population) was found in BTA23. The longest HER was found in BTA22 with a length size of 3.67 Mb, and the smallest HER was found in the BTA15 at 0.60 Mb.
All these regions are responsible for coding 413 genes, including 363 protein-coding, six pseudogenes, 13 long non-coding RNAs, seven microRNAs, two miscellaneous RNAs, one small nucleolar RNA, 15 small nuclear RNAs, three processed pseudogenes, and three ribosomal RNAs. The list of all the genes found in these regions is presented in Supplementary Table S2. The significant GO terms (p < 0.05) and their related genes are presented in Table 5.
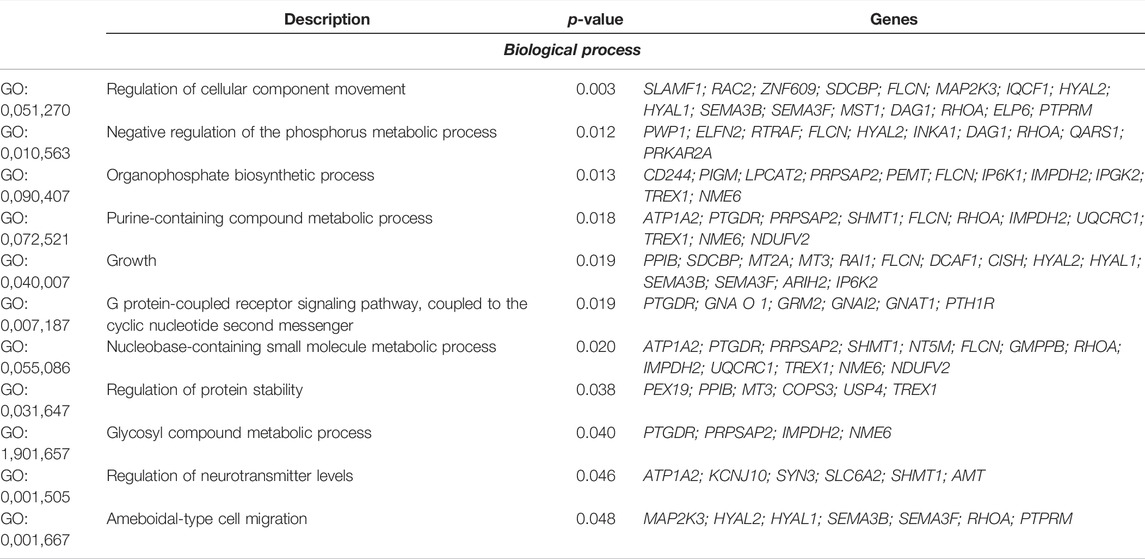
TABLE 5. Significant (p < 0.05) Gene Ontology (GO) terms, to biological process, to heterozygous-enriched regions found in the Purunã breed.
In total, we found 17 significant GO terms involved in biological processes, eight in molecular functions, and six in cellular components. Interesting regions related to the growth pathways (GO:0,040,007) were found in the heterozygous-enriched regions in BTA10, BTA14, BTA18, BTA19, and BTA20, where 14 genes are acting in higher variability in the population. The genes are PPIB (peptidylprolyl isomerase B), SDCBP (syndecan binding protein), MT2A and MT3 components of metallothionein, RAI1 (retinoic acid-induced 1), FLCN (folliculin), DCAF1 (DNA damage-binding protein 1), CISH (cytokine-inducible SH2), HYAL1 and HAYAL2 components of hyaluronidase, SEMA3B and SEMA3F components of semaforin, ARIH2 (ariadne RBR E3 ubiquitin protein ligase 2), and IP6K2 (inositol hexakisphosphate kinase 2). To track the origin of these heterozygous regions in Purunã, we used a phylogenetic tree analysis. Figure 5B shows the phylogenetic tree for the regions related to the growth pathway found in the heterozygous-enriched regions.
4 Discussion
Our main goal in this study was to genetically characterize the Purunã breed by estimating genetic diversity and population structure parameters based on both genomic and pedigree information. This breed was developed by crossing, in the same proportion, Charolais, Canchim, Angus, and Caracu breeds, while Canchim is also a composite breed that has Charolais and Nellore as the main founder breeds. Therefore, the average genetic proportion for Purunã is 13/32 Charolais, 8/32 Caracu, 8/32 Angus, and 3/32 Nellore.
Based on the results from the population stratification section, the Purunã breed seems to be genetically closer to Charolais, Canchim, and Angus, with the highest genomic contribution from the Charolais breed (Figure 2B, K = 3). Yet, our findings indicate that Purunã is closer to the Bos taurus taurus than Bos taurus indicus breeds. This was expected due to the greater contribution of taurine breeds in the formation of the Purunã breed.
4.1 Inbreeding Metrics
The maintenance of low levels of inbreeding is also desirable in composite breeds, once an advantage of crossbreeding is heterosis. Such heterosis is influenced by the genetic distance between the parental breeds and the level of inbreeding in the population, which can affect the degree of heterosis retention (Peripolli et al., 2020). As shown in Table 1, the inbreeding coefficient for all the metrics estimated in this study ranged from −0.009 (±0.041) to 0.029 (±0.024). These results are expected as the Purunã breed is a recently developed composite breed. The low level of inbreeding, with more emphasis on negative values (outbreeding), indicates that the probability of the two homologous genes within an individual being identical-by-descendent is smaller than two homologous genes drawn at random from the reference population and the ancestry shared into the population is small (Wang, 2014). However, in terms of gain or loss variability to a reference base population (Villanueva et al., 2021), the values indicated that some variability had been gained (through migration or gene flow from other populations) or, in the cases where the inbreeding coefficient was positive, a slight loss of variability.
An accurate measure of FPED could be expected when a complete, deep (many generations recorded) and no (or few) errors in the pedigree files. In the case of the Purunã breed, the information in the pedigree files goes to, on average, 2.35 generations. As the Purunã pedigree is shallow, the use of genomic information to estimate the inbreeding coefficients is a great alternative to access the inbreeding levels of the individuals. These inbreeding metrics, in addition, are not dependent on pedigree information, taking into account the Mendelian sampling variation (Doekes et al., 2019), the stochastic nature of recombination (Ferenčaković et al., 2013), and correcting the pedigree failure to assume that the founders of a population are unrelated (Rebelato et al., 2018). Yet, some metrics not only measure the levels of overall inbreeding but also give an estimate of when the inbreeding was created, as in the case of FROH.
The FROH captures the highest level of inbreeding, especially because the FROH metric is capable of capturing both recent and more ancient inbreeding (Ghoreishifar et al., 2020). As shown in Table 1, the value for the ancient inbreeding coefficient (F < 8 MB) is higher than more recent inbreeding (F > 8 MB). Such ancient inbreeding could be provided by ancient generations in ancient mating and still be in the population passing it through generations. This division between ancient and recent inbreeding is helpful to manage the diversity in the population. As not all inbreeding is expected to be equally unfavorable, recent inbreeding is expected to have more negative effects than ancient inbreeding (Doekes et al., 2019), therefore maintaining a low level of recent inbreeding coefficient is a desirable goal. Figure 3 illustrates the correlation among the inbreeding coefficient metrics. All the metrics showed a low correlation with FPED. Some authors have already mentioned that the genomic inbreeding metrics are more accurate in assessing individual inbreeding (Curik et al., 2014; Marras et al., 2015; Doekes et al., 2019). This happens due to the particularities mentioned before about the pedigree estimation, but as the FPED, each metric used to calculate the genomic inbreeding coefficient has its specificities and captures a different type of inbreeding that was originally defined by Wright (1922) and/or Malécot (1948).
The genomic metrics vary according to the weight that each marker gets to find the G matrix or the allele frequency for each marker (Howard et al., 2017). This affects how the inbreeding is calculated for each individual and the correlation among the metrics. The metrics FHOM and FROH weigh all the alleles equally, while the metrics FUNI and FGRM give more weight to rare alleles (Alemu et al., 2021). This could explain why the metrics FHOM and FROH, and FGRM and FUNI show moderate to strong correlation, while the FGRM and FHOM or the FROH classes had a negative correlation.
4.2 Linkage Disequilibrium, Effective Population Size, and Consistency of the Gametic Phase
Higher LD values were observed for markers located closer to each other and a faster decreased LD values were found as the distance between the markers increased, as observed in other crossbred or composite populations (Prieur et al., 2017; Deng et al., 2019). The extent of LD is strongly influenced by the population history, particularly in domestic animal populations, which have undergone bottlenecks during both domestication and the subsequent formation of breeds (Brito et al., 2015). Such LD is directly related to genomic selection, where the number of markers required to accurately predict breeding values depends on the LD (Larmer et al., 2014). Following the proposed equation by (McKay et al., 2007), the number of markers required for accurate genomic selection will be around 95,000 markers (2.67 GB/30 kb at LD = 0.2) for the Purunã breed. However, it is essential to highlight that for an implementation of genomic selection in Purunã, it is crucial that a sizable training population needs to be generated, to provide accurate genomic predictions of breeding values and selection.
Analysis of LD plays a central role in many areas of population genetics, including the determination of genetic maps, ascertainment of levels of recombination at the population level, and Ne estimation (D’Ambrosio et al., 2019). Based on all the metrics, the Ne estimates for Purunã are higher than 100 in the current generations, which is a threshold proposed by Meuwissen (2009) to ensure long-term population sustainability. The Ne estimate based on LD was able to be detected up to the fifth generation ago using the PLINK software (Purcell et al., 2007). We observed a slight divergence between the results from the SNeP and PLINK software, but not as high as reported by Barbato et al. (2015).
Understanding the LD levels, population structure, and CGP across breeds are crucial for implementing genomic selection (Brito et al., 2015). The CGP for all the evaluated breeds, including the Purunã, resulted in a low correlation, as shown in Table 2. These results indicate that the markers’ phase (or the phase between markers and QTL) is not consistent across breed pairs. In this context, the possible use of a multi-breed training population for genomic evaluations using these breeds (Purunã, Charolais, Canchim, and Angus) might not result in more accurate genomic breeding values. As the markers are not in the same phase across breeds, the ability to use one breed to determine the effects of SNP to aid in the selection of another population becomes less likely (Larmer et al., 2014).
4.3 Runs of Homozygosity
Figure 4A shows the number of ROHs found by chromosome in Purunã. The BTA5 showed a higher number of ROHs, as also observed in other beef cattle studies (Peripolli et al., 2018; Peripolli et al., 2020). The majority of ROH found (62.7%) were classified as short ROHs, and as the length of ROH is negatively correlated with the co-ancestry (Mastrangelo et al., 2018), the ROH found in Purunã were conceived in a more ancient generation. Taking the length of ROH and using the studies that estimate the ROH and correlate with the generation, as the work of Howrigan et al. (2011), the majority of ROH found in this study was created between 10 and 20 generations ago.
The ROH can be used for genome characterization and a better understanding of the implications of selection pressure (Marras et al., 2018). An interesting region was identified in the BTA5, which contains significant pathways related to behavioral traits. The first pathway was the sensory perception associated with a series of events required for an organism to receive a sensory stimulus, convert it to a molecular signal, and recognize and characterize the signal (AmiGO, 2021c). The second was the detection of a stimulus pathway related to a stimulus received by a cell or organism. This pathway converts a signal into a response to an extracellular stimulus, associating any movement, secretion, enzyme production, or gene expression in an extracellular stimulus (AmiGO, 2021a). The third pathway was olfactory receptor activity, a pathway related to combining with an odorant and transmitting the signal from one side of the membrane to the other to initiate a change in cell activity in response to the detection of smell (DeMaria and Ngai, 2010).
To track the origin of such a region, a phylogenetic tree (Figure 5A) was made to evaluate which breed could provide this region. As shown in Figure 5A, the Purunã, Charolais, and Angus animals seem to be genetically closer, and therefore, Angus and Charolais might have contributed to this region. Some studies have previously reported the same region with a high incidence of homozygous sequence (Szmatoła et al., 2019; Fabbri et al., 2021). Some interesting genes, already mentioned in the literature as candidate genes were identified in this region, as MY O 1A (Myosin IA) related to bovine heat-tolerance (Jia et al., 2019), RDH5 (11-cis retinol dehydrogenase 5) associated with feed conversion (de Almeida Santana et al., 2016), and AMDHD1 (amidohydrolase domain containing 1) related to reproduction (Moravčíková et al., 2019).
4.4 Heterozygous-Enriched Region
Maintaining diversity at a locus may be advantageous for fitness and could be subject to balancing or countervailing selection (Williams et al., 2016). These heterozygous-enriched regions are single nucleotide differences observed between paternal and maternal chromosomes and can reveal much about the population structure and demographic history (Santos et al., 2021). As shown in Figure 4B, the majority of HER found in this study were classified as shorter HER. Interestingly, one region is already mentioned as a conserved region for beef and dairy cattle in the BTA14 (Zhao et al., 2015). This region is variable in at least 17% of the Purunã individuals, demonstrating that even in more conservative regions, the crossbred could provide some variability to the animals.
Although some studies have shown that the majority of HER islands are related to immunity to diseases (Williams et al., 2016), survival rate, and fertility (Biscarini et al., 2020), an interesting pathway was found in our study related to growth. The growth pathway is a biological process related to the increase in size or mass of an entire organism, a part of an organism, or a cell (AmiGO, 2021b). In the case of PPIB, a gene used as a reference gene in studies of gene expression (Costa et al., 2013; da Costa et al., 2013) or the SDCBP gene, a possible candidate gene related to carcass weight in Hanwoo, a Korean native breed (Lee et al., 2013) and Montana Tropical Composite, a composite beef cattle population developed in Brazil (Grigoletto et al., 2020). Another gene mentioned as a possible candidate gene for meat quality and carcass yield was the MT2A, which is involved in glucocorticoid response and with metal and antioxidant biological responds (Haegeman et al., 2003). Although the CISH gene is directly related to insulin metabolism, Fonseca L. F. S. et al. (2020) indicated that this gene could play an essential role in marbling deposition. Our tracking of this pathway was not possible to define a unique breed responsible to provide such a region of HER to Purunã breed or even the breeds where the population is closer, as shown in Figure 5B. This means that such variability is not provided by a unique or small group of breeds, but by the mixture of the breeds used in the creation of the Purunã breed.
5 Conclusion
As observed in the admixture analyses, the Purunã breed received a more significant genetic contribution to its formation from Charolais, Canchim, and Angus. The inbreeding levels for Purunã were small based on multiple inbreeding metrics. Higher LD values were observed for markers with small distances and a faster decrease associated with an increase in the distance between the markers (ranging from 0.43 to 0.04 with distance of 10–1,000 Kb), indicating that a denser panel of markers is necessary to achieve higher levels of accuracy in a genomic selection of Purunã. A high Ne (>100) was observed in all metrics evaluated and the consistency of gametic phase analyses resulted in a small correlation among all breeds, which determines that a multi-breed genetic evaluation for Purunã might not be advantageous. An interesting homozygous region was found in the BTA5 with significant pathways related to behavior and genes related to traits such as heat-tolerance (MY O 1A), feed conversion rate (RDH5), and reproduction (AMDHD1). This could indicate a possible pressure of selection in such regions. For the heterozygosity, the number of HER was elevated, but this was expected since Purunã is a composite breed. Among HER regions, an interesting pathway related to growth was identified with higher variability, containing genes previously associated with carcass weight (SDCBP), meat and carcass quality (MT2A), and marbling deposition (CISH).
Data Availability Statement
The Purunã genotypes data are available in the OSF Repository (https://osf.io/7p6wt/). Genotypes from Angus, Canchim, and Charolais are available in the WIDDE database (http://widde.toulouse.inra.fr/widde/). The Nellore datasets presented in this article are not readily available because genotypes from databases Katayama are not publicly available but can be obtained through a reasonable request via the corresponding author. Requests to access the datasets should be directed to dmJwZWRyb3NhQHVlcGcuYnI=.
Ethics Statement
Ethical review and approval were not required for the animal study because no new animals were handled in this experiment.
Author Contributions
HM, LFBR, and VP conceived, designed, and conducted the data analyses. JM, LS, and VP contributed to the data acquisition. HM, LFBR, LD, and VP wrote and edited the manuscript. All authors reviewed and contributed to editing of the manuscript and approved its final publication.
Conflict of Interest
Author LD is employed by the company NEOGEN Corporation.
The remaining authors declare that the research was conducted in the absence of any commercial or financial relationships that could be construed as a potential conflict of interest.
Publisher’s Note
All claims expressed in this article are solely those of the authors and do not necessarily represent those of their affiliated organizations, or those of the publisher, the editors, and the reviewers. Any product that may be evaluated in this article, or claim that may be made by its manufacturer, is not guaranteed or endorsed by the publisher.
Acknowledgments
The authors thank the Agronomic Institute of Paraná (IAPAR), for providing the pedigree and hair samples for DNA extraction, Katayama Ltd. and NEOGEN Corporation for providing the genomic information. The first author also acknowledges the Research Support Foundation of the State of Bahia (FAPESB) for the doctoral scholarship.
Supplementary Material
The Supplementary Material for this article can be found online at: https://www.frontiersin.org/articles/10.3389/fgene.2022.858970/full#supplementary-material
References
Alemu, S. W., Kadri, N. K., Harland, C., Faux, P., Charlier, C., Caballero, A., et al. (2021). An Evaluation of Inbreeding Measures Using a Whole-Genome Sequenced Cattle Pedigree. Heredity 126, 410–423. doi:10.1038/s41437-020-00383-9
Alexander, D. H., and Lange, K. (2011). Enhancements to the ADMIXTURE Algorithm for Individual Ancestry Estimation. BMC Bioinforma. 12, 1–6. doi:10.1186/1471-2105-12-246
Alexander, D. H., Shringarpure, S. S., Novembre, J., and Lange, K. (2015). Admixture 1.3 Software Manual. Cold Spring Harbor Lab.
AmiGO (2021a). AmiGO 2: Term Details for “Detection of Stimulus” (GO:0051606). Available at: http://amigo.geneontology.org/amigo/term/GO:0051606 (Accessed November 18, 2021).
AmiGO (2021b). AmiGO 2: Term Details for “Growth” (GO:0040007). Available at: http://amigo.geneontology.org/amigo/term/GO:0040007 (Accessed November 24, 2021).
AmiGO (2021c). AmiGO 2: Term Details for “Sensory Perception” (GO:0007600). Available at: http://amigo.geneontology.org/amigo/term/GO:0007600 (Accessed November 18, 2021).
Barbato, M., Orozco-terWengel, P., Tapio, M., and Bruford, M. W. (2015). SNeP: a Tool to Estimate Trends in Recent Effective Population Size Trajectories Using Genome-wide SNP Data. Front. Genet. 6, 109. doi:10.3389/fgene.2015.00109
Behr, A. A., Liu, K. Z., Liu-Fang, G., Nakka, P., and Ramachandran, S. (2016). Pong: Fast Analysis and Visualization of Latent Clusters in Population Genetic Data. Bioinformatics 32, 2817–2823. doi:10.1093/BIOINFORMATICS/BTW327
Biscarini, F., Cozzi, P., Gaspa, G., and Marras, G. (2019). detectRUNS: An R Package to Detect Runs of Homozygosity and Heterozygosity in Diploid Genomes. Milan: CRAN.R.
Biscarini, F., Mastrangelo, S., Catillo, G., Senczuk, G., and Ciampolini, R. (2020). Insights into Genetic Diversity, Runs of Homozygosity and Heterozygosity-Rich Regions in Maremmana Semi-feral Cattle Using Pedigree and Genomic Data. Animals 10, 2285. doi:10.3390/ani10122285
Bonhomme, M., Chevalet, C., Servin, B., Boitard, S., Abdallah, J., Blott, S., et al. (2010). Detecting Selection in Population Trees: The Lewontin and Krakauer Test Extended. Genetics 186, 241–262. doi:10.1534/GENETICS.110.117275
Brito, L. F., Jafarikia, M., Grossi, D. A., Kijas, J. W., Porto-Neto, L. R., Ventura, R. V., et al. (2015). Characterization of Linkage Disequilibrium, Consistency of Gametic Phase and Admixture in Australian and Canadian Goats. BMC Genet. 16, 67. doi:10.1186/S12863-015-0220-1
Corbin, L. J., Liu, A. Y. H., Bishop, S. C., and Woolliams, J. A. (2012). Estimation of Historical Effective Population Size Using Linkage Disequilibria with Marker Data. J. Anim. Breed. Genet. 129, 257–270. doi:10.1111/j.1439-0388.2012.01003.x
Costa, A. S. H., Silva, M. P., Alfaia, C. P. M., Pires, V. M. R., Fontes, C. M. G. A., Bessa, R. J. B., et al. (2013). Genetic Background and Diet Impact Beef Fatty Acid Composition and Stearoyl-CoA Desaturase mRNA Expression. Lipids 48, 369–381. doi:10.1007/s11745-013-3776-4
Cristiana, A. D., and Mirela, C. S. (2018). Study on Technological Aspects Related to the Growth of the Aberdeen Angus Breed in Romania. Ann. Food Sci. Technol. 19, 1–5.
Curik, I., Ferenčaković, M., and Sölkner, J. (2014). Inbreeding and Runs of Homozygosity: A Possible Solution to an Old Problem. Livest. Sci. 166, 26–34. doi:10.1016/j.livsci.2014.05.034
D’Ambrosio, J., Phocas, F., Haffray, P., Bestin, A., Brard-Fudulea, S., Poncet, C., et al. (2019). Genome-wide Estimates of Genetic Diversity, Inbreeding and Effective Size of Experimental and Commercial Rainbow Trout Lines Undergoing Selective Breeding. Genet. Sel. Evol. 51, 26–15. doi:10.1186/S12711-019-0468-4/FIGURES/6
da Costa, A. S. H., Pires, V. M. R., Fontes, C. M. G. A., and Mestre Prates, J. A. (2013). Expression of Genes Controlling Fat Deposition in Two Genetically Diverse Beef Cattle Breeds Fed High or Low Silage Diets. BMC Vet. Res. 9, 118. doi:10.1186/1746-6148-9-118
de Almeida Santana, M. H., Junior, G. A. O., Cesar, A. S. M., Freua, M. C., da Costa Gomes, R., da Luz e Silva, S., et al. (2016). Copy Number Variations and Genome-wide Associations Reveal Putative Genes and Metabolic Pathways Involved with the Feed Conversion Ratio in Beef Cattle. J. Appl. Genet. 57, 495–504. doi:10.1007/s13353-016-0344-7
DeMaria, S., and Ngai, J. (2010). The Cell Biology of Smell. J. Cell Biol. 191, 443–452. doi:10.1083/jcb.201008163
Deng, T., Liang, A., Liu, J., Hua, G., Ye, T., Liu, S., et al. (2019). Genome-Wide SNP Data Revealed the Extent of Linkage Disequilibrium, Persistence of Phase and Effective Population Size in Purebred and Crossbred Buffalo Populations. Front. Genet. 9, 688. doi:10.3389/FGENE.2018.00688
Doekes, H. P., Veerkamp, R. F., Bijma, P., de Jong, G., Hiemstra, S. J., and Windig, J. J. (2019). Inbreeding Depression Due to Recent and Ancient Inbreeding in Dutch Holstein-Friesian Dairy Cattle. Genet. Sel. Evol. 51, 54. doi:10.1186/s12711-019-0497-z
Fabbri, M. C., Dadousis, C., Tiezzi, F., Maltecca, C., Lozada-Soto, E., Biffani, S., et al. (2021). Genetic Diversity and Population History of Eight Italian Beef Cattle Breeds Using Measures of Autozygosity. PLoS ONE 16, e0248087. doi:10.1371/journal.pone.0248087
Falconer, D. S., and Mackay, T. F. C. (1996). Introduction to Quantitative Genetics. 4th ed. New York: Longman Essex.
Fariello, M. I., Boitard, S., Naya, H., SanCristobal, M., and Servin, B. (2013). Detecting Signatures of Selection through Haplotype Differentiation Among Hierarchically Structured Populations. Genetics 193, 929–941. doi:10.1534/GENETICS.112.147231
Ferenčaković, M., Hamzić, E., Gredler, B., Solberg, T. R., Klemetsdal, G., Curik, I., et al. (2013). Estimates of Autozygosity Derived from Runs of Homozygosity: Empirical Evidence from Selected Cattle Populations. J. Anim. Breed. Genet. 130, 286–293. doi:10.1111/jbg.12012
Fonseca, L. F. S., dos Santos Silva, D. B., Gimenez, D. F. J., Baldi, F., Ferro, J. A., Chardulo, L. A. L., et al. (2020). Gene Expression Profiling and Identification of Hub Genes in Nellore Cattle with Different Marbling Score Levels. Genomics 112, 873–879. doi:10.1016/j.ygeno.2019.06.001
Fonseca, P. A. S., Suárez-Vega, A., Marras, G., and Cánovas, Á. (2020). GALLO: An R Package for Genomic Annotation and Integration of Multiple Data Sources in Livestock for Positional Candidate Loci. Gigascience 9, 1–9. doi:10.1093/gigascience/giaa149
Ghoreishifar, S. M., Moradi-Shahrbabak, H., Fallahi, M. H., Jalil Sarghale, A., Moradi-Shahrbabak, M., Abdollahi-Arpanahi, R., et al. (2020). Genomic Measures of Inbreeding Coefficients and Genome-wide Scan for Runs of Homozygosity Islands in Iranian River Buffalo, Bubalus Bubalis. BMC Genet. 21, 16. doi:10.1186/s12863-020-0824-y
Grigoletto, L., Ferraz, J. B. S., Oliveira, H. R., Eler, J. P., Bussiman, F. O., Abreu Silva, B. C., et al. (2020). Genetic Architecture of Carcass and Meat Quality Traits in Montana Tropical Composite Beef Cattle. Front. Genet. 11, 123. doi:10.3389/fgene.2020.00123
Groeneveld, E., Westhuizen, B. V. D., Maiwashe, A., Voordewind, F., and Ferraz, J. B. S. (2009). POPREP: a Generic Report for Population Management. Genet. Mol. Res. 8, 1158–1178. doi:10.4238/vol8-3gmr648
Gutiérrez, J., Goyache, F., and Cervantes, I. (2010). Endog v4.8 – a Computer Program for Monitoring Genetic Variability of Populations Using Pedigree Information. User’s Guide. Universidad Complutense de Madrid. Madrid, España, 45p.
Haegeman, A., Williams, J. L., Law, A., Van Zeveren, A., and Peelman, L. J. (2003). Mapping and SNP Analysis of Bovine Candidate Genes for Meat and Carcass Quality. Anim. Genet. 34, 349–353. doi:10.1046/j.1365-2052.2003.01008.x
Howard, J. T., Pryce, J. E., Baes, C., and Maltecca, C. (2017). Invited Review: Inbreeding in the Genomics Era: Inbreeding, Inbreeding Depression, and Management of Genomic Variability. J. Dairy Sci. 100, 6009–6024. doi:10.3168/jds.2017-12787
Howrigan, D. P., Simonson, M. A., and Keller, M. C. (2011). Detecting Autozygosity through Runs of Homozygosity: A Comparison of Three Autozygosity Detection Algorithms. BMC Genomics 12, 460. doi:10.1186/1471-2164-12-460
Ito, R. H., Prado, I. N. d., Visentainer, J. V., Prado, R. M. d., Fugta, C. A., and Pires, M. C. O. (2010). Carcass Characteristics, Chemical and Fatty Acid Composition of Longissimus Muscle of Purunã Bulls Slaughtered at 18 or 24 Months of Age. Acta Sci. Anim. Sci. 32, 299–307. doi:10.4025/actascianimsci.v32i3.7274
Jahuey‐Martínez, F. J., Parra‐Bracamonte, G. M., Sifuentes‐Rincón, A. M., and Moreno‐Medina, V. R. (2019). Signatures of Selection in Charolais Beef Cattle Identified by Genome‐wide Analysis. J. Anim. Breed. Genet. 136, 378–389. doi:10.1111/jbg.12399
Jia, P., Cai, C., Qu, K., Chen, N., Jia, Y., Hanif, Q., et al. (2019). Four Novel SNPs of MYO1A Gene Associated with Heat-Tolerance in Chinese Cattle. Animals 9, 964. doi:10.3390/ANI9110964
Larmer, S. G., Sargolzaei, M., and Schenkel, F. S. (2014). Extent of Linkage Disequilibrium, Consistency of Gametic Phase, and Imputation Accuracy within and across Canadian Dairy Breeds. J. Dairy Sci. 97, 3128–3141. doi:10.3168/JDS.2013-6826
Lee, S. H., Choi, B. H., Lim, D., Gondro, C., Cho, Y. M., Dang, C. G., et al. (2013). Genome-Wide Association Study Identifies Major Loci for Carcass Weight on BTA14 in Hanwoo (Korean Cattle). PLoS ONE 8, e74677. doi:10.1371/journal.pone.0074677
Lozada-Soto, E. A., Maltecca, C., Lu, D., Miller, S., Cole, J. B., and Tiezzi, F. (2021). Trends in Genetic Diversity and the Effect of Inbreeding in American Angus Cattle under Genomic Selection. Genet. Sel. Evol. 53, 1–15. doi:10.1186/S12711-021-00644-Z/FIGURES/6
Marras, G., Gaspa, G., Sorbolini, S., Dimauro, C., Ajmone-Marsan, P., Valentini, A., et al. (2015). Analysis of Runs of Homozygosity and Their Relationship with Inbreeding in Five Cattle Breeds Farmed in Italy. Anim. Genet. 46, 110–121. doi:10.1111/age.12259
Marras, G., Wood, B. J., Makanjuola, B., Malchiodi, F., Peeters, K., Van As, P., et al. (2018). “Characterization of Runs of Homozygosity and Heterozygosity-Rich Regions in a Commercial turkey (Meleagris gallopavo) Population,” in Proceedings of the 11th World Congress of Genetics Applied to Livestock Production (Auckland), 763–767.
Mastrangelo, S., Ciani, E., Sardina, M. T., Sottile, G., Pilla, F., and Portolano, B. (2018). Runs of Homozygosity Reveal Genome-wide Autozygosity in Italian Sheep Breeds. Anim. Genet. 49, 71–81. doi:10.1111/AGE.12634
McKay, S. D., Schnabel, R. D., Murdoch, B. M., Matukumalli, L. K., Aerts, J., Coppieters, W., et al. (2007). Whole Genome Linkage Disequilibrium Maps in Cattle. BMC Genet. 8, 74. doi:10.1186/1471-2156-8-74
McQuillan, R., Leutenegger, A.-L., Abdel-Rahman, R., Franklin, C. S., Pericic, M., Barac-Lauc, L., et al. (2008). Runs of Homozygosity in European Populations. Am. J. Hum. Genet. 83, 359–372. doi:10.1016/j.ajhg.2008.08.007
Meuwissen, T. H. (2009). Accuracy of Breeding Values of 'unrelated' Individuals Predicted by Dense SNP Genotyping. Genet. Sel. Evol. 41, 35. doi:10.1186/1297-9686-41-35
Meuwissen, T., and Luo, Z. (1992). Computing Inbreeding Coefficients in Large Populations. Genet. Sel. Evol. 24, 305–313. doi:10.1186/1297-9686-24-4-305
Missio, R. L., Restle, J., Moletta, J. L., Kuss, F., Neiva, J. N. M., Elejalde, D. A. G., et al. (2015). Slaughter Weights on Animal Performance, Carcass Commercial Cuts and Meat Characteristics of Cull Cows. Sem. Ci. Agr. 36, 3827. doi:10.5433/1679-0359.2015v36n6p3827
Moravčíková, N., Trakovická, A., Kadlečík, O., and Kasarda, R. (2019). Genomic Signatures of Selection in Cattle through Variation of Allele Frequencies and Linkage Disequilibrium. J. Central Eur. Agric. 20, 576–580. doi:10.5513/JCEA01/20.2.2552
Moura, I. C. F., Kuss, F., Moletta, J. L., Menezes, L. F. G., Henrique, D. S., Lipinski, L. C., et al. (2014). Desempenho de vacas de corte Purunã submetidas a diferentes manejos de amamentação. Pesq. Agropec. Bras. 49, 49–56. doi:10.1590/S0100-204X2014000100007
Mulim, H. A., Brito, L. F., Pinto, L. F. B., Ferraz, J. B. S., Grigoletto, L., Silva, M. R., et al. (2022). Characterization of Runs of Homozygosity, Heterozygosity-Enriched Regions, and Population Structure in Cattle Populations Selected for Different Breeding Goals. BMC Genomics 23, 209–218. doi:10.1186/s12864-022-08384-0
Otto, P. I., Santos, A. L., Perotto, D., Oliveira, S. N., Granzotto, F., Gobo, D. O. R., et al. (2021). Estimation of Genetic Parameters for Weaning and Yearling Weights in a Composite Population Used to Form the Purunã Breed. Rev. Bras. Zootec. 50, 1–11. doi:10.37496/RBZ5020180224
Peripolli, E., Metzger, J., de Lemos, M. V. A., Stafuzza, N. B., Kluska, S., Olivieri, B. F., et al. (2018). Autozygosity Islands and ROH Patterns in Nellore Lineages: Evidence of Selection for Functionally Important Traits. BMC Genomics 19, 680. doi:10.1186/s12864-018-5060-8
Peripolli, E., Stafuzza, N. B., Amorim, S. T., Lemos, M. V. A., Grigoletto, L., Kluska, S., et al. (2020). Genome‐wide Scan for Runs of Homozygosity in the Composite Montana Tropical Beef Cattle. J. Anim. Breed. Genet. 137, 155–165. doi:10.1111/jbg.12428
Perotto, D., Cubas, A. C., Moletta, J. L., and Lesskiu, C. (2000a). Heterose sobre os pesos de bovinos Canchim e Aberdeen Angus e de seus cruzamentos recíprocos. Pesq. Agropec. Bras. 35, 2511–2520. doi:10.1590/s0100-204x2000001200022
Perotto, D., Moletta, J. L., and Cubas, A. C. (2000b). Características quantitativas da carcaça de bovinos Charolês, Caracu e cruzamentos recíprocos terminados em confinamento. R. Bras. Zootec. 29, 117–124. doi:10.1590/S1516-35982000000100016
Pires, B. V., Stafuzza, N. B., de Freitas, L. A., Mercadante, M. E. Z., Ramos, E. S., and Paz, C. C. P. (2021). Expression of Candidate Genes for Residual Feed Intake in Tropically Adapted Bos taurus and Bos indicus Bulls under Thermoneutral and Heat Stress Environmental Conditions. J. Therm. Biol. 99, 102998. doi:10.1016/J.JTHERBIO.2021.102998
Pontes, D. S., Rosado, R. D. S., Cruz, C. D., Nascimento, M., Oliveira, A. M. C., and Pensky, S. M. (2020). Trait Selection Using Procrustes Analysis for the Study of Genetic Diversity in Conilon Coffee. Acta Sci. Agron. 42, e43195–12. doi:10.4025/actasciagron.v42i1.43195
Prieur, V., Clarke, S. M., Brito, L. F., McEwan, J. C., Lee, M. A., Brauning, R., et al. (2017). Estimation of Linkage Disequilibrium and Effective Population Size in New Zealand Sheep Using Three Different Methods to Create Genetic Maps. BMC Genet. 18, 68. doi:10.1186/s12863-017-0534-2
Purcell, S., Neale, B., Todd-Brown, K., Thomas, L., Ferreira, M. A. R., Bender, D., et al. (2007). PLINK: A Tool Set for Whole-Genome Association and Population-Based Linkage Analyses. Am. J. Hum. Genet. 81, 559–575. doi:10.1086/519795
Rebelato, A. B., Caetano, A. R., Rebelato, A. B., and Caetano, A. R. (2018). Runs of Homozygosity for Autozygosity Estimation and Genomic Analysis in Production Animals. Pesq. Agropec. Bras. 53, 975–984. doi:10.1590/s0100-204x2018000900001
Reynolds, J., Weir, B. S., and Cockerham, C. C. (1983). Estimation of the Coancestry Coefficient: Basis for a Short-Term Genetic Distance. Genetics 105 (3), 767–779. doi:10.1093/genetics/105.3.767
Rosen, B. D., Bickhart, D. M., Schnabel, R. D., Koren, S., Elsik, C. G., Tseng, E., et al. (2020). De Novo assembly of the Cattle Reference Genome with Single-Molecule Sequencing. Gigascience 9, 1–9. doi:10.1093/gigascience/giaa021
Santos, W., Schettini, G., Fonseca, M. G., Pereira, G. L., Chardulo, L. A., Neto, O., et al. (2021). Fine‐scale Estimation of Inbreeding Rates, Runs of Homozygosity and Genome‐wide Heterozygosity Levels in the Mangalarga Marchador Horse Breed. J. Anim. Breed. Genet. 138, 161–173. doi:10.1111/jbg.12508
Sempéré, G., Moazami-Goudarzi, K., Eggen, A., Laloë, D., Gautier, M., and Flori, L. (2015). WIDDE: A Web-Interfaced Next Generation Database for Genetic Diversity Exploration, with a First Application in Cattle. BMC Genomics 16, 1–8. doi:10.1186/s12864-015-2181-1
Sievert, C. (2020). Interactive Web-Based Data Visualization with R, Plotly, and Shiny. Chapman and Hall/CRC.
Szmatoła, T., Gurgul, A., Jasielczuk, I., Ząbek, T., Ropka-Molik, K., Litwińczuk, Z., et al. (2019). A Comprehensive Analysis of Runs of Homozygosity of Eleven Cattle Breeds Representing Different Production Types. Animals 9, 1024. doi:10.3390/ani9121024
Taye, M., Yoon, J., Dessie, T., Cho, S., Oh, S. J., Lee, H.-K., et al. (2018). Deciphering Signature of Selection Affecting Beef Quality Traits in Angus Cattle. Genes Genom 40, 63–75. doi:10.1007/s13258-017-0610-z
Urbinati, I., Stafuzza, N. B., Oliveira, M. T., Chud, T. C., Higa, R. H., Regitano, L. C., et al. (2016). Selection Signatures in Canchim Beef Cattle. J. Anim. Sci. Biotechnol. 7, 29–9. doi:10.1186/S40104-016-0089-5/TABLES/3
VanRaden, P. M. (2008). Efficient Methods to Compute Genomic Predictions. J. Dairy Sci. 91, 4414–4423. doi:10.3168/jds.2007-0980
Villanueva, B., Fernández, A., Saura, M., Caballero, A., Fernández, J., Morales-González, E., et al. (2021). The Value of Genomic Relationship Matrices to Estimate Levels of Inbreeding. Genet. Sel. Evol. 53, 1–17. doi:10.1186/S12711-021-00635-0/FIGURES/7
Wang, J., Liao, Y., Jaehnig, E., Shi, Z., and Sheng, Q. (2020). Gene Set Analysis Toolkit WebGestaltR. CRAN.R.
Wang, J. (2014). Marker-based Estimates of Relatedness and Inbreeding Coefficients: An Assessment of Current Methods. J. Evol. Biol. 27, 518–530. doi:10.1111/jeb.12315
Williams, J. L., Hall, S. J. G., Del Corvo, M., Ballingall, K. T., Colli, L., Ajmone Marsan, P., et al. (2016). Inbreeding and Purging at the Genomic Level: the Chillingham Cattle Reveal Extensive, Non-random SNP Heterozygosity. Anim. Genet. 47, 19–27. doi:10.1111/age.12376
Wright, S. (1922). Coefficients of Inbreeding and Relationship. Am. Nat. 56, 330–338. doi:10.1086/279872
Xia, X., Zhang, S., Zhang, H., Zhang, Z., Chen, N., Li, Z., et al. (2021). Assessing Genomic Diversity and Signatures of Selection in Jiaxian Red Cattle Using Whole-Genome Sequencing Data. BMC Genomics 22, 43. doi:10.1186/s12864-020-07340-0
Yang, J., Benyamin, B., McEvoy, B. P., Gordon, S., Henders, A. K., Nyholt, D. R., et al. (2010). Common SNPs Explain a Large Proportion of the Heritability for Human Height. Nat. Genet. 42, 565–569. doi:10.1038/ng.608
Keywords: beef cattle, genomic diversity, inbreeding coefficient, persistency of the gametic phase, runs of heterozygosity, runs of homozygosity
Citation: Mulim HA, Brito LF, Batista Pinto LF, Moletta JL, Da Silva LR and Pedrosa VB (2022) Genetic and Genomic Characterization of a New Beef Cattle Composite Breed (Purunã) Developed for Production in Pasture-Based Systems. Front. Genet. 13:858970. doi: 10.3389/fgene.2022.858970
Received: 20 January 2022; Accepted: 10 June 2022;
Published: 18 July 2022.
Edited by:
Lingyang Xu, Chinese Academy of Agricultural Sciences, ChinaReviewed by:
Jose Bento Sterman Ferraz, University of São Paulo, BrazilAli Esmailizadeh, Shahid Bahonar University of Kerman, Iran
Yaokun Li, South China Agricultural University, China
Copyright © 2022 Mulim, Brito, Batista Pinto, Moletta, Da Silva and Pedrosa. This is an open-access article distributed under the terms of the Creative Commons Attribution License (CC BY). The use, distribution or reproduction in other forums is permitted, provided the original author(s) and the copyright owner(s) are credited and that the original publication in this journal is cited, in accordance with accepted academic practice. No use, distribution or reproduction is permitted which does not comply with these terms.
*Correspondence: Victor Breno Pedrosa, dmJwZWRyb3NhQHVlcGcuYnI=