
94% of researchers rate our articles as excellent or good
Learn more about the work of our research integrity team to safeguard the quality of each article we publish.
Find out more
DATA REPORT article
Front. Genet., 09 March 2022
Sec. Statistical Genetics and Methodology
Volume 13 - 2022 | https://doi.org/10.3389/fgene.2022.858808
 Yujia Jiang1,2†
 Shijie Hao2,3†
 Xi Chen2
 Mengnan Cheng2,3
 Jiangshan Xu2,3
 Chenghao Li2
 Huiwen Zheng1,2
 Giacomo Volpe4
 Ao Chen2
 Sha Liao2
 Chuanyu Liu2*
 Longqi Liu2*
 Xun Xu1,2*
Diseases leading to lung structural and functional disruption pose a major threat to human health (Tobin, 2005; Nathan et al., 2019; Podolanczuk et al., 2021). Mouse models represent a common choice to investigate physiological and pathological processes (Cheon and Orsulic, 2011; Benam et al., 2015; Walsh et al., 2017). To date, researches conducted on mouse lungs have been instrumental in dissecting developmental processes as well as pulmonary diseases, for example, studies on tumor-infiltrating myeloid cells in lung cancer (Zilionis et al., 2019), generation of pulmonary fibrosis (Wu et al., 2020), neonatal development (Scaffa et al., 2021) and injury repair (Leist et al., 2020). The recent development of novel state-of-the-art genomic technologies allows a deeper exploration of the lung functionally and structurally. A growing number of mouse-lung genomic datasets have been generated and have been paramount for illustrating fundamental transcriptomic changes at the tissue level (Angelidis et al., 2019; Vila Ellis et al., 2020) or revealing heterogeneity in resident lung cells (Angelidis et al., 2019; Gillich et al., 2020; Travaglini et al., 2020; Hurskainen et al., 2021) via bulk and single-cell RNA sequencing (scRNA-seq).
However, due to technical limitations of bulk and scRNA-seq, irreversible elimination of topological information hinders further analysis focusing on temporal-spatial dimensions (Lahnemann et al., 2020). In this regard, spatial transcriptome (ST) approaches, rising as the annual technology of Nature Methods in 2020 (Marx, 2021), can help to fill the knowledge gap between structure and function (Stahl et al., 2016; Lein et al., 2017; Moor and Itzkovitz, 2017). In this technique, spatio-temporal expression of genes is revealed by sequencing the mRNA captured in situ, with spatial coordinates labeled and translated (Close et al., 2021; Larsson et al., 2021; Zhuang, 2021). Using ST, researchers investigated the mechanisms of lung diseases and development at new latitudes, which is crucial for understanding the regulation of cell fate decisions and transitions of lung cells (Saviano et al., 2020; Liao et al., 2021). ST was first applied to mouse lung models by Boyd et al., in 2020, who reported the lethal immunopathology of the damage-responsive lung fibroblasts during severe influenza virus infection (Boyd et al., 2020). Furthermore, Xu found the location changes of T helper cells after immunization by integrating ST and scRNA-seq (Xu et al., 2021). Besides, ST was also employed to explore the mechanism that promotes lung tissue remodeling following respiratory viral infection (Beppu et al., 2021). The studies mentioned above have highlighted the importance of ST, in combination with multiple cutting-edge technologies, to gain basic and previously inaccessible information about lung biology and pathophysiology. However, most recent lung-related studies using ST are limited by a low spatial resolution (∼55–60 µm) and a restricted field of view (42.25 mm2), making the discrimination of different cells within the same capture spot challenging (Asp et al., 2020; Waylen et al., 2020). In addition, it is difficult to provide a detailed description of the subtle structures in the lung, such as bronchi, blood vessels, etc. Consequently, ST data of lungs with a resolution of approaching cellular-to-sub-cellular level are highly desired (Longo et al., 2021; Rao et al., 2021; Zhang et al., 2021).
Traditionally, mouse lung development can be subdivided into five main stages based on morphological changes: Embryonic (E9.5–E11.5), Pseudoglandular (E11.5–E16.5), Canalicular (E16.5–E17.5), Saccular (E17.5–P5) and Alveolar (postnatal (P) 5–P30), followed by maturation (P30 - adult) (Mujahid et al., 2013; Chao et al., 2015). Upon entering the maturation period, the basic structures of the mouse lung have developed and subsequently increase in size as the mouse grows (Schittny, 2017). It has been reported that the proximal lung matures more rapidly than the distal lung (Rawlins et al., 2007; Mund et al., 2008; Beauchemin et al., 2016; He et al., 2022). However, there is no research revealing the significant markers related to the spatial asynchronous development in the early maturation of mouse lung. Therefore, we selected P35 mouse lungs for spatiotemporal transcriptomic experiments to observe the spatial distribution of mature tissue cells within the mouse lung and dissect the spatial asynchronous development. For this study, we employed Stereo-seq (Chen et al., 2021), a novel ST approach with a 500 nm resolution that allows us to precisely detect mouse lungs’ structures and investigate the spatiotemporal transcriptomic change during lung development. Bioinformatic analysis on our dataset suggested the differences in the expression of several genes from proximal to distal lungs.
As far as we know, it is the first time to demonstrate such alternation via spatial gene mapping. In addition, our dataset provided strong support for further studies on the lung’s tissue structure and functional exercise and explored lung diseases’ mechanisms and treatment options. And the Stereo-seq data can be accessed and explored interactively on the website: https://db.cngb.org/stomics/datasets/STDS0000062?tab=explore.
For this study, we used a female adult mouse from a C57BL/6J strain, obtained from Guangdong Medical Laboratory Animal Center (https://www.gdmlac.com.cn/). The Institutional Review Board approved the use of laboratory mice on the Ethics Committee of BGI (Permit No. BGI-IR20210903001). Briefly, the mouse was sacrificed, and 1 × PBS (Thermo, CA, United States) was injected from the heart’s left ventricle to replace the blood until both lungs turned white. Then, the lung was inflated with the mixture of 50% optimal cutting temperature compound (OCT, SAKURA, Japan) and 50% 1 × PBS with 5% RNase inhibitor (RI, NEB, United States) dissolved (v/v) to complete the perfusion. After this, the lung was immediately isolated, snap-frozen with OCT in dry ice, and then stored in a −80°C refrigerator.
The Stereo-seq libraries were prepared as previously described (Chen et al., 2021). The OCT-frozen mouse lung was equilibrated in a Leica CM1950 cryostat (Leica Mikrosysteme Vertrieb GmbH, Wetzlar, Germany) at −17°C for 30 min. The lung was cryosectioned in 10 μm thickness. The first section was attached to a pathology-grade transparent microscope slide (CITOTEST, Jiangsu, China), while the following three successive sections were attached to the Stereo-seq chip surfaces. The microscope slide and chips were incubated at 37°C for 3 min and then transferred to methanol at −20°C for 30 min for fixation. The first section was stained with hematoxylin and eosin (H&E, Solarbio, Beijing, China). The Stereo-seq chips were dried at room temperature for 5 min, then permeabilized at 37°C using 0.1% PR Enzyme (BGI, Shenzhen, China) at pH 2.0 for 6 min. After that, the chips were washed twice using 0.1 × SSC with 5% RI v/v, and then dripped 100 μL reverse transcription (RT) mixture (5 μL RI, 5 μL RT Additive, 80 μL RT Reagent, 5 μL Reverse T Enzyme, 5 μL RT Oligo, BGI, Shenzhen, China) for 2 h at 42°C. Then the chips were washed twice with 0.1 × SSC. Tissues on the chip surfaces were then digested with the TR Buffer (BGI, Shenzhen, China) at 37°C for 30 min. The chips were washed twice with 0.1 × SSC and immersed in the cDNA Release Mix (10% cDNA Release Enzyme, 90% cDNA Release Buffer v/v, BGI, Shenzhen, China) at 55°C for 3 h to release the cDNA. The cDNA mixture was collected, and the chips were washed with nuclease-free H2O. The cDNA mixture and washing nuclease-free H2O were evenly mixed, and the new mixture was purified using the DNA clean beads (Vazyme, Nanjing, China) (0.8—fold to the volume of the new mix) to collect cDNAs in the target size. Finally, the cDNAs were amplified, fragmented, and cyclized to generate DNA nanoball (DNB) for sequencing on MGI DNBSEQ-T1 sequencer according to manufacturer protocol (MGI, Shenzhen, China) (Chen et al., 2021).
The raw stereo-seq paired-end sequencing data was parsed to the coordinate identity (CID, read1 1st–25th base), unique molecular identifiers (UMI, read1 26th–35th base), and cDNA (whole reads 2) sequences at the first step, followed by the mapping of CID and pre-position-resolved CID whitelist by using the ST_BarcodeMap software (https://github.com/BGIResearch/ST_BarcodeMap) with a tolerance of 1-base mismatch. Next, the read pairs without valid CID sequencing data were removed. Then, according to the criteria, we filtered the read pairs with a low-quality UMI sequence, containing any N (undefined base) base or containing two bases with a quality score lower than 10 (Phred + 33). Next, the cDNA sequences with valid CID and UMI were aligned to the reference mouse genome (mm10) with the STAR software (Dobin et al., 2013). Moreover, we filtered out the alignments with a lower mapping quality (MAPQ < 10), annotated alignments on corresponding genes. Finally, we aggregated the raw bin 1 matrix into the final bin 50 matrix and assigned coordinates for each bin.
We applied the Hotspot software (v0.9.1) with the chosen model parameter “normal” to detect spatially variable genes (DeTomaso and Yosef, 2021). First, the variable genes were grouped into multiple groups with the compute_local_correlations function of Hotspot. Then, we calculated the gene module score for these detected gene groups, obtaining the final score matrix where each row represents a bin50 spots while each column represents a gene group. Finally, the bin50 spots were clustered into 10 clusters using the k-means function in the R language with the score matrix.
We used the RCTD software (v1.2.0) to resolve the cell composition in each bin 50 spot while the “doublet_mode” parameter was set as “multi” (Cable et al., 2021). The cell types with < 20 cells were pre-removed from the adoptive scRNA-seq data (Travaglini et al., 2020) because of the minimal cell number threshold in RCTD. Then we extracted the most likely cell composition in the “sub_weights” from the “result” slot to calculate the cell type correlation and count the overall relative cell number and visualization. Finally, the cell composition of each bin was visualized by scatterpie (v0.1.5) (https://github.com/GuangchuangYu/scatterpie) R package while we enlarged the spots Adventitial Fibroblast, Ciliated, and Vein for their concentrated location in the section.
The regulating activity of transcription factors (TFs) was calculated by using SCENIC software (Aibar et al., 2017), implemented in pyscenic package (v0.11.2) (Van de Sande et al., 2020), in three steps. First, we calculated the co-expression genes for each TF using the grnboost2 software in step 1, followed by the mapping to the RcisTarget database for further validation of the regulative relation of the TFs and their relation co-expression genes. Finally, we ran the aucell command in pyscenic to calculate the regulatory activity of the TFs in each bin and visualized their spatial distribution.
A total of four successive frozen sections with a thickness of 10 μm were collected from a female adult mouse lung, the first of which was used for H&E staining and the subsequent three for Stereo-seq experiments (Figure 1A). Simultaneously, we systematically evaluated the quality of the Stereo-seq dataset based on the number of total reads, bases Q30, barcode mapping ratio, etc. (Supplementary Table S1). Approximately 4.77 G reads per section were generated, with the average bases Q30 of CID being 88.86%, the UMI Q30 was 84.28%, sequence Q30 was 88.61%, the average barcode mapping ratio was 61.79%, and the average reads mapping ratio was 79.87%. After further processing of alignments filtration, annotation, and matrix count, the bin1 Count Matrix was obtained. The bin1 represents a capture spot with a 220 nm diameter and a center-to-center distance of 500 nm. We combined the bin1 spots within a 50 × 50 square area as bin 50 and recognized them as the basic spot matrix for the subsequent analysis. The resolution of bin 50 is 25 μm (50 × 500 nm) (Figure 1B). To run quality control analysis on the Stereo-seq data of three sections, we characterized the overall distribution of UMI counts and the expression of mitochondrial genes separately, consistent with morphology photomicrographs displayed in H&E staining (Figure 1C). To assess the reproducibility of our data between different sections, we calculated the Coefficient of determination (R2), this being 0.9989 and 0.9980 for the Stereo-seq datasets in sections 2 and 1, and 3 and 1, respectively (Supplementary Figure S1).
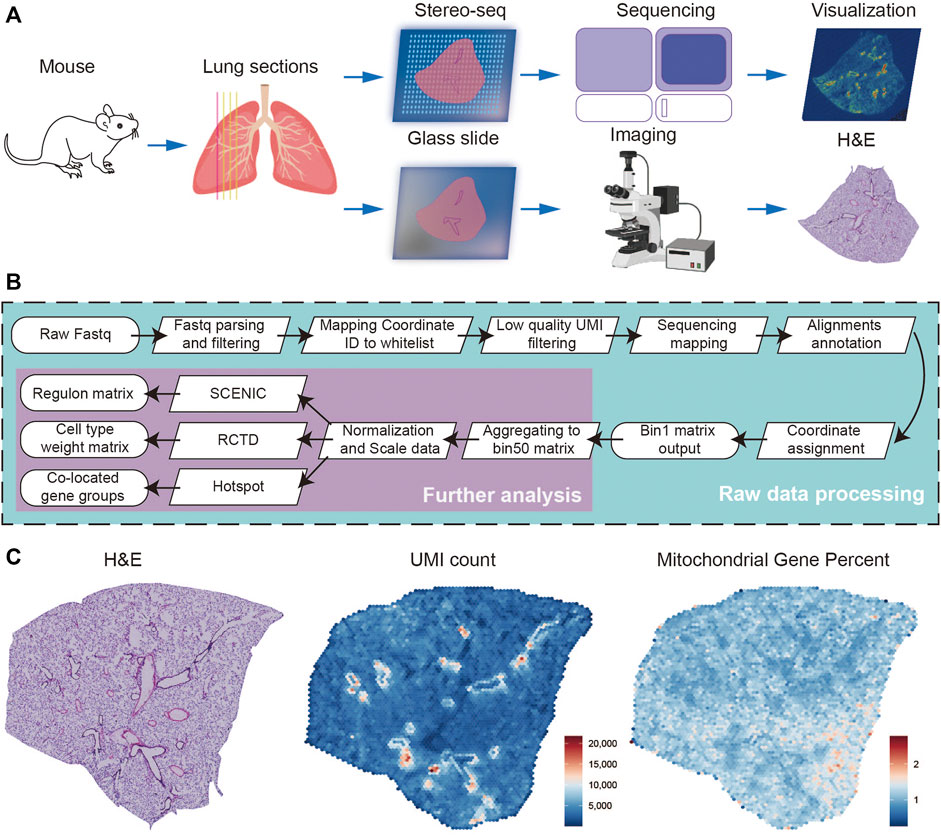
FIGURE 1. Overview of the experimental, data analysis workflow, and Stereo-seq data quality control. (A) Four lung sections from female mouse were collected, and the first was stained with H&E, the subsequent three for Stereo-seq experiments. (B) The analysis workflow for Stereo-seq datasets. (C) The H&E of the first section (left), the UMI (middle), and the percent of mitochondrial genes (right) spatial distribution patterns of the first Stereo-seq section.
We analyzed the spatial distribution of markers genes that are canonically expressed in bronchioli, alveoli, and immune cells, such as Scgb1a1, Sftpc, Ager, Car4, Acta2, Ager, Dcn, Cdk8, and Foxj1 (Figure 2A). First, we calculated and clustered the spatially co-expressed genes by Hotspot software (v0.9.1) (DeTomaso and Yosef, 2021), thus leading to 17 groups that were reflected by typical expression patterns associated with given structures or cells in the lung (Supplementary Figure S2), for example, the expression of Scgb1a1, Scgb3a2, Cyp2f2, and Hp in group 1 corresponding to the bronchioli, group 2 with Sftpc and Ager for alveoli, group 7 with Acta1 and Acta2 for cartilage and group 8 with Igkc, Jchain and Mzb1 for immune cells (Supplementary Figure S3A; Supplementary Table S2) (Han et al., 2018; Travaglini et al., 2020). Next, we integrated the module score of all gene groups. We then performed k-means clustering analysis to finally collapse the bin 50 spots into six defined clusters, obtaining a spatially-resolved pattern of multiple structures and cells (Supplementary Figure S3B). Finally, the percentages of all 6 clusters were counted within the section (Supplementary Figure S3C), and the correlations among the clusters were defined (Supplementary Figure S3D). Our analysis identified cluster 5 as highly enriched for Clara cells makers, those being Scgb3a2, Scgb1a1, Cyp2f2, and Hp (Supplementary Figure S3E; Supplementary Table S3). Considering that Clara cells are viewed as the main cells of lung bronchioli, it is safe to assume that the pattern observed in cluster 5 depicts the distribution of the bronchioli (Rawlins et al., 2009). Cluster 6 showed the highest correlation with cluster 5 and was distributed mainly around cluster 5, also being characterized by a similar expression pattern albeit at lower levels. The gradient distribution could result from a slight dispersion of lung bronchial cells.
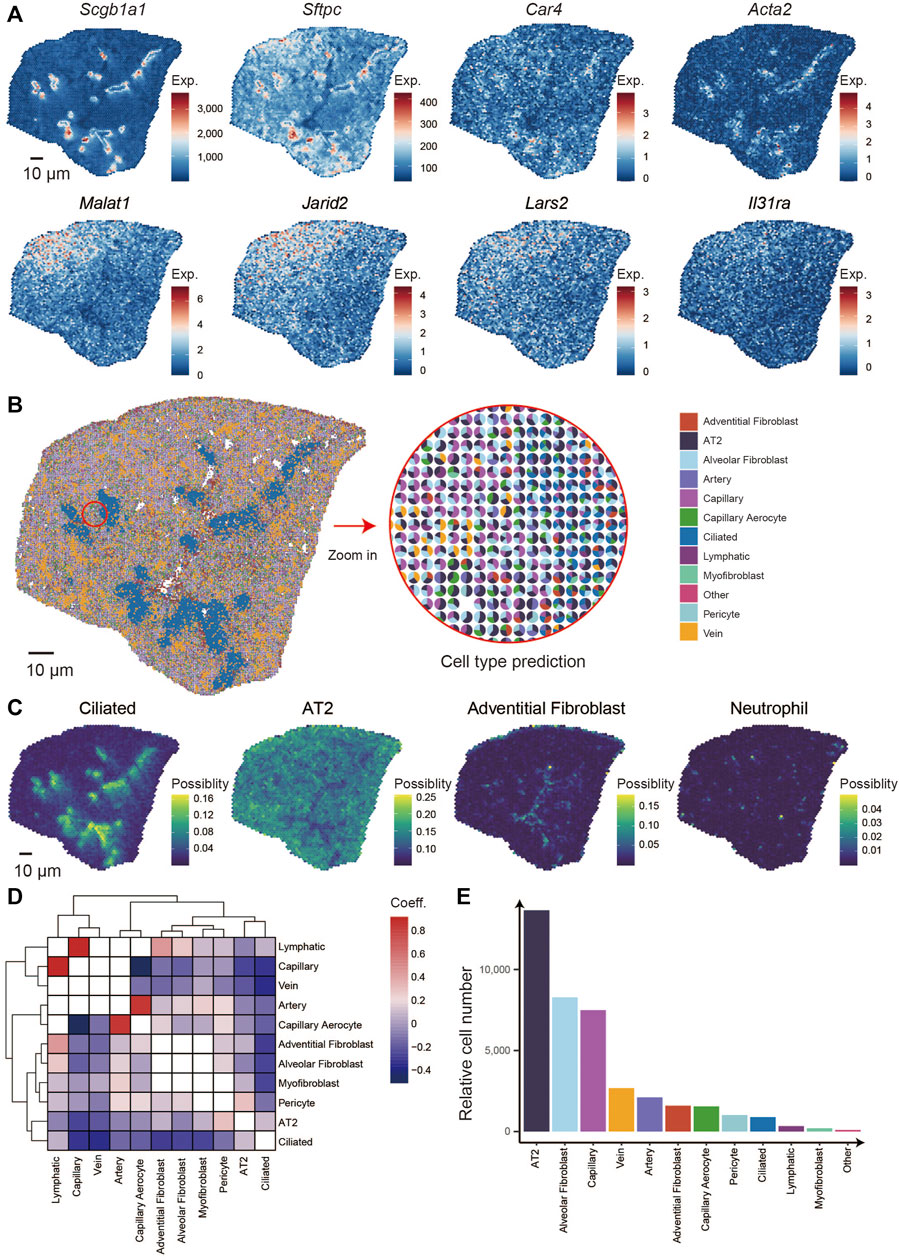
FIGURE 2. Identification of the specific pattern of genes in the lung and integrating analysis of scRNA-seq and Stereo-seq. (A) Spatial distribution of genes: Scgb1a1, Sftpc, Car4, Acta2, Malat1, Jarid2, Lars2, and Il31ra. (B) Spatial localization of multiple cell types in the lung section combines scRNA-seq and Stereo-seq (left) and the percentages of major cell types in each spot (right). (C) Spatial distribution of 4 cell types: ciliated, AT2, adventitial fibroblast, and neutrophil. (D) Spatial location correlation between different cell types. (E) The relative numbers of multiple cell types in the lung section.
Similarly, the spatial location of the intrapulmonary blood vessels was depicted by clusters 1, as characterized by the expression of Myh6, Myl7, and Tnnt2, which are typically expressed in the smooth muscle cells located around vessels (Thorolfsdottir et al., 2017; Cho et al., 2021). Cluster two and four displayed the highest correlation, were the most abundant within the analyzed section, and were marked by high expression of Sftpc, thus highlighting the distribution of alveoli within the mouse lung. Malat1, Jarid2, Gm42428, and Cmm1 were observed at higher levels in cluster 4, indicating different alveolar states. The cluster three bins accounted for only a small percentage in the lung section and displayed high expression of canonical neutrophil genes such as S100a9 and S100a8, indicating a population of immune resident cells (Han et al., 2018). To our knowledge, this is the first spatial transcriptome approach that allows a detailed description of the lung at the micrometer-scale resolution, and the data we obtained will be of great value in further understanding the spatial differences of lung development and diseases.
Depending on the distance to the trachea, the top and bottom of the section were regarded as the distal and proximal lung, and clusters four and two were located at the distal and proximal areas, respectively (Supplementary Figure S3B) (Zepp et al., 2021). We calculated the differentially expressed genes (DEG) between Cluster two and Cluster four and found that Malat1, Jarid2, Lars2, Il31ra, Camk1d, Cd44, and others expressed higher in the distal lung. In contrast, Scgb1a1, Scgb3s2, Cyp2f2, mt-Nd4, mt-Nd1, mt-Nd2, and so on expressed higher at the proximal lung (Figure 2A; Supplementary Figure S4A). To reveal the particular functions of genes specially located in the different developmental areas, we performed the gene pathway enrichment analyses, which indicate that the proximal side is correlated with energy generation and transport such as ATP synthesis, and the distal with cell proliferation such as cell junction and assembly and positive regulation of binding (Supplementary Figure S4B). Malat1, a long non-coding RNA that is crucial for mouse lung development (Eissmann et al., 2012) and is overexpressed in a variety of lung cancers (Gutschner et al., 2013). Jarid2 has been reported to control the cell cycle by regulating cyclin D1 in cardiac cells (Adhikari et al., 2019; Toyoda et al., 2003). Lars2 is involved in mitochondrial function (Huang et al., 2021) and is enriched in endothelial cells of the brain and lung (Paik et al., 2020). Il31ra regulates allergen-induced lung inflammation (Neuper et al., 2021). Cdk8 is a cycling-dependent kinase (Poss et al., 2013) that is overexpressed mainly in many tumor tissues and that accelerates the growth and division process of cancer cells (Supplementary Figure S3A) (Galbraith et al., 2017). Similarly, it has been reported that Camk1d was overexpressed when amplified in invasive breast carcinomas (Bergamaschi et al., 2008). Interestingly, Cd44 has been reported to be expressed during the late saccular phase of human lung development at birth (Markasz et al., 2021).
The lung development of P35 mice is in a state of early maturation. Distributions of Malat1, Jarid2, Lar2, Il31ra, Cdk8, Camkld and Cd44 indicated that the distal lung is more proliferative and less mature than the proximal during this developmental stage. It is evident that, at this particular stage, the development of the mouse lung is characterized by spatial asynchrony. Taken together, the spatial distribution of lung functional genes revealed by ST can aid our understanding of the function-structure relation of the lung structures.
Thanks to the emergence of novel bioinformatic tools, it is now possible to integrate ST datasets with scRNA-seq data to obtain a deeper molecular insight while preserving spatial integrity, as shown in recent studies (Abdelaal et al., 2020; Kleshchevnikov et al., 2020; Kuppe et al., 2020; Fawkner-Corbett et al., 2021).
To further investigate the cellular spatial locations within the lung section, we comprehensively integrated of our Stereo-seq dataset with a previously published scRNA-seq dataset (Travaglini et al., 2020). We identified 11 main cell types within the analyzed lung section, including alveolar epithelial type 2 (AT2), artery, vein, ciliated, lymphatic, adventitial fibroblast, alveolar fibroblast, capillary, capillary aerocyte, myofibroblast, and pericyte (Figure 2B). Notably, the spatial distributions of different cell types, such as AT2, ciliated, alveolar fibroblast, and neutrophil, were consistent with the distribution of their marker genes expression as mentioned above (Figure 2C). And then, we calculated the correlation of spatial distribution between cell types in the entire lung section. Based on the results among the cell types, lymphatic and capillary were clustered together while the arterial cells clustered more closely with the capillary aerocyte cluster. This means that in the spatial distribution of this lung section, the lymphatic cell gathered the closest with capillary, the same as arterial cells and capillary aerocyte. The blank plots mean no correlation in any spatial location within those 2 cell types. The plots that belong to the cell type are also blank (Figure 2D). We calculated the percentage of each population of cells identified in each bin50 spot and observed that the AT2 was the most abundant, followed by alveolar fibroblast and capillary cells (Figure 2E) (Han et al., 2018).
Given the integration analyses are based on the resolution of bin 50, we visualized the spatial distribution of some marker genes at bin 1, bin 5, and bin 10 resolution, which is actually in the subcellular dimension. As a result, the gene expression pattern was roughly consistent with bin 50 and displayed more details (Supplementary Figure S5A). In addition, compared the distribution of genes and cells between Stereo-seq and a publicly available Visium dataset (Esquer et al., 2022), the highest resolution of Visium is 100 μm which can not accurately reveal the location of genes in situ (Supplementary Figure S5B).
Taken together, we have successfully integrated scRNA-seq and ST data, and those can be used for further and deeper multi-omics analysis.
Ultimately, we applied the SCENIC algorithm to our data for gene regulatory network reconstruction (Aibar et al., 2017). By doing so, we identified 99 regulons that displayed a distinct spatial distribution within the lung section, such as Hsfy2(+), Nr5a1(+), Mxd4(+), Foxj1(+), Hcfc(+), Hif1a(+), Ctcf(+), and Jund(+) (Figure 3A). We found that the spatial distribution of the regulatory activities of some regoluns remains consistent, such as Ctcf(+) and Jund(+). Next, we analyzed potential correlations between specific regulons with given lung structures (Figure 3B). We found that several regulon modules, including Ctcf(+), Jund(+), Tef(+), Jun(+), Klf2(+), Dbp(+), Ets2(+), Foxj1(+) were specifically enriched within the bronchioli. The regulon module with Hcfc1(+), Hif1a(+), Etv5(+), Tcf4(+), Nr1h3(+), Hes1(+) was instead preferentially located within alveoli, while the regulon module with Hsfy2(+), Nr5a1(+), Hoxc4(+), Neurod1(+), Cdx4(+), Foxg1(+), Nr2e3(+) was mainly distributed inside the alveoli according to the annotation of functional regions (Cusanovich et al., 2018). Jund has been reported to be involved in multiple mechanisms of cell fate regulation in the lung, including mediating transcriptional activation of angiotensinogen (Abdul-Hafez et al., 2009), inducing interleukin-6 (Eickelberg et al., 1999), and participating in lung carcinogenesis (Ruiz et al., 2021). Foxj1 affects the differentiation and functional performance of ciliated cells distributed throughout the airway tree, including the trachea, lobar bronchi, and terminal bronchiole (You et al., 2004; Koay et al., 2021). Hcfc1 drives cell-cycle gene expression as a transcriptional regulator, depending on heat-shock proteins 90 (Antonova et al., 2019). It was also shown that Foxg1 is the main target gene of MiR-378, which promotes the cell proliferation of non-small cell lung cancer when Foxg1 is inhibited (Ji et al., 2018). Similarly, Tcf4 has been shown to play a role in developing lung cancer, for example, by promoting M2 polarization of macrophages (Sun and Xu, 2019). Our data can identify the spatial distribution of regulons in the mouse lung, providing fundamental insight for understanding its functions in development and diseases.
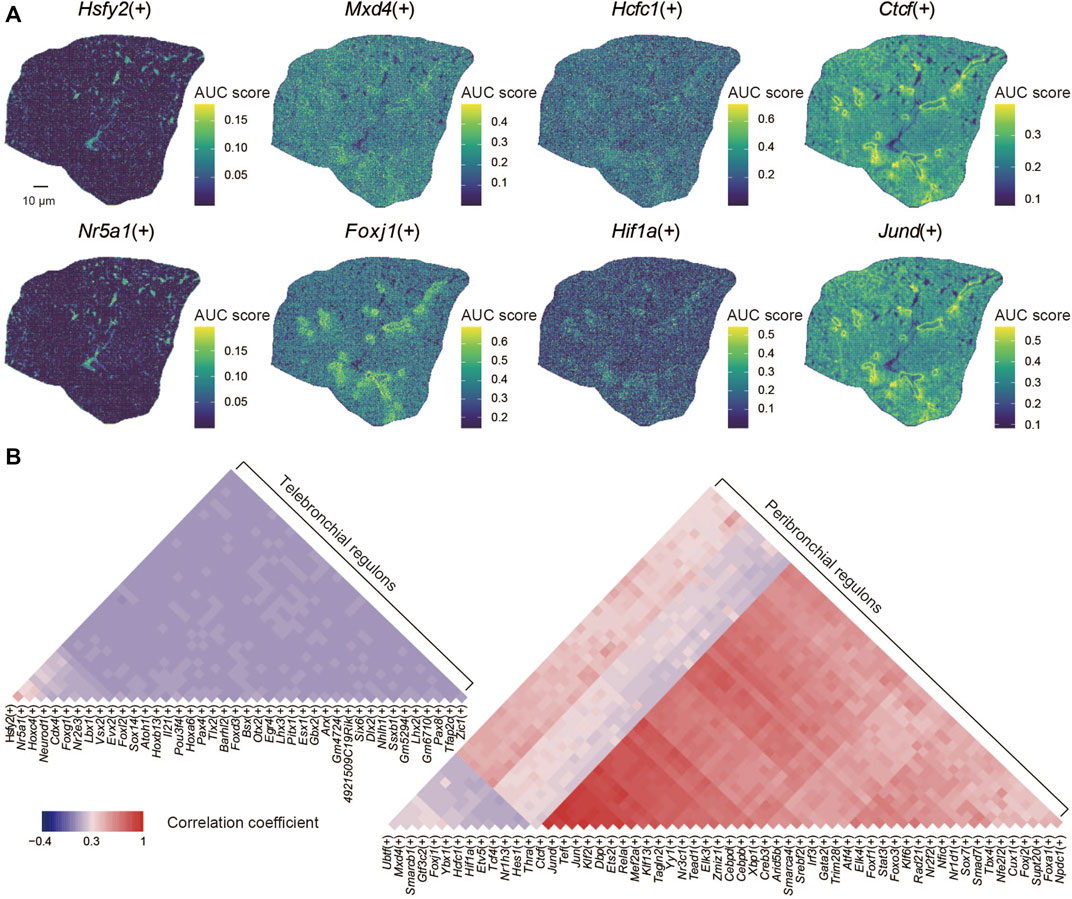
FIGURE 3. Spatial characteristics of regulons in the lung. (A) Spatial distribution of regulons: Hsfy2(+), Nr5a1(+), Mxd4(+), Foxj1(+), Hcfc1(+), Hif1a(+), Ctcf(+), and Jund(+). (B) The correlation coefficient of the spatial distribution of regulons.
In summary, by applying the Stereo-seq, we provide an ST atlas of the developing murine female lung at an unprecedented resolution. The internal tissue structures of mouse lungs, such as bronchioli and alveoli, were well-exhibited, revealing the spatial localization of the regulons determined by SCENIC. Furthermore, our work developed a route for multi-modal-omics data integration by integrating of ST data with scRNA-seq. Our data can benefit several research areas in life sciences, such as lung developmental biology, disease research, tumor research, and more.
The datasets presented in this study can be found in online repositories. The names of the repository/repositories and accession number(s) can be found below: https://www.ncbi.nlm.nih.gov/, PRJNA798781 https://db.cngb.org/, CNP0002590.
The animal study was reviewed and approved by the Ethics Committee of BGI (Permit No. BGI-IR20210903001).
YJ, SH, XX, CLiu, and LL conceived the idea. YJ and CLi collected samples. YJ, JX, and MC generated the data. YJ, MC, JX, and HZ assisted with the experiments. YJ and SH analyzed the data. YJ wrote the manuscript with the input of SH, CLiu, MC, JX, and LL. XX, GV, and LL supervised the study and revised the manuscript. XC, AC, and SL provided helpful comments on this study. All authors reviewed and approved the final manuscript.
This research was supported by the Guangdong Provincial Key Laboratory of Genome Read and Write (No. 2017B030301011) and Shenzhen Key Laboratory of Single-Cell Omics (No. ZDSYS20190902093613831).
The authors declare that the research was conducted in the absence of any commercial or financial relationships that could be construed as a potential conflict of interest.
All claims expressed in this article are solely those of the authors and do not necessarily represent those of their affiliated organizations, or those of the publisher, the editors and the reviewers. Any product that may be evaluated in this article, or claim that may be made by its manufacturer, is not guaranteed or endorsed by the publisher.
We thank all Center for Digitizing Cells from the Institute of SuperCells (BGI) for helpful comments. In addition, we thank China National GeneBank for providing sequencing services for this project.
The Supplementary Material for this article can be found online at: https://www.frontiersin.org/articles/10.3389/fgene.2022.858808/full#supplementary-material
Supplementary Figure 1 | Stereo-seq dataset quality control of section 2 and section 3. (A) The UMI (left) and the percent of mitochondrial genes (middle) spatial distribution patterns of the Stereo-seq Section 2, and the Coefficient of determination (R2) of Section 2 and Section 1. (B) The UMI (left) and the percent of mitochondrial genes (middle) spatial distribution patterns of the Stereo-seq Section 3, and the Coefficient of determination (R2) of Section 3 and Section 1.
Supplementary Figure 2 | Spatial distribution of the 17 hotspot gene groups.
Supplementary Figure 3 | Identification of the pattern of genes and structures in the lung. (A) Spatial distribution of genes: Ager, Dcn, Cdk8, and Foxj1. (B) All groups to tissue section by clustering, to gain the spatial clustering. (C) Percentage of the content of each cluster in section. (D) Correlation of each cluster in the lung section. (E) Percentage expression and average expression of each cluster containing genes in the lung section.
Supplementary Figure 4 | Identification of the differential express genes and functions in the proximal and distal lung. (A) The differential express genes in the proximal and distal lung. (B) The gene pathway enrichment analyses of the genes in the proximal and distal lung.
Supplementary Figure 5 | The distribution of genes and cells in Stereo-seq and Visium. (A) The distribution of Acta2,Tmem100, Myh6, and Jarid2 in bin1, bin5, and bin10 of Stereo-seq. (B) The distribution of Ciliated, Adventitial Fibroblast, and AT2 of Visum.
Supplementary Table 1 | Sequencing dataset quality control of three Stereo-seq sections.
Supplementary Table 2 | List of genes in groups formed by identical expression patterns.
Supplementary Table 3 | Markers and annotation for each cluster in the mouse lung section.
Abdelaal, T., Mourragui, S., Mahfouz, A., and Reinders, M. J. T. (2020). SpaGE: Spatial Gene Enhancement Using scRNA-Seq. Nucleic Acids Res. 48, e107. doi:10.1093/nar/gkaa740
Abdul-Hafez, A., Shu, R., and Uhal, B. D. (2009). JunD and HIF‐1α Mediate Transcriptional Activation of Angiotensinogen by TGF‐β1 in Human Lung Fibroblasts. FASEB j. 23, 1655–1662. doi:10.1096/fj.08-114611
Adhikari, A., Mainali, P., and Davie, J. K. (2019). JARID2 and the PRC2 Complex Regulate the Cell Cycle in Skeletal Muscle. J. Biol. Chem. 294, 19451–19464. doi:10.1074/jbc.ra119.010060
Aibar, S., González-Blas, C. B., Moerman, T., Huynh-Thu, V. A., Imrichova, H., Hulselmans, G., et al. (2017). SCENIC: Single-Cell Regulatory Network Inference and Clustering. Nat. Methods 14, 1083–1086. doi:10.1038/nmeth.4463
Angelidis, I., Simon, L. M., Fernandez, I. E., Strunz, M., Mayr, C. H., Greiffo, F. R., et al. (2019). An Atlas of the Aging Lung Mapped by Single Cell Transcriptomics and Deep Tissue Proteomics. Nat. Commun. 10, 963. doi:10.1038/s41467-019-08831-9
Antonova, A., Hummel, B., Khavaran, A., Redhaber, D. M., Aprile-Garcia, F., Rawat, P., et al. (2019). Heat-Shock Protein 90 Controls the Expression of Cell-Cycle Genes by Stabilizing Metazoan-specific Host-Cell Factor HCFC1. Cel Rep. 29, 1645–1659. doi:10.1016/j.celrep.2019.09.084
Asp, M., Bergenstråhle, J., and Lundeberg, J. (2020). Spatially Resolved Transcriptomes-Next Generation Tools for Tissue Exploration. Bioessays 42, e1900221. doi:10.1002/bies.201900221
Beauchemin, K. J., Wells, J. M., Kho, A. T., Philip, V. M., Kamir, D., Kohane, I. S., et al. (2016). Temporal Dynamics of the Developing Lung Transcriptome in Three Common Inbred Strains of Laboratory Mice Reveals Multiple Stages of Postnatal Alveolar Development. PeerJ 4, e2318. doi:10.7717/peerj.2318
Benam, K. H., Dauth, S., Hassell, B., Herland, A., Jain, A., Jang, K.-J., et al. (2015). Engineered In Vitro Disease Models. Annu. Rev. Pathol. Mech. Dis. 10, 195–262. doi:10.1146/annurev-pathol-012414-040418
Beppu, A. K., Zhao, J., Yao, C., Carraro, G., Israely, E., Coelho, A. L., et al. (2021). Epithelial Plasticity and Innate Immune Activation Promote Lung Tissue Remodeling Following Respiratory Viral Infection. BioRxiv. doi:10.1101/2021.09.22.461381
Bergamaschi, A., Kim, Y. H., Kwei, K. A., La Choi, Y., Bocanegra, M., Langerød, A., et al. (2008). CAMK1Damplification Implicated in Epithelial-Mesenchymal Transition in Basal-like Breast Cancer. Mol. Oncol. 2, 327–339. doi:10.1016/j.molonc.2008.09.004
Boyd, D. F., Allen, E. K., Allen, E. K., Randolph, A. G., Guo, X.-z. J., Weng, Y., et al. (2020). Exuberant Fibroblast Activity Compromises Lung Function via ADAMTS4. Nature 587, 466–471. doi:10.1038/s41586-020-2877-5
Cable, D. M., Murray, E., Zou, L. S., Goeva, A., Macosko, E. Z., Chen, F., et al. (2021). Robust Decomposition of Cell Type Mixtures in Spatial Transcriptomics. Nat. Biotechnol39, 1-10. doi:10.1101/2020.05.07.082750
Chao, C.-M., El Agha, E., Tiozzo, C., Minoo, P., and Bellusci, S. (2015). A Breath of Fresh Air on the Mesenchyme: Impact of Impaired Mesenchymal Development on the Pathogenesis of Bronchopulmonary Dysplasia. Front. Med. 2, 27. doi:10.3389/fmed.2015.00027
Chen, A., Liao, S., Cheng, M., Ma, K., Wu, L., Lai, Y., et al. (2021). Spatiotemporal Transcriptomic Atlas of Mouse Organogenesis Using DNA Nanoball Patterned Arrays. BioRxiv. doi:10.1101/2021.01.17.427004
Cheon, D.-J., and Orsulic, S. (2011). Mouse Models of Cancer. Annu. Rev. Pathol. Mech. Dis. 6, 95–119. doi:10.1146/annurev.pathol.3.121806.154244
Cho, J., Kim, S., Lee, H., Rah, W., Cho, H. C., Kim, N. K., et al. (2021). Regeneration of Infarcted Mouse Hearts by Cardiovascular Tissue Formed via the Direct Reprogramming of Mouse Fibroblasts. Nat. Biomed. Eng. 5, 880–896. doi:10.1038/s41551-021-00783-0
Close, J. L., Long, B. R., and Zeng, H. (2021). Spatially Resolved Transcriptomics in Neuroscience. Nat. Methods 18, 23–25. doi:10.1038/s41592-020-01040-z
Cusanovich, D. A., Hill, A. J., Aghamirzaie, D., Daza, R. M., Pliner, H. A., Berletch, J. B., et al. (2018). A Single-Cell Atlas of In Vivo Mammalian Chromatin Accessibility. Cell 174, 1309–1324. doi:10.1016/j.cell.2018.06.052
DeTomaso, D., and Yosef, N. (2021). Hotspot Identifies Informative Gene Modules across Modalities of Single-Cell Genomics. Cel Syst. 12, 446–456. doi:10.1016/j.cels.2021.04.005
Dobin, A., Davis, C. A., Schlesinger, F., Drenkow, J., Zaleski, C., Jha, S., et al. (2013). STAR: Ultrafast Universal RNA-Seq Aligner. Bioinformatics 29, 15–21. doi:10.1093/bioinformatics/bts635
Eickelberg, O., Pansky, A., Mussmann, R., Bihl, M., Tamm, M., Hildebrand, P., et al. (1999). Transforming Growth Factor-Β1 Induces Interleukin-6 Expression via Activating Protein-1 Consisting of JunD Homodimers in Primary Human Lung Fibroblasts. J. Biol. Chem. 274, 12933–12938. doi:10.1074/jbc.274.18.12933
Eissmann, M., Gutschner, T., Hämmerle, M., Günther, S., Caudron-Herger, M., Gross, M., et al. (2012). Loss of the Abundant Nuclear Non-coding RNA MALAT1 Is Compatible with Life and Development. RNA Biol. 9, 1076–1087. doi:10.4161/rna.21089
Esquer, C., Echeagaray, O., Firouzi, F., Savko, C., Shain, G., Bose, P., et al. (2022). Fundamentals of Vaping-Associated Pulmonary Injury Leading to Severe Respiratory Distress. Life Sci. Alliance 5, 1246. doi:10.26508/lsa.202101246
Fawkner-Corbett, D., Antanaviciute, A., Parikh, K., Jagielowicz, M., Gerós, A. S., Gupta, T., et al. (2021). Spatiotemporal Analysis of Human Intestinal Development at Single-Cell Resolution. Cell 184, 810–826. doi:10.1016/j.cell.2020.12.016
Galbraith, M. D., Andrysik, Z., Pandey, A., Hoh, M., Bonner, E. A., Hill, A. A., et al. (2017). CDK8 Kinase Activity Promotes Glycolysis. Cel Rep. 21, 1495–1506. doi:10.1016/j.celrep.2017.10.058
Gillich, A., Zhang, F., Farmer, C. G., Travaglini, K. J., Tan, S. Y., Gu, M., et al. (2020). Capillary Cell-type Specialization in the Alveolus. Nature 586, 785–789. doi:10.1038/s41586-020-2822-7
Gutschner, T., Hämmerle, M., Eissmann, M., Hsu, J., Kim, Y., Hung, G., et al. (2013). The Noncoding RNA MALAT1 Is a Critical Regulator of the Metastasis Phenotype of Lung Cancer Cells. Cancer Res. 73, 1180–1189. doi:10.1158/0008-5472.can-12-2850
Han, X., Wang, R., Zhou, Y., Fei, L., Sun, H., Lai, S., et al. (2018). Mapping the Mouse Cell Atlas by Microwell-Seq. Cell 172, 1091–1107. doi:10.1016/j.cell.2018.02.001
He, P., Lim, K., Sun, D., Pett, J. P., Jeng, Q., Polanski, K., et al. (2022). A Human Fetal Lung Cell Atlas Uncovers Proximal-Distal Gradients of Differentiation and Key Regulators of Epithelial Fates. bioRxiv. doi:10.1101/2022.01.11.474933
Huang, X., Shen, W., Veizades, S., Liang, G., Sayed, N., and Nguyen, P. K. (2021). Single-Cell Transcriptional Profiling Reveals Sex and Age Diversity of Gene Expression in Mouse Endothelial Cells. Front. Genet. 12, 590377. doi:10.3389/fgene.2021.590377
Hurskainen, M., Mižíková, I., Cook, D. P., Andersson, N., Cyr-Depauw, C., Lesage, F., et al. (2021). Single Cell Transcriptomic Analysis of Murine Lung Development on Hyperoxia-Induced Damage. Nat. Commun. 12, 1565. doi:10.1038/s41467-021-21865-2
Ji, K. X., Cui, F., Qu, D., Sun, R. Y., Sun, P., Chen, F. Y., et al. (2018). MiR-378 Promotes the Cell Proliferation of Non-small Cell Lung Cancer by Inhibiting FOXG1. Eur. Rev. Med. Pharmacol. Sci. 22, 1011–1019. doi:10.26355/eurrev_201802_14383
Kleshchevnikov, V., Shmatko, A., Dann, E., Aivazidis, A., King, H. W., Li, T., et al. (2020). Comprehensive Mapping of Tissue Cell Architecture via Integrated Single Cell and Spatial Transcriptomics. BioRxiv. doi:10.1101/2020.11.15.378125
Koay, T. W., Osterhof, C., Orlando, I. M. C., Keppner, A., Andre, D., Yousefian, S., et al. (2021). Androglobin Gene Expression Patterns and FOXJ1-dependent Regulation Indicate its Functional Association with Ciliogenesis. J. Biol. Chem. 296, 100291. doi:10.1016/j.jbc.2021.100291
Kuppe, C., Ramirez Flores, R. O., Li, Z., Hannani, M., Tanevski, J., Halder, M., et al. (2020). Spatial Multi-Omic Map of Human Myocardial Infarction. BioRxiv. doi:10.1101/2020.12.08.411686
Lähnemann, D., Köster, J., Szczurek, E., McCarthy, D. J., Hicks, S. C., Robinson, M. D., et al. (2020). Eleven Grand Challenges in Single-Cell Data Science. Genome Biol. 21, 31. doi:10.1186/s13059-020-1926-6
Larsson, L., Frisén, J., and Lundeberg, J. (2021). Spatially Resolved Transcriptomics Adds a New Dimension to Genomics. Nat. Methods 18, 15–18. doi:10.1038/s41592-020-01038-7
Lein, E., Borm, L. E., and Linnarsson, S. (2017). The Promise of Spatial Transcriptomics for Neuroscience in the Era of Molecular Cell Typing. Science 358, 64–69. doi:10.1126/science.aan6827
Leist, S. R., Dinnon, K. H., Schäfer, A., Tse, L. V., Okuda, K., Hou, Y. J., et al. (2020). A Mouse-Adapted SARS-CoV-2 Induces Acute Lung Injury and Mortality in Standard Laboratory Mice. Cell 183, 1070–1085. doi:10.1016/j.cell.2020.09.050
Liao, J., Lu, X., Shao, X., Zhu, L., and Fan, X. (2021). Uncovering an Organ's Molecular Architecture at Single-Cell Resolution by Spatially Resolved Transcriptomics. Trends Biotechnol. 39, 43–58. doi:10.1016/j.tibtech.2020.05.006
Longo, S. K., Guo, M. G., Ji, A. L., and Khavari, P. A. (2021). Integrating Single-Cell and Spatial Transcriptomics to Elucidate Intercellular Tissue Dynamics. Nat. Rev. Genet. 22, 627–644. doi:10.1038/s41576-021-00370-8
Markasz, L., Savani, R. C., Jonzon, A., and Sindelar, R. (2021). CD44 and RHAMM Expression Patterns in the Human Developing Lung. Pediatr. Res. 89, 134–142. doi:10.1038/s41390-020-0873-y
Marx, V. (2021). Method of the Year: Spatially Resolved Transcriptomics. Nat. Methods 18, 9–14. doi:10.1038/s41592-020-01033-y
Moor, A. E., and Itzkovitz, S. (2017). Spatial Transcriptomics: Paving the Way for Tissue-Level Systems Biology. Curr. Opin. Biotechnol. 46, 126–133. doi:10.1016/j.copbio.2017.02.004
Mujahid, S., Logvinenko, T., Volpe, M. V., and Nielsen, H. C. (2013). miRNA Regulated Pathways in Late Stage Murine Lung Development. BMC Dev. Biol. 13, 13. doi:10.1186/1471-213x-13-13
Mund, S. I., Stampanoni, M., and Schittny, J. C. (2008). Developmental Alveolarization of the Mouse Lung. Dev. Dyn. 237, 2108–2116. doi:10.1002/dvdy.21633
Nathan, S. D., Barbera, J. A., Gaine, S. P., Harari, S., Martinez, F. J., Olschewski, H., et al. (2019). Pulmonary Hypertension in Chronic Lung Disease and Hypoxia. Eur. Respir. J. 53, 1801914. doi:10.1183/13993003.01914-2018
Neuper, T., Neureiter, D., Sarajlic, M., Strandt, H., Bauer, R., Schwarz, H., et al. (2021). IL‐31 Transgenic Mice Show Reduced Allergen‐induced Lung Inflammation. Eur. J. Immunol. 51, 191–196. doi:10.1002/eji.202048547
Paik, D. T., Tian, L., Williams, I. M., Rhee, S., Zhang, H., Liu, C., et al. (2020). Single-Cell RNA Sequencing Unveils Unique Transcriptomic Signatures of Organ-specific Endothelial Cells. Circulation 142, 1848–1862. doi:10.1161/circulationaha.119.041433
Podolanczuk, A. J., Wong, A. W., Saito, S., Lasky, J. A., Ryerson, C. J., and Eickelberg, O. (2021). Update in Interstitial Lung Disease 2020. Am. J. Respir. Crit. Care Med. 203, 1343–1352. doi:10.1164/rccm.202103-0559up
Poss, Z. C., Ebmeier, C. C., and Taatjes, D. J. (2013). The Mediator Complex and Transcription Regulation. Crit. Rev. Biochem. Mol. Biol. 48, 575–608. doi:10.3109/10409238.2013.840259
Rao, A., Barkley, D., França, G. S., and Yanai, I. (2021). Exploring Tissue Architecture Using Spatial Transcriptomics. Nature 596, 211–220. doi:10.1038/s41586-021-03634-9
Rawlins, E. L., Okubo, T., Xue, Y., Brass, D. M., Auten, R. L., Hasegawa, H., et al. (2009). The Role of Scgb1a1+ Clara Cells in the Long-Term Maintenance and Repair of Lung Airway, but Not Alveolar, Epithelium. Cell Stem Cell 4, 525–534. doi:10.1016/j.stem.2009.04.002
Rawlins, E. L., Ostrowski, L. E., Randell, S. H., and Hogan, B. L. M. (2007). Lung Development and Repair: Contribution of the Ciliated Lineage. Proc. Natl. Acad. Sci. 104, 410–417. doi:10.1073/pnas.0610770104
Ruiz, E. J., Lan, L., Diefenbacher, M. E., Riising, E. M., Da Costa, C., Chakraborty, A., et al. (2021). JunD, Not C-Jun, Is the AP-1 Transcription Factor Required for Ras-Induced Lung Cancer. JCI Insight 6, 124985. doi:10.1172/jci.insight.124985
Saviano, A., Henderson, N. C., and Baumert, T. F. (2020). Single-cell Genomics and Spatial Transcriptomics: Discovery of Novel Cell States and Cellular Interactions in Liver Physiology and Disease Biology. J. Hepatol. 73, 1219–1230. doi:10.1016/j.jhep.2020.06.004
Scaffa, A., Yao, H., Oulhen, N., Wallace, J., Peterson, A. L., Rizal, S., et al. (2021). Single-cell Transcriptomics Reveals Lasting Changes in the Lung Cellular Landscape into Adulthood after Neonatal Hyperoxic Exposure. Redox Biol. 48, 102091. doi:10.1016/j.redox.2021.102091
Schittny, J. C. (2017). Development of the Lung. Cell Tissue Res 367, 427–444. doi:10.1007/s00441-016-2545-0
Ståhl, P. L., Salmén, F., Vickovic, S., Lundmark, A., Navarro, J. F., Magnusson, J., et al. (2016). Visualization and Analysis of Gene Expression in Tissue Sections by Spatial Transcriptomics. Science 353, 78–82. doi:10.1126/science.aaf2403
Sun, Y., and Xu, J. (2019). TCF-4 Regulated lncRNA-XIST Promotes M2 Polarization of Macrophages and Is Associated with Lung Cancer. Ott Vol. 12, 8055–8062. doi:10.2147/ott.s210952
Thorolfsdottir, R. B., Sveinbjornsson, G., Sulem, P., Helgadottir, A., Gretarsdottir, S., Benonisdottir, S., et al. (2017). A Missense Variant in PLEC Increases Risk of Atrial Fibrillation. J. Am. Coll. Cardiol. 70, 2157–2168. doi:10.1016/j.jacc.2017.09.005
Tobin, M. J. (2005). Update in Pulmonary Diseases. Ann. Intern. Med. 142, 283–288. doi:10.7326/0003-4819-142-4-200502150-00010
Toyoda, M., Shirato, H., Nakajima, K., Kojima, M., Takahashi, M., Kubota, M., et al. (2003). Jumonji Downregulates Cardiac Cell Proliferation by Repressing Cyclin D1 Expression. Develop. Cel. 5, 85–97. doi:10.1016/s1534-5807(03)00189-8
Travaglini, K. J., Nabhan, A. N., Penland, L., Sinha, R., Gillich, A., Sit, R. V., et al. (2020). A Molecular Cell Atlas of the Human Lung from Single-Cell RNA Sequencing. Nature 587, 619–625. doi:10.1038/s41586-020-2922-4
Van de Sande, B., Flerin, C., Davie, K., De Waegeneer, M., Hulselmans, G., Aibar, S., et al. (2020). A Scalable SCENIC Workflow for Single-Cell Gene Regulatory Network Analysis. Nat. Protoc. 15, 2247–2276. doi:10.1038/s41596-020-0336-2
Vila Ellis, L., Cain, M. P., Hutchison, V., Flodby, P., Crandall, E. D., Borok, Z., et al. (2020). Epithelial Vegfa Specifies a Distinct Endothelial Population in the Mouse Lung. Develop. Cel. 52, 617–630. doi:10.1016/j.devcel.2020.01.009
Walsh, N. C., Kenney, L. L., Jangalwe, S., Aryee, K.-E., Greiner, D. L., Brehm, M. A., et al. (2017). Humanized Mouse Models of Clinical Disease. Annu. Rev. Pathol. Mech. Dis. 12, 187–215. doi:10.1146/annurev-pathol-052016-100332
Waylen, L. N., Nim, H. T., Martelotto, L. G., and Ramialison, M. (2020). From Whole-Mount to Single-Cell Spatial Assessment of Gene Expression in 3D. Commun. Biol. 3, 602. doi:10.1038/s42003-020-01341-1
Wu, H., Yu, Y., Huang, H., Hu, Y., Fu, S., Wang, Z., et al. (2020). Progressive Pulmonary Fibrosis Is Caused by Elevated Mechanical Tension on Alveolar Stem Cells. Cell 180, 107–121. doi:10.1016/j.cell.2019.11.027
Xu, Z., Wang, X., Fan, L., Wang, F., Wang, J., Chen, W., et al. (2021). Integrative Analysis of Spatial Transcriptome with Single-Cell Transcriptome and Single-Cell Epigenome in Mouse Lungs after Immunization. BioRxiv. doi:10.1101/2021.09.17.460865
You, Y., Huang, T., Richer, E. J., Schmidt, J.-E. H., Zabner, J., Borok, Z., et al. (2004). Role of F-Box Factor Foxj1 in Differentiation of Ciliated Airway Epithelial Cells. Am. J. Physiology-Lung Cell Mol. Physiol. 286, L650–L657. doi:10.1152/ajplung.00170.2003
Zepp, J. A., Morley, M. P., Loebel, C., Kremp, M. M., Chaudhry, F. N., Basil, M. C., et al. (2021). Genomic, Epigenomic, and Biophysical Cues Controlling the Emergence of the Lung Alveolus. Science 371, eabc3172. doi:10.1126/science.abc3172
Zhang, M., Sheffield, T., Zhan, X., Li, Q., Yang, D. M., Wang, Y., et al. (2021). Spatial Molecular Profiling: Platforms, Applications and Analysis Tools. Brief. Bioinformatics 22, bbaa145. doi:10.1093/bib/bbaa145
Zhuang, X. (2021). Spatially Resolved Single-Cell Genomics and Transcriptomics by Imaging. Nat. Methods 18, 18–22. doi:10.1038/s41592-020-01037-8
Keywords: spatial transcriptome, Stereo-seq, mouse lung, alveolarization, development
Citation: Jiang Y, Hao S, Chen X, Cheng M, Xu J, Li C, Zheng H, Volpe G, Chen A, Liao S, Liu C, Liu L and Xu X (2022) Spatial Transcriptome Uncovers the Mouse Lung Architectures and Functions. Front. Genet. 13:858808. doi: 10.3389/fgene.2022.858808
Received: 20 January 2022; Accepted: 21 February 2022;
Published: 09 March 2022.
Edited by:
Jijun Tang, University of South Carolina, United StatesReviewed by:
Naihe Jing, Shanghai Institute of Biochemistry and Cell Biology (CAS), ChinaCopyright © 2022 Jiang, Hao, Chen, Cheng, Xu, Li, Zheng, Volpe, Chen, Liao, Liu, Liu and Xu. This is an open-access article distributed under the terms of the Creative Commons Attribution License (CC BY). The use, distribution or reproduction in other forums is permitted, provided the original author(s) and the copyright owner(s) are credited and that the original publication in this journal is cited, in accordance with accepted academic practice. No use, distribution or reproduction is permitted which does not comply with these terms.
*Correspondence: Chuanyu Liu, bGl1Y2h1YW55dUBnZW5vbWljcy5jbg==; Longqi Liu, bGl1bG9uZ3FpQGdlbm9taWNzLmNu; Xun Xu, eHV4dW5AZ2Vub21pY3MuY24=
†These authors have contributed equally to this work
Disclaimer: All claims expressed in this article are solely those of the authors and do not necessarily represent those of their affiliated organizations, or those of the publisher, the editors and the reviewers. Any product that may be evaluated in this article or claim that may be made by its manufacturer is not guaranteed or endorsed by the publisher.
Research integrity at Frontiers
Learn more about the work of our research integrity team to safeguard the quality of each article we publish.