 Peijun Mao
 Yonghang Run
 Kehui Zhan
 Haixia Xu
94% of researchers rate our articles as excellent or good
Learn more about the work of our research integrity team to safeguard the quality of each article we publish.
Find out more
ORIGINAL RESEARCH article
Front. Genet., 16 March 2022
Sec. Genomics of Plants and the Phytoecosystem
Volume 13 - 2022 | https://doi.org/10.3389/fgene.2022.846795
This article is part of the Research TopicApplication of Network Theoretic Approaches in BiologyView all 11 articles
In plants, chloride channels (CLC) are involved in a series of specific functions, such as regulation of nutrient transport and stress tolerance. Members of the wheat Triticum aestivum L. CLC (TaCLC) gene family have been proposed to encode anion channels/transporters that may be related to nitrogen transportation. To better understand their roles, TaCLC family was screened and 23 TaCLC gene sequences were identified using a Hidden Markov Model in conjunction with wheat genome database. Gene structure, chromosome location, conserved motif, and expression pattern of the resulting family members were then analyzed. Phylogenetic analysis showed that the TaCLC family can be divided into two subclasses (I and II) and seven clusters (-a, -c1, -c2, -e, -f1, -f2, and -g2). Using a wheat RNA-seq database, the expression pattern of TaCLC family members was determined to be an inducible expression type. In addition, seven genes from seven different clusters were selected for quantitative real-time PCR (qRT-PCR) analysis under low nitrogen stress or salt stress conditions, respectively. The results indicated that the gene expression levels of this family were up-regulated under low nitrogen stress and salt stress, except the genes of TaCLC-c2 cluster which were from subfamily -c. The yeast complementary experiments illustrated that TaCLC-a-6AS-1, TaCLC-c1-3AS, and TaCLC-e-3AL all had anion transport functions for NO3− or Cl−, and compensated the hypersensitivity of yeast GEF1 mutant strain YJR040w (Δgef1) in restoring anion-sensitive phenotype. This study establishes a theoretical foundation for further functional characterization of TaCLC genes and provides an initial reference for better understanding nitrate nitrogen transportation in wheat.
Nitrogen is the most important nutrient element for plant growth and development. The composition of more complex compounds such as proteins, nucleic acids and enzymes, which are crucial for plant functioning, is inseparable from nitrogen itself (Lv et al., 2021). Despite its benefits, excessive nitrogen application brings serious negative effects, including ground water nitrate pollution and eutrophication of rivers and lakes. According to available statistical data, 25 million tons of nitrogen fertilizer are applied annually in China, three times the world average. However, the utilization efficiency of nitrogen fertilizer has only reached 30% of the applied amount (Ju and Zhang, 2017). Given this, improving nitrogen use efficiency is of great significance to crops, as better efficiency will reduce nitrogen fertilizer pollution in surrounding ecosystems.
The main forms of nitrogen absorbed and used by most plants are nitrate nitrogen (NO3−) and ammonium nitrogen (NH4+). In plants, ammonium nitrogen absorption is mainly regulated by the ammonium transporter (AMT) genes (Li et al., 2017). Conversely, nitrate nitrogen uptake is mainly regulated by four types of NO3− transporters: low affinity nitrate transporter NRT1, high affinity nitrate transporter NRT2, chloride channel protein CLC, and slow anion channel related homologue SLAC1/SLAH (Liu R. et al., 2020). Of these, the chloride channel (CLC) gene family is widely distributed across a variety of archaea, microbial fungi, mammals, and plants (Park et al., 2017). The members of the CLC family were first discovered in Torpedo California (electric ray fish) by White and Miller in 1979 (White and Miller, 1979). The first family gene was isolated from marine ray (Torpedo marmorata) by Jentsch in 1990 and named CLC-0 (Jentsch et al., 1990). Later, it was discovered that the CLC family genes also existed in most plants, including Arabidopsis thaliana, Nicotiana tabacum, Oryza sativa (L.), Poncirus trifoliata (L.) Raf., Zea mays (L.), and Glycine max (Lurin et al., 1996; Diedhiou and Golldack, 2006; Lv et al., 2009; Wang et al., 2015; Wei et al., 2015). Plants CLC proteins play important roles in turgor maintenance, stomatal movement, ion homeostasis, as well as enhancing drought and salt tolerance, and increasing nitrate accumulation (Wei et al., 2015; Zhang et al., 2018; Liu C. et al., 2020).
Structurally, the identified CLC genes all have a highly conserved voltage-gated chloride channel (Voltage-gate CLC) domain and two conserved Cystathionine beta synthase (CBS) domains (Xing et al., 2020). At present, the function and classification of Arabidopsis CLC family genes have been extensively and deeply studied. Specifically, members of the AtCLC gene family have been divided into two subclasses (I and II) and 7 subfamilies (-a, -b, -c, -d, -e, -f, and -g) (Nedelyaeva et al., 2020). Subclass Ⅰ is mainly composed of AtCLC-a/-b/-c/-d/-g subfamily, while subclass II is composed of AtCLC-e/-f subfamily (Nedelyaeva et al., 2020). In addition, it was found that subclass I contained the patterns GxGIPE (I), GKxGPxxH (II), and PxxGxLF (III). Comparatively, subclass II did not contain any of the above conserved motifs. When x in the conserved region of the gene GxGIPE (I) is a proline (P, Pro) residue, NO3− is preferentially transported. However, when x is a serine (S, Ser) residue, Cl− is preferentially transported. Past work has also shown that when the x in the conserved region (II) is a conservative-gated glutamate (E, Glu) and the fourth residue in the conserved region (III) is proton glutamate (E, Glu) residue, the protein function is a CLC antiporter rather than a CLC channel (Subba et al., 2021). The CLC family genes are not only comprised of channel proteins for anions such as chloride ion and nitrate ion, but also plays vital functional roles in regulating stomatal movement, maintaining both the potential balance and proton gradient in plant cell, transporting and accumulating nutrients in plants (Zifarelli and Pusch, 2010). In Arabidopsis, the AtCLC-a gene is located on the vacuolar membrane of plant vacuole and functions as a NO3−/H+ exchanger (De Angeli et al., 2006; Wege et al., 2014). The C-terminus of AtCLC-a can be combined with ATP and nitrate/proton alkynol to regulate the specific accumulation of nitrate in the vacuole (De Angeli et al., 2009). AtCLC-b is located on the vacuolar membrane as the second vacuolar NO3−/H+ exchanger (Whiteman et al., 2008; von der Fecht-Bartenbach et al., 2010). AtCLC-c is involved in stomatal movement and associated with salt tolerance (Harada et al., 2004; Jossier et al., 2010). AtCLC-d mediates the transport of anions such as Cl− or NO3−, and regulates the luminal pH of the Golgi network (von der Fecht-Bartenbach et al., 2007). AtCLC-e and AtCLC-f are related to the thylakoid and Golgi membranes, respectively (Marmagne et al., 2007). AtCLC-a, AtCLC-b, and AtCLC-d play important roles in regulating root elongation (Moradi et al., 2015). OsCLC1 improves rice drought tolerance and increases yield (Um et al., 2018). The overexpression of the maize gene ZmCLC-d in Arabidopsis thaliana allows for better tolerance to cold, drought and salt stresses by an increased germination rate, root length, plant survival rate, antioxidant enzyme activities, and a reduced accumulation of Cl− in transgenic plants (Wang et al., 2015).
Wheat (Triticum aestivum L.) serves as the staple food for 30% of global population, and is an important cereal crop with a high demand for nitrogen fertilizer to enable the grain protein accumulation (Zörb et al., 2018). As a preferred nitrate crop, wheat mainly absorbs nitrate nitrogen as its nitrogen source. Studies showed that wheat biomass under conditions of either single ammonium nitrogen or single nitrate nitrogen was lower than when combined ammonium nitrogen and nitrate nitrogen were used (Ijato et al., 2021). Single ammonium nitrogen has a toxic effect on wheat, while nitrate nitrogen alleviates part of this toxic effect (Wang et al., 2016). The CLC genes have been shown to be related to the transportation of nitrate. However, the functional roles of the Triticum aestivum L. CLC (TaCLC) genes remain less well known. In this study, 23 wheat TaCLC genes were identified by a genome-wide search using released wheat genome data. We analyzed the phylogeny as well as conserved motifs in TaCLC proteins, gene structures, and expression patterns under stress condition. In addition, the part of TaCLC genes were functionally characterized in yeast mutant. Our study will lay a preliminary foundation for future research into the functions of TaCLCs gene.
Wheat genome (Triticum_aestivum.IWGSC.dna.toplevel.fa, 2021), GFF3 file (Triticum_aestivum.IWGSC.49.gff3, 2021), and protein sequences (Triticum_aestivum.IWGSC.pep.all.fa, 2021) were downloaded from the ensembl plant website (http://plants.ensembl.org/index.html).
The Pfam protein family database (http://pfam.xfam.org/) was used to search the ID number of the CLC gene family and its distribution across species (Finn et al., 2006). The Pfam accession number ID PF00654 was then used to search the sequences with default parameter settings in the Emsembl Plant database (http://plants.ensembl.org/index.html, Triticum aestivum IWGSCv1.1) (Cheng et al., 2018). The Blastp program of TBtools software was used to compare the amino acid sequence of wheat genome (http://ftp.ensemblgenomes.org/pub/plants/release-49/fasta/triticum_aestivum/pep/) with the protein sequence of AtCLC genes (Supplementary Table S1) and AtCLC used as the reference sequence (Chen et al., 2020). Then the TaCLC candidate genes obtained by HMM search and Blastp were compared. The ID of the same gene obtained by search retained only the longest transcript sequence. Incomplete gene sequences without either the initial or termination codon and mutation sequences were removed. The remaining sequences were detected using the CDD tool in NCBI (https://www.ncbi.nlm.nih.gov/) and any sequences with incomplete voltage-gated CLC domains were discarded. The final genes were members of the wheat TaCLC gene family. The gene length, encoded amino acid length, intron number, exon number and other biological information were downloaded from the Emsembl Plant database. The TaCLC sequence of wheat was submitted to blast online program in Ensembl Plant to find homologous genes in Arabidopsis thaliana genome (TAIR10.1). The GFF annotation information of TaCLCs gene was downloaded from the Emsembl Plant database. Subcellular localization of each TaCLC gene was predicted using WolfPSORT (https://wolfpsort.hgc.jp/) online tools. The gene structure was analyzed using TBtools software. We identified 33 conserved motifs of TaCLC based on the HMM logo in the Pfam database. The conserved motifs of TaCLC protein were identified by MEME (http://meme-suite.org/). The number of motifs setting was 33 and the motif length was set to 2–200 aa. Default parameters were used for all the programmes unless otherwise stated.
The protein sequences of AtCLC, OsCLC and GmCLC were retrieved from NCBI (https://www.ncbi.nlm.nih.gov/), RiceDate (https://www.ricedata.cn/), and SoyBase (https://www.soybase.org/), respectively. All these protein sequences are listed in Supplementary Table S1. The Clustal W tool in MAGA7.0 software was used to compare the reported CLC protein sequences of Arabidopsis thaliana (At), Oryza sativa L. (Os), Glycine max (Gm) and the newly identified wheat TaCLC protein sequences (Kumar et al., 2016). A phylogenetic tree was constructed using the neighbor-joining (NJ) method with the bootstrap replicates setting parameter of 1000.
The physical, chromosomal position of each TaCLC gene was obtained from the IWGSC RefSeq V1.0 database (https://urgi.versailles.inra.fr/). The physical map was plotted using MapInspect software according to the starting position and chromosome length of each gene. One Step MCScanX program of TBtools software was used to compare and integrate the whole genome sequence and gene structure annotation information of wheat and the E-value parameter setting was 10E-05 (Chen et al., 2020). In order to further predict the interspecific evolution mechanism of TaCLC family members, we also used TBtools software to integrate and compare the whole wheat genome sequence and gene structure annotation with Arabidopsis thaliana, Oryza sativa L. and Triticum dicoccoides. The data were from Emsembl Plant database (http://ftp.ensemblgenomes.org/pub/plants/release-49/fasta/) and the E-value parameter setting was 10E-05. Dual Systeny Plot program and Circle Gene View of TBtools software were used to visualize the collinearity results of TaCLC gene sequences. PROTTER (http://wlab.ethz.ch/protter/start/) online tools were used to analyze the transmembrane structure of TaCLCs gene-encoded proteins.
Using the wheat expression database ExpWheat (https://wheat.pw.usda.gov/WheatExp/), the expression patterns of TaCLC family genes in wheat plant roots, stems, leaves, panicles, grains, and other tissues were obtained. The expression of genes at different stages was also predicted. A heat map of TaCLCs gene expression was drawn by Heml software.
Wheat (Triticum aestivum L. cv. Yunong 804) seeds were planted for 5 days in culture dishes containing water in a greenhouse at 22°C with a 16 h light/8 h dark photoperiod. The 5-day-old wheat seedlings were transplanted into a nutrient solution (Supplementary Table S2), which was replaced every 3 days until the seedlings reached the three-leaf stage. The plantlets were then subjected to low nitrogen (0.4 mM NH4NO3) or salt stress (100 mM NaCl) treatment. Roots and shoots were collected at 0, 2, 6, 12, and 24 h after treatment with 0.4 mM NH4NO3. Whole plantlets were collected at 0, 1, 3, 6, 9, 12, and 24 h after treatment with 100 mM NaCl. Each treatment was conducted using three independent biological replicates and samples were collected from three plants for each treatment at each replication. All plant samples were immediately collected and frozen in liquid nitrogen prior to storing at −80°C for further RNA isolation.
To understand the expression pattern of TaCLC genes under short-term stress of different environment conditions, we selected one gene from each cluster of the TaCLC gene family. In total, seven genes were screened to validate expression levels. Specific fluorescence quantitative primers (Supplementary Table S3) were designed using Primer 5 software (http://www.premierbiosoft.com/index.html). Total RNA was extracted from different treatment groups using TransZOL (TransGen Biotech, Beijing, China) according to the manufacturer’s instructions. Then, cDNA was synthesized using PrimeScript™ RT reagent Kit with gDNA Eraser (Takara, Dalian, China). Reverse transcription cDNA was used as template for amplification with Hieff UNICON® qPCR SYBR Green Master Mix (YEASEN Biotechnology, Shanghai, China) in Quantstudio™5 (Thermo Fisher, Shanghai, China). Quantitative real-time PCR (qRT-PCR) thermocycling conditions were as follows: 95°C for 5 min, followed by 40 cycles of 95°C for 10 s and 60°C for 30 s, and a final extension at 72°C for 5 min. The expression levels of six genes (TaCLC-c2 cluster genes were removed because they were not expressed and the relative expression cannot be calculated) selected from the TaCLC gene family under different stress conditions were calculated using the 2−ΔΔct method. The wheat β-actin gene was used as an internal reference control. The average of three independent biological replicates was used for all data analysis.
Yeast mutant strain YJR040w (Δgef1; MATa; his3Δ1; leu2Δ0; met15Δ0; ura3Δ0; YJR040w: kanMX4) lacks the only CLC family protein—GEF1—in Saccharomyces Cerevisiae and is sensitive to low nitrogen medium. To further illustrate the function of TaCLC genes, we used the EUROSCARF (http://www.euroscarf.de/index.php?name=News) yeast mutant YJR040w that heterologously expressed the TaCLCs. The primer sequences of TaCLC-a-6AS-1, TaCLC-c1-3AS, and TaCLC-e-3AL used for gene amplification are listed in Supplementary Table S3. The selected TaCLCs gene was cloned into the yeast expression vector p416 by ClonExpress® II One Step Cloning Kit (Vazyme Biotech Co., Ltd., Nanjing, China). The constructed recombinant plasmid was then transformed into YJR040w using the lithium acetate transformation method and uniformly plated on a SD/-Ura Broth (Coolaber Technology Co., Ltd., Beijing, China) solid plate. The monoclonal was selected and verified by PCR with p416-F/p416-R (Supplementary Table S3). The monoclonal containing the target band was transferred to liquid SD/-Ura medium and cultured to OD600 = 0.6. These initial yeast cultures were used to prepare a series of diluents (10−1). From each gradient, 5 μl samples of each diluted culture were plated into YTD medium (1% yeast extract/2% tryptone/2% dextrose), YTD medium supplemented with 1 M KCl, 1 M NaCl, or 1 M KNO3, respectively. The plates were incubated at 30°C for 3–5 days and photographed.
We used the voltage-gated chloride channel protein conserved domain PF00654 as a search sequence in conjunction with a wheat genome database to perform alignment and to remove incomplete conserved domains. A total of 23 non-redundant TaCLC candidate gene sequences were identified and named based on the orthologous relationships of the rice family genes (Table 1). Information about the chromosome on which the gene was located was indicated by chromosomal arm symbols on the gene/protein name. When multiple gene sequences of the wheat TaCLC family members formed the same cluster as a certain gene as that seen in rice, a number was added after the gene name to distinguish these two genes, such as TaCLC-c1-3DS-1 and TaCLC-c1-3DS-2.
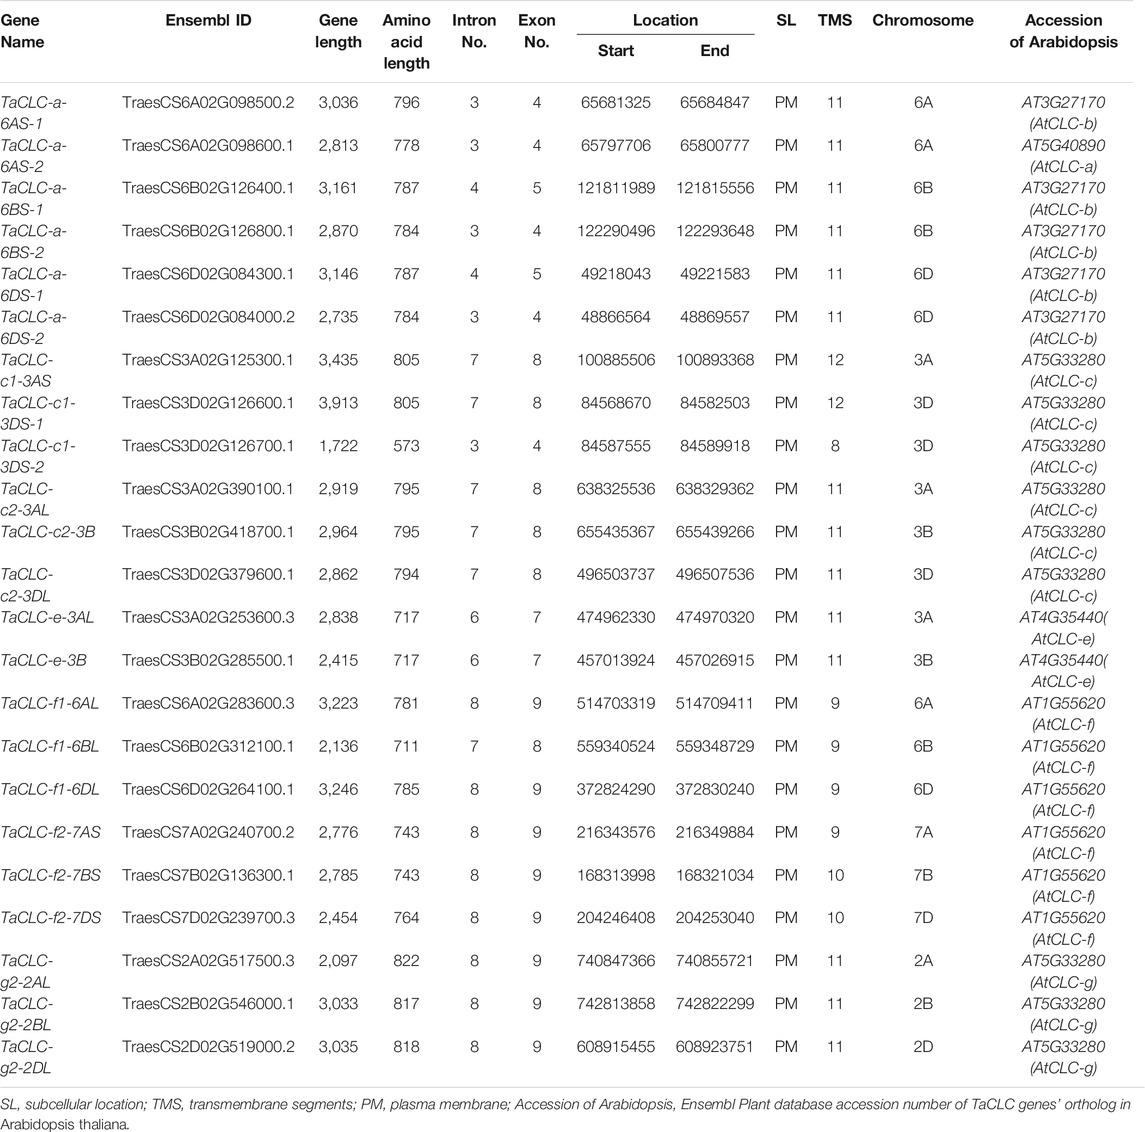
TABLE 1. Main information of 23 wheat TaCLC genes.
There were five TaCLC family members, all of which had homologous genes on the A, B, and D genomes including TaCLC-a, -c2, -f1, -f2, and -g2. However, TaCLC-c1 cluster and TaCLC-e cluster members contained only two homologous sequences. Comparatively, the TaCLC-c1 cluster member had one gene on the A genome and two genes on the D genome. The amino acid length of the TaCLC proteins ranged from 573 aa (TaCLC-g2-2AL) to 822 aa (TaCLC-c1-3DS-2). TaCLC proteins contained 8–12 transmembrane regions, of which 14 TaCLC proteins had 11 transmembrane regions and one TaCLC proteins (TaCLC-c1-3DS) had the least transmembrane regions with 8. The results of the visualized protein topology diagram are shown in Supplementary Figure S1.
In this study, the CLC family protein sequences of 23 Triticum aestivum (TaCLC), 7 Arabidopsis thaliana (AtCLC), 8 Oryza sativa (OsCLC), and 8 Glycine max (GmCLC) were aligned to construct a phylogenetic tree. This was performed using the neighbor-joining method with 1,000 bootstrap replication (Figure 1). According to the clustering criteria of rice and Arabidopsis, wheat TaCLC proteins were divided into seven clusters including TaCLC -a, -c1, -c2, -e, -f1, -f2 and -g2. Among these, the cluster -a was the largest group and contained six genes; comparatively, cluster -e was the smallest and only contained two members. The remaining five clusters all contained only three genes.
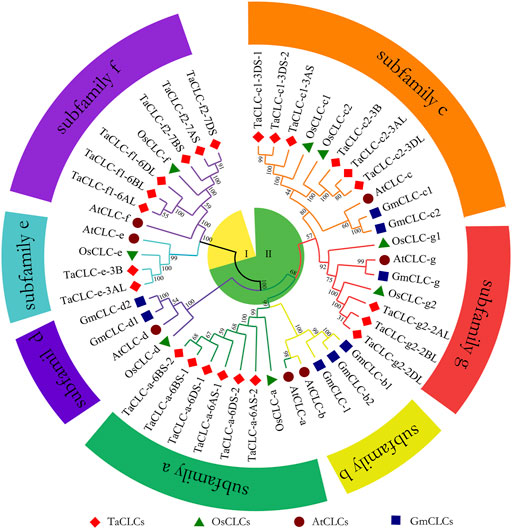
FIGURE 1. The phylogenetic tree of the CLC family of wheat, rice, soybean and Arabidopsis. The proteins belonging to each of four species are represented by different shapes and colors. The TaCLC family proteins were divided into seven subfamilies (-a, -b, -c, -d, -e, -f, and -g) and two subclasses (I and II), which are indicated with different shapes and colors of lines. The CLC proteins loci of wheat, rice, soybean, and Arabidopsis are listed in Supplementary Table S1. Ta, Triticum aestivum; Os, Oryza sativa; Gm, Glycine max; At, Arabidopsis thaliana.
Structural analysis showed that cluster -a, cluster -c1, cluster -c2, and cluster -g2 all contained typical conserved regions GxGIPE (I), GKxGPxxH (II), and PxxGxLF (III). Cluster -e and cluster -f1/-f2 did not have this typical structure (Supplementary Figure S2). These results indicated that wheat TaCLC genes were divided into subclass I and subclass II according to the conserved structures of the CLC genes.
TaCLC genes were distributed on 12 chromosomes of wheat (Figure 2). The physical locations of TaCLC genes are shown in Table 1. The 23 TaCLC genes were unevenly distributed on chromosomes, of which 3A, 3D, 6A, 6B, and 6D chromosomes had three gene members. The distribution of the TaCLC genes in the A (8), B (7) and D (8) subgenomes was relatively balanced. This was consistent with the fact that nearly half of the family members have three homologous genes.
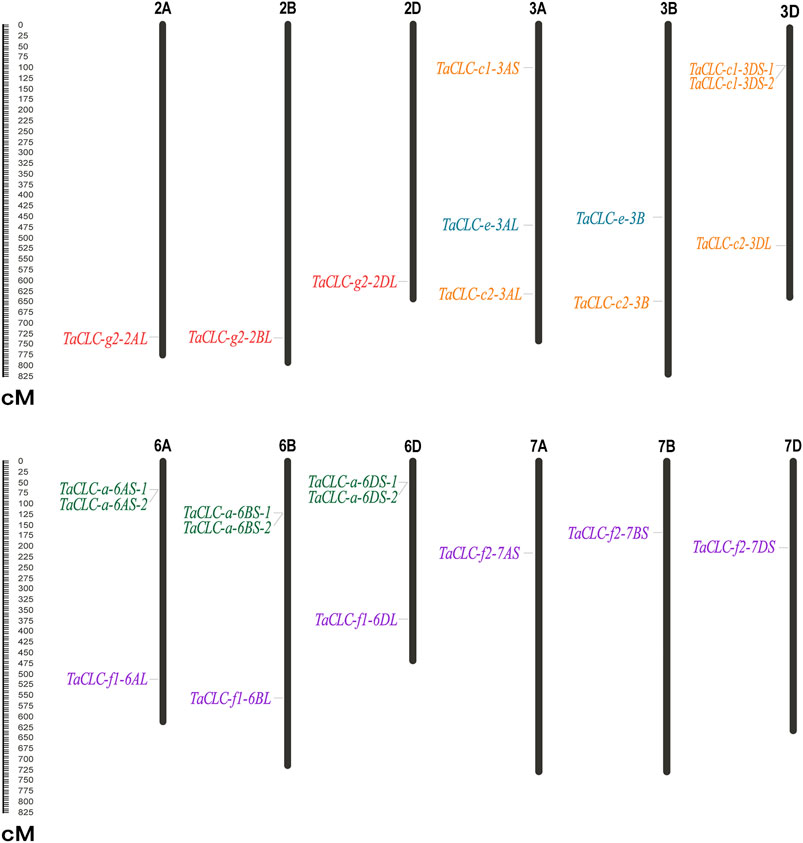
FIGURE 2. Distribution of TaCLC genes on chromosomes. The names of each chromosome are shown above. The gene names are indicated on the left and the starting positions are on the right side of the chromosomes. The TaCLC genes in each subfamily are specified by the same color. The chromosome lengths are shown in Mb (Millions of bases).
There were tandem repeat events in the cluster -a and cluster -c1, and they appeared on chromosomes in the form of tandem gene clusters. For example, TaCLC-a-6AS-1 and TaCLC-a-6AS-2, TaCLC-a-6BS-1 and TaCLC-a-6BS-2, TaCLC-a-6DS-1 and TaCLC-a-6DS-2, and TaCLC-c1-3DS-1 and TaCLC-a-3DS-2 all formed different tandem gene clusters on chromosomes 6A, 6B, 6D, and 3D, respectively. This may also be the reason the number of TaCLC members was more than that of other species.
The results of intraspecies collinearity analysis showed that the 23 wheat TaCLC genes constituted 15 pairs of collinear genes (Figure 3). Among them, four genes including TaCLC-a-6AS-2, TaCLC-a-6BS-2, TaCLC-a-6DS-2, and TaCLC-c1-6DS-2 had no collinearity with other TaCLC family genes and had tandem repeats. There was no collinearity between homologous genes TaCLC-f1-6BL and TaCLC-f1-6DL, between TaCLC-a-6BS-1 and TaCLC-a-6DS-1, and no gene of cluster -c1 on the 3B chromosome. This also indicated that homologous fragment loss occurred simultaneously during evolution of the genes.
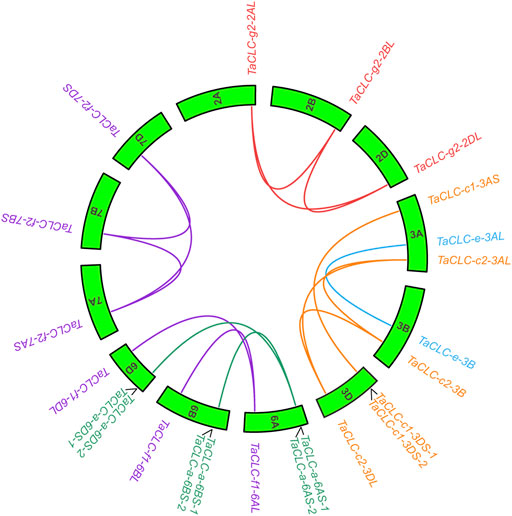
FIGURE 3. Collinearity analysis of TaCLC genes. TaCLC genes in five subfamilies (-a, -c, -e, -f, and -g) are represented by different colors of lines. Wheat chromosomes are represented by green boxes with chromosome names inside.
The results of collinearity analysis among species showed that TaCLC genes had collinearity with genes in genome of Arabidopsis thaliana, Oryza sativa L. and Triticum dicoccoides (Figure 4; Supplementary Table S4). The number of collinear gene pairs was different between species. Only two TaCLC genes between the genome of Triticum aestivum L. and Arabidopsis thaliana had collinearity, namely TaCLC-f2-7BS and TaCLC-f2-7DS (Figure 4A). The number of collinearity gene pairs in Triticum aestivum L. and Oryza sativa L. was 13, and the collinearity genes were mainly cluster -c2 and subfamily -e, -f, and -g (Figure 4B). Triticum aestivum L. and Triticum dicoccoides had 35 collinear gene pairs, which was the largest number (Figure 4C). Among them, 19 genes in TaCLC had collinearity with Triticum dicoccoides genes. There were 7, 6 and 6 TaCLC genes in the three subgenomes of A, B, and D of wheat, respectively, which had a collinearity relationship with the Triticum dicoccoides genes. This illustrated that the distribution of these 19 genes in the genome was uniform, and they were in a relatively conservative state during the evolution process from Triticum dicoccoides to Triticum aestivum L. Both TaCLC-f2-7BS and TaCLC-f2-7DS existed in the collinear gene pairs between Triticum aestivum L. and Arabidopsis thaliana, Oryza sativa L. and Triticum dicoccoides, indicating that these two genes may be ubiquitous in monocotyledons and dicotyledons. They formed before species differentiation and evolved for a longer time.
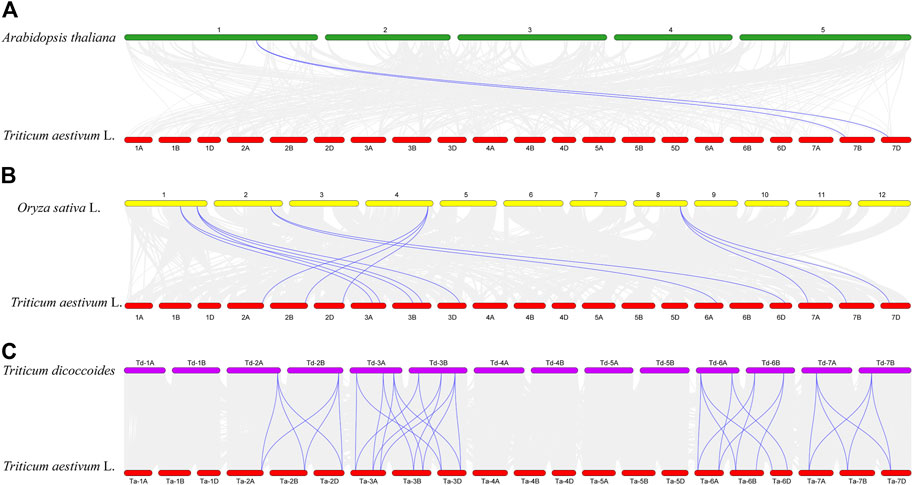
FIGURE 4. Collinearity analysis of TaCLC genes between Triticum aestivum L. and Arabidopsis thaliana (A), Oryza sativa L. (B), and Triticum dicoccoides (C). The chromosomes of wheat, Arabidopsis, rice, and emmer are expressed in red, green, yellow and purple, respectively. The gray line represents all the collinearity gene pairs between the two species, and the blue bright line represents the collinearity gene pair between the TaCLC genes of wheat and the corresponding species. The names of each chromosome are shown above and below.
TBtools software was used to compare the CDS sequences of 23 TaCLCs with their corresponding genome sequences. A visual structure map of the TaCLC genes was then obtained (Figure 5A). TaCLC genes contained 3–8 introns and 4–9 exons. The introns and exons of TaCLC-a-6AS-1, TaCLC-a-6AS-2, TaCLC-a-6BS-2, TaCLC-a-6DS-2, and TaCLC-c1-3DS-2 had the smallest number among all identified TaCLC genes with 3 introns and 4 exons. TaCLC-f1-6AL, TaCLC-f1-6DL, TaCLC-f2-7AS, TaCLC-f2-7BS, TaCLC-f2-7DS, TaCLC-g2-2AL, TaCLC-g2-2BL, and TaCLC-g2-2DL had the largest number, with 8 introns and 9 exons. Exon and intron number among the same cluster of homologous genes also varied. For example, TaCLC-f1-6AL contained 8 introns and 9 exons, whereas TaCLC-f1-6BL contained 7 introns and 8 exons.
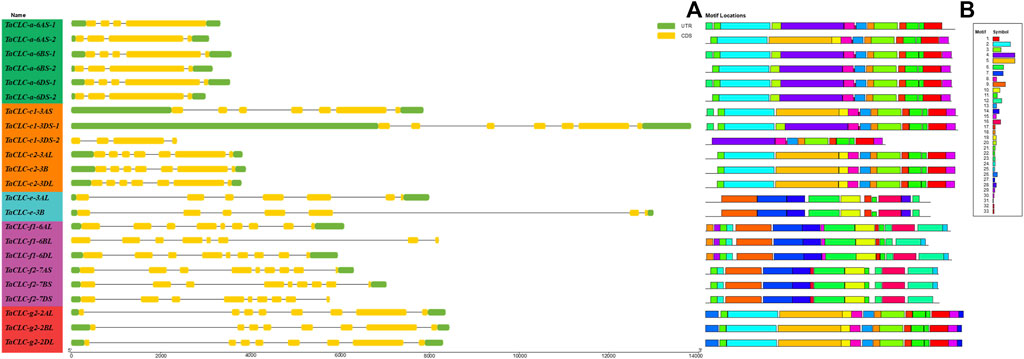
FIGURE 5. Gene structure and conservation motifs of TaCLC gene. (A) Gene structure. TaCLC genes are displayed in the order based on phylogenetic analysis of their proteins. Introns, exons and noncoding regions are represented with black lines, yellow boxes and green boxes, respectively. (B) Conserved motifs of TaCLC proteins. Thirty three motifs were identified and are marked with different colors.
Using online tools to analyze conservative protein motifs, the motif structure of the same cluster of homologous genes was determined to be basically similar (Figure 5B). These 33 motifs were evenly distributed in 7 clusters, and the number of motifs in each cluster was also similar (Supplementary Table S5). The conserved motifs of TaCLC proteins were divided into two categories. The relatively conserved motifs in cluster -a and cluster -c1, -c2, and -g2 were different from those in cluster -e and cluster -f1 and -f2, indicating that the conserved motifs of the whole TaCLC gene family could be divided into two cases.
The expression patterns of TaCLC genes in wheat tissues (roots, stems, leaves, spikes, and grains) at different developmental stages were analyzed using available wheat RNA-seq databases (Figure 6). The developmental stages were as follows: z10 (seedling), z13 (three leaves), z23 (three tillers), z30 (spike at 1 cm), z32 (two nodes), z39 (meiosis), z65 (anthesis), z71 (2 DAA), z75 (14 DAA) and z85 (30 DAA). Of the 23 genes, the expression data on 21 genes were obtained from RNA-seq databases. The only missing genes were TaCLC-c1-3DS-2 and TaCLC-c2-3DL. TaCLC-c2-3AL, TaCLC-c2-3B, TaCLC-a-6BS-1, TaCLC-a-6DS-1, and TaCLC-f1-6BL had low expression level in all detected periods and tissues. This was especially true for the z75 (14 DAA) period, which had very low gene expression. The expression levels of TaCLC-c1-3AS in roots of z10 (seedling stage), z13 (three leaves stage), z39 (meiosis stage), and leaves of z71 (2 DAA stage), as well as TaCLC-c1-3DS-1 in leaves of z13 (three-leaves stage) were all higher in all examined TaCLC genes.
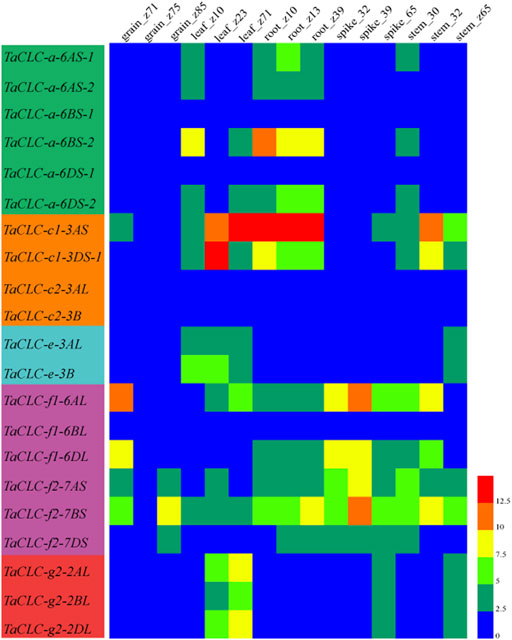
FIGURE 6. Heat map of TaCLC genes expressed at different developmental stages in wheat tissues. The values were obtained from the RNA-seq data of Chinese spring wheat in different tissues and periods provided by WheatExp database (Pearce et al., 2015). The values of 0–12.5 represent the lowest to the highest expression levels of the detected genes.
TaCLC-a-6BS-2 had the highest expression level in cluster -a, while all the genes of cluster -c2 were not expressed. The expression level of TaCLC-c1-3AS was higher than that of TaCLC-c1-3DS-1 during all the stages except for the leaves of z23 (three tillers) in cluster -c1. In cluster -e, the expression levels of TaCLC-e-3AL and TaCLC-e-3B were similar in all stages and tissues except in leaves of z10 (seedling) and z13 (three leaves). Among the three cluster -f1 genes, the expression level of TaCLC-f1-6AL was the highest and expressed in all tissues at each stage, while the expression level of TaCLC-f2-7BS was the highest among the three genes of cluster -f2. In cluster -g2, the expression levels of TaCLC-g2-2AL and TaCLC-g2-2DL genes in leaves of z23 (three tillers) and z71 (2 DAA) stages were higher than those of TaCLC-g2-2BL.
According to the predictive analysis of gene expression heat map, we selected TaCLC-a-6AS-1, TaCLC-c1-3AS, TaCLC-e-3AL, TaCLC-f1-6AL, TaCLC-f2-7BS, TaCLC-g2-2DL, and TaCLC-c2-3AL from each cluster to analyze the expression patterns under low nitrogen stress or salt stress using qRT-PCR. The gene expression of this family of genes was determined to be up-regulated under conditions of low nitrogen stress or salt stress except for TaCLC-c2-3AL (Figure 7). This finding was consistent with the data from the wheat RNA-seq database that the genes of cluster -c2 were not expressed across all stages.
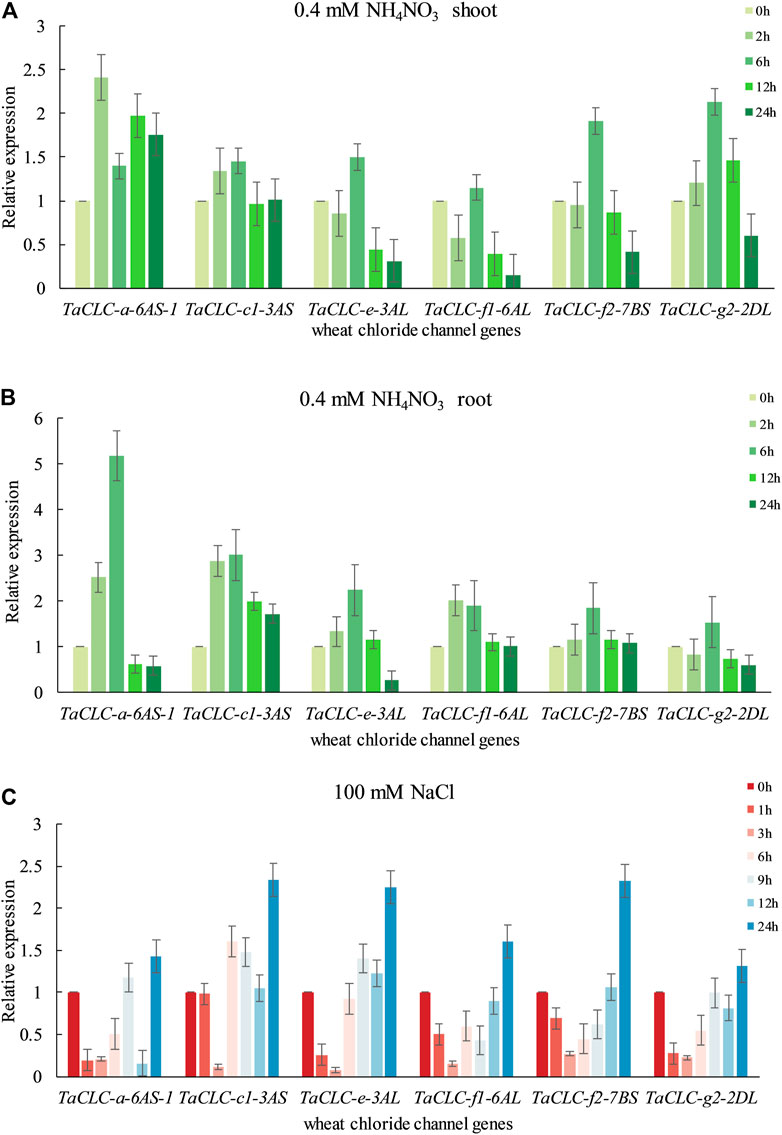
FIGURE 7. Quantitative real-time PCR validation of TaCLC genes in wheat seedlings under different stresses. (A) Expression of TaCLC genes in the wheat shoot tissue after 0.4 mM NH4NO3 treatment for 0, 2, 6, 12 and 24 h. (B) Expression of TaCLC genes in the wheat root after 0.4 mM NH4NO3 treatment for 0, 2, 6, 12 and 24 h. (C) Expression of TaCLC genes in wheat seedlings after 100 mM NaCl treatment for 0, 1, 3, 6, 9, 12 and 24 h.
The expression patterns of different genes in different parts were also diverse under low nitrogen stress (Figures 7A,B). Among them, the expression of the TaCLC-a-6AS-1 gene was at its highest level after 2 h in the shoot and at its highest level at 6 h in the root tissues when compared with the untreated tissues. Under conditions of low nitrogen stress, expression patterns in the shoot tissues were mainly divided into three types (Figure 7A). The expression levels of the other five genes were the highest after 6 h of low nitrogen stress, except for the TaCLC-a-6AS-1 gene. The expression patterns of TaCLC-e-3AL, TaCLC-f1-6AL, and TaCLC-f2-7BS genes were all down-regulated and then up-regulated. Comparatively, the expression patterns of the TaCLC-c1-3AL and TaCLC-g2-2AL genes were slowly up-regulated and then down-regulated. The expression pattern of the TaCLC-a-6AS-1 gene was completely different from that of the other five genes, indicating that TaCLC-a-6AS-1 belonged to a gene type that was stress-induced and involved rapid up-regulation. Notably, its expression level remained higher than when without stress. In the root parts and under conditions of low nitrogen stress, the expression patterns of the other five genes were first up-regulated and then down-regulated. This occurred across all genes except for the TaCLC-g2-2DL gene. The expression of TaCLC-a-6AS-1, TaCLC-c1-3AS, TaCLC-e-3AL, and TaCLC-f2-7BS all reached their highest respective levels at 6 h after low nitrogen stress treatment (Figure 7B). Only TaCLC-f1-6AL reached its highest expression level at 2 h; the expression pattern of the TaCLC-g2-2DL gene was first down-regulated, up-regulated, and finally down-regulated.
As shown in Figure 7C, all six genes reached their highest respective expression levels after 24 h salt stress treatment. The relative expression levels of TaCLC-c1-3AS, TaCLC-e-3AL, and TaCLC-f2-7BS were all higher than those of the other genes. The other five genes showed a down-regulated expression pattern under transient salt stress, and began to show an upward tendency at approximately 6 h treatment, except for the TaCLC-c1-3AS gene. Three genes—TaCLC-a-6AS-1, TaCLC-e-3AL, and TaCLC-g2-2DL—were all down-regulated, and finally up-regulated across 6–24 h. The TaCLC-f1-6AL and TaCLC-f2-7BS genes were both down-regulated to their lowest levels at 3 h and then up-regulated to their highest level at 24 h. The expression of TaCLC-c1-3AS did not change much before 1 h, and reached its lowest level at 3 h. After a brief up-regulation from 3 to 6 h, its expression began to be down-regulated from 6 to 12 h. Its expression was finally up-regulated to its highest level from 12 to 24 h.
The budding yeast S. cerevisiae has been shown to be an excellent model for studying ion transport properties and physiological function of ion homeostasis (Xu et al., 2013). The existence of mutant strains lacking their own transport systems has provided an efficient tool for the molecular study of transporters from higher eukaryotes upon their expression in yeast cells (Xu et al., 2008). In S. cerevisiae, the GEF1 gene encodes a single putative CLC chloride channel/transporter. The corresponding mutant strain—Δgef1—lacks GEF1 gene and is sensitive to extracellular cations (Lv et al., 2009). Studies have shown that the AtCLC-c gene compensates for the inhibited growth of Δgef1 deletion mutant yeast cells on YTD medium containing high concentrations of either NaCl or KCl (Lv et al., 2009). The growth of Δgef1 cells is not significantly different from that of wild type cells, indicating that the toxicity of these salts on the growth of Δgef1 cells is more related to the properties of anions than the properties of cations (Lv et al., 2009). In this study, we investigated the function of TaCLC-a-6AS-1, TaCLC-c1-3AS, and TaCLC-e-3AL using the yeast strain YJR040w (Δgef1). The AtCLC-c-p416 recombinant plasmid vector was transferred into the yeast strain YJR040w and used as a positive control, while the p416 vector was transferred into the yeast strain YJR040w and used as a negative control. The results illustrated that the three genes TaCLC-a-6AS-1, TaCLC-c1-3AS, and TaCLC-e-3AL also compensated for the inhibitory effects of the GEF1 deletion mutant yeast YJR040w cells on the growth of YTD medium containing either 1 M NaCl or 1 M KCl (Figure 8). All the test transgenic CLC genes partially restored the growth function of mutant yeast cells YJR040w on YTD medium containing 1 M KNO3, indicating that TaCLC-a-6AS-1, TaCLC-c1-3AS, and TaCLC-e-3AL in wheat and AtCLC-c in Arabidopsis had certain NO3− transport ability. These results showed that the three selected TaCLC genes compensated for the fact that the GEF1 mutant YJR040w blocks transport of Cl− or NO3− after the deletion of the CLC genes. The proteins encoded by these three genes of TaCLC-a-6AS-1, TaCLC-c1-3AS, and TaCLC-e-3AL exhibited anion transport activity of Cl− or NO3−.
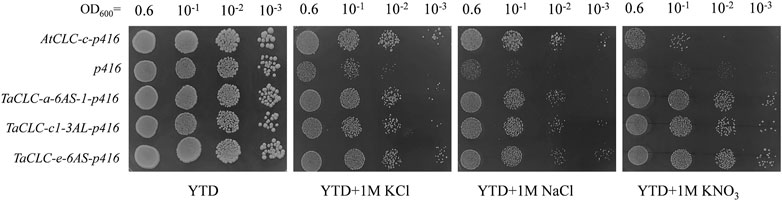
FIGURE 8. Yeast Δgef1 mutant complementation experiment. Yeast transformed with empty vector (p416) was used as a negative control and AtCLC-c was used as a positive control. The tested YTD (1% yeast extract/2% tryptone/2% dextrose) media supplemented with different concentrations of compounds (1 M KCl/1 M NaCl/1 M KNO3) are indicated under each panel. Serial dilutions (10−1) of yeast culture were plated.
The main nitrogen sources for plants are either nitrate nitrogen or ammonium nitrogen. Under natural field conditions, the content of nitrate nitrogen in soil is much higher than that of ammonium nitrogen. Therefore, understanding the efficient absorption mechanism(s) of nitrate nitrogen in crops would provide a theoretical basis for improving crop absorption—potentially by using biotechnological approaches (Meng et al., 2019). Currently, there remains little information on the CLC gene family in plants, with information relegated to only some species like Arabidopsis thaliana, Glycine max, Oraza sativa, and Zea mays (Diedhiou and Golldack, 2006; Lv et al., 2009; Wang et al., 2015; Wei et al., 2019). For wheat, there remains no previous work regarding a genome-wide identification and analysis of wheat TaCLC family genes. With the successful completion of genome sequence of wheat, it is now possible to identify members of the TaCLC gene family at the whole genome level (Appels et al., 2018). According to the homologous relationship of CLC genes in different species, a total of 23 TaCLC genes in seven clusters were identified using the wheat genome database. Their homologous relationships, gene structure, chromosomal localization, and expression pattern were subsequently analyzed. These results will lay the foundation for the functional study of TaCLC genes and provide a theoretical reference for understanding nitrate transport in wheat.
Across species, the name of the CLC protein family remains confusing because different researchers have updated the data at different stages. For example, in addition to ZmCLC1, ZmCLC2, and ZmCLC3 genes in maize, there are also ZmCLC-a, -b, -c, -d and other genes (Yu et al., 2017). Moreover, the rice OsCLC genes used in this study were originally named OsCLC 1–7. After comparing, we corrected the name to OsCLC-a, OsCLC-c1, and other more consistent gene names (Supplementary Table S1). In this study the TaCLC genes were named according to the Arabidopsis classification criteria ( -a, -b, -c, -d, -e, -f, -g). During the structural analysis of the TaCLC protein, we found that the TaCLC-a/-c1/-c2/-g2 contained a common conserved domain that was also found in other species. The x residue in the conserved region (I) of the TaCLC-a cluster was proline, while in the TaCLC-c1/-c2/-g2 it was serine. Therefore, we speculated that the function of the TaCLC-a cluster of genes was similar to that of the CLC-a cluster of genes in other species. Moreover, NO3− was preferentially transported, which may indicate the gene’s role as a NO3−/H+ exchanger. The TaCLC-c1/-c2/-g2 cluster genes have a higher affinity for Cl− and preferentially transport Cl− (Nedelyaeva et al., 2019). This hypothesis is also consistent with the up-regulation of the TaCLC-a-6AS-1 gene in our qRT-PCR results.
In plants, the functional research of CLC genes has mainly focused on the physiological and molecular regulatory functions of either Cl− or NO3− absorption, transportation, and chloride (salt) tolerance (Li et al., 2006; Nakamura et al., 2006; Wei et al., 2013; Wong et al., 2013; Liao et al., 2018; Nedelyaeva et al., 2018; Nedelyaeva et al., 2019). Therefore, genetic research into the CLC-a/-c cluster is more extensive. In Arabidopsis, studies have found that AtCLC-e and AtCLC-a also have interconnected transporters in the nitrate assimilation pathway (Monachello et al., 2009). In addition, AtCLC-a plays a different role in the regulation of guard cell expansion in that AtCLC-a promotes anion accumulation during light-induced guard cell expansion and stomata opening (Wege et al., 2014). The N-terminus of AtCLC-a is phosphorylated by AtSnRK 2.6 (AtOST1, At4g33950), which mediates stoma closure by excluding anions (Wege et al., 2014). AtPP2A-C5 (At1g69960) interacts with AtCLC family genes, and AtPP2A-5C overexpression in plants increases the activity of AtCLC-c. This increases the ability of Cl− to enter into vacuoles and improves salt tolerance of plants (Hu et al., 2017). Based on the hypothesis of homologous sequence alignment, it was speculated that the TaSnRK 2.6 (TaOST1, TraesCS5D02G081700) and TaCLC-a cluster of genes, as well as the TaPP2A-5C (TraesCS6D02G1714000) and TaCLCs should be related.
Among plants, only three PtCLC genes have been identified in Populus trichocarpa (Yu et al., 2017), and 22 GhCLC genes in upland cotton (Gossypium hirsutum L.) (Liu X. et al., 2020). In most cases, the number of CLC genes identified in other plants is 5–7, while the number of TaCLC genes identified in wheat is up to 23 genes. The physical location and collinearity analysis of the gene on its corresponding chromosome indicated that there was a tandem repeat in the evolution of wheat TaCLC genes, which might be the reason why there are more TaCLC genes in wheat than other species. In this study, the TaCLC-b/-d subfamily genes were not found in the wheat genome, indicating that the fragment and gene loss of the homologous gene in this family may have simultaneously occurred. It may also be the artificial deletion caused by the incompleteness of the conserved domain in the previous analysis of 34 CLC genes annotated in the Emsembl Plant database. For example, the CD-search results of proteins encoded by the AtCLC-b and AtCLC-d genes in NCBI did not have a complete voltage gated CLC domain (PF00654), so we removed TaCLC-b/-d in the identification of the wheat TaCLC gene family. At the same time, we also named the 11 removed genes which had incomplete domains according to the phylogenetic tree (Supplementary Figure S3; Supplementary Table S6). In the CLC genes identified in both Camellia sinensis and Nicotiana tabacum, the number of motifs used was 20 and 24, respectively (Zhang et al., 2018; Xing et al., 2020). According to the HMM logo in the Pfam database, the motifs number of TaCLCs was determined to be 33 and the structure type was similar to the motif’s position structural type of the CLC which can be divided into two types. In addition, two different motif position structure types were also found in tobacco, which indicated that the functions of the CLC genes have become diversified. RNA-seq database analysis showed that the function and expression of each gene were different. Notably, even homologous genes played different functions at different development stages, such as TaCLC-a-6AS-1, TaCLC-a-6BS-1, and TaCLC-a-6DS-1. It seems that evolutionary pressures can extend the members of the gene family (Abdullah et al., 2021; Musavizadeh et al., 2021). Moreover, mutations in coding sites and promoter regions can affect the function of members of the gene family (Faraji et al., 2021).
To analyze the expression patterns of the TaCLC gene family under low nitrogen stress or salt stress, seven genes from each cluster of the TaCLC gene family were selected for fluorescence qRT-PCR. The results showed that the family genes were up-regulated under short-term low nitrogen stress or salt stress. This was true except for the TaCLC-c2 cluster genes, which basically had no expression across the various periods of stress. The expression pattern of the CLC gene family in most species has been focused on across different tissue types as well as during long-term abiotic stress (Lv et al., 2009; Jossier et al., 2010; Wei et al., 2015; Zhang et al., 2018; Liu X. et al., 2020). However, the expression patterns of TaCLC at each time point were different from those of other species. For instance, AtCLCa-d had a relatively stable expression abundance at all developmental stage. The expression level of AtCLC-e was equivalent to that of AtCLC-f, but was significantly lower than that of subclass I genes (Wei et al., 2015). In tobacco, all expressed NtCLC genes had low expression levels in the roots. After 7 days of salt stress (300 mM NaCl), the expression levels of multiple NtCLC genes were all significantly up-regulated (Zhang et al., 2018). In pomegranate (Punica granatum), the expression level of the PgCLC genes under salt stress was high in leaves and low in roots. Moreover, PgCLC genes have been shown to affect the accumulation of Cl−, SO42−, and NO3− in pomegranate tissues under salt stress (Liu C. et al., 2020). Our results showed that all TaCLC genes were expressed under low nitrogen stress conditions over the short term. For low nitrogen stress, the response of the TaCLC-a-6AS-1 gene revealed it had the highest expression level. The relative expression levels of the TaCLC-c1-3AS, TaCLC-e-3AL, and TaCLC-g2-2DL genes were all higher under salt stress. These results were consistent with the characteristics that cluster -a had NO3− transport capacity and clusters -c1/-g2 had Cl− transport capacity in the CLC gene family. Based on the results of qRT-PCR analysis, we speculated that TaCLC genes (except the genes of TaCLC-c2 cluster) could respond to anion deficiency stresses.
The budding yeast, S. cerevisiae allows for large-scale, genome-wide analyses in a fast and economically efficient manner. Work with S. cerevisiae allows for the discovery and/or characterization of many aspects of ion transporter function (Locascio et al., 2019). Studies have shown that GEF1, as a chloride channel gene, maintains the charge balance in yeast cells. Through its acidic interior, the cation can be localized in either the internal organs or vacuoles of the cell, thus playing a role in cation detoxification (Gaxiola et al., 1998; Li et al., 2015; Nagatsuka et al., 2017). The mutant yeast Δgef1 lacks the chloride ion channel gene and is blocked when transporting Cl− in the intracellular vesicles (vacuoles or Golgi apparatus) of yeast cells (Hechenberger et al., 1996). It also has hypersensitivity to several extracellular cations. At present, Arabidopsis thaliana, Glycine max, Oryza sativa L., and Suaeda altissima (L.) have been studied using yeast mutants (Nakamura et al., 2006; Lv et al., 2009; Nedelyaeva et al., 2019; Wei et al., 2019). In this study, various chlorides, sulfates, and nitrates were respectively added to SD, SR, YPEG, YPG, YPD, or YTD media to determine whether TaCLC genes inhibit the sensitivity of yeast mutant cells to metal cations and to determine their anion transport function. In these experiments, we found that the growth of Δgef1 yeast cells with YTD medium as the culture substrate was most suitable for YJR040w mutation. This stood in contrast to using SD, SR, YPEG, YPG, or YPD media as the culture substrate.
Previous studies showed that AtCLC-c gene had the ability to transport Cl− (Lv et al., 2009). In our study, we found that when transformed one of the genes TaCLC-a-6AS-1, TaCLC-c1-3AS, and TaCLC-e-3AL, transgenic yeast mutant strains had a strong ability to transport Cl− compared with control yeast strain, albeit they did not reach the tolerance of AtCLC-c gene transformation (Figure 8). It indicated that a large number of TaCLC genes may simultaneously play roles in the transport of anions such as Cl− or NO3−. For a single TaCLC gene, its anion transport capacity was not very strong. In addition, AtCLC-c gene-transformed yeast mutant strains have not been studied in a medium containing KNO3. In our study, we found that AtCLC-c gene-transformed yeast mutant strains could transport NO3− and inhibit the cation hypersensitivity in yeast GEF1 mutants (Figure 8). There was no difference in the growth of TaCLC-a-6AS-1, TaCLC-c1-3AS, and TaCLC-e-3AL in YTD medium containing 1 M KNO3, and the three genes had similar NO3− transport ability without exogenous Cl− interference. According to the regularity of the conserved motifs of the CLC and the analysis of the TaCLC protein sequences, there may be differences in preferential transport ability of NO3− or Cl− among TaCLC-a-6AS-1, TaCLC-c1-3AS, and TaCLC-e-3AL in the case of exogenous Cl− interference.
In this study, a genome-wide identification of CLC genes in wheat was performed and 23 TaCLC genes were identified. The gene structure, chromosomal location, conserved motif and expression pattern of the members of the family were then analyzed. The family was divided into two main subclasses (I and II) and seven clusters (-a, -c1, -c2, -e, -f1, -f2, and -g2). The 23 TaCLC genes of the family were unevenly distributed on wheat chromosomes and some genes in the cluster had tandem duplication. TaCLC gene expression was illustrated using qRT-PCR, and the results showed that the expression pattern of this gene family was induced by low nitrogen stress or salt stress except for TaCLC-c2 which was from subfamily -c. The function of some TaCLC genes was studied using yeast mutant strains. The results of yeast mutant complementation experiments showed that TaCLC-a-6AS-1, TaCLC-c1-3AS, and TaCLC-e-3AL all had anion transport functions for NO3− or Cl− and compensated the hypersensitivity of yeast GEF1 mutants in restoring anion-sensitive phenotype. Collectively, these results provide theoretical reference for studying the response of TaCLC family genes to low nitrogen stress and the physiological functions of anion transport in wheat.
All datasets generated for this study are included in the article/Supplementary Material.
HX and XC conceived and designed the experiments. PM, YR, and HW conducted the experiments. CH performed the expression level examination of the stressed plants. PM, LZ and KZ analyzed the data. PM wrote the paper. HX revised the article. All authors read and approved the final manuscript.
This work was funded by the Henan Natural Science Foundation (202300410217) and Henan Science and Technology Research Project (202102110178).
The authors declare that the research was conducted in the absence of any commercial or financial relationships that could be construed as a potential conflict of interest.
All claims expressed in this article are solely those of the authors and do not necessarily represent those of their affiliated organizations, or those of the publisher, the editors and the reviewers. Any product that may be evaluated in this article, or claim that may be made by its manufacturer, is not guaranteed or endorsed by the publisher.
The Supplementary Material for this article can be found online at: https://www.frontiersin.org/articles/10.3389/fgene.2022.846795/full#supplementary-material
Abdullah,, , Faraji, S., Mehmood, F., Malik, H. M. T., Ahmed, I., Heidari, P., et al. (2021). The GASA Gene Family in Cacao (Theobroma cacao, Malvaceae): Genome Wide Identification and Expression Analysis. Agronomy 11 (7), 1425. doi:10.3390/agronomy11071425
Appels, R., Eversole, K., Appels, R., Eversole, K., Feuillet, C., Keller, B., et al. (2018). Shifting the Limits in Wheat Research and Breeding Using a Fully Annotated Reference Genome. Science 361 (6403), 661. doi:10.1126/science.aar7191
Chen, C., Chen, H., Zhang, Y., Thomas, H. R., Frank, M. H., He, Y., et al. (2020). TBtools: An Integrative Toolkit Developed for Interactive Analyses of Big Biological Data. Mol. Plant 13 (8), 1194–1202. doi:10.1016/j.molp.2020.06.009
Cheng, X., Liu, X., Mao, W., Zhang, X., Chen, S., Zhan, K., et al. (2018). Genome-Wide Identification and Analysis of HAK/KUP/KT Potassium Transporters Gene Family in Wheat (Triticum aestivum L.). Int. J. Mol. Sci. 19 (12), 3969. doi:10.3390/ijms19123969
De Angeli, A., Monachello, D., Ephritikhine, G., Frachisse, J. M., Thomine, S., Gambale, F., et al. (2006). The Nitrate/Proton Antiporter AtCLCa Mediates Nitrate Accumulation in Plant Vacuoles. Nature 442 (7105), 939–942. doi:10.1038/nature05013
De Angeli, A., Moran, O., Wege, S., Filleur, S., Ephritikhine, G., Thomine, S., et al. (2009). ATP Binding to the C Terminus of the Arabidopsis thaliana Nitrate/Proton Antiporter, AtCLCa, Regulates Nitrate Transport into Plant Vacuoles. J. Biol. Chem. 284 (39), 26526–26532. doi:10.1074/jbc.M109.005132
Diédhiou, C. J., and Golldack, D. (2006). Salt-Dependent Regulation of Chloride Channel Transcripts in Rice. Plant Sci. 170 (4), 793–800. doi:10.1016/j.plantsci.2005.11.014
Faraji, S., Heidari, P., Amouei, H., Filiz, E., Abdullah, P., and Poczai, P. (2021). Investigation and Computational Analysis of the Sulfotransferase (SOT) Gene Family in Potato (Solanum tuberosum): Insights into Sulfur Adjustment for Proper Development and Stimuli Responses. Plants 10 (12), 2597. doi:10.3390/plants10122597
Fecht-Bartenbach, J. v. d., Bogner, M., Krebs, M., Stierhof, Y.-D., Schumacher, K., and Ludewig, U. (2007). Function of the Anion Transporter AtCLC-d in the Trans-golgi Network. Plant J. 50 (3), 466–474. doi:10.1111/j.1365-313X.2007.03061.x
Finn, R. D., Mistry, J., Schuster-Bockler, B., Griffiths-Jones, S., Hollich, V., Lassmann, T., et al. (2006). Pfam: Clans, Web Tools and Services. Nucleic Acids Res. 34, D247–D251. doi:10.1093/nar/gkj149
Gaxiola, R. A., Yuan, D. S., Klausner, R. D., and Fink, G. R. (1998). The Yeast CLC Chloride Channel Functions in Cation Homeostasis. Proc. Natl. Acad. Sci. 95 (7), 4046–4050. doi:10.1073/pnas.95.7.4046
Harada, H., Kuromori, T., Hirayama, T., Shinozaki, K., and Leigh, R. A. (2004). Quantitative Trait Loci Analysis of Nitrate Storage in Arabidopsis Leading to an Investigation of the Contribution of the Anion Channel Gene, AtCLC-c, to Variation in Nitrate Levels. J. Exp. Bot. 55 (405), 2005–2014. doi:10.1093/jxb/erh224
Hechenberger, M., Schwappach, B., Fischer, W. N., Frommer, W. B., Jentsch, T. J., and Steinmeyer, K. (1996). A Family of Putative Chloride Channels from Arabidopsis and Functional Complementation of a Yeast Strain with a CLC Gene Disruption. J. Biol. Chem. 271 (52), 33632–33638. doi:10.1074/jbc.271.52.33632
Hu, R., Zhu, Y., Wei, J., Chen, J., Shi, H., Shen, G., et al. (2017). Overexpression of PP2A-C5 that Encodes the Catalytic Subunit 5 of Protein Phosphatase 2A in Arabidopsis Confers Better Root and Shoot Development under Salt Conditions. Plant Cell Environ. 40 (1), 150–164. doi:10.1111/pce.12837
Ijato, T., Porras‐Murillo, R., Ganz, P., Ludewig, U., and Neuhäuser, B. (2021). Concentration‐Dependent Physiological and Transcriptional Adaptations of Wheat Seedlings to Ammonium. Physiol. Plantarum 171 (3), 328–342. doi:10.1111/ppl.13113
Jentsch, T. J., Steinmeyer, K., and Schwarz, G. (1990). Primary Structure of Torpedo marmorata Chloride Channel Isolated by Expression Cloning in Xenopus Oocytes. Nature 348 (6301), 510–514. doi:10.1038/348510a0
Jossier, M., Kroniewicz, L., Dalmas, F., Le Thiec, D., Ephritikhine, G., Thomine, S., et al. (2010). The Arabidopsis Vacuolar Anion Transporter, AtCLCc, is Involved in the Regulation of Stomatal Movements and Contributes to Salt Tolerance. Plant J. 64 (4), 563–576. doi:10.1111/j.1365-313X.2010.04352.x
Ju, X.-t., and Zhang, C. (2017). Nitrogen Cycling and Environmental Impacts in upland Agricultural Soils in North China: A Review. J. Integr. Agric. 16 (12), 2848–2862. doi:10.1016/s2095-3119(17)61743-x
Kumar, S., Stecher, G., and Tamura, K. (2016). MEGA7: Molecular Evolutionary Genetics Analysis Version 7.0 for Bigger Datasets. Mol. Biol. Evol. 33 (7), 1870–1874. doi:10.1093/molbev/msw054
Li, B., Lu, M.-Q., Wang, Q.-Z., Shi, G.-Y., Liao, W., and Huang, S.-S. (2015). Raman Spectra Analysis for Single Mitochondrias after Apoptosis Process of Yeast Cells Stressed by Acetic Acid. Chin. J. Anal. Chem. 43 (5), 643–650. doi:10.1016/s1872-2040(15)60824-6
Li, T., Liao, K., Xu, X., Gao, Y., Wang, Z., Zhu, X., et al. (2017). Wheat Ammonium Transporter (AMT) Gene Family: Diversity and Possible Role in Host-Pathogen Interaction with Stem Rust. Front. Plant Sci. 8, 1. doi:10.3389/fpls.2017.01637
Li, W.-Y. F., Wong, F.-L., Tsai, S.-N., Phang, T.-H., Shao, G., and Lam, H.-M. (2006). Tonoplast-located GmCLC1 and GmNHX1 from Soybean Enhance NaCl Tolerance in Transgenic Bright Yellow (BY)-2 Cells. Plant Cell Environ. 29 (6), 1122–1137. doi:10.1111/j.1365-3040.2005.01487.x
Liao, Q., Zhou, T., Yao, J.-y., Han, Q.-f., Song, H.-x., Guan, C.-y., et al. (2018). Genome-Scale Characterization of the Vacuole Nitrate Transporter Chloride Channel (CLC) Genes and Their Transcriptional Responses to Diverse Nutrient Stresses in Allotetraploid Rapeseed. Plos One 13 (12), e0208648. doi:10.1371/journal.pone.0208648
Liu, C., Zhao, Y., Zhao, X., Dong, J., and Yuan, Z. (2020). Genome-wide Identification and Expression Analysis of the CLC Gene Family in Pomegranate (Punica granatum) Reveals its Roles in Salt Resistance. BMC Plant Biol. 20 (1), 1. doi:10.1186/s12870-020-02771-z
Liu, R., Jia, T., Cui, B., and Song, J. (2020). The Expression Patterns and Putative Function of Nitrate Transporter 2.5 in Plants. Plant Signaling Behav. 15 (12), 1815980. doi:10.1080/15592324.2020.1815980
Liu, X., Pi, B., Pu, J., Cheng, C., Fang, J., and Yu, B. (2020). Genome-Wide Analysis of Chloride Channel-Encoding Gene Family Members and Identification of CLC Genes that Respond to Cl−/salt Stress in upland Cotton. Mol. Biol. Rep. 47 (12), 9361–9371. doi:10.1007/s11033-020-06023-z
Locascio, A., Andrés-Colás, N., Mulet, J. M., and Yenush, L. (2019). Saccharomyces cerevisiae as a Tool to Investigate Plant Potassium and Sodium Transporters. Int. J. Mol. Sci. 20 (9), 2133. doi:10.3390/ijms20092133
Lurin, C., Geelen, D., Barbier-Brygoo, H., Guern, J., and Maurel, C. (1996). Cloning and Functional Expression of a Plant Voltage-dependent Chloride Channel. Plant Cell 8 (4), 701–711. doi:10.1105/tpc.8.4.701
Lv, Q.-d., Tang, R.-j., Liu, H., Gao, X.-s., Li, Y.-z., Zheng, H.-q., et al. (2009). Cloning and Molecular Analyses of the Arabidopsis thaliana Chloride Channel Gene Family. Plant Sci. 176 (5), 650–661. doi:10.1016/j.plantsci.2009.02.006
Lv, X., Zhang, Y., Hu, L., Zhang, Y., Zhang, B., Xia, H., et al. (2021). Low-Nitrogen Stress Stimulates Lateral Root Initiation and Nitrogen Assimilation in Wheat: Roles of Phytohormone Signaling. J. Plant Growth Regul. 40 (1), 436–450. doi:10.1007/s00344-020-10112-5
Marmagne, A., Vinauger-Douard, M., Monachello, D., de Longevialle, A. F., Charon, C., Allot, M., et al. (2007). Two Members of the Arabidopsis CLC (Chloride Channel) Family, AtCLCe and AtCLCf, are Associated With Thylakoid and Golgi Membranes, Respectively. J. Exp. Bot. 58 (12), 3385–3393. doi:10.1093/jxb/erm187
Meng, L., Dong, J.-x., Wang, S.-s., Song, K., Ling, A.-f., Yang, J.-g., et al. (2019). Differential Responses of Root Growth to Nutrition with Different Ammonium/nitrate Ratios Involve Auxin Distribution in Two Tobacco Cultivars. J. Integr. Agric. 18 (12), 2703–2715. doi:10.1016/s2095-3119(19)62595-5
Monachello, D., Allot, M., Oliva, S., Krapp, A., Daniel‐Vedele, F., Barbier‐Brygoo, H., et al. (2009). Two Anion Transporters AtCLCa and AtCLCe Fulfil Interconnecting but Not Redundant Roles in Nitrate Assimilation Pathways. New Phytol. 183 (1), 88–94. doi:10.1111/j.1469-8137.2009.02837.x
Moradi, H., Elzenga, T., and Lanfermeijer, F. (2015). Role of the AtCLC Genes in Regulation of Root Elongation in Arabidopsis. Iran. J. Gen. Plant Breed. 4, 1–8.
Musavizadeh, Z., Najafi-Zarrini, H., Kazemitabar, S. K., Hashemi, S. H., Faraji, S., Barcaccia, G., et al. (2021). Genome-Wide Analysis of Potassium Channel Genes in Rice: Expression of the OsAKT and OsKAT Genes Under Salt Stress. Genes 12 (5), 784. doi:10.3390/genes12050784
Nagatsuka, Y., Kiyuna, T., Kigawa, R., Sano, C., and Sugiyama, J. (2017). Prototheca Tumulicola sp. nov., a Novel Achlorophyllous, Yeast-Like Microalga Isolated from the Stone Chamber interior of the Takamatsuzuka tumulus. Mycoscience 58 (1), 53–59. doi:10.1016/j.myc.2016.09.005
Nakamura, A., Fukuda, A., Sakai, S., and Tanaka, Y. (2006). Molecular Cloning, Functional Expression and Subcellular Localization of Two Putative Vacuolar Voltage-Gated Chloride Channels in rice (Oryza sativa L.). Plant Cell Physiol. 47 (1), 32–42. doi:10.1093/pcp/pci220
Nedelyaeva, O. I., Shuvalov, A. V., and Balnokin, Y. V. (2020). Chloride Channels and Transporters of the CLC Family in Plants. Russ. J. Plant Physiol. 67 (5), 767–784. doi:10.1134/s1021443720050106
Nedelyaeva, O. I., Shuvalov, A. V., Karpichev, I. V., Beliaev, D. V., Myasoedov, N. A., Khalilova, L. A., et al. (2019). Molecular Cloning and Characterisation of SaCLCa1, a Novel Protein of the Chloride Channel (CLC) Family from the Halophyte Suaeda Altissima (L.) Pall. J. Plant Physiol. 240, 152995. doi:10.1016/j.jplph.2019.152995
Nedelyaeva, O. I., Shuvalov, A. V., Mayorova, O. V., Yurchenko, A. A., Popova, L. G., Balnokin, Y. V., et al. (2018). Cloning and Functional Analysis of SaCLCc1, a Gene Belonging to the Chloride Channel Family (CLC), from the Halophyte Suaeda altissima (L.) Pall. Dokl. Biochem. Biophys. 481 (1), 186–189. doi:10.1134/s1607672918040026
Park, E., Campbell, E. B., and MacKinnon, R. (2017). Structure of a CLC Chloride Ion Channel by Cryo-Electron Microscopy. Nature 541 (7638), 500–505. doi:10.1038/nature20812
Pearce, S., Vazquez-Gross, H., Herin, S. Y., Hane, D., Wang, Y., Gu, Y. Q., et al. (2015). WheatExp: An RNA-Seq Expression Database for Polyploid Wheat. BMC Plant Biol. 15, 1. doi:10.1186/s12870-015-0692-1
Subba, A., Tomar, S., Pareek, A., and Singla‐Pareek, S. L. (2021). The Chloride Channels: Silently Serving the Plants. Physiol. Plant. 171 (4), 688–702. doi:10.1111/ppl.13240
Um, T. Y., Lee, S., Kim, J.-K., Jang, G., and Choi, Y. D. (2018). Chloride Channel 1 Promotes Drought Tolerance in rice, Leading to Increased Grain Yield. Plant Biotechnol. Rep. 12 (4), 283–293. doi:10.1007/s11816-018-0492-9
von der Fecht-Bartenbach, J., Bogner, M., Dynowski, M., and Ludewig, U. (2010). CLC-b-Mediated NOFormula/H+ Exchange across the Tonoplast of Arabidopsis Vacuoles. Plant Cell Physiol. 51 (6), 960–968. doi:10.1093/pcp/pcq062
Wang, F., Gao, J., Tian, Z., Liu, Y., Abid, M., Jiang, D., et al. (2016). Adaptation to Rhizosphere Acidification Is a Necessary Prerequisite for Wheat (Triticum aestivum L.) Seedling Resistance to Ammonium Stress. Plant Physiol. Biochem. 108, 447–455. doi:10.1016/j.plaphy.2016.08.011
Wang, S., Su, S. Z., Wu, Y., Li, S. P., Shan, X. H., Liu, H. K., et al. (2015). Overexpression of Maize Chloride Channel Gene ZmCLC-d in Arabidopsis thaliana Improved its Stress Resistance. Biol. Plant 59 (1), 55–64. doi:10.1007/s10535-014-0468-8
Wege, S., De Angeli, A., Droillard, M.-J., Kroniewicz, L., Merlot, S., Cornu, D., et al. (2014). Phosphorylation of the Vacuolar Anion Exchanger AtCLCa is Required for the Stomatal Response to Abscisic Acid. Sci. Signal. 7 (333), 1. doi:10.1126/scisignal.2005140
Wei, P., Che, B., Shen, L., Cui, Y., Wu, S., Cheng, C., et al. (2019). Identification and Functional Characterization of the Chloride Channel Gene, GsCLC-c2 from Wild Soybean. BMC Plant Biol. 19, 1. doi:10.1186/s12870-019-1732-z
Wei, Q. J., Gu, Q. Q., Wang, N. N., Yang, C. Q., and Peng, S. A. (2015). Molecular Cloning and Characterization of the Chloride Channel Gene Family in Trifoliate Orange. Biol. Plant 59 (4), 645–653. doi:10.1007/s10535-015-0532-z
Wei, Q., Liu, Y., Zhou, G., Li, Q., Yang, C., and Peng, S.-a. (2013). Overexpression of CsCLCc, a Chloride Channel Gene from Poncirus trifoliata, Enhances Salt Tolerance in Arabidopsis. Plant Mol. Biol. Rep. 31 (6), 1548–1557. doi:10.1007/s11105-013-0592-1
White, M. M., and Miller, C. (1979). A Voltage-Gated Anion Channel from the Electric Organ of Torpedo californica. J. Biol. Chem. 254 (20), 10161–10166. doi:10.1016/s0021-9258(19)86687-5
Whiteman, S.-A., Serazetdinova, L., Jones, A. M. E., Sanders, D., Rathjen, J., Peck, S. C., et al. (2008). Identification of Novel Proteins and Phosphorylation Sites in a Tonoplast Enriched Membrane Fraction of Arabidopsis thaliana. Proteomics 8 (17), 3536–3547. doi:10.1002/pmic.200701104
Wong, T. H., Li, M. W., Yao, X. Q., and Lam, H. M. (2013). The GmCLC1 Protein from Soybean Functions as a Chloride Ion Transporter. J. Plant Physiol. 170 (1), 101–104. doi:10.1016/j.jplph.2012.08.003
Xing, A., Ma, Y., Wu, Z., Nong, S., Zhu, J., Sun, H., et al. (2020). Genome-Wide Identification and Expression Analysis of the CLC Superfamily Genes in Tea Plants (Camellia sinensis). Funct. Integr. Genom. 20 (4), 497–508. doi:10.1007/s10142-019-00725-9
Xu, H., Jiang, X., Zhan, K., Cheng, X., Chen, X., Pardo, J. M., et al. (2008). Functional Characterization of a Wheat Plasma Membrane Na+/H+ Antiporter in Yeast. Arch. Biochem. Biophys. 473 (1), 8–15. doi:10.1016/j.abb.2008.02.018
Xu, Y., Zhou, Y., Hong, S., Xia, Z., Cui, D., Guo, J., et al. (2013). Functional Characterization of a Wheat NHX Antiporter Gene TaNHX2 that Encodes a K+/H+ Exchanger. Plos One 8 (11), e78098. doi:10.1371/journal.pone.0078098
Yu, B., Liu, Z., and Wei, P. (2017). Research Progresses on Whole Genome Discovery and Function Analysis of CLC Homologous Genes in Plants Based on Salt Stress. J. Nanjing Agric. Univ. 40 (2), 187–194. doi:10.7685/jnau.201701020
Zhang, H., Jin, J., Jin, L., Li, Z., Xu, G., Wang, R., et al. (2018). Identification and Analysis of the Chloride Channel Gene Family Members in Tobacco (Nicotiana tabacum). Gene 676, 56–64. doi:10.1016/j.gene.2018.06.073
Zifarelli, G., and Pusch, M. (2010). CLC Transport Proteins in Plants. Febs Lett. 584 (10), 2122–2127. doi:10.1016/j.febslet.2009.12.042
Keywords: wheat (Triticum aestivum L.), CLC, gene family, nitrate nitrogen, functional characterization
Citation: Mao P, Run Y, Wang H, Han C, Zhang L, Zhan K, Xu H and Cheng X (2022) Genome-Wide Identification and Functional Characterization of the Chloride Channel TaCLC Gene Family in Wheat (Triticum aestivum L.). Front. Genet. 13:846795. doi: 10.3389/fgene.2022.846795
Received: 31 December 2021; Accepted: 11 February 2022;
Published: 16 March 2022.
Edited by:
Manish Kumar Pandey, International Crops Research Institute for the Semi-Arid Tropics (ICRISAT), IndiaReviewed by:
Xiaojun Nie, Northwest A&F University, ChinaCopyright © 2022 Mao, Run, Wang, Han, Zhang, Zhan, Xu and Cheng. This is an open-access article distributed under the terms of the Creative Commons Attribution License (CC BY). The use, distribution or reproduction in other forums is permitted, provided the original author(s) and the copyright owner(s) are credited and that the original publication in this journal is cited, in accordance with accepted academic practice. No use, distribution or reproduction is permitted which does not comply with these terms.
*Correspondence: Haixia Xu, aGF1eGh4QDE2My5jb20=; Xiyong Cheng, eHljNjM0QDE2My5jb20=
Disclaimer: All claims expressed in this article are solely those of the authors and do not necessarily represent those of their affiliated organizations, or those of the publisher, the editors and the reviewers. Any product that may be evaluated in this article or claim that may be made by its manufacturer is not guaranteed or endorsed by the publisher.
Research integrity at Frontiers
Learn more about the work of our research integrity team to safeguard the quality of each article we publish.