 Xiangyi Deng1†
 Fan Yang1†Lei Zhang2,3†
 Jianhao Wang1†Boxuan Liu3Wei Liang3Jiefu Tang4Yuan Xie2
 Liqun He1,5*
- 1Department of Neurosurgery, Tianjin Medical University General Hospital, Tianjin Neurological Institute, Key Laboratory of Post-Neuroinjury Neuro-Repair and Regeneration in Central Nervous System, Ministry of Education and Tianjin City, Tianjin, China
- 2Key Laboratory of Ministry of Education for Medicinal Plant Resource and Natural Pharmaceutical Chemistry, National Engineering Laboratory for Resource Developing of Endangered Chinese Crude Drugs in Northwest of China, College of Life Sciences, Shaanxi Normal University, Xi’an, China
- 3Precision Medicine Center, the Second People’s Hospital of Huaihua, Huaihua, China
- 4Trauma Center, First Affiliated Hospital of Hunan University of Medicine, Huaihua, China
- 5Department of Immunology, Genetics and Pathology, Uppsala University, Uppsala, Sweden
Endothelial cell (EC) plays critical roles in vascular physiological and pathological processes. With the development of high-throughput technologies, transcriptomics analysis of EC has increased dramatically and a large amount of informative data have been generated. The dynamic patterns of gene expression in ECs under various conditions were revealed. Unfortunately, due to the lack of bioinformatics infrastructures, reuse of these large-scale datasets is challenging for many scientists. Here, by systematic re-analyzing, integrating, and standardizing of 203 RNA sequencing samples from freshly isolated mouse ECs under 71 conditions, we constructed an integrated mouse EC gene expression omnibus (ECO). The ECO database enables one-click retrieval of endothelial expression profiles from different organs under different conditions including disease models, genetic modifications, and clinically relevant treatments in vivo. The EC expression profiles are visualized with user-friendly bar-plots. It also provides a convenient search tool for co-expressed genes. ECO facilitates endothelial research with an integrated tool and resource for transcriptome analysis. The ECO database is freely available at https://heomics.shinyapps.io/ecodb/.
Introduction
Endothelial cells (ECs) are single-layered squamous cells distributed on the inner surface of the vasculature, constructing a barrier between the vasculature and tissues and controlling the exchange of substances and fluids (Krüger-Genge et al., 2019). ECs are involved in many essential physiological functions, such as regulating vasoconstriction and vasodilation, blood coagulation, paracrine action, angiogenesis, and constitute barriers (Reglero-Real et al., 2016; Wong et al., 2017; Paone et al., 2019). Dysfunction of EC is the driving factor for many diseases, including atherosclerosis, cancer, hypertension, glomerular disease, and inflammation (Goveia et al., 2014; Li et al., 2019). Uncovering the molecular mechanism of endothelial cells in these pathological conditions is essential to understand the occurrence and treatment of diseases.
With the rapid development of high-throughput sequencing technologies in the last decades, especially the wide use of RNA sequencing, the molecular level analysis of EC has increased significantly and a variety of EC transcriptomics datasets have been accumulated in the public domain (Khan et al., 2019; Munji et al., 2019). Their raw RNAseq data generated by high-throughput sequencing are deposited in the public databases, such as Gene Expression Omnibus (GEO) (Barrett et al., 2007) and ArrayExpress (Parkinson et al., 2007), but unfortunately, it is difficult for researchers without bioinformatics skills to process these raw data and extract the desired information. In some other fields, there are already some databases that provide practical functions to greatly promote the development of this field, such as the Allen Brain Atlas (Lein et al., 2007) for neuroscience and ONCOMINE (Rhodes et al., 2004) for oncology. For EC data, the effort of integrating has been initiated, for example, EndoDB, which has made a collection of EC data (Khan et al., 2019). However, there is still a lack of database integrating all latest RNAseq data and also providing user-friendly analysis functions and visualization tools.
Here, we integrated all freshly isolated EC bulk RNA sequencing data from public sequence databases, processed them with a standardized pipeline, and constructed a user-friendly online database, ECO. It provides a one-click search tool for in vivo EC profiles for each gene in various conditions including pathological alterations, genetic modifications, and other treatment conditions, in the form of easily understandable bar-plots. Also, the database provides a search function to find genes with similar expression profiles, which may generate interesting hypothesis for future research.
Methods
Retrieval of EC RNA Sequencing Datasets
We first conducted a systematic literature search for murine in vivo EC bulk RNAseq studies in PubMed, the NCBI GEO database, and the ArrayExpress database. It resulted in 19 RNA studies for EC under various conditions. They include 71 EC conditions. Each condition has multiple replicated samples, and in total, there are 203 samples. The raw sequence data for each condition, including the raw data for its exact control group, were obtained from the NCBI Short Read Archive (SRA) or ArrayExpress database.
Data Preprocessing on Galaxy
The raw sequence data obtained from SRA and ArrayExpress were preprocessed with the Galaxy online server (Jalili et al., 2020) (https://usegalaxy.eu/, version: 20.09) using a standardized procedure for all datasets. The detailed procedure is described in the Galaxy RNA-seq analysis instruction (https://training.galaxyproject.org/training-material/topics/transcriptomics/tutorials/rna-seq-reads-to-counts/tutorial.html).
The sequence data were uploaded in two ways: for the data available in SRA, the SRA-tools (Leinonen et al., 2011) (version: 2.10.8) in Galaxy were used to upload these datasets reads in the FASTA/Q format from the NCBI; for the other datasets from ArrayExpress, the ArrayExpress FTP download links were used. The FASTQ sequence files were then aligned to the referenced mouse genome assembly (GRCm38/mm10) obtained from the UCSC Genome Browser database (Navarro Gonzalez et al., 2021) using the HISAT2 tool (Kim et al., 2015) (version: 2.1.0) on Galaxy. The gene annotation file GTF (2020, ncbiRefSeq, mm10) was also obtained from the UCSC Genome Browser database, which was consistent with the genome sequence file. The alignment bam files were then input to the featureCounts tool (Liao et al., 2014) (version: 2.0.1, with default parameters) to get the raw read counts for each genes (feature count files). In total, 203 samples were quantified and their count data were processed in R (version: 4.0.3) for downstream analysis.
Data Normalization
In order to compare the EC expression level among different samples in different conditions, all the raw count data were normalized using rpkm function in the edgeR package (version: 3.32.0). The FPKM values for each sample were calculated, and then, the average expressions and standard deviations for each of the 32 conditions (71 bars in the FPKM plot) were calculated in R. The result for each gene was visualized in bar-plot using the ggplot2 package (version: 3.3.2).
Differential Expression Gene Analysis
The gene expression raw count files were imported into the limma package (version: 3.46.0) in R, and the voom function was used to compare the gene expression between two groups (treated versus control) with the default parameters. To remove low-expression genes in each sample, the genes which were detected in only one sample were filtered out. To visualize the differential expression profiles among the 40 comparison groups, the fold changes and the standard deviations for each gene were visualized in bar-plots.
Correlation Analysis
To search for the genes with similar expression profiles with a query gene, the corr.test function from psych package (version: 2.0.12) was applied. The correlation coefficient and the p values were calculated. The sorted result was stored in a table and is available for download through our ECO database. In addition, to better illustrate the correlation result, we chose the 10 most correlated genes to the query gene and generated a heatmap with the pheatmap package (version: 1.0.12).
ECO Web Tool Construction
Our ECO database, an interactive web application, is built mainly using the R Shiny package (version: 1.6.0), as well as the other auxiliary packages including shinythemes (version: 1.2.0), ggplot2 (version: 3.3.3), and ggh4x (version: 0.1.2.1). The ECO database is available for free at https://heomics.shinyapps.io/ecodb/.
Results
Construction of ECO
In order to construct a comprehensive omnibus of mouse in vivo EC RNAseq profiles, we performed literature mining and identified 19 currently available RNA studies (Supplementary Table S1), which cover EC in a variety of pathological alterations, genetic modifications, and other stimulated conditions. In these studies, freshly isolated ECs were analyzed with RNA sequencing. In total, there are 203 samples covering 71 in vivo conditions from 10 organs. These data composite the base for ECO, and they were processed as shown in the workflow (Figure 1). First, their raw data were obtained from the GEO database or ArrayExpress database, respectively. The sequence data were aligned to a standardized mouse genome assembly (GRCm38/mm10), and gene expression in each sample was quantified using the Galaxy analysis platform (Jalili et al., 2020). The gene expression levels in each condition were then summarized (average FPKM and standard deviation) and available for bar-plot visualization in the ECO database (https://heomics.shinyapps.io/ecodb). Also, the gene expression in each condition was compared with its respective control by differential expression analysis, and log scaled fold change (logFC) and p values were calculated, which are also illustrated with the bar-plot in the database. Besides the display of expression profiles in ECs, ECO can further identify the genes which showed similar expression profiles with the queried gene by using correlation analysis. The results were shown both as a heatmap and table.
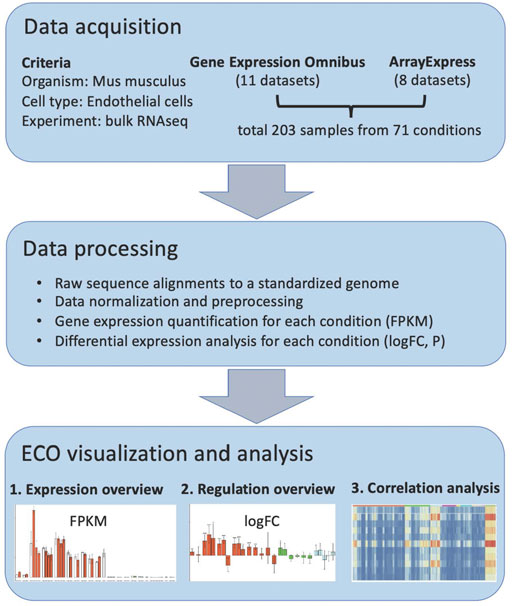
FIGURE 1. ECO workflow.
Investigation for Inter-Organ Heterogeneity of ECs by Using ECO
ECs in different tissues have heterogeneous phenotypes for their distinct physiological needs (Kalucka et al., 2020). For instance, brain ECs form tight junctions and express active transporters to restrict diffusion, known as the blood–brain barrier (BBB) (Daneman and Prat, 2015). In contrast, ECs in the kidney are associated with fenestrae to allow efficient passage of high-volume fluids and formation of urine (Dumas et al., 2021). EC profiles from 10 organs, including the brain, lung, bone, kidney aorta, liver, eye, muscles, lymph node, and embryo, were cataloged in ECO. Users can access and download the expression of the gene of their interest in ECs of different organs in ECO by simple one-click of FPKM button. Also, users can input a customized gene list to analyze their overall gene expression enrichment pattern in a heatmap.
We use Slc2a1 as an example to explore the inter-organ heterogeneity of a given gene. Slc2a1, encoding Glut1, which is highly expressed in BBB ECs but not peripheral ECs and facilitates glucose transport over BBB (Zheng et al., 2010). When we access Slc2a1 expression by pressing the FPKM button after entering the gene symbol in the query interface, we get the normalized data bar-plot visualization for 32 sub-groups from 10 organs. As expected, Slc2a1 is highly expressed in ECs from the brain, but almost absent in other organs (Figure 2).
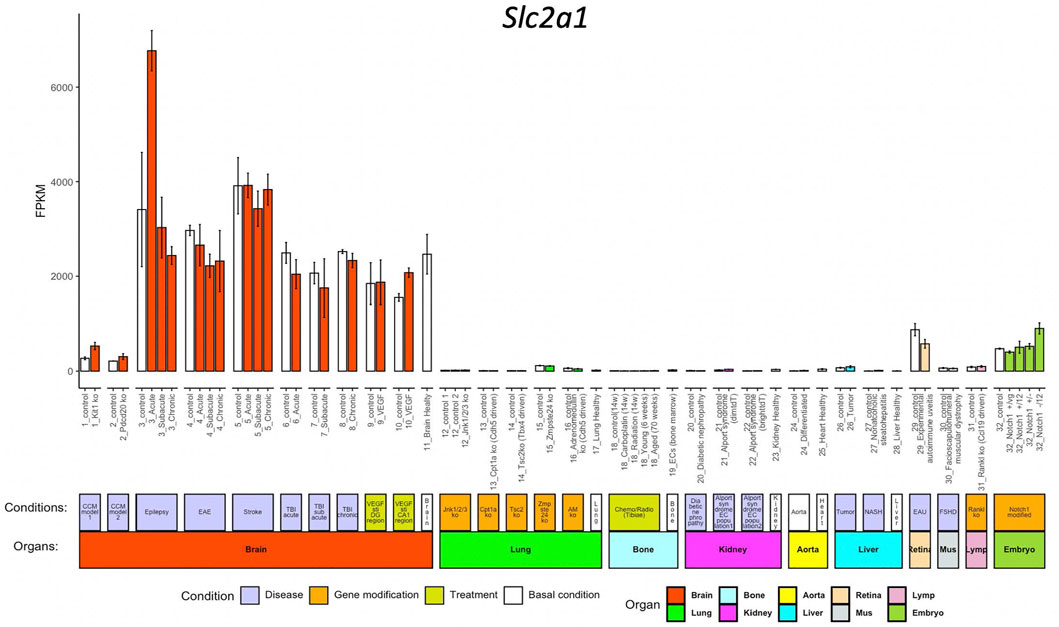
FIGURE 2. Bar-plot of Slc2a1 expression in different conditions. The x-axis shows the 71 conditions, and the y-axis shows the normalized FPKM values. Each bar shows the average expression (+/− standard deviation) in each condition. The bars are colored according to their organ origins, and all basal/control conditions are shown with white color (high-resolution image is available in the ECO online database).
Exploring EC Gene Alterations in Response to Disease, Genetic Manipulations, or Other Stimulations In Vivo by Using ECO
ECs participate in the regulation of multiple processes including angiogenesis, coagulation, and inflammation. Endothelial dysfunction is associated with many pathological alterations and aggravates progression of multiple life-threatening diseases including cancers, cardiovascular disease, diabetes mellitus, and renal disorders. In ECO, we collected EC transcriptomes from eleven mice disease models (cerebral cavernous malformation (CCM), epilepsy, experimental autoimmune encephalomyelitis (EAE), stroke, traumatic brain injury (TBI), diabetic nephropathy, Alport syndrome, liver cancer, non-alcoholic steatohepatitis (NASH), experimental autoimmune uveitis (EAU), and facioscapulohumeral muscular dystrophy (FSHD)), seven gene-modified animal models (Jnk1/2/3 EC-specific deficient, Cpt1a EC-specific deficient, Tsc2 mesenchyme cell-specific deficient, Zmpste24 deficient, adrenomedullin (AD) EC-specific deficient, Tankl stroma cell-deficient, and EC-specific Notch1 mutants), and two clinically relevant treatments (VEGF stimulations and chemo/radiotreatment) (Supplementary Table S1). The users can access the alteration of the genes of their interest in response to the abovementioned conditions compared to their control by clicking the logFC button. The result is illustrated in a bar-plot with 40 columns; each column represents the log2 scaled fold change, and its statistical significance (p value range) is indicated by asterisks (Figure 3).
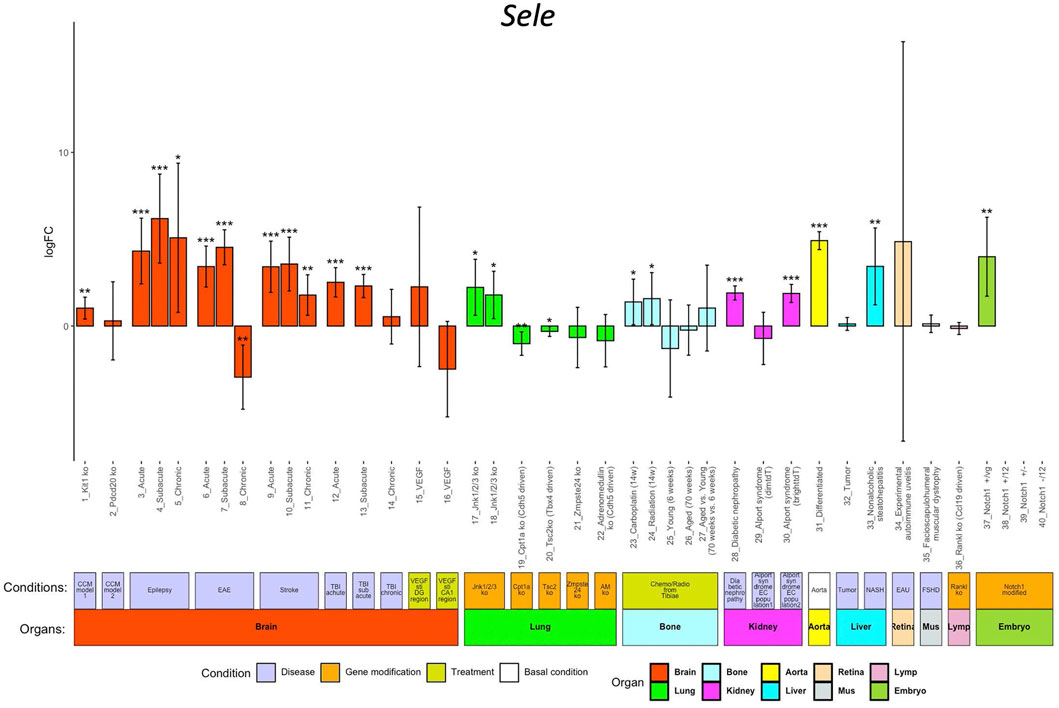
FIGURE 3. Sele regulation in different conditions. The x-axis shows the 40 conditions, and the y-axis shows the log2 scaled regulation fold change (logFC). Each bar shows the average fold change with confidence interval in each condition. The bars are colored according to their organ origins (high-resolution image is available in the ECO online database).
We use Sele as an example to demonstrate the exploration of its regulation in different pathological conditions, genetic modifications, and treatments in vivo. E-selectin, encoded by Sele, is upregulated in ECs in response to pro-inflammatory signals, promoting the rolling and adherence of immune cells to ECs for their diapedesis (Jubeli et al., 2012). Inflammation is closely linked in the EC dysfunction in multiple diseases (Steyers and Miller, 2014). As shown in Figure 3, ECO provides a comprehensive portrait for Sele in different pathological conditions. Sele was upregulated in ECs from eight disease models including CCM, EAE, stroke, TBI, epilepsy, AOD, diabetic nephropathy, Alport syndrome, and NASH, highlighting the broad role of Sele in multiple disease progressions (Silva et al., 2017).
Predicting the Function of Poorly Characterized Genes Based on Correlation Analysis Using ECO
The correlation analysis identifies the genes which have similar expression profiles, and those co-expressed genes may have similar function. In ECO, it provides correlation analysis for the query gene to all other genes in all cataloged EC groups, as well as in individual organs which have relatively large number of samples. This facilitates uncovering the function of novel or not much characterized genes based on correlation analysis.
For example, we used a gene named C330027C09Rik as an example. C330027C09Rik did not yet have a clear gene name at the time of the gene assembly from the Ensembl database and was named after the full-length cDNA sequences from the RIKEN project (Hayashizaki, 2003). Among the top correlated genes, a list of well-known cell cycle-related genes appears, for example, Mki67 and Cenpf, indicating that this gene maybe related with cell cycle (Figure 4). Interestingly, in the NCBI gene database, C330027C09Rik has been formally named as cell proliferation-regulating inhibitor of protein phosphatase 2A (Cip2a) (https://www.ncbi.nlm.nih.gov/gene/?term=C330027C09Rik). This confirmed the prediction from the correlation analysis.
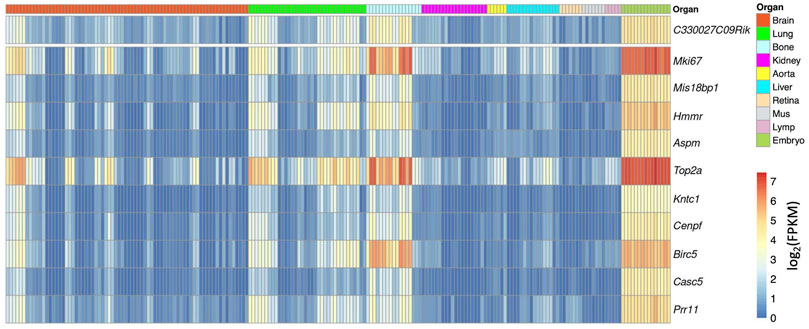
FIGURE 4. Heatmap overview of the top correlated genes to C330027C09Rik. Each column shows one RNAseq sample, and its organ origin is colored on the top of the heatmap. The top 10 correlated genes are visualized. The heatmap color shows the expression level in each sample (log2 scaled FPKM) (high-resolution image is available in the ECO online database).
Discussion
Uncovering the EC transcriptional profile is critical to understand the EC functions in various vascular disease conditions. Previously, we have analyzed EC transcriptomes in normal mice brain (Vanlandewijck et al., 2018) and lung (He et al., 2018). It has improved the understanding of EC in these individual organs, while, on the public domain, many transcriptional profiling studies by different labs have accumulated extensive datasets for EC. However, using bioinformatics technologies to analyze these transcriptome data is a challenging task for many researchers. As such, it is of a great value to provide ECO, a user-friendly EC database, to explore expression profiles. Compared with the previously published EndoDB database (Khan et al., 2019), we have included all nine RNAseq studies in EndoDB, as well as eleven studies which were not presented there. ECO is a user-friendly web-based tool making the ever-increasing amount of EC transcriptome data easily accessible to non-bioinformatics researchers, as well as specialists as a resource of curated data. The core feature of ECO is one-click access to EC gene expression in different organs and alterations under different conditions for all genes on the genome. Unlike other databases, ECO dedicates to curate bulk RNAseq data from purified mouse EC under different conditions. All the data are processed using a standardized method for cross comparisons, and the results are visualized with easily understandable bar-plots. To make the users readily obtain the figures from ECO for presentation or publication usage, all the figures can be downloaded in the high-resolution PDF format.
ECO facilitates endothelial research with an integrated tool and resource for transcriptome analysis. With the friendly interactive interface, users can easily explore the published endothelial datasets from a variety of conditions, which may save some unnecessary animal experiments for vascular researchers. Also, ECO maximizes the value of published datasets by integrating them under a standardized platform. It may reveal potential global patterns which cannot be overserved from individual analysis. We expect that ECO will be a useful tool for researchers in the vascular community.
Data Availability Statement
The original contributions presented in the study are included in the article/Supplementary Material, further inquiries can be directed to the corresponding author.
Author Contributions
LH conceived the project. XD, FY, and LH constructed the database. XD, FY, LZ, JW, BL, WL, JT, YX, and LH analyzed data. XD, LZ, JW, and LH wrote the manuscript. All authors reviewed and approved the final manuscript.
Funding
This work was supported by the National Natural Science Foundation of China (Nos. 81870978 (LH), 81911530166 (LZ), 81702489 (LZ), and 82002659 (YX)), Tianjin Natural Science Foundation (No. 18JCYBJC94000 (LH)), Natural Science Foundation of Shaanxi Province (Nos. 2021KW-46 (LZ) and 2020JQ-429 (YX)), Fundamental Research Funds for the Central University (Nos. GK202003050 (LZ) and GK202003048 (YX)), Natural Science Foundation of Huaihua City (2020R3118 (JT) and 2020R3116 (WL)), and Natural Science Foundation of Hunan Province (No. 2020JJ4071 (B.L.)).
Conflict of Interest
The authors declare that the research was conducted in the absence of any commercial or financial relationships that could be construed as a potential conflict of interest.
Publisher’s Note
All claims expressed in this article are solely those of the authors and do not necessarily represent those of their affiliated organizations, or those of the publisher, the editors, and the reviewers. Any product that may be evaluated in this article, or claim that may be made by its manufacturer, is not guaranteed or endorsed by the publisher.
Supplementary Material
The Supplementary Material for this article can be found online at: https://www.frontiersin.org/articles/10.3389/fgene.2022.844544/full#supplementary-material
References
Barrett, T., Troup, D. B., Wilhite, S. E., Ledoux, P., Rudnev, D., Evangelista, C., et al. (2007). NCBI GEO: Mining Tens of Millions of Expression Profiles-Ddatabase and Tools Update. Nucleic Acids Res. 35 (Database issue), D760–D765. doi:10.1093/nar/gkl887
Daneman, R., and Prat, A. (2015). The Blood-Brain Barrier. Cold Spring Harb. Perspect. Biol. 7, a020412. doi:10.1101/cshperspect.a020412
Dumas, S. J., Meta, E., Borri, M., Luo, Y., Li, X., Rabelink, T. J., et al. (2021). Phenotypic Diversity and Metabolic Specialization of Renal Endothelial Cells. Nat. Rev. Nephrol. 17, 441. doi:10.1038/s41581-021-00411-9
Goveia, J., Stapor, P., and Carmeliet, P. (2014). Principles of Targeting Endothelial Cell Metabolism to Treat Angiogenesis and Endothelial Cell Dysfunction in Disease. EMBO Mol. Med. 6 (9), 1105–1120. doi:10.15252/emmm.201404156
Hayashizaki, Y. (2003). The Riken Mouse Genome Encyclopedia Project. C R. Biol. 326 (10-11), 923–929. doi:10.1016/j.crvi.2003.09.018
He, L., Vanlandewijck, M., Mäe, M. A., Andrae, J., Ando, K., Del Gaudio, F., et al. (2018). Single-cell RNA Sequencing of Mouse Brain and Lung Vascular and Vessel-Associated Cell Types. Sci. Data 5, 180160. doi:10.1038/sdata.2018.160
Jalili, V., Afgan, E., Gu, Q., Clements, D., Blankenberg, D., Goecks, J., et al. (2020). The Galaxy Platform for Accessible, Reproducible and Collaborative Biomedical Analyses: 2020 Update. Nucleic Acids Res. 48 (W1), W395–W402. doi:10.1093/nar/gkaa434
Jubeli, E., Moine, L., Vergnaud-Gauduchon, J., and Barratt, G. (2012). E-selectin as a Target for Drug Delivery and Molecular Imaging. J. Control. Release 158 (2), 194–206. doi:10.1016/j.jconrel.2011.09.084
Kalucka, J., de Rooij, L. P. M. H., Goveia, J., Rohlenova, K., Dumas, S. J., Meta, E., et al. (2020). Single-Cell Transcriptome Atlas of Murine Endothelial Cells. Cell. 180 (4), 764–779. doi:10.1016/j.cell.2020.01.015
Khan, S., Taverna, F., Rohlenova, K., Treps, L., Geldhof, V., de Rooij, L., et al. (2019). EndoDB: a Database of Endothelial Cell Transcriptomics Data. Nucleic Acids Res. 47 (D1), D736–D744. doi:10.1093/nar/gky997
Kim, D., Langmead, B., and Salzberg, S. L. (2015). HISAT: a Fast Spliced Aligner with Low Memory Requirements. Nat. Methods 12 (4), 357–360. doi:10.1038/nmeth.3317
Krüger-Genge, A., Blocki, A., Franke, R. P., and Jung, F. (2019). Vascular Endothelial Cell Biology: An Update. Int. J. Mol. Sci. 20, 4411. doi:10.3390/ijms20184411
Lein, E. S., Hawrylycz, M. J., Ao, N., Ayres, M., Bensinger, A., Bernard, A., et al. (2007). Genome-wide Atlas of Gene Expression in the Adult Mouse Brain. Nature 445 (7124), 168–176. doi:10.1038/nature05453
Leinonen, R., Sugawara, H., and Shumway, M. (2011). The Sequence Read Archive. Nucleic Acids Res. 39 (Database issue), D19–D21. doi:10.1093/nar/gkq1019
Li, X., Kumar, A., and Carmeliet, P. (2019). Metabolic Pathways Fueling the Endothelial Cell Drive. Annu. Rev. Physiol. 81, 483–503. doi:10.1146/annurev-physiol-020518-114731
Liao, Y., Smyth, G. K., and Shi, W. (2014). featureCounts: an Efficient General Purpose Program for Assigning Sequence Reads to Genomic Features. Bioinformatics 30 (7), 923–930. doi:10.1093/bioinformatics/btt656
Munji, R. N., Soung, A. L., Weiner, G. A., Sohet, F., Semple, B. D., Trivedi, A., et al. (2019). Profiling the Mouse Brain Endothelial Transcriptome in Health and Disease Models Reveals a Core Blood-Brain Barrier Dysfunction Module. Nat. Neurosci. 22 (11), 1892–1902. doi:10.1038/s41593-019-0497-x
Navarro Gonzalez, J., Zweig, A. S., Speir, M. L., Schmelter, D., Rosenbloom, K. R., Raney, B. J., et al. (2021). The UCSC Genome Browser Database: 2021 Update. Nucleic Acids Res. 49 (D1), D1046–D57. doi:10.1093/nar/gkaa1070
Paone, S., Baxter, A. A., Hulett, M. D., and Poon, I. K. H. (2019). Endothelial Cell Apoptosis and the Role of Endothelial Cell-Derived Extracellular Vesicles in the Progression of Atherosclerosis. Cell. Mol. Life Sci. 76 (6), 1093–1106. doi:10.1007/s00018-018-2983-9
Parkinson, H., Kapushesky, M., Shojatalab, M., Abeygunawardena, N., Coulson, R., Farne, A., et al. (2007). ArrayExpress--a Public Database of Microarray Experiments and Gene Expression Profiles. Nucleic Acids Res. 35 (Database issue), D747–D750. doi:10.1093/nar/gkl995
Reglero-Real, N., Colom, B., Bodkin, J. V., and Nourshargh, S. (2016). Endothelial Cell Junctional Adhesion Molecules. Arterioscler Thromb. Vasc. Biol. 36 (10), 2048–2057. doi:10.1161/atvbaha.116.307610
Rhodes, D. R., Yu, J., Shanker, K., Deshpande, N., Varambally, R., Ghosh, D., et al. (2004). ONCOMINE: a Cancer Microarray Database and Integrated Data-Mining Platform. Neoplasia 6 (1), 1–6. doi:10.1016/s1476-5586(04)80047-2
Silva, M., Videira, P. A., and Sackstein, R. (2017). E-selectin Ligands in the Human Mononuclear Phagocyte System: Implications for Infection, Inflammation, and Immunotherapy. Front. Immunol. 8, 1878. doi:10.3389/fimmu.2017.01878
Steyers, C., and Miller, F. (2014). Endothelial Dysfunction in Chronic Inflammatory Diseases. Int. J. Mol. Sci. 15 (7), 11324–11349. doi:10.3390/ijms150711324
Vanlandewijck, M., He, L., Mäe, M. A., Andrae, J., Ando, K., Del Gaudio, F., et al. (2018). A Molecular Atlas of Cell Types and Zonation in the Brain Vasculature. Nature 554 (7693), 475–480. doi:10.1038/nature25739
Wong, B. W., Marsch, E., Treps, L., Baes, M., and Carmeliet, P. (2017). Endothelial Cell Metabolism in Health and Disease: Impact of Hypoxia. EMBO J. 36 (15), 2187–2203. doi:10.15252/embj.201696150
Keywords: endothelial cells, gene expression, RNAseq, database, integration
Citation: Deng X, Yang F, Zhang L, Wang J, Liu B, Liang W, Tang J, Xie Y and He L (2022) ECO: An Integrated Gene Expression Omnibus for Mouse Endothelial Cells In Vivo. Front. Genet. 13:844544. doi: 10.3389/fgene.2022.844544
Received: 28 December 2021; Accepted: 15 February 2022;
Published: 04 March 2022.
Edited by:
Geng Chen, GeneCast Biotechnology Co., Ltd., ChinaReviewed by:
Ting Li, National Center for Toxicological Research (FDA), United StatesArtem Kasianov, Vavilov Institute of General Genetics (RAS), Russia
Copyright © 2022 Deng, Yang, Zhang, Wang, Liu, Liang, Tang, Xie and He. This is an open-access article distributed under the terms of the Creative Commons Attribution License (CC BY). The use, distribution or reproduction in other forums is permitted, provided the original author(s) and the copyright owner(s) are credited and that the original publication in this journal is cited, in accordance with accepted academic practice. No use, distribution or reproduction is permitted which does not comply with these terms.
*Correspondence: Liqun He, bGlxdW4uaGVAaWdwLnV1LnNl
†These authors have contributed equally to this work