 Qiang Li1
 S. Aishwarya
 Jia-Pei Shi
- 1Department of Neurosurgery, Hwa Mei Hospital, University of Chinese Academy of Sciences (Ningbo No. 2 Hospital), Ningbo Institute of Life and Health Industry, University of Chinese Academy of Sciences, Ningbo, China
- 2Department of Bioinformatics, Stella Maris College (Autonomous), Chennai, India
- 3Department of Radiology, Hwa Mei Hospital, University of Chinese Academy of Sciences (Ningbo No. 2 Hospital), Ningbo Institute of Life and Health Industry, University of Chinese Academy of Sciences, Ningbo, China
Glioblastoma is an aggressive malignant tumor of the brain and spinal cord. Due to the blood–brain barrier, the accessibility of its treatments still remains significantly challenging. Unfortunately, the recurrence rates of glioblastoma upon surgery are very high too. Hence, understanding the molecular drivers of disease progression is valuable. In this study, we aimed to investigate the molecular drivers responsible for glioblastoma progression and identify valid biomarkers. Three microarray expression profiles GSE90604, GSE50601, and GSE134470 containing healthy and glioblastoma-affected samples revealed overlapping differentially expressed genes (DEGs). The interrelational pathway enrichment analysis elucidated the halt of cell cycle checkpoints and activation of signaling pathways and led to the identification of 6 predominant hub genes. Validation of hub genes in comparison with The Cancer Genome Atlas datasets identified the potential biomarkers of glioblastoma. The study evaluated two significantly upregulated genes, SPARC (secreted protein acidic and rich in cysteine) and VIM (vimentin) for glioblastoma. The genes CACNA1E (calcium voltage-gated channel subunit alpha1 e), SH3GL2 (SH3 domain-containing GRB2-like 2, endophilin A1), and DDN (dendrin) were identified as under-expressed genes as compared to the normal and pan-cancer tissues along with prominent putative prognostic biomarker potentials. The genes DDN and SH3GL2 were found to be upregulated in the proneural subtype, while CACNA1E in the mesenchymal subtype of glioblastoma exhibits good prognostic potential. The mutational analysis also revealed the benign, possibly, and probably damaging substitution mutations. The correlation between the DEG and survival in glioblastoma was evaluated using the Kaplan–Meier plots, and VIM had a greater life expectancy of 60.25 months. Overall, this study identified key candidate genes that might serve as predictive biomarkers for glioblastoma.
Introduction
Glioma is the primary malignant brain tumor affecting the glial cells of the central nervous system (Mamelak & Jacoby, 2007). There are multiple types of glioma known based on the cells from which it originates. The main types are glioblastoma, astrocytoma, mixed gliomas, anaplastic astrocytoma, ependymomas, and oligodendroglioma. Among these, the grade IV malignant tumor glioblastoma (GBM) is the most dangerous, with a survival rate of merely 3%–5%. Unfortunately, the occurrence of the disease in the brain makes it much more difficult for early-stage diagnosis (Müller Bark et al., 2020). In general, a patient affected by GBM survives up to 5 months. However, modern surgery, radiation, and chemotherapy can extend the median survival rate to approximately 12 months (Banu, 2019). Due to the presence of endothelial cell luminal and abluminal plasma membranes, the blood–brain barrier offers physical and biochemical barriers to the normal brain and prevents the passage of oncologic drugs, lipophilic molecules, and monoclonal antibodies (Sarkaria et al., 2018). GBM causes vasogenic brain edema that results in intracranial pressure, which eventually leads to the induction of leakage and the disruption of the normal blood–brain barrier in most patients. The major challenge in prognosis, therapy, and treatments of GBM is due to their invasive nature and the inaccessibility of the brain tissues caused by the disrupted blood–brain barrier (Dubois et al., 2014).
In 2005, the Food and Drug Administration (FDA) approved standard-of-care temozolomide (Chang et al., 2004; Dubois et al., 2014) to treat newly diagnosed brain tumors. In 2009, anti-vascular endothelial growth factor (VEGF) was approved to treat GBM (Friedman et al., 2009; Kreisl et al., 2009). Researchers have recently identified targeting the rat sarcoma virus (RAS) and tyrosine kinase signaling pathways, ephrin receptor subfamily of the protein-tyrosine kinase family (EPH3A) and EGFR receptors, and the development of monoclonal antibody bevacizumab as the means to halt the progression of GBM (Mao et al., 2012; Pearson & Regad, 2017). Unfortunately, the recurrence of GBM tumors remains a major limiting factor for all the existing primary treatment strategies (Shergalis et al., 2018; Cheng et al., 2021). Thus, there is an unmet need to identify molecular drivers responsible for the progression of GBM.
In this direction, discerning the key aberrant molecular targets and pathways in the initiation and progression of GBM can be a significant strategy for developing potential therapeutics (Rai & Jamil, 2019; Silantyev et al., 2019). In previous studies, the genomic, transcriptomic, and proteomic profiles of the healthy and diseased samples have been widely used in elucidating the pathogenesis of cancer and other diseases (Tang & Zhang, 2018; Hsu et al., 2019; Yin et al., 2019). One such recent study elucidated ADAM-like decysin 1 (ADAMDEC1) and fibroblast growth factor 2 (FGF2) as novel druggable targets for GBM (Jimenez-Pascual et al., 2019).
In the current study, we have analyzed the microarray gene expression profiles of GBM collected from three different cohort studies. The microarray expression profile datasets, GSE90604, GSE134470, and GSE50161, were collected from the NCBI-Gene Expression Omnibus database (NCBI-GEO), and the differentially expressed genes (DEGs) with log2FC > 1 and p-value <0.05 were identified. It has been advocated that the integration and reanalysis of the genomics profiles from different studies offer better solutions to the poor reproducibility of single cohort studies and help ensure consistency in the analysis (Bo et al., 2018; Li et al., 2020; Yan et al., 2019). The identified DEGs were further subjected to Gene Ontology (GO) analysis to understand the potentially significant genes. The inter-relational pathways involved in the pathology of GBM were also examined to identify potential prognostic biomarkers. Additionally, the hub genes in GBM were also identified and validated through the analysis of their expression patterns in normal tissues and other related cancers. Furthermore, they were also classified based on the GBM subtypes, and the significant mutations were predicted. Additionally, the correlation between the DEG expression and survival in GBM was analyzed.
Methodology
Identification of Differentially Expressed Genes
The Gene Expression Omnibus (GEO) database contained gene expression profiles of GBM data from which three publicly available datasets, GSE90604 (Gulluoglu et al., 2018), GSE50161 (Griesinger et al., 2013), and GSE134470 (Golebiewska et al., 2020) were retrieved (Table 1). The platform for GSE90604 was based on the GPL17692 Affymetrix human gene 2.1 ST array with 25 samples of mRNA expression datasets from GBM and control. The platform for GSE50161 was based on the GPL570 Affymetrix human genome U133 Plus 2.0 array, and that for GSE134470 was based on the GPL6244 Affymetrix human gene 1.0 ST array expression profiling. The three aforementioned datasets were chosen for the following two reasons: 1) they are from human GBM tissues and 2) the samples were devoid of any treatment options. The overlapping differentially expressed genes were discerned through a meta-analysis of all three datasets using the limma package and Bioconductor GEO2R package. Standard data processing and analysis were implied to identify the DEGs. The datasets were standardized and log-transformed, and Benjamini–Hochberg false discovery rate statistics were applied with log2FC > 1 and p-value <0.05 thresholds. The bioinfokit (https://pypi.org/project/bioinfokit/) package implemented in Python was used to create the volcano plot of the DEGs. The protocol and the data files used in the study are made available for access at https://github.com/aishwarya-sekar/Glioma-gene-expression-analysis.git.
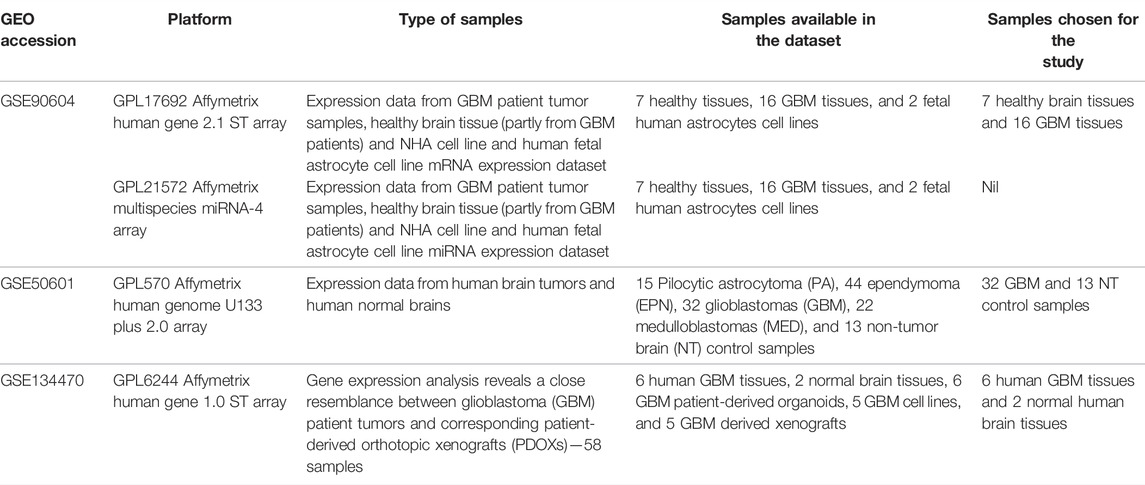
TABLE 1. Datasets used in the current study.
Gene Ontology Term and Signaling Pathway Enrichment Analysis
The DEGs were annotated for their gene ontology terms using the Database for Annotation, Visualization, and Integrated Discovery (DAVID) tool (https://david-d.ncifcrf.gov/) (Dennis et al., 2003). Pathway analysis was performed using the metabolic pathway databases REACTOME (http://www.reactome.org) (Croft et al., 2011) and KEGG (www.genome.jp/kegg) (Kanehisa & Goto, 2000). The ClueGO (version 2.5.7) module of the Cytoscape software (version 3.8.2) was used to examine the inter-relational analysis of the gene annotations and the pathway terms to predict the most significant genes. Hypergeometric two-sided tests and Benjamini–Hochberg methods were used (Bindea et al., 2009).
Protein–Protein Interaction and Hub Gene Validation
The STRING database (http://stringdb.org/) was used to evaluate the evidence-based protein–protein interactions (PPI) (Szklarczyk et al., 2017). Active interactions based on experiments, neighborhood, co-expression, gene fusion, co-occurrence, and text mining were filtered at a medium confidence score of 0.4 and a high confidence score of 0.7. The significant PPI clusters for the up- and downregulated DEGs were determined using the MCODE plug-in implemented in the Cytoscape software. To predict the hub genes, cutoff values of 3, 2, and 0.2 were selected for the network scoring degree, K-score, and node score, respectively. The expression profiles of the hub genes were validated using the expression atlas platform (https://www.ebi.ac.uk/gxa/home) (Papatheodorou et al., 2020). The analysis based on the statistical t-tests was performed across multiple tissue levels with a maximum of 1,642 transcripts per million (TPM) expressions (Pellegrini et al., 2016) in comparison with the Cancer Genome Atlas (TCGA) GBM data from the UALCAN database (http://ualcan.path.uab.edu/cgi-bin) (Chandrashekar et al., 2017). The mutational significance of the hub genes was identified and interpreted through cBioPortal (www.cbioportal.org) with the TCGA GBM datasets (Tomczak et al., 2015). The significant substitution mutations for the hub genes were identified using the PolyPhen-2 (http://genetics.bwh.harvard.edu/pph2/bgi.shtml) webserver.
Survival Plot Analysis and Prognostic Abilities of Hub Genes
Survival plot analysis was performed with Kaplan–Meier servers (http://kmplot.com/analysis/). It was used to predict the correlation between DEGs and the survival rates of the patients using the log-rank p tests. The relationships below a p-value of 0.05 were considered significant (Mishra et al., 2019). The molecular subtypes of GBM were identified as proneural, classical, and mesenchymal (Sidaway, 2017). The expression levels of hub genes were evaluated using the Glioblastoma BioDiscovery Portal (GBM-BioDP) (https://gbm-biodp.nci.nih.gov) to identify their prognostic ability based on the GBM subtypes (Verhaak et al., 2010) from the gene expression datasets of Verhaak 840 Core, integrated with three microarray platforms.
Identification of Prognostic Biomarkers Through Pan-Cancer Analysis
The association of the hub genes and survival analysis revealed the predominant biomarkers of GBM. The genes were analyzed for their expression rates across multiple cancers to identify a reliable biomarker. The pan-cancer analysis was performed using the UALCAN database and protein atlas platform (Sasmita et al., 2018). The genes that had a predominant alteration in the related disease states of glioma were evaluated, and genes with significant differences in the levels of expression for GBM were identified as biomarkers of GBM.
Results
Differentially Expressed Gene Prediction
In this work, we analyzed the microarray gene expression profiles of three GBM datasets, namely, GSE90604, GSE50161, and GSE134470, obtained from the NCBI-GEO database. The datasets were analyzed using the limma package by setting the cutoff criterion as log2FC > 1 and a p-value < 0.05 to obtain the DEGs. A total of 1,673 (785 upregulated and 888 downregulated), 5,375 (2,848 upregulated and 2,497 downregulated), and 2,263 (960 upregulated and 1,303 downregulated) DEGs were identified for GSE90604, GSE50161, and GSE134470, respectively. Out of these, 61 genes (23 upregulated and 38 downregulated) were found to be overlapped, as shown in Figures 1A, B). A volcano plot of all the DEGs of GSE90604, GSE50161, and GSE134470 is shown in Figures 1C–E, respectively. The overlapped DEGs (as listed in Supplementary File S1) were taken into consideration for further analysis. The topmost enriched overlapping DEGs with their biological functions are presented in Table 2.
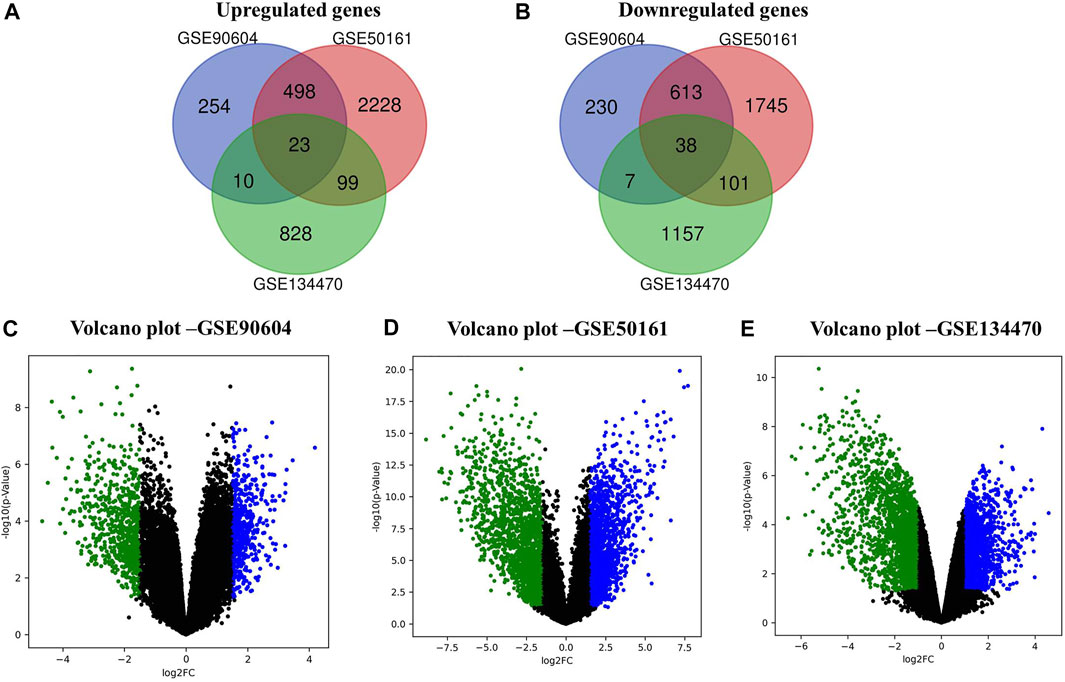
FIGURE 1. Differentially expressed genes (DEGs) of the expression profiles GSE90604, GSE50161, and GSE134470 with log2FC > 1 and p-value < 0.05. (A) Venn diagram representation of the overlapped upregulated DEGs (B) Venn diagram representation of the overlapped downregulated DEGs. (C) Volcano plots of the up- and downregulated DEGs of GSE90604. (D) Volcano plots of the up- and downregulated DEGs of GSE50161 and (E) Volcano plots of the up- and downregulated DEGs of GSE134470. Green and blue dots represent down and upregulated genes, respectively. Black dots represent the remaining genes with no significant difference.
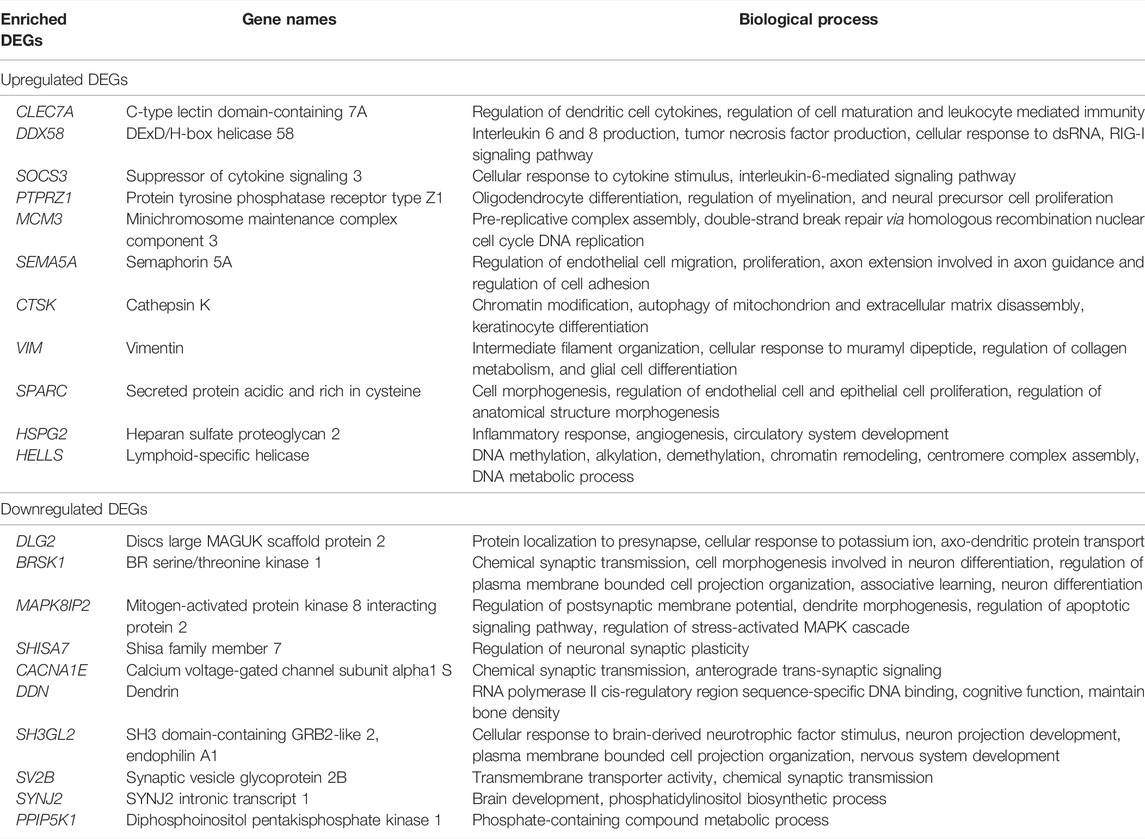
TABLE 2. Top DEGs and their biological functions.
Gene Annotations From the Differentially Expressed Genes
From the GO analysis of the overlapping DEGs, the top ten annotations based on their p-values were considered for biological process (BP), molecular functions (MF), and cellular component (CC) sub-ontologies. As shown in Figure 2A, the upregulated genes for BP showed significant enrichment in the regulation and migration of endothelial cells, cytokine response, and regulation of interleukin-6 and interleukin-8. For MF, the upregulation in clathrin adapter activity, transaminase activity, 1-phosphatidylinositol 3 kinase regulator activity, and double-stranded RNA binding were observed (Figure 2A). For CC, the remarkable enrichment in the tight junctions, lysosomes, primase complex, and CMG complexes involved in replication was observed (Figure 2A). For BP, significant downregulation in neurotransmitter transports, synaptic transmission, cation channel activity, and neurotransmitter receptor activity was observed (Figure 2B). For CC, the downregulation in axonal and neuronal growth, exocytic vesicle membrane, and synaptic vesicle membranes were observed (Figure 2B). For MF, the downregulation in ionotropic glutamate receptor activity, guanylate activity, phosphatidylinositol 4,5 bisphosphate activity, and histone threonine kinase activity were observed (Figure 2B).
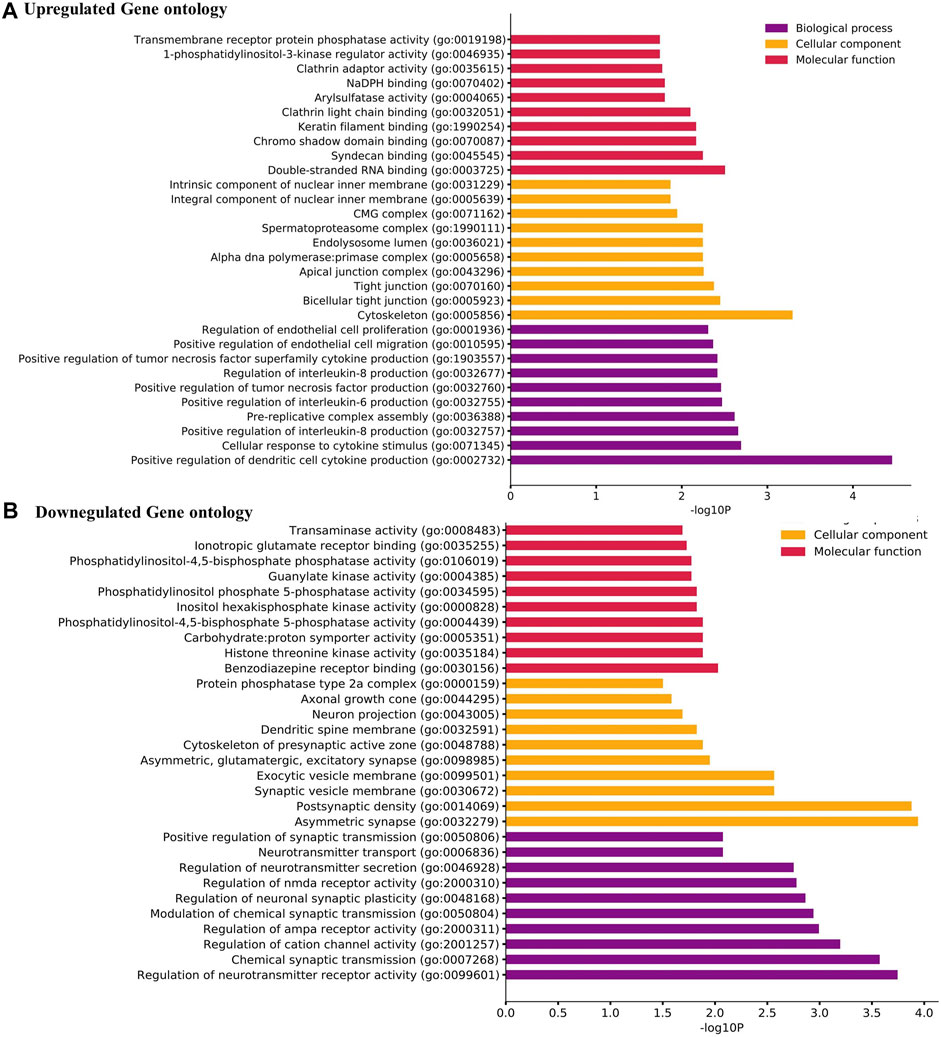
FIGURE 2. (A) Gene Ontology (GO) term enrichment analysis of the upregulated DEGs. (B) GO analysis of the downregulated DEGs. The top ten annotations ranked based on p-values are shown for three sub-ontologies, namely, biological process, molecular function, and cellular component.
Enrichment of Pathways
The major metabolic pathway databases, Kyoto Encyclopedia of Genes and Genomes (KEGG) and REACTOME, were used to study the enriched pathways for the annotated genes. The significant pathways involved in GBM were identified for the DEGs. As shown in Figure 3A, the upregulated DEGs were mainly involved in cell cycle checkpoints, mitotic G1-G1/S phase, DNA replication, immune system signaling of interferons, interleukins, and cytokines. Further, to ensure consistency between the GO and pathways enrichment, the inter-relational analysis was performed using the ClueGO module of Cytoscape. The upregulation of DNA replication, cell cycle checkpoints, chromosome condensation, immune responses, pulmonary valve morphogenesis, and coronary artery developments was noticed (Figure 3B). The downregulated DEGs were mainly involved in GABAergic and dopaminergic synaptic transmission, calcium signaling, osteoclast formation, SNARE formation, and methionine salvage pathways (Figure 4A). The interrelational analysis of downregulated DEGs was also consistent with the underexpression of GABA receptor activities, cell communications, synaptic transmission, and neuron myelination (Figure 4B).
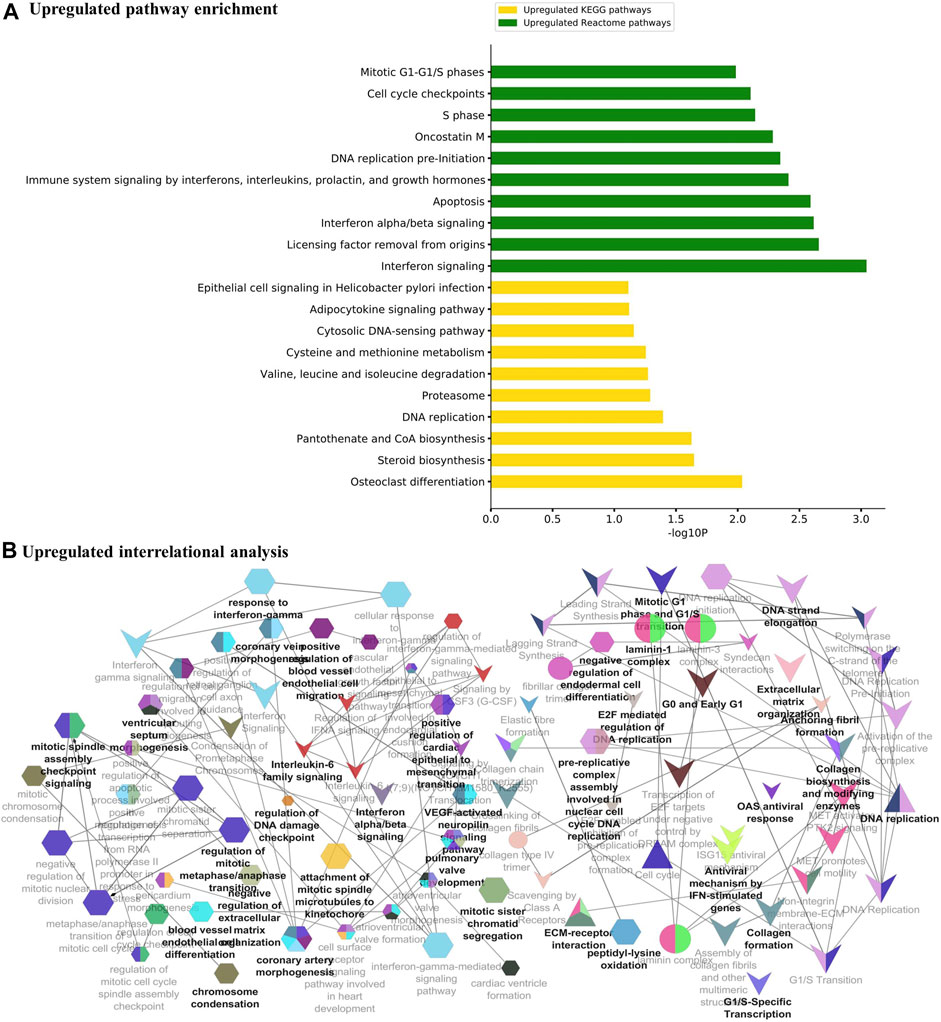
FIGURE 3. (A) Pathway enrichment analysis with KEGG and REACTOME is shown for the upregulated DEGs. (B) Interrelational pathway enrichment analysis is shown for the upregulated DEGs.
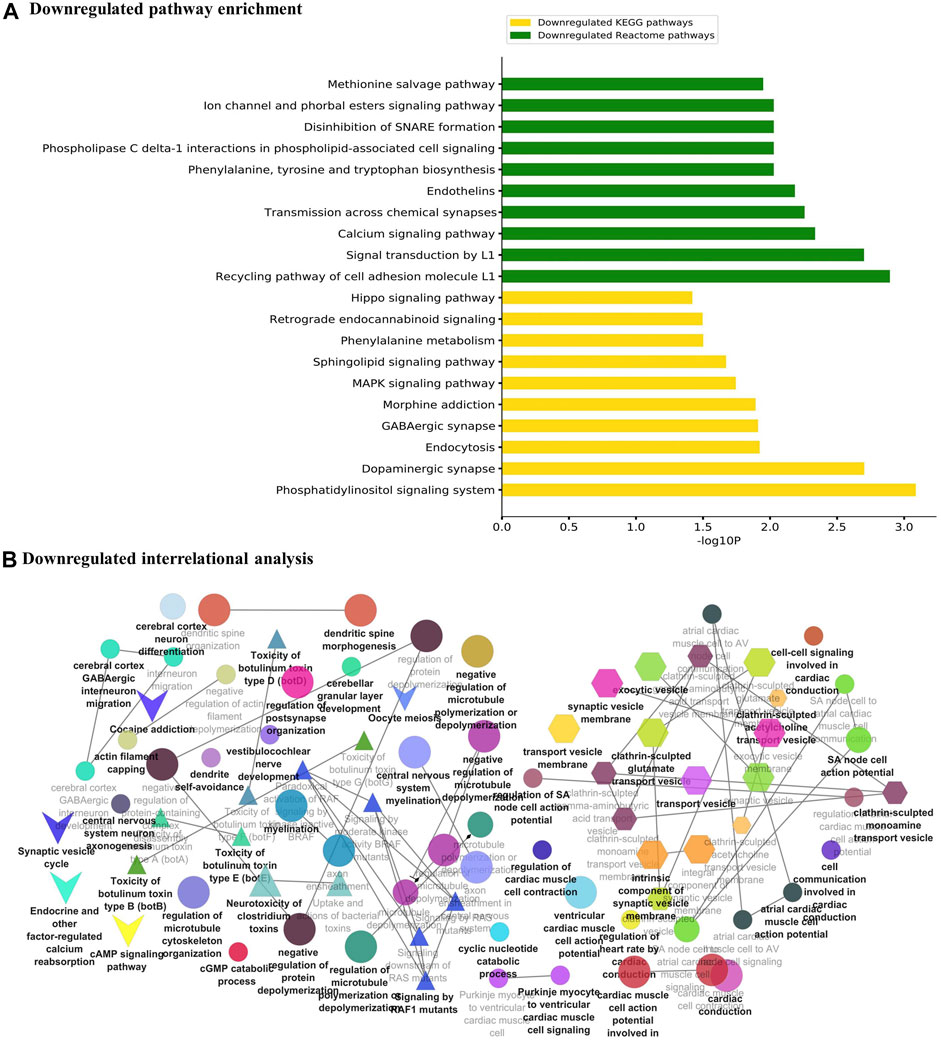
FIGURE 4. (A) Pathway enrichment analysis with KEGG and REACTOME is shown for the downregulated DEGs. (B) Interrelational pathway enrichment analysis is shown for the downregulated DEGs.
Prediction of Hub Genes Through PPI Network
The PPI networks analysis has helped in the identification of the hub genes playing a critical role in the GBM. In the predicted PPI networks for up- and downregulated DEGs, a haircut operation with a network scoring cutoff of 2 was applied using the MCODE plug-in of Cytoscape software. It resulted in 11 and 16 nodes for 23 up and 38 downregulated overlapping DEGs with scores of 3 and 3.86, respectively. The PPI networks for up- and downregulated DEGs are shown in Figures 5A, B, respectively. The 11 prominent upregulated hub genes, namely, CTSK, HSPG2, SPARC, VIM, SOCS3, HELLS, CKAP2, ASPM, MCM3, DDX58, and CLEC7A, were identified. A total of 16 genes, namely, MAPK8IP2, CACNA1E, BZRAP1, RIMS3, GABRD, DDN, BRSK1, NAP1L2, PPIP5K1, RASL10B, PPP2R2C, SYNJ2, SH3GL2, LICAM, MCTP1, and SV2B, were identified. Among them, seven upregulated DEGs—VIM, HELLS, SPARC, HSPG2, MCM3, ASPM, and SOCS3 and three downregulated DEGs—SH3GL2, LICAM, and SYNJ2 exhibited interactions with a high confidence score of 0.7.
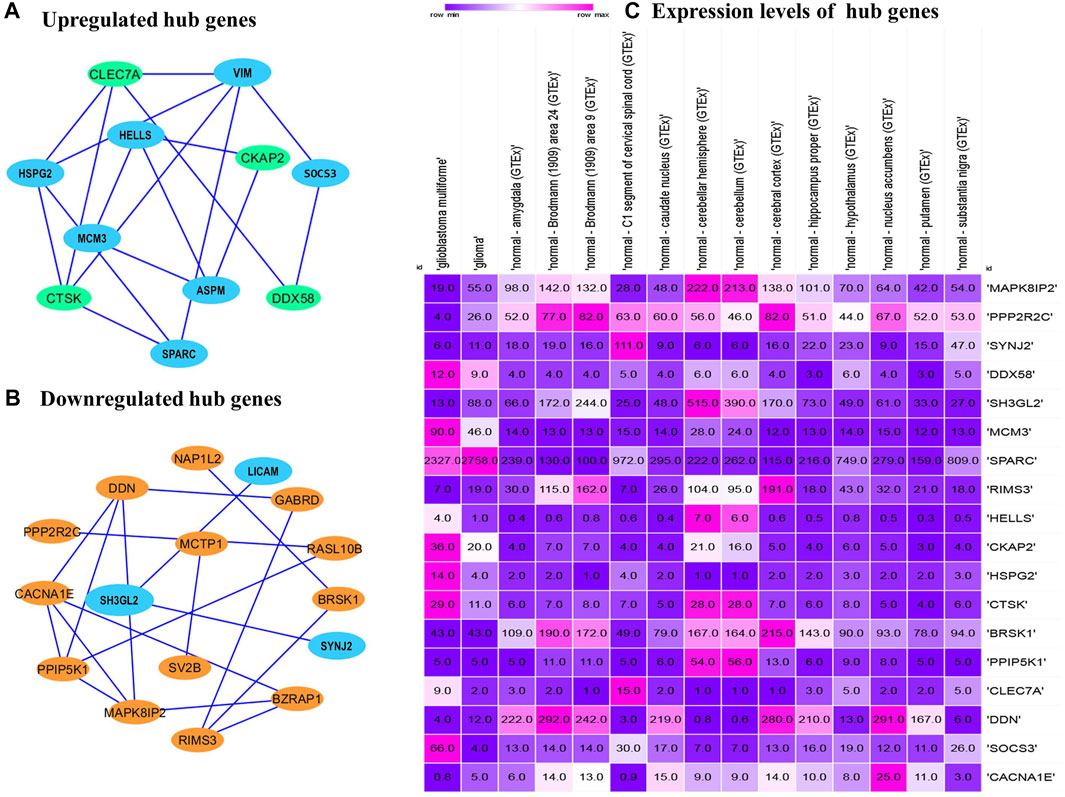
FIGURE 5. Protein–protein interaction network of the overlapped DEGs. (A) Upregulated hub genes of the PPI network with a medium confidence score of 0.4 are shown as green nodes, and hub genes with a high confidence score of 0.7 are shown as blue nodes. (B) Downregulated hub genes of the PPI with a medium score are shown as orange nodes, and hub genes with a high confidence score of 0.7 are shown as blue nodes. PPI, protein–protein interaction. DEGs, differentially expressed genes. (C) Comparison of the expression levels of hub genes among the brain tissues identified from the Expression Atlas platform for TCGA datasets.
Validation of Hub Genes
The expression atlas platform was used to further elucidate the levels of hub genes expression on the brain tissues. The set of hub genes was validated by comparing their expression patterns against the datasets of the pan-cancer atlas of the whole-genome consortium (ICGC/TCGA Pan-Cancer Analysis of Whole Genomes Consortium, 2020). GBM is reported to occur in the regions of cerebral hemispheres and frontal and temporal lobes. As shown in Figure 5C, MAPK8IP2, SH3GL3, and PPIP5K1 were found to be overly expressed in the tissues of the normal cerebellar hemisphere and cerebellum, whereas high expression of PPP2R2C and BRSK1 was seen in the normal cerebral cortex areas of brains. A very significant expression of SPARC at the rates of 2,327.0 TPM and 2,758.0 TPM were observed in GBM and glioma, respectively. It indicates SPARC to be a strong prognostic biomarker of GBM and glioma. The expression levels of the genes were measured at a maximum rate of 3,642 transcripts per million. We have further extended the validation of the hub genes by comparing the expression levels with The Cancer Genome Atlas (TCGA) data. The expression levels of the hub genes in normal brains were compared to the GBM brains. They were also classified based on TP53 mutant and non-mutant tissue samples from the TCGA datasets (TCGA pan-cancer atlas with 592 samples of GBM) and shortlisted the ones that were in line with the previous comparisons, as shown in Table 3. The genes PPP2R2C, DDN, SH3GL2, MAPK8IP2, CACNA1E, and BRSK1 were found significantly underexpressed, whereas SPARC, VIM, and MCM3 were highly expressed in both the TCGA datasets (including the TP53 mutant and non-mutant types) and GEO datasets. On the contrary, the genes CTSK, CKAP2, DDX58, and HSPG2 of GBM in TCGA were observed to be significantly overexpressed in comparison to their expressions in GEO datasets. The genes SYNJ2 and RIMS3 were observed to be relatively underexpressed in the TCGA datasets in comparison to the GEO datasets and thus excluded from further analysis.
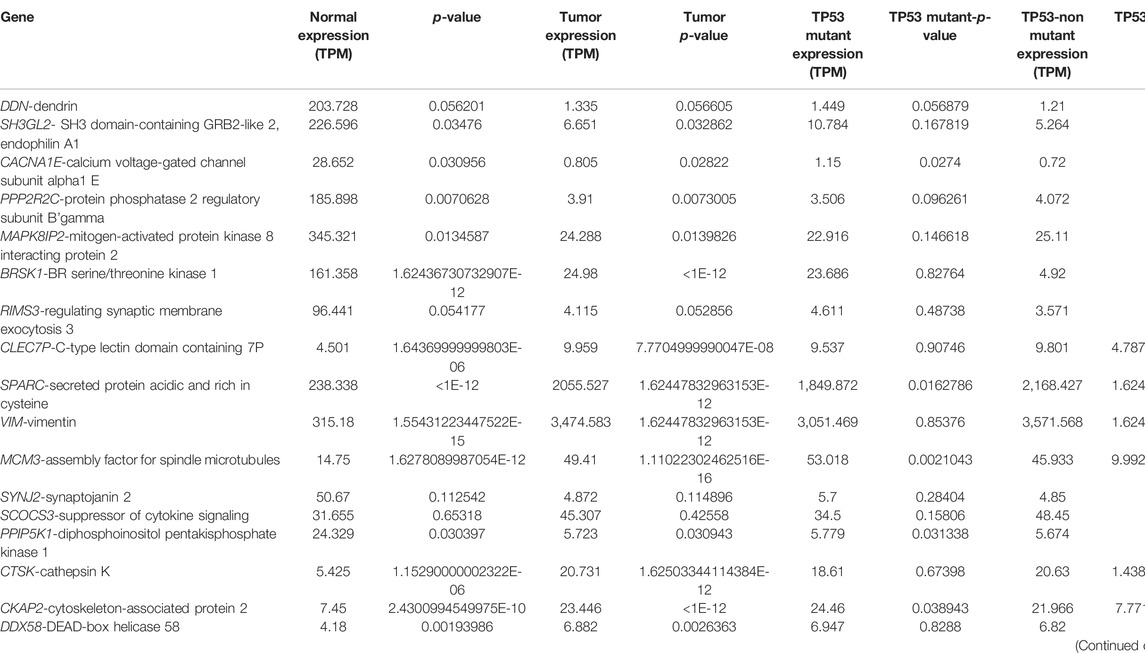
TABLE 3. Expression levels of the hub genes in GBM identified from pan-cancer analysis.
Mutational Analysis of the Hub Genes
Mutational analysis of the hub genes was inferred from the six TCGA datasets using cBioportal with a total of 1,893 samples. SH3GL2 had the highest altered frequency (2.2%) with six missense (shallow deletion) mutations. These mutations were classified as variants of unknown significance (VUS). BRSK1 had six VUS mutations with five missense and one truncating mutation with a frequency of 1.2% alterations. MCM3 had ten VUS mutations with six missense and one truncating mutation. MAPK8IP2 and PPP2R2C had two VUS mutations. The detailed mutation data of the hub genes are presented in Table 3. Genes HSPG2 with 35 VUS had a higher number of mutations with 1.5% somatic mutations followed by ASPM and CACNE1 with 26 VUS each. The substitution polymorphism was predicted using the PolyPhen-2 tool. It predicted the damaging effects of the hub genes. VIM had two mutations with probably damaging effects on V161G and E95Q with scores of 1.0 and 0.980, respectively. A possibly damaging effect with a score of 0.95 was also found on A301T. DDN, MCM3, and MCTP1 had no mutations, while SPARC had only one mutation, A127V, which was possibly damaged with a score of 0.909. SH3GL2 had only three mutations, out of which two were benign and the third where T was replaced by N at position 320 was probably damaging. BRSK1 had four mutations, out of which G to A substitution that occurred at position 327 was probably damaging. CACNA1E had 22 mutations R to W substitution at 590th residue was found recurrent in many samples. The significant substitutions of the biomarker genes are represented in Figure 6. The genes ASPM and HSPG2 exhibited 27 and 35 mutations, respectively. Some of their recurrent mutations are shown in Table 4. Figures 6A–D represents the significant substitution mutations of the four predominant genes classified as predictive biomarkers—VIM, SH3GL2, SPARC, and CACNA1E.
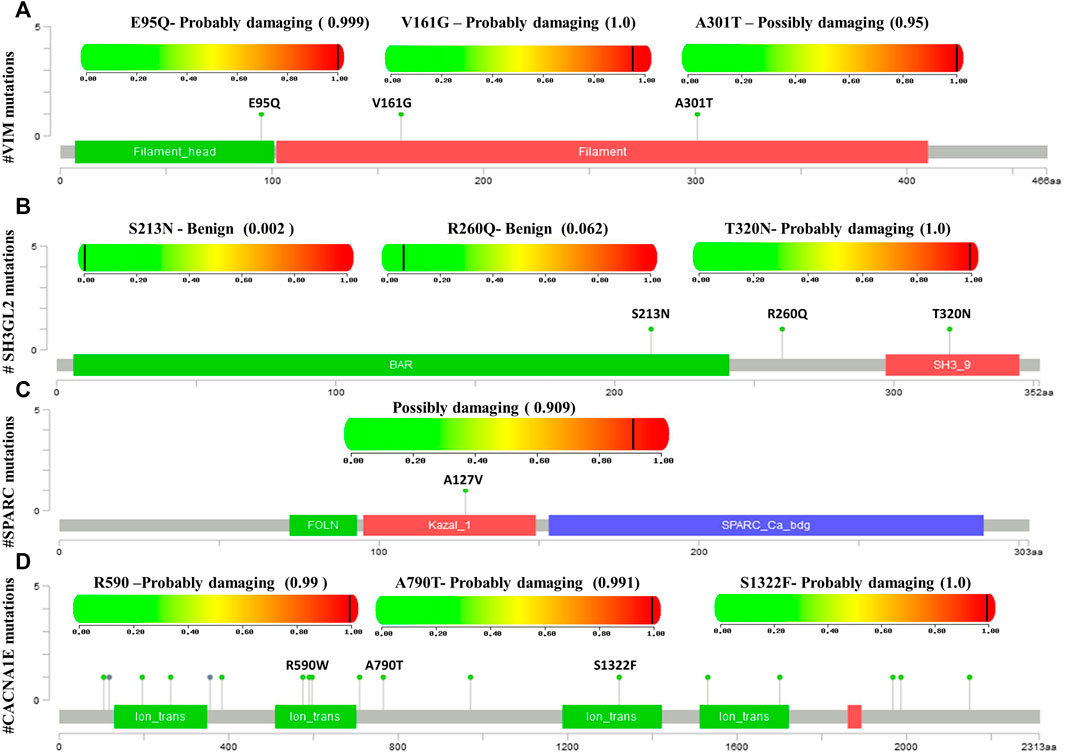
FIGURE 6. Lollipop plot exhibiting the significant substitution mutations of genes classified either as benign or damaging. (A) Significant mutations of VIM. (B) Significant mutations of SH3GL2. (C) Significant mutations of SPARC. (D) Significant mutations of CACNA1E.
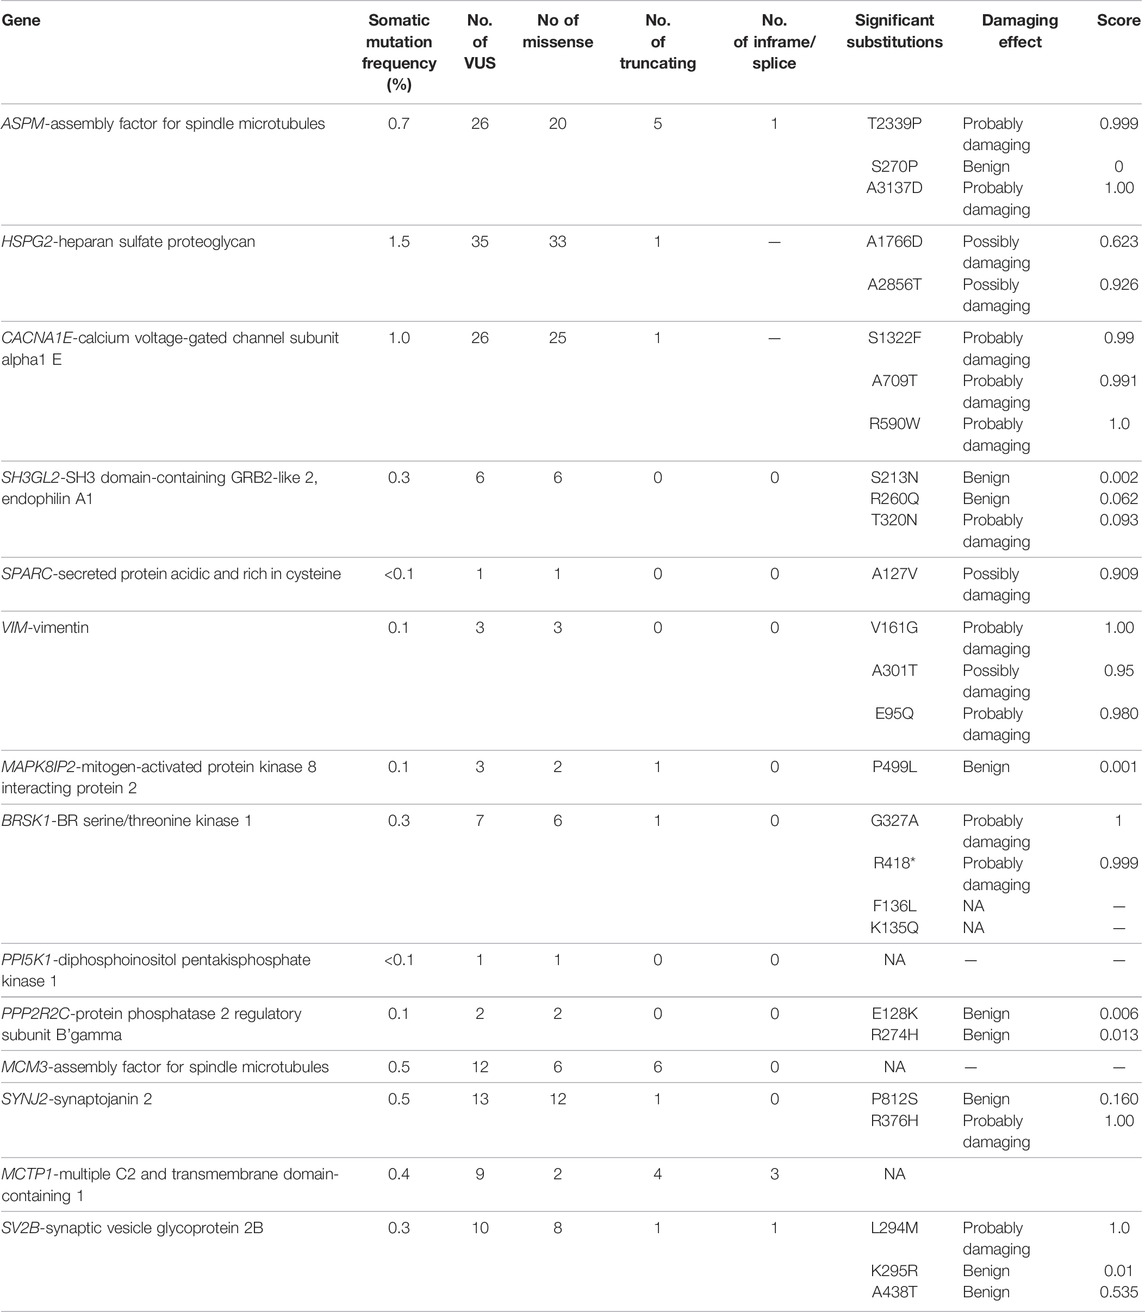
TABLE 4. Mutational analysis of the hub genes.
Survival Analysis
In this step, the prognostic benefits of the hub genes were explored in correlation with the overall survival rates of GBM patients. The median months of deceased and disease-free progression rates correlated with the hub genes expression (Table 5). A total of nine genes, namely, DDN, SH3GL2, PPP2R2C, MAPK8IP2, SPARC, CACNA1E, VIM, MCM3, and BRSK1, were identified to have an overall survival of more than 5. Log-rank p-value is only the test of significance based on the time of events. The overexpressed gene SPARC had an overall survival rate of 7.26 median months and the disease-free rate of two months which shows the progression of the disease. The underexpressed genes MAPK8IP2, BRSK1, SH3GL2, DDN, and PPP2R2C had overall survival rates of 10.65, 16.93, 6.54, 7.40, and 17.80 median months, respectively. The disease-free progression rates of MAPK8IP2, BRSK1, SH3GL2, DDN, and PPP2R2C were 11.17, 8.40, 13.21, 4.83, and 10.90 median months, respectively. The overall and disease-free progression of upregulated hub gene VIM had shown log-p ranks of 0.28 and 0.04, respectively. The highest overall survival rate was 65.33 median months. The highest disease-free progression rate was 57.72 median months. With five years of life expectancy, these values indicate a good survival rate and can be proposed as a prognostic biomarker for GBM. Figure 7 shows the overall survival rates of eight significant genes—MAPK8IP2 (Figure 7A), DDN (Figure 7B), PPP2R2C (Figure 7C), VIM (Figure 7D), SH3GL2 (Figure 7E), SPARC (Figure 7F), BRSK1 (Figure 7G), and CACNA1E (Figure 7H).
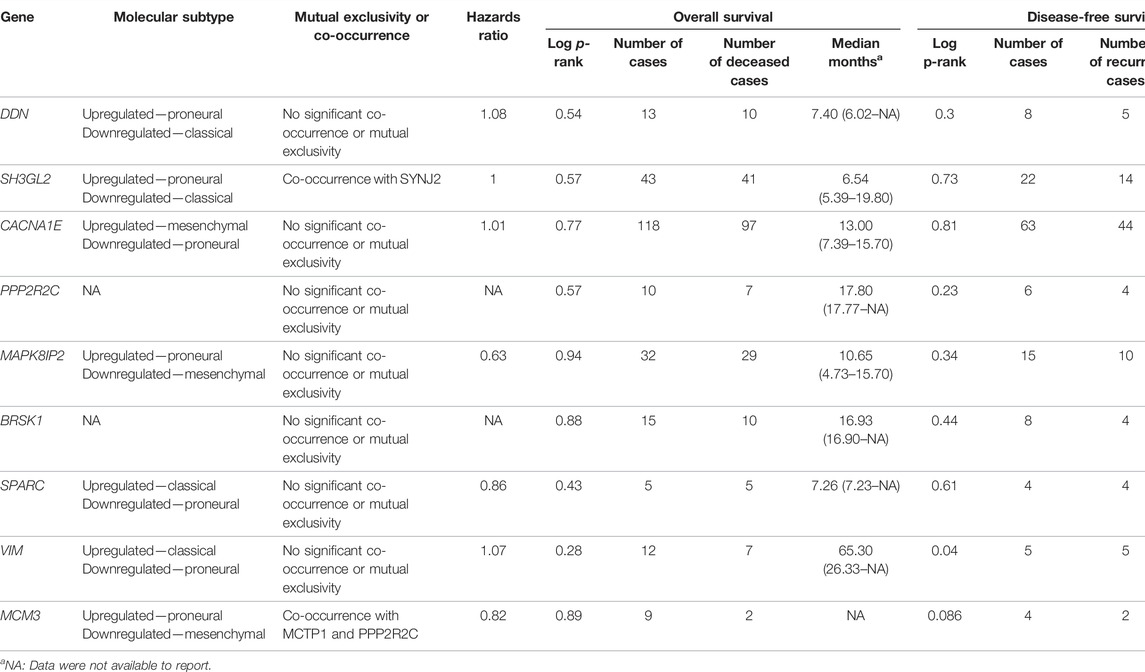
TABLE 5. Survival analysis of the hub genes.
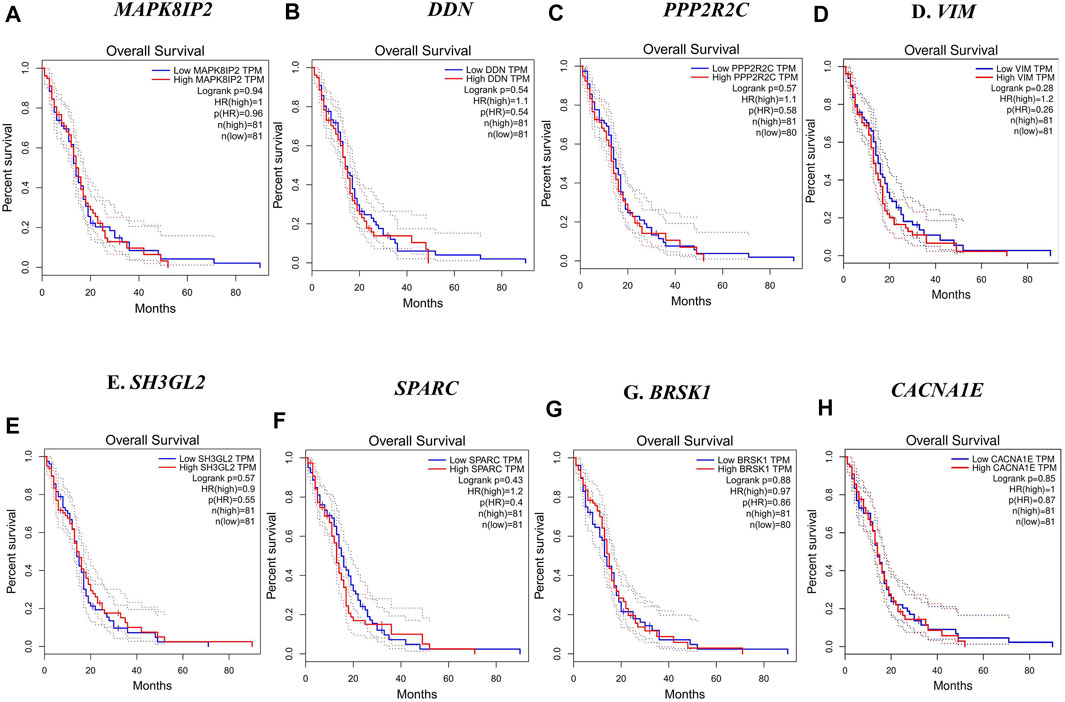
FIGURE 7. Overall survival analysis by Kaplan–Meir plots of the hub genes. (A) Overall survival rate of MAPK8IP2 in GBM patients. (B) Overall survival rate of DDN in GBM patients. (C) Overall survival rate of PPP2R2C in GBM patients. (D) Overall survival rate of VIM in GBM patients. (E) Overall survival rate of SH3GL2 in GBM patients. (F) Overall survival rate of SPARC in GBM patients. (G) Overall survival rate of BRSK1 in GBM patients. (H) Overall survival rate of CACNA1E in GBM patients.
Prediction of Prognostic Potentials of Hub Genes Across GBM Subtypes
The GBM can be classified into three subtypes, namely, proneural, classical, and mesenchymal, based on their prognosis and survival rates. The factors such as inter tumor, intratumor heterogeneity, short survival, and lack of treatment contribute to this classification. According to Verhaak et al. (2010), proneural subtypes are found in less pathological conditions and young patients with better survival and prognosis rate. Recurrent GBM with a high incidence of the tumor, inflammation, and necrosis shifts to mesenchymal types and is considered the worst of all. The classical subtype showed various amplifications, including chromosome 7, deletion of chromosome 10, and lack of p53 mutations. Upon combative radiotherapy and chemotherapy, classical types had a reduced mortality rate (Zhang P et al., 2020). GBM Biodp database enabled the identification of prognostic potentials of the hub genes across the GBM subtypes and their expression levels are represented in Supplementary Figure S1. DDN was identified to be upregulated in the proneural subtype and downregulated in the classical subtype (Sidaway, 2017), while SH3GL2 was upregulated in proneural and downregulated in classical, thus making them good prognostic biomarker candidates. CACNA1E with a hazards ratio of 1.01 was found upregulated in mesenchymal but downregulated in proneural. SPARC with a hazards ratio of 0.86 was observed in higher levels only during the later stages of GBM. They tend to be upregulated in classical and mesenchymal while exhibiting downregulated expressions in proneural. VIM had a higher hazards ratio of 1.07 and was observed upregulated in classical and downregulated in proneural. Both MCM3 and MAPK8IP2 were upregulated in proneural and downregulated in mesenchymal with the potential to act as prognostic biomarkers. When assessing their significant mutual exclusivity and co-occurrence ability filtered with a p-value <0.05, it was found that most of the genes including DDN, SPARC, VIM, BRSK1, PPP2R2C, and MAPK8IP2 were free from mutual exclusivity and co-occurrence. MCM3 was found to be co-occurring with MCTP1 and PPP2R2C, while SH3GL2 co-occurred with SYNJ2. Hence based on the classification of genes at the proneural type four genes, namely, SH3GL2, MCM3, MAPK8IP2, and DDN, have the potential to be suitable biomarker candidates.
Identification of Prognostic Biomarkers Through Pan-Cancer Analysis
We performed a pan-cancer analysis to ascertain the occurrence and expression patterns of hub genes in normal and GBM tissues in comparison to other cancer tissues. Although the SPARC and VIM genes had higher expression rates in GBM, they were found high in other cancer types. In GBM, they can be considered as significantly overexpressed genes. Their upregulation in the mesenchymal and classical subtypes reveals that they are involved in the more aggressive stages of GBM. Four genes, namely, MAPK8IP2, DDN, CACNA1E, and SH3GL2, were significant, with higher expression rates of 345.24 TPM, 7.93 TPM, 21.65 TPM, and 7.92 TPM, respectively, in the normal brain and were significantly lower in GBM with respective expression rates of 24.28 TPM, 1.313 TPM, 0.8 TPM, and 3.06 TPM. In contrast, MCM3 was found to be lowest in the normal brain with 16.09 TPM with a higher expression level of 121.564 TPM. Although MCM3 was upregulated in proneural, it had exceptionally higher levels in GBM than in normal brains. It cannot be ascertained as a biomarker for GBM due to its similar higher expression patterns in various cancers. However, MAPK8IP2 was significantly downregulated in GBM, lower brain grade glioma, and paraganglioma, as compared to the normal brain tissues. MAPK8IP2 also loses its importance as a biomarker for GBM as it is also observed in all other cancer types. The highest expression level of DDN was seen in the normal brain tissues and a distinguishable reduction was observed in GBM. Similar lower levels of DDN were observed only in pheochromocytoma paraganglioma (PCPG), head and neck squamous carcinoma (HNSC), esophageal carcinoma (ESCA), colon adenocarcinoma (COAD), and rectal adenocarcinoma (READ). Apart from GBM, SH3GL2 deviation was marked in the kidney chromophobe tumor (KICH), kidney renal cell carcinoma (KIRC), pancreatic adenocarcinoma (PAAD), prostate adenocarcinoma (PRAD), and sarcoma (SARC). Similar to DDN and MAPK8IP2, only the normal brain tissues had the highest expression of CACNA1E with a marked reduction of expressions in GBM. Lower expression levels of CACNA1E were found in pheochromocytoma, paraganglioma (PCPG), kidney renal clear cell carcinoma (KIRC), and sarcoma (SARC). Interestingly, due to less common occurrence in other cancer types, larger differences in expression rates in GBM than the normal tissue three genes, namely, CACNA1E, DDN, and SH3GL2, Figure 8 can be proposed as potential prognostic biomarkers of GBM. Although the survival rates of patients with DDN and SH3GL2 were lower, they can still be considered putative diagnostic markers in GBM. This is due to the fact that they demonstrated a significant drop in expression rate as compared to the normal brain tissues. Significant overexpression of VIM with high overall survival correlated with previous findings as a strong biomarker of the mesenchymal and classical types of GBM (Shai et al., 2003).
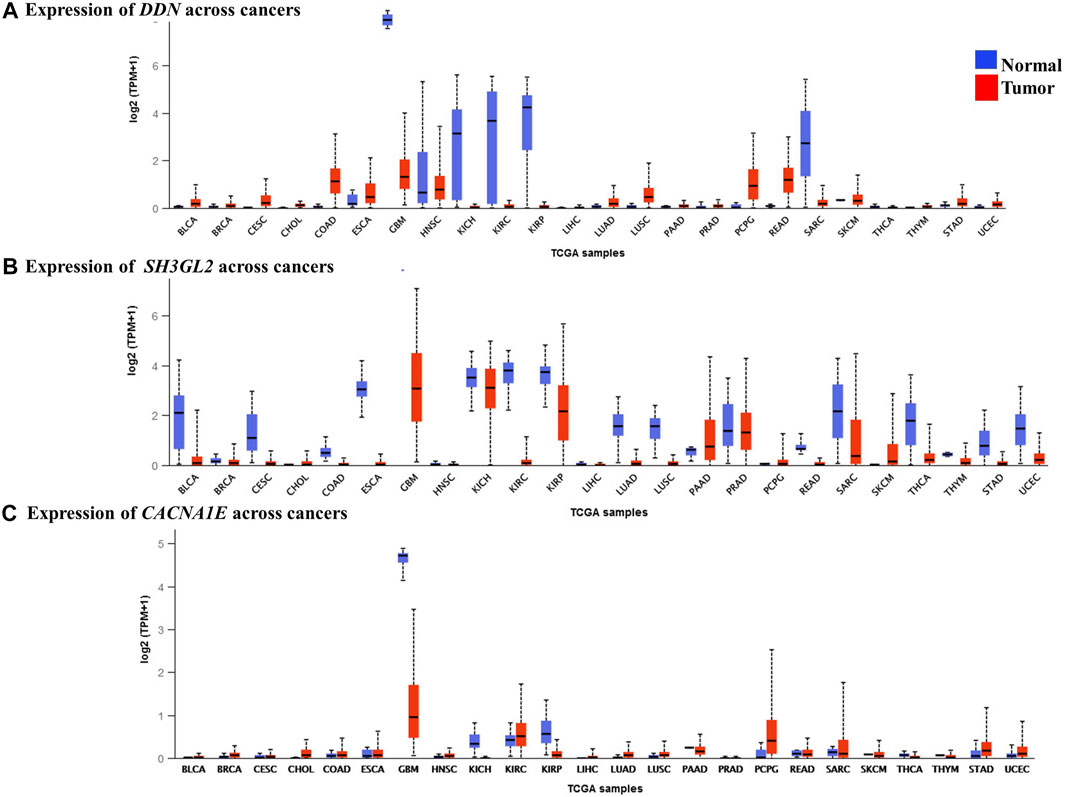
FIGURE 8. Expression levels of the hub genes in pan-cancer tissues. (A) Lower expression levels of DDN observed in GBM. (B) Lower expression levels of SH3GL2 observed in GBM. (C) Lower expression levels of CACNA1E observed in GBM.
Discussion
GBM is the deadliest type of brain tumor. Unfortunately, to date, both the diagnosis and treatment are extremely challenging. In its aggressive form, the blood–brain barrier is disrupted, which worsens the delivery of oncogenic drugs and treatment (Hoelzinger et al., 2005). Elucidation of the molecular biomarkers and pivotal pathways assist in the early detection of the disease progression. In this aspect, computational gene profiling strategies have been advocated for GBM and other cancer types (Piao et al., 2021). In the current study, we have conducted an extensive investigation of the underlying gene expressions in GBM with an aim to identify the key candidate genes and molecular drivers responsible for their progression. Using integrated bioinformatics analysis, we have identified 61 differentially expressed genes (23 upregulated and 38 downregulated genes) by comparing the microarray expression profiles- GSE90604, GSE50161, and GSE134470, obtained from the NCBI-GEO database.
In the subsequent gene ontology analysis, we have identified that the voltage-gated ion channels of calcium, neurotransmitter receptor activities, cell communication, neuronal growth, synaptic transmission, and GABA receptor functions were disrupted in the GBM. Furthermore, the overexpressed immune responses, including interleukin, interferon, and cytokines were significant in GBM along with enhanced DNA replication. The pathway enrichment determined by KEGG and REACTOME for the annotated genes reveals the inter-relationships, interactions, and regulation of how each gene affects the other. Pathways overexpressed by the upregulated DEGs were cell cycle checkpoints, mitotic G1-G1/S phase, DNA replication, immune system signaling of interferons, interleukins, and cytokines, while the downregulated pathways were GABAergic and dopaminergic synaptic transmission, calcium signaling, osteoclast formation, SNARE formation, and methionine salvage pathways.
The detailed functional annotation revealed that the upregulation of DEGs such as HSPG2, SOCS3, DDX58, and CLEC7A was involved in inflammatory response—cytokine, interleukin 6 and 8, and interferon signaling. MCM3 and HELLS responsible for the initiation of DNA replication, replication assembly complex, DNA methylation, and alkylation were enriched, which signifies the escalation of cell proliferation. The rise in cell morphogenesis and endothelial and epithelial cell proliferation was remarkably seen with the upregulated SPARC gene. The intermediate filament vimentin shot up the cellular response to muramyl dipeptide and regulation of collagen metabolism. A surge in neuronal mechanisms such as glial cell differentiation, axon extension, and regulation of myelination and neural precursor cell proliferation was seen due to the enrichment of VIM, SEMA5A, and PTPRZ1. In low-grade glioma, SEMA5A was underexpressed, exhibiting its tumor suppressor nature, but it is compromised in high-grade GBM (X. Li et al., 2012). Remarkable elevation of oligodendrocyte differentiation and angiogenesis were observed in GBM. Functional annotation unraveled the dwindling mechanisms of synaptic transmission, axodendritic transport, neuronal differentiation, postsynaptic membrane potential, transmembrane transport activity, and neuronal plasticity due to the underexpression of DLG2, BRSK1, MAPK8IP2, SHISA7, SV2B, and CACNA1E. All the downregulated DEGs were related to curtailment of brain development, neuronal transport, and synaptic transmission signals. SV2B was found to be differentially expressed in glioma grade II. Both over and underexpression of the gene were previously noted in GBM (Zhang Y et al., 2020). RNA polymerase II cis-regulatory region sequence-specific DNA binding, cognitive function, cellular response to brain-derived neurotrophic factor stimulus, neuron projection development, plasma membrane bounded cell projection organization, and nervous system development were declined with the reduction of their responsible genes—DDN and SH3GL2. The most remarkable pathway of the brain, the phosphatidylinositol biosynthetic process involved in aging, was downregulated due to the phosphatidylinositol 3-kinase (PI3K) dysfunction as seen in many neurodegenerative processes (Thakur & Rattan, 2012).
Protein–protein interaction profiles of the overlapped DEGs with a high confidence score unraveled interesting upregulated and downregulated protein interactions. The 11 upregulated hub genes were identified as CTSK, HSPG2, SPARC, VIM, SOCS3, HELLS, CKAP2, ASPM, MCM3, DDX58, and CLEC7A. Based on their PPI network, 16 downregulated hub genes viz. MAPK8IP2, CACNA1E, BZRAP1, RIMS3, GABRD, DDN, BRSK1, NAP1L2, PPIP5K1, RASL10B, PPP2R2C, SYNJ2, SH3GL2, LICAM, MCTP1, and SV2B were identified. Among them, seven upregulated DEGs— VIM, HELLS, HSPG2, MCM3, ASPM, SPARC, and SOCS3 and three downregulated DEGs—SH3GL2, LICAM, and SYNJ2 exhibited interactions with a high confidence score of 0.7. All the hub genes were validated by comparing their expression patterns in the GBM datasets of TCGA from which the genes PPP2R2C, DDN, SH3GL2, MAPK8IP2, CACNA1E, and BRSK1 were found significantly underexpressed, whereas SPARC, VIM, and MCM3 were highly expressed in both the TCGA datasets (including the TP53 mutant and non-mutant types) and GEO datasets. On the contrary, the genes CTSK, CKAP2, DDX58, and HSPG2 of GBM in TCGA were observed to be significantly overexpressed in comparison to their expressions in GEO datasets. The genes SYNJ2 and RIMS3 were observed to be relatively underexpressed in the TCGA datasets to the GEO datasets. We were also interested in predicting the driver or passenger mutations for the hub genes. We found HSPG2 with 35 VUS had the higher number of mutations followed by ASPM and CACNA1E with 26 mutations each. The mutational frequency of the three genes demands more insight and analysis to be identified as marker genes. CACNA1E, the member of voltage-gated calcium channels, was identified as a significantly downregulated gene and was identified to be one of the unique genes of GBM (Phan et al., 2017). Predominant substitution mutations of the hub genes were inferred to understand if they are benign or damaging.
Furthermore, we have conducted a survival analysis to identify the putative biomarkers of GBM, and a similar approach for biomarker identification has been reported in other studies (Gulluoglu et al., 2018; Gulluoglu et al., 2018; Piao et al., 2021). The overall survival and disease-free survival analysis narrowed down the initially identified hub genes to eight noteworthy genes, namely, SH3GL2, SPARC, MAPK8IP2, DDN, BRSK1, CACNA1E, VIM, and PPP2R2C, whose overall survival rate was greater than five months. VIM, with a log-rank p-value of 0.28, had a better life expectancy of more than five years and their expression levels are strikingly high in GBM.
The most interesting findings of this study are the identification of potential biomarkers in GBM. Genes, namely, PPP2R2C (protein phosphatase regulatory subunit B gamma), SH3GL2 (SH3 domain-containing GRB2-like 2, endophilin A1), BRSK1 (BR serine/threonine kinase 1), DDN (dendrin), CACNA1E (calcium voltage-gated channel subunit alpha1 E), and MAPK8IP2 (mitogen-activated protein kinase 8 interacting protein 2) were harmoniously underexpressed in GBM than in the normal tissues. These genes were also observed to be significantly downregulated in GBM, as indicated by the pan-cancer analysis. Interestingly, as per GeneCards, the PPP2R2C gene was already reported to be involved in cell cycle regulation, beta-adrenergic receptor signaling, and PI3-Akt signaling, as well as being responsible for inflammatory bowel disease (Lizcano et al., 2004). MAPK8IP2 was responsible for AKT, ERK, and MAP signaling pathways and was responsible for spinocerebellar ataxia (Ziats et al., 2019). DDN is a significant gene validated to have a role in causing autism with properties to heal impaired bone density (Cousminer et al., 2018). BRSK1 was reported to be a biomarker for lung large cell carcinoma with a role in LKB1 signaling (Lizcano et al., 2004)). SH3GL2 exhibited an important role in clathrin-mediated endocytosis and its underexpression caused pediatric pilocytic astrocytoma (Yao et al., 2014). Hence, the lower expression levels of the above said five genes correlated with either disruption of signals or causing neurological distress. The two predominant upregulated hub genes, namely, VIM (vimentin) and SPARC (secreted protein acidic and rich in cysteine), showed significantly higher expression rates in GBM than in normal brains. Vimentin (VIM), the major intermediary filament constituent, was associated with neuritogenesis, cell signaling, attachment, and migration, causing congenital cataracts (Griesinger et al., 2013). There is ample evidence on VIM as a potential biomarker or therapeutic candidate for GBM. VIM, a multifunctional protein, exhibits interactions with diverse proteins and ascertains itself to be a marker for highly aggressive and metastatic forms of almost all cancers (Shai et al., 2003). The histochemical profiles of VIM revealed that it was widely distributed in gliomas, cerebellar pilocytic astrocytomas, neurinomas, and endothelial cells of various cancer cells (Schiffer et al., 1986). Higher expression of VIM was attributed to the progression of glioblastoma and was linked to a reduced survival rate (Zhao et al., 2018). Cell surface vimentin on the GBM has been shown to initiate tumors in the adjacent cells, and two monoclonal antibodies 86C and pritumumab were successful to target cell surface vimentin offering promising treatment options to GBM (Noh et al., 2016; Babic et al., 2018). VIM was seen upregulated in the classical and mesenchymal subtypes and evidently the transitions from classical to mesenchymal GBM were correlated to higher expressions of VIM (Schiffer et al., 1986; Herrera-Oropeza et al., 2021). Upregulation of vimentin protein was evident in the proliferation and migration of GBM. The invasion of cancer cells was found to be suppressed by vimentin knockdown strategies (Nowicki et al., 2019). Although pan-cancer analysis showed overexpression of VIM in most cancer types, its overall survival rate was promising, with 65.3 months of life expectancy in patients, thus making it an attractive diagnostic biomarker for aggressive stages of GBM. It is also due to the fact that it has a very high expression rate in mesenchymal and classical subtypes. SPARC, also termed osteonectin, was associated with brittle bone disorder with significance in metastasis and cancer invasion. It was found upregulated in mesenchymal and classical subtypes (Delany et al., 2008) due to which the overall survival rate of SPARC was just 7 months and disease-free survival was 2.2 median months. Similar to VIM, although SPARC was remarkably overexpressed in most cancer types, a ten-fold increased expression seen in GBM makes it crucial (Liu & Lathia, 2016); (Yao et al., 2014); (Herrera-Oropeza et al., 2021). The fact that the expression of DDN and SH3GL2 were attributed to the proneural subtype makes them strong prognostic GBM biomarker candidates. CACNA1E was attributed to the mesenchymal subtype, which is the most aggressive form of GBM, thus making it a significant diagnostic biomarker for GBM. Furthermore, pan-cancer analysis of the hub genes revealed three genes, namely, CACNA1E, DDN, and SH3GL2, which were predominantly downregulated in GBM but not identified in more than five cancer types, could also make them putative prognostic biomarkers for GBM.
There is enough evidence on the prognostic biomarkers of GBM. Putative biomarkers for the GBM stem cells were identified: upregulation of CD133 (encoded by PROM1) is linked to self-renewal of stem cells and resistance to temozolomide (Han et al., 2016), CD44 is found to be involved in tumor cell migration and proliferation (Nishikawa et al., 2018), CD15 (a trisaccharide 3-fucosyl-N-acetyllactosamine) as seen in many cancers is attributed to the GBM grades and survival during hypoxic conditions (Ishii et al., 2021), CD70 (CD27 L—type II transmembrane protein that belongs to the tumor necrosis factor (TNF) receptor family) is attributed to tumor immunosuppression and aggressiveness of GBM (Pratt et al., 2017), S100A4 is a metastasis inducer capable of initiating a tumor and forming spheres of GBM (Liang et al., 2014), ALDH1A3 (aldehyde dehydrogenases) is linked to tumor proliferation in multiple cancers (Fedele et al., 2019), nanog (homeodomain transcription factor) is linked to low survival in both low- and high-grade glioma (Elsir et al., 2014), OCT-4 (octamer-binding protein transcription factor 4) is found to be upregulated in the hypoxic conditions of GBM (Krogh Petersen et al., 2016), SOX-2 (sex-determining region Y) is found to have an increased expression in GBM stem cells linked to the growth of tumors and relapse after chemo and radiotherapy (Ren et al., 2016), and nestin (an intermediate filament) is attributed to tumor initiation, angiogenesis, metastasis, and aggressive growth (Nowak et al., 2018). Although several putative prognostic biomarkers for GBM are already predicted, they are found in multiple cancer types (Hassn Mesrati et al., 2020). Mutations on IDH1 (isocitrate dehydrogenase) were considered significant with prognostic benefits, while deletion of CDKN2A (cyclin-dependent kinase inhibitor 2A) in IDH mutants was a marker for malignancy. TERT (telomerase and reverse transcriptase) promoter mutations, H3F3A (replication-independent histone 3.3 linked to high-grade gliomas) alterations, and methylation of MGMT (O6-methylguanine-DNA methyltransferase) promoters were proposed as potential markers of GBM (Śledzińska et al., 2021). The potential prognostic biomarkers, namely, epidermal growth factor (EGFR), p53 (tumor suppressor protein), platelet-derived growth factor receptor (PDGFR), phosphoinositide 3-kinase (PI3K), phosphatase and tensin homolog (PTEN), and 1p/19q (codeletion of chromosomes 1p and 19q) have also been identified, but they failed to achieve prognostic effect in the clinical studies (Karsy, 2015). Nanoparticle protein typing of the extracellular vesicles revealed the protein markers EGFR (epidermal growth factor receptor), IDH1, PDPN (podoplanin), TGFB (transforming growth factor-beta), IL-8 (interleukin 8), TIMP1 (TIMP metallopeptidase inhibitor 1), and ZAP70 (zeta chain-associated protein kinase 70). According to GBM subtype classification, chromosome 7 amplification together with the deletion of chromosome 10 and EGFR amplification, were identified as a classical GBM (Verhaak et al., 2010). Mesenchymal GBM showed mutations in neurofibromatosis type 1 (NF1) with the upregulation of necrosis and inflammation genes (Fadhlullah et al., 2019). Proneural subtype GBM was marked with IDH1 point mutations and platelet-derived growth factor receptor alpha (PDGFRA) aberrations (Verhaak et al., 2010). Sequencing of the circulating tumor DNAs revealed the presence of mutations in IDH1, IDH2, TP53, TERT, ATRX (nuclear alpha-thalassemia/mental retardation X-linked syndrome), H3F3A, and HIST1H3B mutations claiming them to be significant biomarkers of GBM. The drawback of the predicted circulating tumor DNAs is that they are very rarely detected. SH3GL2, a tumor suppressor gene widely prevalent in the central nervous system, was identified to be downregulated by the miRNA biomarker—mir330, thereby causing malignancy in GBM (Yao et al., 2014). Although there were a remarkable number of biomarkers already reported, they either failed to exhibit prognostic effects in clinical studies or were invariably seen in many cancer types, making them futile.
Altogether, through this study, we provide sufficient background for the genes SH3GL2, DDN, and CACNA1E to be the potential putative prognostic biomarker candidates of GBM. BRSK1, PPP2R2C, and MAPK8IP2 with striking lower expression levels and better survival rates can also play a role in the early diagnosis of GBM. The study evaluated the biomarkers in comparison with GEO datasets, TCGA datasets, and the Pan-Cancer Analysis of Whole Genomes datasets adding strong validation to the predicted biomarkers.
Conclusion
This study sheds light on the identification of the key molecular drivers of GBM. The study elucidated putative prognostic biomarkers through a top–down integrated bioinformatics approach. Through this study, we have predicted novel GBM biomarkers DDN and SH3GL2 along with the already reported VIM, CACNA1E, and SPARC genes. It provides a promising preliminary investigation that employs multiple steps of validation right from the comparison of expression levels between normal and GBM brain tissues to predicting the prognostic potential based on the GBM subtypes. Further biological validation will be more valuable. Also, the clinical examination of the hub genes will endorse the prognostic biomarker candidates obtained through this study.
Data Availability Statement
The original contributions presented in the study are included in the article/Supplementary Material, further inquiries can be directed to the corresponding author.
Author Contributions
QL: idea, conceptualization, and first draft; SA: execution and analysis; J-PL: writing and figures; DX-P: writing and proofreading; and J-PS: funding, correspondence, and final manuscript. All the authors reviewed the manuscript.
Funding
This work is funded by Hwa Mei Hospital, University of Chinese Academy of Sciences.
Conflict of Interest
The authors declare that the research was conducted in the absence of any commercial or financial relationships that could be construed as a potential conflict of interest.
Publisher’s Note
All claims expressed in this article are solely those of the authors and do not necessarily represent those of their affiliated organizations, or those of the publisher, the editors and the reviewers. Any product that may be evaluated in this article, or claim that may be made by its manufacturer, is not guaranteed or endorsed by the publisher.
Acknowledgments
The authors acknowledge Hwa Mei Hospital, University of Chinese Academy of Sciences, and Stella Maris College, Chennai, India for their constant support.
Supplementary Material
The Supplementary Material for this article can be found online at: https://www.frontiersin.org/articles/10.3389/fgene.2022.832742/full#supplementary-material
Supplementary Figure S1 | Box plots representing the expression levels of hub genes classified into the subtypes of GBM—proneural (P) in pink, classical (C) in blue, and mesenchymal (M) in red. (A) Expression of DDN in three aggregate datasets classified as C, M, and P. (B) Expression of MAPK8IP2 in three aggregate datasets classified as C, M, and P. (C) Expression of MCM3 in three aggregate datasets classified as C, M, and P. (D) Expression of VIM in three aggregate datasets classified as C, M, and P. (E) Expression of CACNA1E in three aggregate datasets classified as C, M, and P. (F) Expression of SPARC in three aggregate datasets classified as C, M, and P.
References
Babic, I., Nurmemmedov, E., Yenugonda, V. M., Juarez, T., Nomura, N., Pingle, S. C., et al. (2018). Pritumumab, the First Therapeutic Antibody for Glioma Patients. Hum. Antibodies 26 (2), 95–101. doi:10.3233/HAB-170326
Banu, Z. (2019). Glioblastoma Multiforme: a Review of its Pathogenesis and Treatment. Int. Res. J. Pharm. 9 (Issue 12), 7–12. doi:10.7897/2230-8407.0912283
Bindea, G., Mlecnik, B., Hackl, H., Charoentong, P., Tosolini, M., Kirilovsky, A., et al. (2009). ClueGO: a Cytoscape Plug-In to Decipher Functionally Grouped Gene Ontology and Pathway Annotation Networks. Bioinformatics 25 (8), 1091–1093. doi:10.1093/bioinformatics/btp101
Bo, L., Wei, B., Wang, Z., Li, C., Gao, Z., and Miao, Z. (2018). Bioinformatic Analysis of Gene Expression Profiling of Intracranial Aneurysm. Mol. Med. Rep. 17 (3), 3473–3480. doi:10.3892/mmr.2017.8367
Chandrashekar, D. S., Bashel, B., Balasubramanya, S. A. H., Creighton, C. J., Ponce-Rodriguez, I., Chakravarthi, B. V. S. K., et al. (2017). UALCAN: A Portal for Facilitating Tumor Subgroup Gene Expression and Survival Analyses. Neoplasia 19 (8), 649–658. doi:10.1016/j.neo.2017.05.002
Chang, S. M., Theodosopoulos, P., Lamborn, K., Malec, M., Rabbitt, J., Page, M., et al. (2004). Temozolomide in the Treatment of Recurrent Malignant Glioma. Cancer 100 (3), 605–611. doi:10.1002/cncr.11949
Cheng, J.-X., Min, W., Ozeki, Y., and Polli, D. (2021). Stimulated Raman Scattering Microscopy: Techniques and Applications. Elsevier.
Cousminer, D. L., Mitchell, J. A., Chesi, A., Roy, S. M., Kalkwarf, H. J., Lappe, J. M., et al. (2018). Genetically Determined Later Puberty Impacts Lowered Bone Mineral Density in Childhood and Adulthood. J. Bone Miner Res. 33 (3), 430–436. doi:10.1002/jbmr.3320
Croft, D., O'Kelly, G., Wu, G., Haw, R., Gillespie, M., Matthews, L., et al. (2011). Reactome: a Database of Reactions, Pathways and Biological Processes. Nucleic Acids Res. 39, D691–D697. doi:10.1093/nar/gkq1018
Delany, A. M., McMahon, D. J., Powell, J. S., Greenberg, D. A., and Kurland, E. S. (2008). Osteonectin/SPARC Polymorphisms in Caucasian Men with Idiopathic Osteoporosis. Osteoporos. Int. A J. Established as Result Cooperation between Eur. Found. Osteoporos. Natl. Osteoporos. Found. USA 19 (7), 969–978. doi:10.1007/s00198-007-0523-9
Dennis, G., Sherman, B. T., Hosack, D. A., Yang, J., Gao, W., Lane, H. C., et al. (2003). DAVID: Database for Annotation, Visualization, and Integrated Discovery. Genome Biol. 4 (5), P3. doi:10.1186/gb-2003-4-5-p3
Dubois, L. G., Campanati, L., Righy, C., D’Andrea-Meira, I., Spohr, T. C. L. de. S. E., Porto-Carreiro, I., et al. (2014). Gliomas and the Vascular Fragility of the Blood Brain Barrier. Front. Cell Neurosci. 8, 418. doi:10.3389/fncel.2014.00418
Elsir, T., Edqvist, P.-H., Carlson, J., Ribom, D., Bergqvist, M., Ekman, S., et al. (2014). A Study of Embryonic Stem Cell-Related Proteins in Human Astrocytomas: Identification of Nanog as a Predictor of Survival. Int. J. Cancer 134 (5), 1123–1131. doi:10.1002/ijc.28441
Fadhlullah, S. F. B., Halim, N. B. A., Yeo, J. Y. T., Ho, R. L. Y., Um, P., Ang, B. T., et al. (2019). Pathogenic Mutations in Neurofibromin Identifies a Leucine-Rich Domain Regulating Glioma Cell Invasiveness. Oncogene 38 (27), 5367–5380. doi:10.1038/s41388-019-0809-3
Fedele, M., Cerchia, L., Pegoraro, S., Sgarra, R., and Manfioletti, G. (2019). Proneural-Mesenchymal Transition: Phenotypic Plasticity to Acquire Multitherapy Resistance in Glioblastoma. Int. J. Mol. Sci. 20 (11), 2746. doi:10.3390/ijms20112746
Friedman, H. S., Prados, M. D., Wen, P. Y., Mikkelsen, T., Schiff, D., Abrey, L. E., et al. (2009). Bevacizumab Alone and in Combination with Irinotecan in Recurrent Glioblastoma. J. Clin. Oncol. Official J. Am. Soc. Clin. Oncol. 27 (28), 4733–4740. doi:10.1200/jco.2008.19.8721
Golebiewska, A., Hau, A.-C., Oudin, A., Stieber, D., Yabo, Y. A., Baus, V., et al. (2020). Patient-derived Organoids and Orthotopic Xenografts of Primary and Recurrent Gliomas Represent Relevant Patient Avatars for Precision Oncology. Acta Neuropathologica 140 (6), 919–949. doi:10.1007/s00401-020-02226-7
Griesinger, A. M., Birks, D. K., Donson, A. M., Amani, V., Hoffman, L. M., Waziri, A., et al. (2013). Characterization of Distinct Immunophenotypes across Pediatric Brain Tumor Types. J. Immunol. 191 (9), 4880–4888. doi:10.4049/jimmunol.1301966
Gulluoglu, S., Tuysuz, E. C., Sahin, M., Kuskucu, A., Kaan Yaltirik, C., Ture, U., et al. (2018). Simultaneous miRNA and mRNA Transcriptome Profiling of Glioblastoma Samples Reveals a Novel Set of OncomiR Candidates and Their Target Genes. Brain Res. 1700, 199–210. doi:10.1016/j.brainres.2018.08.035
Han, M., Guo, L., Zhang, Y., Huang, B., Chen, A., Chen, W., et al. (2016). Clinicopathological and Prognostic Significance of CD133 in Glioma Patients: A Meta-Analysis. Mol. Neurobiol. 53 (1), 720–727. doi:10.1007/s12035-014-9018-9
Hassn Mesrati, M., Behrooz, A. B., Y Abuhamad, A., and Syahir, A. (2020). Understanding Glioblastoma Biomarkers: Knocking a Mountain with a Hammer. Cells 9 (5), 1236. doi:10.3390/cells9051236
Herrera-Oropeza, G. E., Angulo-Rojo, C., Gástelum-López, S. A., Varela-Echavarría, A., Hernández-Rosales, M., and Aviña-Padilla, K. (2021). Glioblastoma Multiforme: a Multi-Omics Analysis of Driver Genes and Tumour Heterogeneity. Interf. Focus 11 (4), 20200072. doi:10.1098/rsfs.2020.0072
Hoelzinger, D. B., Mariani, L., Weis, J., Woyke, T., Berens, T. J., McDonough, W. S., et al. (2005). Gene Expression Profile of Glioblastoma Multiforme Invasive Phenotype Points to New Therapeutic Targets. Neoplasia 7 (1), 7–16. doi:10.1593/neo.04535
Hsu, J. B.-K., Chang, T.-H., Lee, G. A., Lee, T.-Y., and Chen, C.-Y. (2019). Identification of Potential Biomarkers Related to Glioma Survival by Gene Expression Profile Analysis. BMC Med. Genomics 11 (Suppl. 7), 34. doi:10.1186/s12920-019-0479-6
ICGC/TCGA Pan-Cancer Analysis of Whole Genomes Consortium (2020). Pan-cancer Analysis of Whole Genomes. Nature 578 (7793), 82–93. doi:10.1038/s41586-020-1969-6
Ishii, H., Mimura, Y., Zahra, M. H., Katayama, S., Hassan, G., Afify, S. M., et al. (2021). Isolation and Characterization of Cancer Stem Cells Derived from Human Glioblastoma. Am. J. Cancer Res. 11 (2), 441–457.
Jimenez-Pascual, A., Hale, J. S., Kordowski, A., Pugh, J., Silver, D. J., Bayik, D., et al. (2019). ADAMDEC1 Maintains a Growth Factor Signaling Loop in Cancer Stem Cells. Cancer Discov. 9 (11), 1574–1589. doi:10.1158/2159-8290.cd-18-1308
Kanehisa, M., and Goto, S. (2000). KEGG: Kyoto Encyclopedia of Genes and Genomes. Nucleic Acids Res. 28 (1), 27–30. doi:10.1093/nar/28.1.27
Karsy, M. (2015). Erratum: A Practical Review of Prognostic Correlations of Molecular Biomarkers in Glioblastoma. Neurosurg. Focus 38 (6), E13. doi:10.3171/2015.4.focus14755a
Kreisl, T. N., Kim, L., Moore, K., Duic, P., Royce, C., Stroud, I., et al. (2009). Phase II Trial of Single-Agent Bevacizumab Followed by Bevacizumab Plus Irinotecan at Tumor Progression in Recurrent Glioblastoma. J. Clin. Oncol. Official J. Am. Soc. Clin. Oncol. 27 (5), 740–745. doi:10.1200/jco.2008.16.3055
Krogh Petersen, J., Jensen, P., Dahl Sørensen, M., and Winther Kristensen, B. (2016). Expression and Prognostic Value of Oct-4 in Astrocytic Brain Tumors. PLoS One 11 (12), e0169129. doi:10.1371/journal.pone.0169129
Li, H., Wei, N., Ma, Y., Wang, X., Zhang, Z., Zheng, S., et al. (2020). Integrative Module Analysis of HCC Gene Expression Landscapes. Exp. Ther. Med. 19 (3), 1779–1788. doi:10.3892/etm.2020.8437
Li, X., Law, J. W. S., and Lee, A. Y. W. (2012). Semaphorin 5A and Plexin-B3 Regulate Human Glioma Cell Motility and Morphology through Rac1 and the Actin Cytoskeleton. Oncogene 31 (5), 595–610. doi:10.1038/onc.2011.256
Liang, J., Piao, Y., Holmes, L., Fuller, G. N., Henry, V., Tiao, N., et al. (2014). Neutrophils Promote the Malignant Glioma Phenotype through S100A4. Clin. Cancer Res. Official J. Am. Assoc. Cancer Res. 20 (1), 187–198. doi:10.1158/1078-0432.ccr-13-1279
Liu, H., and Lathia, J. D. (2016). Cancer Stem Cells: Targeting the Roots of Cancer, Seeds of Metastasis, and Sources of Therapy Resistance. Elsevier.
Lizcano, J. M., Göransson, O., Toth, R., Deak, M., Morrice, N. A., Boudeau, J., et al. (2004). LKB1 Is a Master Kinase that Activates 13 Kinases of the AMPK Subfamily, Including MARK/PAR-1. EMBO J. 23 (4), 833–843. doi:10.1038/sj.emboj.7600110
Mamelak, A. N., and Jacoby, D. B. (2007). Targeted Delivery of Antitumoral Therapy to Glioma and Other Malignancies with Synthetic Chlorotoxin (TM-601). Expert Opin. Drug Deliv. 4 (2), 175–186. doi:10.1517/17425247.4.2.175
Mao, H., Lebrun, D. G., Yang, J., Zhu, V. F., and Li, M. (2012). Deregulated Signaling Pathways in Glioblastoma Multiforme: Molecular Mechanisms and Therapeutic Targets. Cancer Invest. 30 (1), 48–56. doi:10.3109/07357907.2011.630050
Mishra, N. K., Southekal, S., and Guda, C. (2019). Survival Analysis of Multi-Omics Data Identifies Potential Prognostic Markers of Pancreatic Ductal Adenocarcinoma. Front. Genet. 10, 624. doi:10.3389/fgene.2019.00624
Müller Bark, J., Kulasinghe, A., Chua, B., Day, B. W., and Punyadeera, C. (2020). Circulating Biomarkers in Patients with Glioblastoma. Br. J. Cancer 122 (3), 295–305. doi:10.1038/s41416-019-0603-6
Nishikawa, M., Inoue, A., Ohnishi, T., Kohno, S., Ohue, S., Matsumoto, S., et al. (2018). Significance of Glioma Stem-like Cells in the Tumor Periphery that Express High Levels of CD44 in Tumor Invasion, Early Progression, and Poor Prognosis in Glioblastoma. Stem Cell Int. 2018, 5387041. doi:10.1155/2018/5387041
Noh, H., Yan, J., Hong, S., Kong, L.-Y., Gabrusiewicz, K., Xia, X., et al. (2016). Discovery of Cell Surface Vimentin Targeting mAb for Direct Disruption of GBM Tumor Initiating Cells. Oncotarget 7 (44), 72021–72032. doi:10.18632/oncotarget.12458
Nowak, A., Grzegrzółka, J., Kmiecik, A., Piotrowska, A., Matkowski, R., and Dzięgiel, P. (2018). Role of Nestin Expression in Angiogenesis and Breast Cancer Progression. Int. J. Oncol. 52 (2), 527–535. doi:10.3892/ijo.2017.4223
Nowicki, M. O., Hayes, J. L., Chiocca, E. A., and Lawler, S. E. (2019). Proteomic Analysis Implicates Vimentin in Glioblastoma Cell Migration. Cancers 11 (4), 466. doi:10.3390/cancers11040466
Papatheodorou, I., Moreno, P., Manning, J., Fuentes, A. M.-P., George, N., Fexova, S., et al. (2020). Expression Atlas Update: from Tissues to Single Cells. Nucleic Acids Res. 48 (D1), D77–D83. doi:10.1093/nar/gkz947
Pearson, J. R. D., and Regad, T. (2017). Targeting Cellular Pathways in Glioblastoma Multiforme. Signal. Transduction Targeted Ther. 2, 17040. doi:10.1038/sigtrans.2017.40
Pellegrini, M., Baglioni, M., and Geraci, F. (2016). Protein Complex Prediction for Large Protein Protein Interaction Networks with the Core&Peel Method. BMC Bioinformatics 17 (Suppl. 12), 372. doi:10.1186/s12859-016-1191-6
Phan, N. N., Wang, C.-Y., Chen, C.-F., Sun, Z., Lai, M.-D., and Lin, Y.-C. (2017). Voltage-gated Calcium Channels: Novel Targets for Cancer Therapy. Oncol. Lett. 14 (2), 2059–2074. doi:10.3892/ol.2017.6457
Piao, C., Zhang, Q., Xu, J., Wang, Y., Liu, T., Ma, H., et al. (2021). Optimal Intervention Time of ADSCs for Hepatic Ischemia-Reperfusion Combined with Partial Resection Injury in Rats. Life Sci. 285, 119986. doi:10.1016/j.lfs.2021.119986
Pratt, D., Pittaluga, S., Palisoc, M., Fetsch, P., Xi, L., Raffeld, M., et al. (2017). Expression of CD70 (CD27L) Is Associated with Epithelioid and Sarcomatous Features in IDH-wild-type Glioblastoma. J. Neuropathol. Exp. Neurol. 76 (8), 697–708. doi:10.1093/jnen/nlx051
Ren, Z.-H., Zhang, C.-P., and Ji, T. (2016). Expression of SOX2 in Oral Squamous Cell Carcinoma and the Association with Lymph Node Metastasis. Oncol. Lett. 11 (3), 1973–1979. doi:10.3892/ol.2016.4207
Sarkaria, J. N., Hu, L. S., Parney, I. F., Pafundi, D. H., Brinkmann, D. H., Laack, N. N., et al. (2018). Is the Blood-Brain Barrier Really Disrupted in All Glioblastomas? A Critical Assessment of Existing Clinical Data. Neuro-Oncology 20 (2), 184–191. doi:10.1093/neuonc/nox175
Sasmita, A. O., Wong, Y. P., and Ling, A. P. K. (2018). Biomarkers and Therapeutic Advances in Glioblastoma Multiforme. Asia-Pacific J. Clin. Oncol. 14 (1), 40–51. doi:10.1111/ajco.12756
Schiffer, D., Giordana, M. T., Mauro, A., Migheli, A., Germano, I., and Giaccone, G. (1986). Immunohistochemical Demonstration of Vimentin in Human Cerebral Tumors. Acta Neuropathologica 70 (3-4), 209–219. doi:10.1007/BF00686074
Shai, R., Shi, T., Kremen, T. J., Horvath, S., Liau, L. M., Cloughesy, T. F., et al. (2003). Gene Expression Profiling Identifies Molecular Subtypes of Gliomas. Oncogene 22 (31), 4918–4923. doi:10.1038/sj.onc.1206753
Shergalis, A., Bankhead, A., Luesakul, U., Muangsin, N., and Neamati, N. (2018). Current Challenges and Opportunities in Treating Glioblastoma. Pharmacol. Rev. 70 (3), 412–445. doi:10.1124/pr.117.014944
Sidaway, P. (2017). CNS Cancer: Glioblastoma Subtypes Revisited. Nat. Rev. Clin. Oncol. 14 (10), 587. doi:10.1038/nrclinonc.2017.122
Silantyev, A. S., Falzone, L., Libra, M., Gurina, O. I., Kardashova, K. S., Nikolouzakis, T. K., et al. (2019). Current and Future Trends on Diagnosis and Prognosis of Glioblastoma: From Molecular Biology to Proteomics. Cells 8 (8), 863. doi:10.3390/cells8080863
Śledzińska, P., Bebyn, M. G., Furtak, J., Kowalewski, J., and Lewandowska, M. A. (2021). Prognostic and Predictive Biomarkers in Gliomas. Int. J. Mol. Sci. 22 (19), 10373. doi:10.3390/ijms221910373
Szklarczyk, D., Morris, J. H., Cook, H., Kuhn, M., Wyder, S., Simonovic, M., et al. (2017). The STRING Database in 2017: Quality-Controlled Protein-Protein Association Networks, Made Broadly Accessible. Nucleic Acids Res. 45 (D1), D362–D368. doi:10.1093/nar/gkw937
Tang, H., and Zhang, Y. (2018). Identification and Bioinformatics Analysis of Overlapping Differentially Expressed Genes in Depression, Papillary Thyroid Cancer and Uterine Fibroids. Exp. Ther. Med. 15 (6), 4810–4816. doi:10.3892/etm.2018.6023
Thakur, M. K., and Rattan, S. I. S. (2012). Brain Aging and Therapeutic Interventions. Springer Science & Business Media.
Tomczak, K., Czerwińska, P., and Wiznerowicz, M. (2015). Review the Cancer Genome Atlas (TCGA): an Immeasurable Source of Knowledge. Współczesna Onkologia 1A, 68–77. doi:10.5114/wo.2014.47136
Verhaak, R. G. W., Hoadley, K. A., Purdom, E., Wang, V., Qi, Y., Wilkerson, M. D., et al. Cancer Genome Atlas Research Network (2010). Integrated Genomic Analysis Identifies Clinically Relevant Subtypes of Glioblastoma Characterized by Abnormalities in PDGFRA, IDH1, EGFR, and NF1. Cancer Cell 17 (1), 98–110. doi:10.1016/j.ccr.2009.12.020
Yan, H., Zheng, G., Qu, J., Liu, Y., Huang, X., Zhang, E., et al. (2019). Identification of Key Candidate Genes and Pathways in Multiple Myeloma by Integrated Bioinformatics Analysis. J. Cell Physiol. 234 (12), 23785–23797. doi:10.1002/jcp.28947
Yao, Y., Xue, Y., Ma, J., Shang, C., Wang, P., Liu, L., et al. (2014). MiR-330-Mediated Regulation of SH3GL2 Expression Enhances Malignant Behaviors of Glioblastoma Stem Cells by Activating ERK and PI3K/AKT Signaling Pathways. PLoS ONE 9 (4), e95060. doi:10.1371/journal.pone.0095060
Yin, W., Tang, G., Zhou, Q., Cao, Y., Li, H., Fu, X., et al. (2019). Expression Profile Analysis Identifies a Novel Five-Gene Signature to Improve Prognosis Prediction of Glioblastoma. Front. Genet. 10, 419. doi:10.3389/fgene.2019.00419
Zhang, P., Xia, Q., Liu, L., Li, S., and Dong, L. (2020). Current Opinion on Molecular Characterization for GBM Classification in Guiding Clinical Diagnosis, Prognosis, and Therapy. Front. Mol. Biosciences 7, 562798. doi:10.3389/fmolb.2020.562798
Zhang, Y., Yang, X., Zhu, X.-L., Hao, J.-Q., Bai, H., Xiao, Y.-C., et al. (2020). Bioinformatics Analysis of Potential Core Genes for Glioblastoma. Biosci. Rep. 40 (7), BSR20201625. doi:10.1042/BSR20201625
Zhao, J., Zhang, L., Dong, X., Liu, L., Huo, L., and Chen, H. (2018). High Expression of Vimentin Is Associated with Progression and a Poor Outcome in Glioblastoma. Appl. Immunohistochem. Mol. Morphol. 26 (5), 337–344. doi:10.1097/pai.0000000000000420
Keywords: glioblastoma, hub genes, survival analysis, biomarkers, gene ontology, gene expression
Citation: Li Q, Aishwarya S, Li J-P, Pan D-X and Shi J-P (2022) Gene Expression Profiling of Glioblastoma to Recognize Potential Biomarker Candidates. Front. Genet. 13:832742. doi: 10.3389/fgene.2022.832742
Received: 10 December 2021; Accepted: 23 March 2022;
Published: 27 April 2022.
Edited by:
Elzbieta Pluciennik, Medical University of Lodz, PolandReviewed by:
Katarzyna Kośla, Medical University of Lodz, PolandKatia Aviña-Padilla, National Autonomous University of Mexico, Mexico
Copyright © 2022 Li, Aishwarya, Li, Pan and Shi. This is an open-access article distributed under the terms of the Creative Commons Attribution License (CC BY). The use, distribution or reproduction in other forums is permitted, provided the original author(s) and the copyright owner(s) are credited and that the original publication in this journal is cited, in accordance with accepted academic practice. No use, distribution or reproduction is permitted which does not comply with these terms.
*Correspondence: Jia-Pei Shi, c2hpamlhcGVpMjAyMEAxMjYuY29t