
95% of researchers rate our articles as excellent or good
Learn more about the work of our research integrity team to safeguard the quality of each article we publish.
Find out more
ORIGINAL RESEARCH article
Front. Genet. , 25 March 2022
Sec. Genomics of Plants and the Phytoecosystem
Volume 13 - 2022 | https://doi.org/10.3389/fgene.2022.830644
This article is part of the Research Topic Genetic Validation and its Role in Crop Improvement View all 19 articles
 Yousheng Tian1,2†
 Wei Sang3†Pengpeng Liu3
 Jindong Liu4Jishan Xiang3Fengjuan Cui3Hongjun Xu3Xinnian Han3
 Yingbin Nie3Dezhen Kong3Weihua Li1*Peiyuan Mu3*
In order to understand the genetic basis of starch pasting viscosity characteristics of Chinese spring wheat, we assessed the genetic variation of RVA parameters determined by the Rapid Visco Analyser in a panel of 192 Chinese spring wheat accessions grown in Er’shi, Shihezi and Zhaosu during 2012 and 2013 cropping seasons. A genome-wide association study with 47,362 single nucleotide polymorphism (SNP) markers was conducted to detect marker-trait associations using mixed linear model. Phenotypic variations of RVA parameters ranged from 1.6 to 30.7% and broad-sense heritabilities ranged from 0.62 to 0.91. Forty-one SNP markers at 25 loci were significantly associated with seven RVA traits in at least two environments; among these, 20 SNPs were located in coding sequences (CDS) of 18 annotation genes, which can lead to discovering novel genes underpinning starch gelatinization in spring wheat. Haplotype analysis revealed one block for breakdown (BD) on chromosome 3B and two blocks for pasting temperature (T) on chromosome 7B. Cultivars with superior haplotypes at these loci showed better starch pasting viscosity than the average of all cultivars surveyed. The identified loci and associated markers provide valuable sources for future functional characterization and genetic improvement of starch quality in wheat.
Wheat (Triticum aestivum L.) is one of the most important staple food crops worldwide. With the improvement of living standards, people pay more attention to the quality of end-use products of wheat. Improvement of quality traits has become a major objective in wheat breeding (Kong et al., 2013). The gelatinization characteristic of wheat flour is a main index to evaluate the processing quality of food products (Crosbie, 1991; Panozzo et al., 1993; Liu et al., 2003; Kaur et al., 2016; Amiri et al., 2018; Moiraghi et al., 2019). Rapid Visco Analyser (RVA) profile has proven useful in wheat breeding programs to assess the eating and cooking quality of wheat (Konik et al., 1992; He et al., 2003; He et al., 2004; Zhang et al., 2004; Zhang et al., 2005; León et al., 2006). Starch pasting viscosity is controlled by multiple genes and often influenced by environments (Zhang et al., 2009), the traditional methods for assessing RVA parameters are laborious and need expensive equipment. The use of molecular markers for an indirect marker-assisted selection (MAS) is effective in selection for quality traits in breeding process. Therefore, it is important to study the genetic basis of starch gelatinization for wheat quality improvement using MAS.
Previous studies have been heading for localizing genes and QTL for starch gelatinization characteristics to expedite MAS in wheat breeding (Udall et al., 1999; Araki et al., 2000; Deng et al., 2014). However, QTL identified by bi-parent populations cannot explain the variation of starch gelatinization characteristics in complex genetic population due to relatively simple genetic background and lower allele variability. The genome-wide association study (GWAS) can identify genomic regions associated with variations in a given trait by combining phenotypic with genotypic data (AL-Maskri et al., 2012). Compared with conventional bi-parental QTL mapping, GWAS has the advantage of surveying a larger range of allelic variations and avoiding a time-consuming process for establishing a customized mapping population (Tadesse et al., 2015). Because of having more genetic diversity and historical recombination of alleles among associated panels, GWAS can get more accurate results (Muhu-Din Ahmed et al., 2020). With development of sequencing technology, high-density wheat SNP arrays have been developed, which combined with GWAS were widely used to identify genetic loci for important traits in hexaploid wheat (Sukumaran et al., 2015; Sun et al., 2017; Rimbert et al., 2018; Zhang et al., 2018; Yan et al., 2019; Lv et al., 2020; Shi et al., 2020), especially for quality-related traits, such as grain protein content, wet gluten content, grain starch content, SDS-sedimentation volume, dough rheological properties, and so on (Muqaddasi et al., 2020; Yang et al., 2020; Muhu-Din Ahmed et al., 2020), but none for starch pasting properties.
Herein, we performed a GWAS to identify genetic loci for RVA parameters using the wheat 90K SNP array and multi-environment field data in a panel of 192 Chinese spring wheat genotypes. Markers significantly associated with RVA parameters and candidate genes were identified. The results of this study can enhance our understanding of the genetic basis of wheat starch gelatinization and provide valuable information for MAS in wheat breeding.
A set of 192 genetically diverse spring wheat accessions, representing cultivars and breeding lines from different provinces of China, was grown at Er’shi, Shihezi and Zhaosu in Xinjiang province in randomized complete blocks with three replications during 2012 and 2013 cropping seasons (hereafter referred as 2012_ES, 2012_SHZ, 2012_ZS, 2013_ES, 2013_SHZ and 2013_ZS, respectively). Each genotype was sown in ten rows, with a row length of 3 m, a row-to-row distance of 25 cm and plant-to-plant distance of 10 cm. There were differences in climate and soil conditions among Er’shi, Shihezi and Zhaosu, and different temperatures between the years 2012 and 2013. Planting and harvest dates and trial management varied according to the recommendations of each location. The accessions were harvested at maturity and cleaned prior to quality test.
Flour milling was performed in a mill (MLU202, Wuxi, China) to flour extraction rates of around 65%. Prior to milling, the hard, medium hard (mixtures of hard and soft wheat) and soft wheats were tempered overnight to moisture contents of around 16, 15, and 14%, respectively.
Pasting properties of flour were determined with a Rapid Visco Analyser (RVA-Techmaster, Newport Scientific, Australia). The 3 g flour was suspended in 25 ml of distilled water before the solution was placed inside RVA instrument. The programs of temperature in the following order: held at 50°C for 60 s, heated from 50 to 95°C at a rate of 1°C/5 s and held at 95°C for 150 s, then cooled to 50°C at a rate of 1°C/5 s and held at 50°C for 120 s. RVA parameters including peak viscosity (PV), trough viscosity (TV), breakdown (BD), final viscosity (FV), setback (SB), peak time (PT) and pasting temperature (T) were determined.
Fresh leaf samples were collected from 10-day old seedlings and sent to the CapitalBio Technology company1 in Beijing for genotyping with the high-density illumina wheat 90K SNP array. After excluding the low-quality SNP markers with minor allele frequency (MAF) ≤0.02 and missing data ≥10%, 47,362 SNPs were used for GWAS. All SNP markers were anchored on the wheat genome (IWGSC RefSeq v1.0) using BLASTN by 50 bp SNP flanking sequences on both sides of the SNP.
The Bayesian clustering technique was used with 3400 SNP markers to classify groups of genotypically same individuals using the statistical software STRUCTURE v.2.3.4 (Pritchard et al., 2000). Burn-in iterations of 104 cycles were used, followed by a simulation runs of 105 cycles with an admixture model. The K values of 1–10 and 3 independent runs were selected to attain reliable results. Web-based analysis “Structure Harvester v0.6.93”2 was applied to obtain maximum value or peak of “K” for validation to understand the STRUCTURE v.2.3.4 results using ad-hoc techniques (Earl and VonHoldt, 2011). ΔK was plotted against the number of sub-group K following Evanno et al. (2005).
A principal component analysis (PCA) using filtered SNPs was performed with the TASSEL v.5.2.43 and the first three PCA values were plotted in three dimensions.
Phenotypic data in different environments and best linear unbiased prediction (BLUP) values were analyzed, respectively, for association analysis to identify the marker-trait associations (MTAs) employing mixed linear model (MLM) in TASSEL v.5.2.43 (Bradbury et al., 2007). The MLM option requires population structure (Q-matrix) and kinship matrix (K-matrix) as covariates for GWAS to avoid false positives. The Q-matrix was generated through STRUCTURE v.2.3.4, whereas the K-matrix was generated by TASSEL v.5.2.43. The Bonferroni multiple testing correction was used to identify significant markers. Significant SNPs associated with RVA traits were claimed when the significance test reached p < 4.18E-4 (20/47,362 = 0.000418). Linkage disequilibrium (LD) was calculated by TASSEL 5.0 with the markers whose positions were known. The LD decay plot was generated by intra-chromosomal r2 and base pair distance using R package ggplot2.
The Chinese spring reference genome (IWGSC RefSeq v1.0) and gene annotations in GFF3 format were retrieved from the Ensemble database release 443. The SNP marker sequences were mapped to the wheat genome using BLASTN program with a stringent E-value of 0.0001. For each SNP only the best scoring hit was retained. Each aligned genomic position was annotated into 5′-UTR, 3′-UTR, CDS, intron and intergenic region according to the genomic regions provided in the GFF3 file. The intergenic region was the genomic region with no annotated genes. The protein functions of candidate genes were predicted in the Uniprot Protein database4.
For the genomic regions harboring SNPs with -log10 (p) above the threshold, and the phenotypic values of accessions with different alleles reached significant level (p < 0.05) in multi-environment, haplotype analysis was carried out by Haploview version 4.2 software (Barrett et al., 2005), and candidate loci were determined by testing the significant differences on phenotypes among major haplotypes through analysis of variance (ANOVA).
ANOVA and correlation analysis were carried out using SPSS version 22.0. The coefficient of variation (CV) was calculated by dividing the standard deviation by the average of trait values. The BLUP values of all traits over 2 years across environments were calculated by the R package Lme4 (Bates et al., 2015). Broad-sense heritabilities (h2) of RVA traits were calculated as h2 = σ2g/(σ2g + σ2gl/l +σ2gs/s + σ2gls/ls), where σ2g, σ2gl, σ2gs, σ2gls variances for genotypic, genotype by location interaction, genotype by season interaction and genotype by location by season interaction, respectively, whereas l and s were the numbers of locations and seasons, respectively. SNP density plots, Manhattan and quantile-quantile (Q-Q) plots were generated in R package CMplot while histograms were performed in Origin 8.0.
The variation coefficients of PV, TV, BD, FV, SB, PT and T were in the ranges of 8.4–13.6%, 7.0–12.9%, 20.4–30.7%, 5.4–12.6%, 7.6–12.9%, 1.6–3.0%, 1.9–13.6%, respectively, across environments, and h2 estimates were 0.91, 0.77, 0.86, 0.89, 0.82, 0.62 and 0.85, respectively (Supplementary Table S1). Except the T, the frequency distributions of BLUP values of RVA parameters were nearly symmetrically distributed (Supplementary Figure S1). RVA parameters exhibited wide phenotypic variations and high broad-sense heritabilities, which were imperative for an efficient GWAS.
Based on the BLUP values across six environments, PV was significantly and positively correlated with TV (r = 0.68**), BD (r = 0.81**) and FV (r = 0.63**); TV was significantly and positively correlated with FV (r = 0.94**), SB (r = 0.72**) and PT (r = 0.63**); FV was significantly and positively correlated with SB (r = 0.89**) and PT (r = 0.48**); BD was significantly and negatively correlated with PT (r = −0.43**, Table 1).
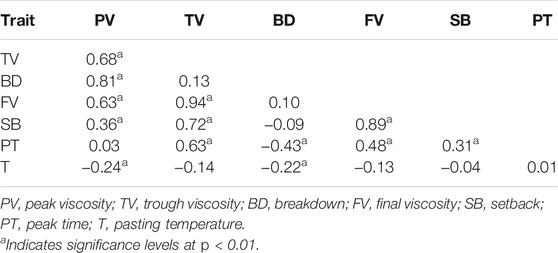
TABLE 1. Pearson’s correlation coefficients (r) between RVA parameters.
Based on whole-genome genotyping data, PCA showed that the association panel could be divided into two subgroups (Figure 1A), the same with the results calculated by the STRUCTURE software with 3,400 markers, in which the peak of the broken line graph was observed at k = 2 (Figure 1B), indicating the association panel can be divided into two sub-populations. After filtering low-quality markers, 47,362 SNPs were used for GWAS analysis with BLUP values and individual data in six environments. The number of SNPs within 1 Mb window size in chromosomes indicated that these SNPs were almost evenly distributed across the whole genome (Figure 1C). To avoid multiple significances within individual LD blocks, the support interval was determined when the decay distance of LD reached r2 = 0.2, and LD was estimated to decay at about 7 Mb for whole genome (Supplementary Figure S2). Manhattan and Q-Q plots based on BLUP values identified 92 significant SNPs at 51 loci (Figure 2; Supplementary Table S2), of which 13, 7, 5, 16, 10, 7 and 2 were significantly associated with PV, TV, BD, FV, SB, PT and T, respectively (Figure 1D). Phenotypic variations explained by these SNPs ranged from 6.9 to 11.1% for PV, 6.6–8.4% for TV, 7.2–8.8% for BD, 5.9–11.9% for FV, 5.2–7.3% for SB, 6.7–7.7% for PT, and 6.8–9.1% for T (Supplementary Table S2).
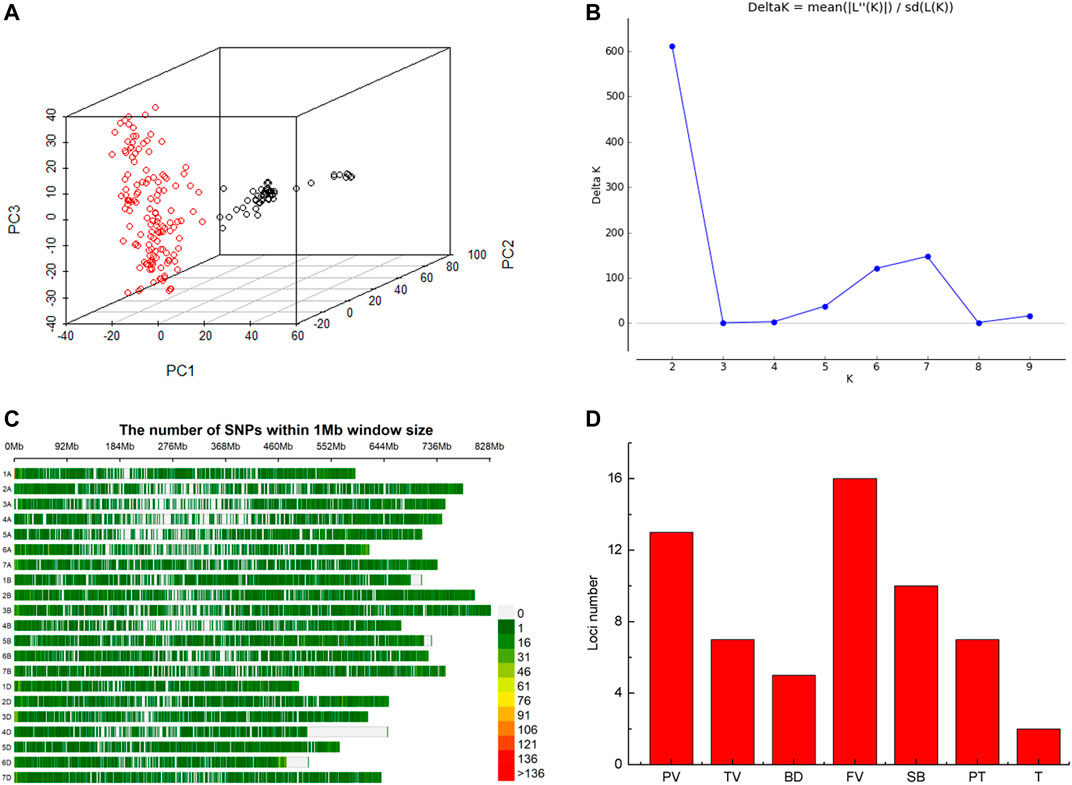
FIGURE 1. Structure of the association panel of 192 Chinese spring wheat varieties for genome-wide association study (GWAS), distribution of SNPs and significant loci revealed by GWAS. (A) Structure of association panel. (B) Broken line of delta K. (C) Distribution of SNPs on chromosomes. (D) Histogram plot of loci number significantly associated with RVA parameters via GWAS based on BLUP values.
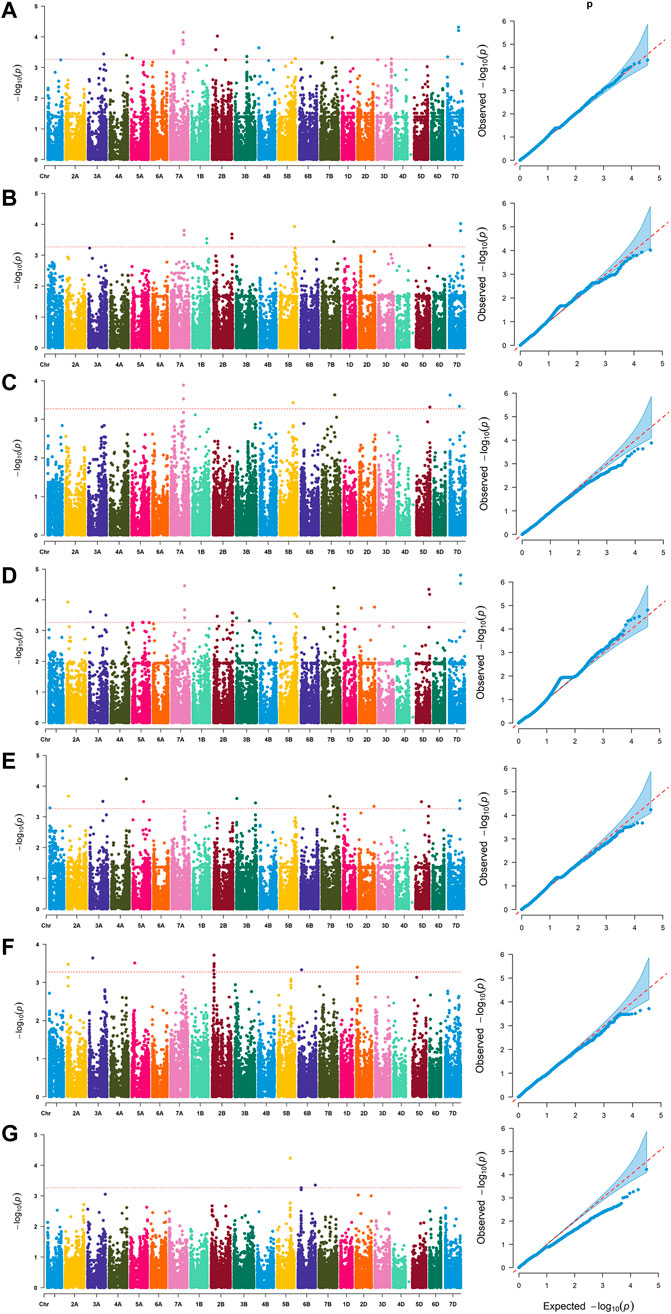
FIGURE 2. Manhattan and quantile-quantile (Q–Q) plots for RVA parameters identified by genome-wide association study based on BLUP values. (A) peak viscosity (PV). (B) trough viscosity (TV). (C) breakdown (BD). (D) final viscosity (FV). (E) setback (SB). (F) peak time (PT). (G) pasting temperature (T).
Forty-one SNPs at 25 loci were stably detected in at least two environments (BLUP is considered as an environment, Supplementary Table S3), and four SNPs (GENE-4428_113, BobWhite_c13098_670, IAAV4275, Kukri_rep_c69088_774) on chromosomes 7A (1), 7B (1) and 7D (2) at 534, 489 and 463 Mb, respectively, were significantly associated with both PV and TV, while one SNP (Excalibur_c9183_1397) on chromosome 7D at 13 Mb was significantly associated with both PV and BD. Thirty-four SNP markers associated with RVA parameters were mapped in the annotated genes; 20 SNPs among these were located in the CDS of 18 annotation genes, which were considered as candidate genes (Supplementary Table S4).
To test the effect of different genotypes on RVA parameters, stable SNPs were selected to group the populations according to their genotypes, and t-test was used to test the significance of genotypic effects on the traits. Three SNPs (BS00023017_51, Excalibur_c10124_361, Kukri_c4560_110) revealed significant differences (p < 0.05) of the traits between two alleles in at least four environments (Supplementary Table S5), indicating that these loci had a great influence on phenotypic variation.
The haplotype analysis for regions harboring the SNP marker (BS00023017_51) associated with BD showed that the 776–782 Mb interval on chromosome 3B had an 862-kb block, and six SNPs including BS00023017_51 were clustered in the block (Figures 3A,D). Comparison of BD values indicated that 37 cultivars with the TT/AC/CC/CC/GG/AA (BS00024883_51/BS00023017_51/IAAV8892/RFL_Contig2578_862/wsnp_Ex_c33879_42293206/wsnp_CAP11_c59_99263) haplotypes showed significantly higher BD (p < 0.05) than the average of all cultivars surveyed in four environments (2012_SHZ, 2013_ES, 2013_SHZ, 2013_ZS, Figures 3B,C). Haplotype analysis was also conducted for region harboring the SNPs (Excalibur_c10124_361, Kukri_c4560_110) associated with T, and two blocks in 442–454 Mb interval on chromosome 7B were detected. Two cultivars with CC/AA/CC (CAP12_c8025_110/IAAV 2037/Excalibur_c49622_60), 17 cultivars with AA/TT/GG/GG (wsnp_Ex_c64815_63464750/RAC875_c4438_419/IAAV3414/TA001679-0356) haplotypes showed higher T than the average of all cultivars surveyed, exhibiting significant differences in some locations (p < 0.05, Supplementary Table S6, Supplementary Figure S3).
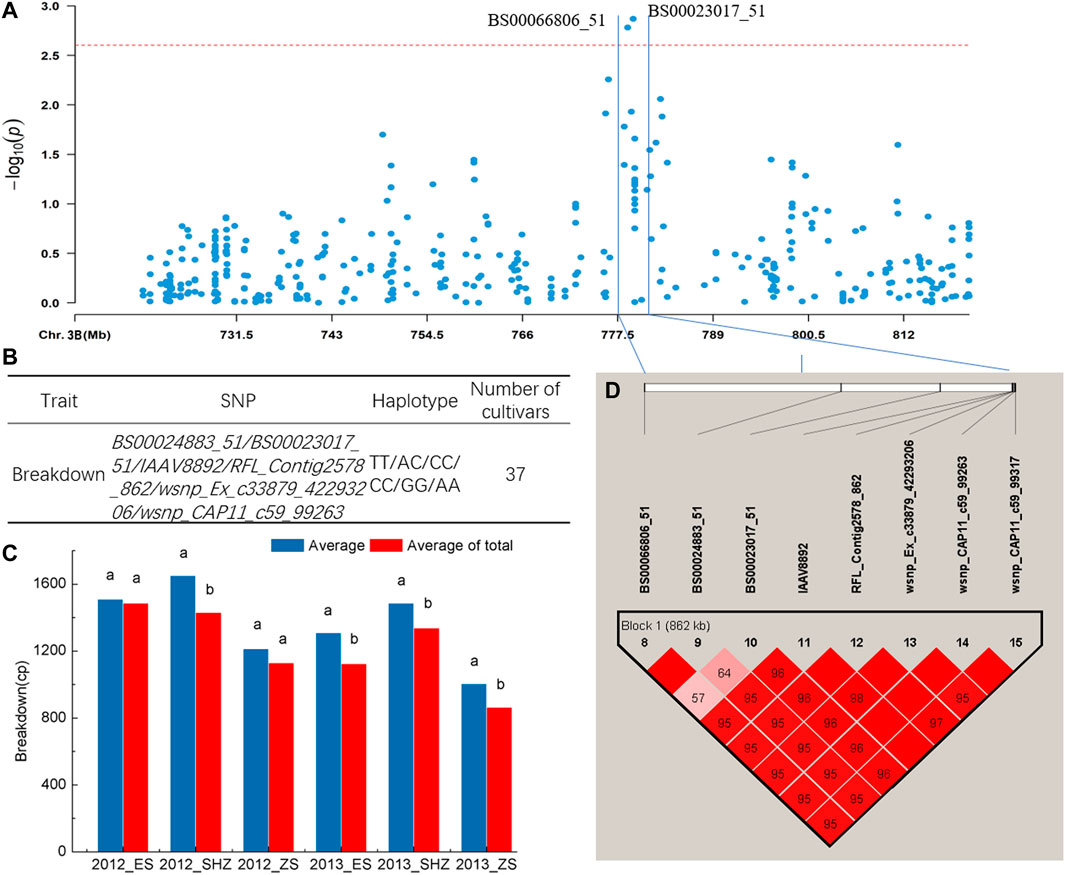
FIGURE 3. Haplotype analysis. (A) Local Manhattan plot. (B) Haplotypes with different SNP alleles in the block. (C) Phenotypic effects of haplotypes in different environments, Different lowercase letters indicate significant differences at p < 0.05. (D) Haplotype analysis of multi-environment significant SNPs associated with breakdown on chromosome 3B, the color represents the linkage between SNPs, and the deeper color means the higher linkage between SNPs.
Identification of genetic loci controlling wheat quality parameters is useful in breeding programs (Matus and Hayes, 2002; Mourad et al., 2020). In the association panel evaluated in this study, we observed significant phenotypic variations among accessions in RVA parameters (Supplementary Table S1). Earlier researches were in line with current results that starch pasting properties exhibited large variations (He et al., 2006; Ram and Sharma, 2013). Successive phenotypic distributions indicated polygenic inheritance of RVA parameters (Supplementary Figure S1). Heritability estimation provides information about the extent of a particular genetic character to be transmitted to offspring (Muhu-Din Ahmed et al., 2020). In this experiment, RVA parameters had high heritabilities (Supplementary Table S1), similar with a previous study, which also reported a high heritability in RVA parameters (Rahim et al., 2020). Our results demonstrated that this panel of wheat varieties had high levels of intra-species genetic flow, which made it suitable for the genetic study of RVA parameters by GWAS.
Marker-trait association study established the relationship between specific phenotypic and genetic variability within a genome, which ultimately detected loci underpinning corresponding traits. The ability to capture significant associations between polymorphic loci and phenotypic variance depend on the extent of LD along the genome (Pritchard and Przeworski, 2001; Remington et al., 2001). LD decay was about 7 Mb in our association panel in the present study, which consistent with previous studies (Appels et al., 2018; Yang et al., 2020), but inconsistent with most studies (Sukumaran et al., 2015; Jamil et al., 2019; Roncallo et al., 2019; Muhammad et al., 2020; Hu et al., 2021; Sharma, 2021), because of the differences in the type of markers used for genotyping and the sample size variation in the different studies (Chao et al., 2010). In the past, many studies for protein quality in wheat have been reported (Kristensen et al., 2019; Yang et al., 2020), whereas, few reports are about QTL for RVA parameters. In this study, we identified SNP markers associated with RVA traits using MLM. Besides the BLUP value, GWAS was also conducted with data of individual environments as a reference for locating SNPs that were relatively stable across different experimental environments. We highlighted those SNPs detected in at least two environments as stable SNPs and 41 significant MTAs were identified (Supplementary Table S3).
Significant and stable MTAs for PV were mainly clustered to chromosomes 2B, 3A, 3B, 4A, 4B, 5A, 7A, 7B and 7D (Supplementary Table S3); several were consistent with previous studies (Udall et al., 1999; Sun et al., 2008; Zhang et al., 2009; Deng et al., 2014). Wx-B1 gene (TRAESCS4A02G418200, chr4A, 688,097,145–688,100,962 bp) encodes granule-bound starch synthase, generating a higher PV and BD (Briney et al., 1998; Araki et al., 2000; Batey et al., 2002; Miura et al., 2002; Ram and Sharma, 2013). Some studies found the QTL for starch pasting properties near Wx-B1 on chromosome 4A (Batey et al., 2002; Mccartney et al., 2006). In the present study, we also identified a SNP marker (BobWhite_c17731_56, Chr.4A: 689,849,795 bp, Supplementary Table S3) associated with PV, its physical position was very close to Wx-B1 gene. TRAESCS7D02G365900 on chromosome 7D at 473,617,760 to 473,624,545 bp, encodes phosphorylase which probably contributes to starch synthesis and degradation (Tetlow et al., 2004; Tickle et al., 2009; Mishra et al., 2016). In the current study, we found two SNP markers (IAAV4275 and Kukri_rep_c69088_774) around there.
Our results corroborated other QTL studies in wheat, where QTL associated with BD was detected on chromosome 3B (Supplementary Table S3). However, we did not find QTL for BD on chromosomes 1A, 1B, 3A, 4A, 4B, 6A and 6D (Zhang et al., 2009; Deng et al., 2014). We detected new QTL (GENE-4993_69 on chromosome 7B, Excalibur_c9183_1397 and Tdurum_contig69003_459 on chromosome 7D, Supplementary Table S3) were not reported in previous studies. One stable SNP (BS00067650_51, Supplementary Table S3) associated with FV was detected at 526,464,187 bp on chromosome 5D in this study which was never reported before, while several FV QTL were identified on chromosomes 1A, 1B, 1D, 3A, 3D, 4A, 4B, 5B, 5D, 6B, 6D and 7A previously (Batey et al., 2002; Mccartney et al., 2006; Sun et al., 2008; Zhang et al., 2009; Deng et al., 2014). Using two DH populations, Batey et al. (2002) found QTL for FV near Wx-B1 on chromosome 4A, where no locus associated with FV was detected in this research. Nine SNPs in seven loci on chromosomes 2B (2), 5B (1), 6B (1), 7B (2) and 6D (1) were significantly associated with T (Supplementary Table S3), whereas QTL for T were reported on chromosomes 2D, 3A, 3B, 4A, 4B, 5D, 6D in previous studies (Zhao et al., 2009; Deng et al., 2014). The MTA at BS00022437_51 (chr.6B, 715,775,218 bp) significantly associated with T was very close to TRAESCS6B02G418100 (chr.6B, 690,447,513–690,452,026 bp) which was the homolog of phosphorylase (PHO, Tetlow et al., 2004; Li et al., 2018).
We also detected eight stable SNPs at five loci for TV on chromosomes 7A, 2B, 5B, 7B and 7D, one SNP for SB on chromosome 5A, and one SNP for PT on chromosome 2A (Supplementary Table S3). Whereas, previous studies have reported more loci on other chromosomes (Sun et al., 2008; Deng et al., 2014), which were not detected in this study, because alleles at these loci might be fixed in this association panel, or rare alleles cannot be detected.
The annotation conducted on 41 stable SNPs identified by GWAS showed that seven (17%) SNPs were mapped in intergenic regions, and 34 (83%) were mapped in genic regions (Supplementary Table S4). Among these, 20 SNPs were located in the CDS of 18 annotation genes which will result in discovering new genes controlling RVA parameters in wheat. Furthermore, GENE-4428_113, BobWhite_c13098_670, IAAV4275 and Kukri_rep_c69088_774 had effects on both PV and TV, and Excalibur_c9183_1397 had effect on both PV and BD; these SNPs were all mapped in the CDS of annotation genes, which may be key candidate genes that participate in regulating wheat starch quality. Excalibur_c9183_1397 was located in the CDS region of TraesCS7D02G026700 encoding 1,3-beta-glucan synthase that is present mainly in the cell walls of starchy endosperm (Moravčíková et al., 2016). Other candidate genes that were not reported in previous research need to be paid more attention for study in the future.
In the present study, SNPs significantly associated with RVA parameters were identified on almost all wheat chromosomes. To validate the effect of each SNP, estimations of SNP effects were used to predict the observed phenotypic performance (Supplementary Table S5). BS00023017_51, Excalibur_c10124_361 and Kukri_c4560_110 had significant (p < 0.05) effects on traits in at least four environments, and could be used as optimal loci in marker-assisted breeding and quality improvement. The haplotype analysis was conducted on these loci and three blocks were detected (Figure 3, Supplementary Figure S3; Supplementary Table S6). Cultivars with superior haplotypes showed relatively better phenotypes than the average of all cultivars surveyed. Therefore, these loci can be considered to improve cultivars for starch quality.
It is not feasible that phenotypic selection for improving wheat starch quality at the early stages in wheat breeding. Even at later stages in the breeding process, starch quality was also impacted greatly by environments. Therefore, genetic selection through MAS is a desirable way to improve wheat starch quality in wheat breeding programs. Based on dense SNPs across the whole genome, the GWAS has become a common approach to uncover genetic components of agronomic traits, which provides us with insightful information into genetic architecture of complex traits. In this study, GWAS analysis were performed for RVA parameters with 47,362 SNPs in 192 Chinese spring wheat accessions among six environments. Forty-one SNPs at 25 loci were stably detected in at least two environments, of which 20 SNPs were located in the CDS of 18 annotation genes. Haplotype analysis for regions harboring the SNPs (BS00023017_51, Excalibur_c10124_361, Kukri_c4560_110) revealed one block for BD on chromosome 3B and two blocks for T on chromosome 7B, cultivars with superior haplotypes at these loci showed better starch pasting viscosity than the average of all cultivars surveyed. Validation studies for SNPs in the candidate genes and detected loci will be conducted in the future by designing KASP assays, which can be further used for marker-assisted breeding for improvement of grain starch quality in wheat.
The data presented in the study are deposited in Figshare DOI: 10.6084/m9.figshare.19297601.
WL and PM conceived and planned the research; WS, PL, JX, FC, HX, XH, YN, and DK performed the research; YT analyzed the data and wrote the manuscript; JL edited and reviewed the final manuscript. All authors read and approved the final manuscript.
This work was funded by the Key Science and Technology Project of Xinjiang Production and Construction Corps (2019AB021), the National Natural Science Foundation of China (U1178306), the international science and technology cooperation program project of Xinjiang Production and Construction Corps (2019BC003).
The authors declare that the research was conducted in the absence of any commercial or financial relationships that could be construed as a potential conflict of interest.
All claims expressed in this article are solely those of the authors and do not necessarily represent those of their affiliated organizations, or those of the publisher, the editors and the reviewers. Any product that may be evaluated in this article, or claim that may be made by its manufacturer, is not guaranteed or endorsed by the publisher.
The Supplementary Material for this article can be found online at: https://www.frontiersin.org/articles/10.3389/fgene.2022.830644/full#supplementary-material
1https://www.capitalbiotech.com/.
2http://taylor0.biology.ucla.edu/structureHarvester/.
3ftp://ftp.ensemblgenomes.org/pub/plants/release-44.
Al-Maskri, A. Y., Sajjad, M., and Khan, S. H. (2012). Association Mapping: a Step Forward to Discovering New Alleles for Crop Improvement. Int. J. Agric. Biol. 14, 153–160. doi:10.13140/2.1.1925.9524
Amiri, R., Sasani, S., Jalali-Honarmand, S., Rasaei, A., Seifolahpour, B., and Bahraminejad, S. (2018). Genetic Diversity of Bread Wheat Genotypes in Iran for Some Nutritional Value and Baking Quality Traits. Physiol. Mol. Biol. Plants 24, 147–157. doi:10.1007/s12298-017-0481-4
Appels, R., Eversole, K., Appels, R., Eversole, K., Feuillet, C., Keller, B., et al. (2018). Shifting the Limits in Wheat Research and Breeding Using a Fully Annotated Reference Genome. Science 361 (6403), 661–674. doi:10.1126/science.aar7191
Araki, E., Miura, H., and Sawada, S. (2000). Differential Effects of the Null Alleles at the Three Wx Loci on the Starch-Pasting Properties of Wheat. Theor. Appl. Genet. 100, 1113–1120. doi:10.1007/s001220051394
Barrett, J. C., Fry, B., Maller, J., and Daly, M. J. (2005). Haploview: Analysis and Visualization of LD and Haplotype Maps. Bioinformatics 21, 263–265. doi:10.1093/bioinformatics/bth457
Bates, D. M., Mäechler, M., Bolker, B. M., and Walker, S. (2015). Lme4: Linear Mixed-Effects Models Using “Eigen” and S4. J. Stat. Softw. 67. doi:10.18637/jss.v067.i01
Batey, I. L., Hayden, M. J., Cai, S., Sharp, P. J., Cornish, G. B., Morell, M. K., et al. (2002). Genetic Mapping of Commercially Significant Starch Characteristics in Wheat Crosses. Aust. J. Agric. Res. 52, 1287–1296. doi:10.1071/AR01053
Bradbury, P. J., Zhang, Z., Kroon, D. E., Casstevens, T. M., Ramdoss, Y., and Buckler, E. S. (2007). TASSEL: Software for Association Mapping of Complex Traits in Diverse Samples. Bioinformatics 23, 2633–2635. doi:10.1093/bioinformatics/btm308
Briney, A., Wilson, R., Potter, R. H., Barclay, I., Crosbie, G., Appels, R., et al. (1998). A PCR-Based Marker for Selection of Starch and Potential Noodle Quality in Wheat. Mol. Breed. 4, 427–433. doi:10.1023/A:1009664917998
Chao, S., Dubcovsky, J., Dvorak, J., Luo, M.-C., Baenziger, S. P., Matnyazov, R., et al. (2010). Population- and Genome-specific Patterns of Linkage Disequilibrium and SNP Variation in spring and winter Wheat (Triticum aestivum L.). BMC Genomics 11, 727. doi:10.1186/1471-2164-11-727
Crosbie, G. B. (1991). The Relationship between Starch Swelling Properties, Paste Viscosity and Boiled Noodle Quality in Wheat Flours. J. Cereal Sci. 13, 145–150. doi:10.1016/S0733-5210(09)80031-3
Deng, Z., Tian, J., Chen, F., Li, W., Zheng, F., Chen, J., et al. (2014). Genetic Dissection on Wheat Flour Quality Traits in Two Related Populations. Euphytica 203, 221–235. doi:10.1007/s10681-014-1318-7
Earl, D. A., and VonHoldt, B. M. (2011). STRUCTURE HARVESTER: a Website and Program for Visualizing STRUCTURE Output and Implementing the Evanno Method. Conservation Genet. Resour. 4, 359–361. doi:10.1007/s12686-011-9548-7
Evanno, G., Regnaut, S., and Goudet, J. (2005). Detecting the Number of Clusters of Individuals Using the Software Structure: a Simulation Study. Mol. Ecol. 14, 2611–2620. doi:10.1111/j.1365-294X.2005.02553.x
He, Z. H., Liu, A. H., Peña, R. J., and Rajaram, S. (2003). Suitability of Chinese Wheat Cultivars for Production of Northern Style Chinese Steamed Bread. Euphytica 131, 155–163. doi:10.1023/A:1023929513167
He, Z. H., Yang, J., Zhang, Y., Quail, K. J., and Peña, R. J. (2004). Pan Bread and Dry white Chinese Noodle Quality in Chinese winter Wheats. Euphytica 139, 257–267. doi:10.1007/s10681-004-3283-z
He, Z., Xu, Z., Xia, L., Xia, X., Yan, J., Zhang, Y., et al. (2006). Genetic Variation for Waxy Proteins and Starch Properties in Chinese winter Wheats. Cereal Res. Commun. 34, 1145–1151. doi:10.1556/crc.34.2006.2-3.254
Hu, P., Zheng, Q., Luo, Q., Teng, W., Li, H., Li, B., et al. (2021). Genome-wide Association Study of Yield and Related Traits in Common Wheat under Salt-Stress Conditions. BMC Plant Biol. 21 (1), 1–20. doi:10.1186/s12870-020-02799-1
Jamil, M., Ali, A., Gul, A., Ghafoor, A., Napar, A. A., Ibrahim, A. M. H., et al. (2019). Genome-wide Association Studies of Seven Agronomic Traits under Two Sowing Conditions in Bread Wheat. BMC Plant Biol. 19 (1), 1–18. doi:10.1186/s12870-019-1754-6
Kaur, A., Shevkani, K., Katyal, M., Singh, N., Ahlawat, A. K., and Singh, A. M. (2016). Physicochemical and Rheological Properties of Starch and Flour from Different Durum Wheat Varieties and Their Relationships with Noodle Quality. J. Food Sci. Technol. 53, 2127–2138. doi:10.1007/s13197-016-2202-3
Kong, L., Si, J., Zhang, B., Feng, B., Li, S., and Wang, F. (2013). Environmental Modification of Wheat Grain Protein Accumulation and Associated Processing Quality: a Case Study of China. Aust. J. Crop Sci. 7, 173–181.
Konik, C. M., Miskelly, D. M., and Gras, P. W. (1992). Contribution of Starch and Non-starch Parameters to the Eating Quality of Japanese white Salted Noodles. J. Sci. Food Agric. 58, 403–406. doi:10.1002/jsfa.2740580315
Kristensen, P. S., Jensen, J., Andersen, J. R., Guzmán, C., Orabi, J., and Jahoor, A. (2019). Genomic Prediction and Genome-wide Association Studies of Flour Yield and Alveograph Quality Traits Using Advanced winter Wheat Breeding Material. Genes 10, 669–688. doi:10.3390/genes10090669
Kumar, D., Sharma, S., Sharma, R., Pundir, S., Singh, V. K., Chaturvedi, D., et al. (2021). Genome-wide Association Study in Hexaploid Wheat Identifies Novel Genomic Regions Associated with Resistance to Root Lesion Nematode (Pratylenchus Thornei). Sci. Rep. 11 (1), 3572. doi:10.1038/s41598-021-80996-0
León, A. E., Barrera, G. N., Pérez, G. T., Ribotta, P. D., and Rosell, C. M. (2006). Effect of Damaged Starch Levels on Flour-thermal Behaviour and Bread Staling. Eur. Food Res. Technol. 224, 187–192. doi:10.1007/s00217-006-0297-x
Li, W., Chen, Z. Y., Li, Z., Zhao, X. F., Pu, Z. E., Chen, G. Y., et al. (2018). Characterization of Starch Synthetic Genes and Starch Granule during Seeds Development between Synthetic Hexaploid Wheat and its Parents. Cereal Res. Commun. 46, 275–286. doi:10.1556/0806.46.2018.09
Liu, J. J., He, Z. H., Zhao, Z. D., Peña, R. J., and Rajaram, S. (2003). Wheat Quality Traits and Quality Parameters of Cooked Dry white Chinese Noodles. Euphytica 131, 147–154. doi:10.1023/A:1023972032592
Lv, G., Dong, Z., Wang, Y., Geng, J., Li, J., Lv, X., et al. (2020). Identification of Genetic Loci of Black Point in Chinese Common Wheat by Genome-wide Association Study and Linkage Mapping. Plant Dis. 104 (7), 2005–2013. doi:10.1094/PDIS-12-19-2733-RE
Matus, I. A., and Hayes, P. M. (2002). Genetic Diversity in Three Groups of Barley Germplasm Assessed by Simple Sequence Repeats. Genome 45, 1095–1106. doi:10.1139/g02-071
Mccartney, C. A., Somers, D. J., Lukow, O., Ames, N., Noll, J., Cloutier, S., et al. (2006). QTL Analysis of Quality Traits in the spring Wheat Cross RL4452×'AC Domain'. Plant Breed. 125, 565–575. doi:10.1111/j.1439-0523.2006.01256.x
Mishra, A., Singh, A., Sharma, M., Kumar, P., and Roy, J. (2016). Development of EMS-Induced Mutation Population for Amylose and Resistant Starch Variation in Bread Wheat (Triticum aestivum) and Identification of Candidate Genes Responsible for Amylose Variation. BMC Plant Biol. 16, 217–232. doi:10.1186/s12870-016-0896-z
Miura, H., Wickramasinghe, M. H. A., Subasinghe, R. M., Araki, E., and Komae, K. (2002). Development of Near-Isogenic Lines of Wheat Carrying Different Null Wx Alleles and Their Starch Properties. Euphytica 123, 353–359. doi:10.1023/A:1015042322687
Moiraghi, M., Sciarini, L. S., Paesani, C., León, A. E., and Pérez, G. T. (2019). Flour and Starch Characteristics of Soft Wheat Cultivars and Their Effect on Cookie Quality. J. Food Sci. Technol. 56, 4474–4481. doi:10.1007/s13197-019-03954-9
Moravčíková, J., Margetínyová, D., Gálová, Z., Žur, I., Gregorová, Z., Zimová, M., et al. (2016). Beta-1,3-glucanase Activities in Wheat and Relative Species. Nova Biotechnologica Chim. 15, 122–132. doi:10.1515/nbec-2016-0013
Mourad, A. M. I., Belamkar, V., and Baenziger, P. S. (2020). Molecular Genetic Analysis of spring Wheat Core Collection Using Genetic Diversity, Population Structure, and Linkage Disequilibrium. BMC Genomics 21, 434–456. doi:10.1186/s12864-020-06835-0
Muhammad, A., Hu, W., Li, Z., Li, J., Xie, G., Wang, J., et al. (2020). Appraising the Genetic Architecture of Kernel Traits in Hexaploid Wheat Using GWAS. Ijms 21, 5649. doi:10.3390/ijms21165649
Muhu-Din Ahmed, H. G., Sajjad, M., Zeng, Y., Iqbal, M., Habibullah Khan, S., Ullah, A., et al. (2020). Genome-wide Association Mapping through 90K SNP Array for Quality and Yield Attributes in Bread Wheat against Water-Deficit Conditions. Agriculture 10, 392–425. doi:10.3390/agriculture10090392
Muqaddasi, Q. H., Brassac, J., Ebmeyer, E., Kollers, S., Korzun, V., and Argillier, O. (2020). Prospects of GWAS and Predictive Breeding for European winter Wheat's Grain Protein Content, Grain Starch Content, and Grain Hardness. Sci. Rep. 10, 12541. doi:10.1038/s41598-020-69381-5
Panozzo, J. F., Plieske, J., Ganal, M. W., and Röder, M. S. (1993). The Rapid Viscoanalyser as a Method of Testing for Noodle Quality in a Wheat Breeding Programme. J. Cereal Sci. 17, 25–32. doi:10.1006/jcrs.1993.1004
Pritchard, J. K., and Przeworski, M. (2001). Linkage Disequilibrium in Humans: Models and Data. Am. J. Hum. Genet. 69, 1–14. doi:10.1086/321275
Pritchard, J. K., Stephens, M., Rosenberg, N. A., and Donnelly, P. (2000). Association Mapping in Structured Populations. Am. J. Hum. Genet. 67, 170–181. doi:10.1086/302959
Rahim, M. S., Mishra, A., Katyal, M., Thakur, S., Sharma, M., Kumar, P., et al. (2020). Marker-trait Association Identified Candidate Starch Biosynthesis Pathway Genes for Starch and Amylose-Lipid Complex Gelatinization in Wheat (Triticum aestivum L.). Euphytica 216, 151–173. doi:10.1007/s10681-020-02688-6
Ram, S., and Sharma, I. (2013). Allelic Diversity in Granule Bound Starch Synthase Genes in Indian Wheats and Their Relationship with Starch Pasting Properties. Cereal Res. Commun. 41, 141–149. doi:10.1556/CRC.2012.0024
Remington, D. L., Thornsberry, J. M., Matsuoka, Y., Wilson, L. M., Whitt, S. R., Doebley, J., et al. (2001). Structure of Linkage Disequilibrium and Phenotypic Associations in the maize Genome. Proc. Natl. Acad. Sci. 98, 11479–11484. doi:10.1073/pnas.201394398
Rimbert, H., Darrier, B., Navarro, J., Kitt, J., Choulet, F., Leveugle, M., et al. (2018). High Throughput SNP Discovery and Genotyping in Hexaploid Wheat. PLoS One 13, e0186329. doi:10.1371/journal.pone.0186329
Roncallo, P. F., Beaufort, V., Larsen, A. O., Dreisigacker, S., and Echenique, V. (2019). Genetic Diversity and Linkage Disequilibrium Using SNP (KASP) and AFLP Markers in a Worldwide Durum Wheat (Triticum Turgidum L. Var Durum) Collection. PLoS One 14 (6), e0218562. doi:10.1371/journal.pone.0218562
Shi, C., Zheng, Y., Geng, J., Liu, C., Pei, H., Ren, Y., et al. (2020). Identification of Herbicide Resistance Loci Using a Genome-wide Association Study and Linkage Mapping in Chinese Common Wheat. Crop J. 8, 666–675. doi:10.1016/j.cj.2020.02.004
Sukumaran, S., Dreisigacker, S., Lopes, M., Chavez, P., and Reynolds, M. P. (2015). Genome-wide Association Study for Grain Yield and Related Traits in an Elite spring Wheat Population Grown in Temperate Irrigated Environments. Theor. Appl. Genet. 128, 353–363. doi:10.1007/s00122-014-2435-3
Sun, C., Zhang, F., Yan, X., Zhang, X., Dong, Z., Cui, D., et al. (2017). Genome-wide Association Study for 13 Agronomic Traits Reveals Distribution of superior Alleles in Bread Wheat from the Yellow and Huai Valley of China. Plant Biotechnol. J. 15, 953–969. doi:10.1111/pbi.12690
Sun, H., Lü, J., Fan, Y., Zhao, Y., Kong, F., Li, R., et al. (2008). Quantitative Trait Loci (QTLs) for Quality Traits Related to Protein and Starch in Wheat. Prog. Nat. Sci. 18, 825–831. doi:10.1016/j.pnsc.2007.12.013
Tadesse, W., Ogbonnaya, F. C., Jighly, A., Sanchez-Garcia, M., Sohail, Q., Rajaram, S., et al. (2015). Genome-wide Association Mapping of Yield and Grain Quality Traits in winter Wheat Genotypes. PLoS One 10, e0141339. doi:10.1371/journal.pone.0141339
Tetlow, I. J., Morell, M. K., and Emes, M. J. (2004). Recent Developments in Understanding the Regulation of Starch Metabolism in Higher Plants. J. Exp. Bot. 55, 2131–2145. doi:10.1093/jxb/erh248
Tickle, P., Burrell, M. M., Coates, S. A., Emes, M. J., Tetlow, I. J., and Bowsher, C. G. (2009). Characterization of Plastidial Starch Phosphorylase in Triticum aestivum L. Endosperm. J. Plant Physiol. 166, 1465–1478. doi:10.1016/j.jplph.2009.05.004
Udall, J. A., Souza, E., Anderson, J., Sorrells, M. E., and Zemetra, R. S. (1999). Quantitative Trait Loci for Flour Viscosity in winter Wheat. Crop Sci. 39, 238–242. doi:10.2135/cropsci1999.0011183X003900010036x
Yan, X., Zhao, L., Ren, Y., Dong, Z., Cui, D., and Chen, F. (2019). Genome-wide Association Study Revealed that the TaGW8 Gene Was Associated with Kernel Size in Chinese Bread Wheat. Sci. Rep. 9, 2702. doi:10.1038/s41598-019-38570-2
Yang, Y., Chai, Y., Zhang, X., Lu, S., Zhao, Z., Wei, D., et al. (2020). Multi-locus GWAS of Quality Traits in Bread Wheat: Mining More Candidate Genes and Possible Regulatory Network. Front. Plant Sci. 11, 1091–1110. doi:10.3389/fpls.2020.01091
Zhang, Y., He, Z. H., Ye, G. Y., Zhang, A. M., and Ginkel, M. V. (2004). Effect of Environment and Genotype on Bread-Making Quality of spring-sown spring Wheat Cultivars in China. Euphytica 139, 75–83. doi:10.1007/s10681-004-2131-5
Zhang, X., Chen, J., Yan, Y., Yan, X., Shi, C., Zhao, L., et al. (2018). Genome-wide Association Study of Heading and Flowering Dates and Construction of its Prediction Equation in Chinese Common Wheat. Theor. Appl. Genet. 131, 2271–2285. doi:10.1007/s00122-018-3181-8
Zhang, Y., Nagamine, T., He, Z. H., Ge, X. X., Yoshida, H., and Peña, R. J. (2005). Variation in Quality Traits in Common Wheat as Related to Chinese Fresh white Noodle Quality. Euphytica 141, 113–120. doi:10.1007/s10681-005-6335-0
Zhang, Y., Wu, Y., Xiao, Y., Yan, J., Zhang, Y., Zhang, Y., et al. (2009). QTL Mapping for Milling, Gluten Quality, and Flour Pasting Properties in a Recombinant Inbred Line Population Derived from a Chinese Soft×hard Wheat Cross. Crop Pasture Sci. 60, 587–597. doi:10.1071/CP08392
Keywords: candidate genes, GWAS, haplotype analysis, RVA parameters, Triticum aestivum
Citation: Tian Y, Sang W, Liu P, Liu J, Xiang J, Cui F, Xu H, Han X, Nie Y, Kong D, Li W and Mu P (2022) Genome-wide Association Study for Starch Pasting Properties in Chinese Spring Wheat. Front. Genet. 13:830644. doi: 10.3389/fgene.2022.830644
Received: 07 December 2021; Accepted: 25 February 2022;
Published: 25 March 2022.
Edited by:
Awais Rasheed, Quaid-i-Azam University, PakistanReviewed by:
Deepmala Sehgal, International Maize and Wheat Improvement Center, MexicoCopyright © 2022 Tian, Sang, Liu, Liu, Xiang, Cui, Xu, Han, Nie, Kong, Li and Mu. This is an open-access article distributed under the terms of the Creative Commons Attribution License (CC BY). The use, distribution or reproduction in other forums is permitted, provided the original author(s) and the copyright owner(s) are credited and that the original publication in this journal is cited, in accordance with accepted academic practice. No use, distribution or reproduction is permitted which does not comply with these terms.
*Correspondence: Weihua Li, bHdoX2FnckBzaHp1LmVkdS5jbg==; Peiyuan Mu, bXVweUAxNjMuY29t
†These authors share first authorship
Disclaimer: All claims expressed in this article are solely those of the authors and do not necessarily represent those of their affiliated organizations, or those of the publisher, the editors and the reviewers. Any product that may be evaluated in this article or claim that may be made by its manufacturer is not guaranteed or endorsed by the publisher.
Research integrity at Frontiers
Learn more about the work of our research integrity team to safeguard the quality of each article we publish.