
94% of researchers rate our articles as excellent or good
Learn more about the work of our research integrity team to safeguard the quality of each article we publish.
Find out more
CORRECTION article
Front. Genet., 14 February 2022
Sec. Computational Genomics
Volume 13 - 2022 | https://doi.org/10.3389/fgene.2022.828664
 Zaisheng Ye1†
 Miao Zheng2†
 Yi Zeng1†Shenghong Wei1†Yi Wang1Zhitao Lin1Chen Shu1Yunqing Xie3Qiuhong Zheng3Luchuan Chen1*
by Ye Z, Zheng M, Zeng Y, Wei S, Wang Y, Lin Z, Shu C, Xie Y, Zheng Q and Chen L (2020). Front Genet. 11:595477. doi: 10.3389/fgene.2020.595477
In the original article, there was a mistake in Figure 1 and caption/Supplementary Table S1 as published. The whole process of analysis was based on the raw mRNA expression-based stemness index (mRNAsi), but the survival curve was based on the corrected mRNAsi (mRNAsi/tumor purity). The inconsistent data was confusing. According to consistency principle, we decided to use the raw mRNAsi data to construct survival curve in STAD (Figure 1B; Supplementary Table S1). Second, the limma package was used for the analysis of DEGs between normal and tumor tissues in STAD as published in the section of “Identification of DEGs Between Normal and Tumor Tissues in STAD,” but we described as “between the high and low mRNAsi groups” (Figure 1A).
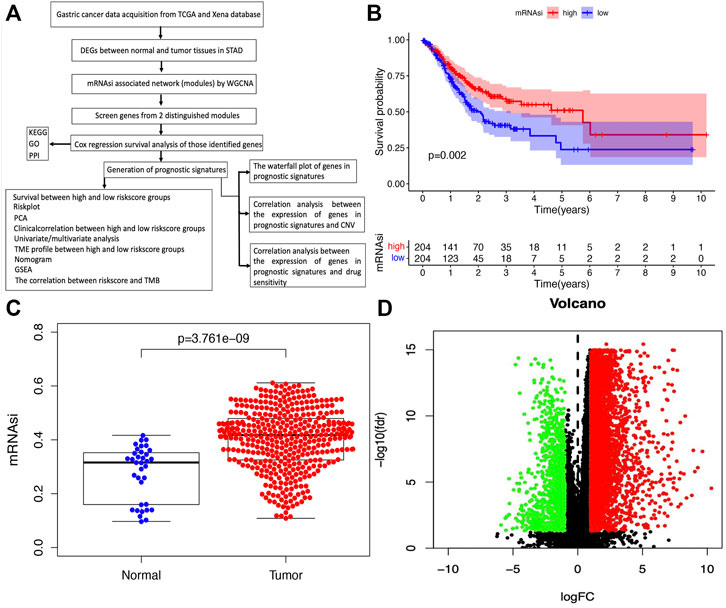
FIGURE 1. Identification of DEGs between normal and tumor tissues in STAD. (A) The flow chart for identification of mRNAsi related signature in STAD. (B) Kaplan–Meier curves show that the low mRNAsi group had greater mortality than the high mRNAsi group. (C) Differences in mRNAsi between normal and tumor tissues in STAD. (D) Identification of DEGs between normal and tumor tissues in STAD; green and red indicate downregulated and upregulated genes, respectively.
The corrected Figure 1 and caption appear below.
The corrected Supplementary Table S1 available in Supplementary Material.
In addition, errors were published in the Abstract and Results section of the original article.
A correction has been made to “Abstract” given below.
“Cancer stem cells (CSCs), characterized by infinite proliferation and self-renewal, greatly challenge tumor therapy. Research into their plasticity, dynamic instability, and immune microenvironment interactions may help overcome this obstacle. Data on the stemness indices (mRNAsi), gene mutations, copy number variations (CNV), tumor mutation burden (TMB), and corresponding clinical characteristics were obtained from The Cancer Genome Atlas (TCGA) and UCSC Xena Browser. The infiltrating immune cells in stomach adenocarcinoma (STAD) tissues were predicted using the CIBERSORT method. Differentially expressed genes (DEGs) between the normal and tumor tissues were used to construct prognostic models with weighted gene co-expression network analysis (WGCNA) and Lasso regression. The association between cancer stemness, gene mutations, and immune responses was evaluated in STAD. A total of 6,739 DEGs were identified between the normal and tumor tissues. DEGs in the brown (containing 19 genes) and blue (containing 209 genes) co-expression modules were used to perform survival analysis based on Cox regression. A nine-gene signature prognostic model (ARHGEF38-IT1, CCDC15, CPZ, DNASE1L2, NUDT10, PASK, PLCL1, PRR5-ARHGAP8, and SYCE2) was constructed from 178 survival-related DEGs that were significantly related to overall survival, clinical characteristics, tumor microenvironment immune cells, TMB, and cancer-related pathways in STAD. Gene correlation was significant across the prognostic model, CNVs, and drug sensitivity. Our findings provide a prognostic model and highlight potential mechanisms and associated factors (immune microenvironment and mutation status) useful for targeting CSCs.”
A correction has been made to the section of Results, “mRNAsi Was Significantly Associated With STAD,” “Paragraph Number 1 and 4” given below.
“The flowchart shown in Figure 1A summarizes the overall bioinformatics analysis of the association between cancer stemness, gene mutations, and immune response in STAD. The data of mRNAsi were used to perform the overall survival analysis in STAD (Supplementary Table S1). The mRNAsi subgroups were clustered according to the median value of mRNAsi in STAD. The overall survival was significantly different between the high and low mRNAsi groups (Figure 1B, p = .002). A significant difference in mRNAsi was observed between normal and tumor tissues in STAD (Figure 1C). A total of 6,739 DEGs were identified between normal and tumor tissues in STAD, of which 1,146 were upregulated and 5,593 were downregulated (Figure 1D; Supplementary Table S2).”
The authors apologize for these errors and state that this does not change the scientific conclusions of the article in any way. The original article has been updated.
All claims expressed in this article are solely those of the authors and do not necessarily represent those of their affiliated organizations, or those of the publisher, the editors and the reviewers. Any product that may be evaluated in this article, or claim that may be made by its manufacturer, is not guaranteed or endorsed by the publisher.
The Supplementary Material for this article can be found online at: https://www.frontiersin.org/articles/10.3389/fgene.2020.595477/full#supplementary-material
Supplementary Table 1 | The mRNA expression-based stemness index (mRNAsi) of stomach adenocarcinoma (STAD) and corresponding survival data from TCGA database.
Keywords: stomach adenocarcinoma, cancer stemness, clinical characteristics, tumor microenvironment, tumor mutation burden
Citation: Ye Z, Zheng M, Zeng Y, Wei S, Wang Y, Lin Z, Shu C, Xie Y, Zheng Q and Chen L (2022) Corrigendum: Bioinformatics Analysis Reveals an Association Between Cancer Cell Stemness, Gene Mutations, and the Immune Microenvironment in Stomach Adenocarcinoma. Front. Genet. 13:828664. doi: 10.3389/fgene.2022.828664
Received: 11 January 2022; Accepted: 11 January 2022;
Published: 14 February 2022.
Approved by:
Frontiers Editorial Office, Frontiers Media SA, SwitzerlandCopyright © 2022 Ye, Zheng, Zeng, Wei, Wang, Lin, Shu, Xie, Zheng and Chen. This is an open-access article distributed under the terms of the Creative Commons Attribution License (CC BY). The use, distribution or reproduction in other forums is permitted, provided the original author(s) and the copyright owner(s) are credited and that the original publication in this journal is cited, in accordance with accepted academic practice. No use, distribution or reproduction is permitted which does not comply with these terms.
*Correspondence: Luchuan Chen, bHVjaHVhbmNoZW5Ac2luYS5jbg==
†These authors have contributed equally to this work
Disclaimer: All claims expressed in this article are solely those of the authors and do not necessarily represent those of their affiliated organizations, or those of the publisher, the editors and the reviewers. Any product that may be evaluated in this article or claim that may be made by its manufacturer is not guaranteed or endorsed by the publisher.
Research integrity at Frontiers
Learn more about the work of our research integrity team to safeguard the quality of each article we publish.