
95% of researchers rate our articles as excellent or good
Learn more about the work of our research integrity team to safeguard the quality of each article we publish.
Find out more
ORIGINAL RESEARCH article
Front. Genet. , 14 March 2022
Sec. Livestock Genomics
Volume 13 - 2022 | https://doi.org/10.3389/fgene.2022.824742
This article is part of the Research Topic Omics Technologies in Livestock Improvement: From Selection to Breeding Decisions View all 30 articles
 Yuan Zhao1Xiaoxue Zhang1
 Fadi Li2,3Deyin Zhang1Yukun Zhang1
 Xiaolong Li1
 Qizhi Song4Bubo Zhou1Liming Zhao1Jianghui Wang1Dan Xu1Jiangbo Cheng1Wenxin Li1Changchun Lin1Xiaobin Yang1Xiwen Zeng1
 Weimin Wang1*
In sheep meat production, the rib eye area is an important index to evaluate carcass traits. However, conventional breeding programs have led to slow genetic progression in rib eye muscle area. Operationalizing molecular marker assisted breeding is an optimized breeding method that might improve this situation. Therefore, the present study used whole genome sequencing data to excavate candidate genes associated with the rib eye muscle. Male Hu lambs (n = 776) with pedigrees and 274 lambs with no pedigree were included. The genetic parameters of the rib eye area were estimated using a mixed linear mixed model. The rib eye area showed medium heritability (0.32 ± 0.13). Whole-genome sequencing of 40 large rib eye sheep [17.97 ± 1.14, (cm2)] and 40 small rib eye sheep [7.89 ± 0.79, (cm2)] was performed. Case-control genome-wide association studies and the fixation index identified candidate rib eye-associated genes. Seven single nucleotide polymorphisms (SNPs) in six genes (ALS2, ST6GAL2, LOC105611989, PLXNA4, DPP6, and COL12A1) were identified as candidates. The study population was expanded to 1050 lambs to perform KASPar genotyping on five SNPs, which demonstrated that SNPs in LOC105611989, DPP6, and COL12A1 correlated significantly with the rib eye area, which could be used as genetic markers for molecular breeding of the rib eye area. The results provided genetic parameters estimated on the rib eye area and information for breeding based on carcass traits in Hu sheep.
Improvement of carcass traits is very important for farmers and the sheep industry, because the commercial value of a sheep carcass is determined by a range of different aspects, notably the rib eye area. Studies suggest that the rib eye area is significantly associated with the carcass lean meat yield (Anderson et al., 2015). Among many carcass traits, the first to be assessed using ultrasonic scanning was the rib eye area, which revealed the importance attached by consumers and farmers to this trait (Arias et al., 2007). Therefore, adding the rib eye area to breeding programs is an important tool to improve sheep carcass values. Hu sheep predominate among Chinese mutton sheep breeds, but show huge variation in their rib eye area because of the selection pressure resulting from breeding methods and geographical differences. The ability to accurately predict the size of the rib eye area early in the life of Hu sheep is extremely valuable for producers to meet the requirements of their target market, and for genetic selection.
In the last 20 years, the heritability of sheep carcass traits has been estimated in many sheep breeds from different regions and countries using different models and approaches (Kefelegn et al., 1999; Greeff et al., 2015; Mortimer et al., 2017; Blasco et al., 2019; Savoia et al., 2019). Several studies have quantified the heritability of certain measured or scored meat quality traits in sheep breeds in different farming and market systems, which demonstrated the existence of genetic variability among these traits, which could be exploited for genetic improvement. However, because the techniques used to obtain phenotypes at the population level are expensive and laborious, it is very rare for measurements of the rib eye area to be used directly in the selection of specialized breeds, e.g., in cattle (Savoia et al., 2019). Carcass merit traits are expressed at the later stages of animal production and are mostly assessed at slaughter, which sacrifices potential breeding stock, although real-time ultrasound imaging technologies can be used to measure the rib eye area (Meirelles et al., 2011; Li et al., 2018).
Reducing the generation interval while maintaining a good level of selection accuracy would improve breeding efficiency (Kefelegn et al., 1999). Early selection is a practical and effective method, which is mainly caried out using genomic selection and molecular marker-assisted breeding (Dekkers, 2003; Tong and Sun, 2015). Identification of the quantitative trait major genes of the rib eye area is necessary. Mutation sites identified using Whole genome sequencing (WGS) represent the ideal pan DNA markers for genetic analyses, because theoretically, they contain all causative polymorphisms. In cattle breeding, genome-wide association studies (GWAs) on production, meat quality, and lactation traits have been reported widely and have been applied in practical production (Lin et al., 2020; Mukiibi, 2020). However, in sheep, only a few GWAs for body size, body weight, and wool traits have been reported (Kominakis and Hager-Theodorides, 2017; Palombo et al., 2020; Tao et al., 2020), and most research used single nucleotide polymorphism (SNP) chips, not the whole genome sequence.
Designing effective breeding programs based on accurate estimates of genetic parameters and molecular markers is one way to solve the problem of slow genetic progression of the rib eye area of sheep. In the present study, the genetic parameters of the rib eye area were estimated using different models, and some genetic correlations between the rib eye area and economic traits were estimated. WGS of High and Low rib eye area groups from a reference population of Hu sheep was performed. The aim was to estimate the heritability of the rib eye area. In addition, we aimed to establish the feasibility of adding the rib eye area trait to breeding goal, and to identify candidate genes that could be used in molecular marker assisted breeding, which will increase the breeding value of Hu sheep.
In the present study, a total of 1050 male Hu lambs, born between 2018 and 2019, were included. Among them, 776 individuals possessed a complete pedigree record. The full pedigree of the experiment population comprised 1500 individuals, including 70 male parents and 600 female parents, which were from three National Core Breeding Farms of Sheep and Goats (NCBFSG) (Gansu Zhongtian Sheep Industry Co. Ltd., Gansu Zhongsheng Huamei Sheep Industry Co. Ltd., and Gansu Pukang Sheep Industry Co. Ltd.) and a large scale Hu sheep farm (Gansu Sanyang Sheep Industry Co. Ltd.). The population with pedigree information could be used to estimate genetic parameters. Each lamb was weaned at 56 days old and transferred to Minqin Defu Agricultural Technology Co., Ltd. (Performance Measurement Centre, PMC; Gansu Province, China). There were two batches in 2018 (May to September and September to December, respectively) and two batches in 2019 (May to September and September to December, respectively).
From 64 days old, all male Hu lambs were raised indoors in individual 0.8 × 1 m pens until the lambs were 180 days old, and each column of pens had a separate trough and drinking bowl for the sheep to feed freely. Before the study, a 14-day transition period was implemented, during which the proportion of pellets in the diet was gradually increased by 7.1% per day, until the diet became totally granulated. The formula, raw materials, and manufacturing plant of the feed were consistent. The experiment began with lambs at 80 days of age. They were weighed at 80 days to obtain their initial weight (BW80) and raised for up to 180 days. The body weight of each lamb at 180 days old was measured as the final weight (BW180). The feed intake of the lambs during the experimental period was recorded every 20 days. The feed intake for 80–180 days was calculated from five records. Then, we calculated the average daily gain (ADG) and average daily feed intake (ADFI). In addition, individual feed efficiency [residual feed intake (RFI) and feed conversion ratio (FCR)] were estimated. RFI was the residual of the multiple linear regression of ADFI on ADG and the medium metabolic weight [MBW =
At the 180 days old, blood was collected and the lambs were slaughtered in accordance with established national standards by Ministry of Agriculture and Rural Affairs of the People’s Republic of China (NY/T 3471-2019). The blood was stored at −20°C until DNA isolation. Twenty-four hours after slaughter, the rib eye muscle area was covered with oleic acid paper from between the fifth and sixth thoracic vertebrae, and used to sketch out the muscle area in a one-to-one ratio. These sketches were scanned using an EPSON Scanner (V19, IDN, Epson, Nagano, Japan) and analyzed using ImageJ (1.8.0; NIH, Bethesda, MD, USA) from which we obtained the rib eye area [REA (
Genomic DNA of every lamb was isolated using an EasyPure Blood Genomic DNA Kit (TransGen Biotech, Beijing, China), according to the manufacturer’s product description. The quality and integrity of the DNA was measured using the A260/280 ratio and by agarose gel electrophoresis. Then, 1.5 µg of high quality genomic DNA from the high and low groups (80 individuals) were used to generate 80 paired-end sequencing libraries with an inset size of 500 bp. The libraries were sequenced as 150 bp paired end reads using the Illumina NovaSeq PE 150 platform (Illumina, San Diego, CA, USA).
Quality control was performed on the raw data to improve subsequent analyses using FastQC (Version 0.11.1). Reads with joint sequences and sequences for which the number of undetected bases in single-end sequencing exceeded 10% of the total length of the sequence were eliminated. Sequences with low-quality bases with a mass value of Q ≤ 5 in the single-end sequence were removed. The clean reads were mapped onto the Ovis aries reference genome (Oar_rambouillet_v1.0) using BWA (Burrows-Wheeler Aligner) (Version 0.7.8) software with default parameters (Li and Durbin, 2009). To reduce mismatches generated by PCR amplification before sequencing, duplicated reads were removed using Genome Analysis Toolkit (GATK, version 3.4.0) and GATK was used to generate variant call format (VCF) files (Mckenna et al., 2010). SNPs were filtered using Vcftools (version 0.1.14) software and processed as follows: SNPs with call rates <75%, minor allele frequencies (MAF) < 0.05, and minor coverage depth <3. Thus, 80 individuals with 9,875,037 SNPs were kept for further genomic analysis (Danecek et al., 2011).
To accurately estimate (co)variance components, we constructed an animal mixed model with univariate and bivariate analysis between each pair of feature pairs, using the restricted maximum likelihood (REML) method implemented in the ASReml software (Gilmour et al., 2009). First, the random effects included in the analyses were the direct additive genetic effect of the animal, maternal genetic effects, and random errors. The fixed effects tested and their levels were: Litter size at individual birth (four levels), fattening season (two levels), and the farm before weaning (four levels). All the fixed effects that significantly affected the trait (p-value < 0.05), as determined using the ASReml Wald program, were incorporated into the (co)variance estimation. Three models that accounted for the genetic effects and bivariate genetic (co)covariance were fitted and were as follows:
Where Y is the phenotype measurement vector of a trait, while
The bivariate model was as follows:
Where y1 and y2 are the phenotypic measurement vectors of traits 1 and 2, b1 and b2 are the fixed effect vectors previously described;
Three methods (fixation index (FST), Fisher’s exact test, and the Chi-squared test) were used to screen mutation sites with significant differences in their allele frequency between the High and Low groups. FST quantified the allele frequency differences between the High and Low groups using Vcftools software (version 0.1.14) (Danecek et al., 2011). We used FST because Weir and Cockerham proposed that genetic structures (or genetic polymorphisms) cause the degree of population differentiation and formulated the FST value (0–1) to represent the degree of allele frequency differences (Cockerham, 1984; Danecek et al., 2011). In the present study, mutation sites with the top 20 FST values were identified as putative selection sites. The genomic data of 80 individuals were subjected to principal components analysis (PCA) [using PLINK (version 1.9)] and permutational multivariate analysis of variance (PERMANOVA) (using Vegan R packages) to verify whether there is population stratification. We constructed a genome-wide case/control design within the High and Low groups using Fisher’s exact test and the Chi-squared test to calculate the p-values using PLINK (version 1.9) (Purcell et al., 2007). In addition, the first five principal components were added as covariates for the association analysis using Fisher’s test. We used the false discovery rate (FDR) method to set the p-value threshold. The genome-wide threshold value was calculated according to an FDR of 0.05. The p.adjust function of R (version 4.0.3) was used to calculate the FDR. (Supplementary Tables S1, S2).
We selected SNPs that met the requirements in all three screening methods (FST, Fisher’s exact test, and the Chi-squared test). PCR extension primers for the SNPs were designed using the genomic DNA sequences. DNA samples from 1050 lambs with phenotypic records were genetyped using KAspar genotyping technology (LGC Genomics, Hoddesdon, UK) (Smith and Maughan, 2015) to further screen the SNPs. The general linear model analysis in the SPSS 22.0 software (IBM Corp., Armonk, NY, USA) was used to analyze the association between the genotypes and the REA (Zhang et al., 2019). The linear model with the fixed and covariate effects was as follows:
In this model,
In the present study, 776 animals with their REA phenotypes were included to estimate the genetic parameters. The average REA was 12.64 ± 2.46
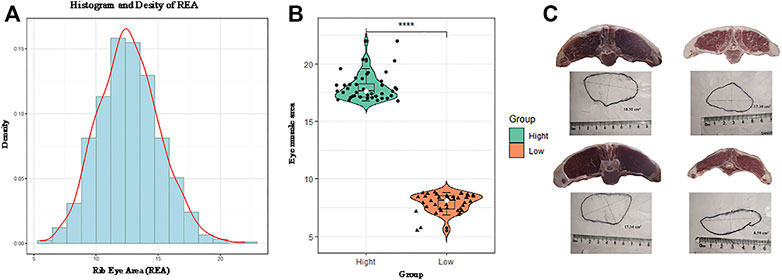
FIGURE 1. Probability density map of the original phenotype data (A). The distribution of the included rib eye area (REA) from the high and low groups (B). Photograph of the REA (C).
Heritability and variance components for the REA are shown in Table 1. The REA heritability estimated using different models showed little difference (0.32 and 0.28). The litter common environmental effect accounted for the majority of the REA. The REA trait showed moderate heritability. Maternal heritability was significantly greater than zero for the REA trait in Hu sheep; however, the influence of the maternal genetic effect on the heritability and the additive variance component estimation of the REA trait was minimal. We calculated the parameters (AIC and BIC) of the two evaluation models (Table 1).
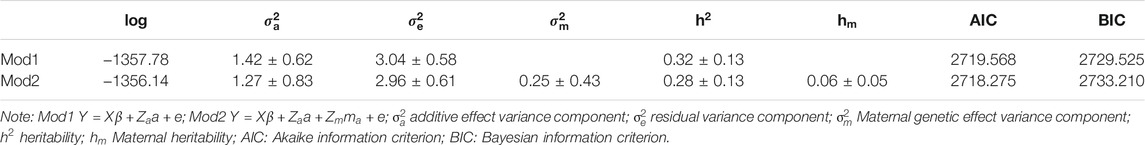
TABLE 1. Estimates of heritability (h2) and variance components.
Estimates of genetic and phenotype correlations between the REA and important economic traits (body weight, feed intake, feed efficiency, and backfat, respectively) are shown in Table 2. The correlations were high for the REA and production traits, with high genetic correlations between BW80, BW180, ADFI80–180, ADG80–180, and REA (0.58, 0.80, 0.55, and 0.91, respectively). Positive moderate phenotype correlations were estimated between the REA and production traits, at 0.32, 0.42, 0.37, and 0.34, respectively. Genetic correlations between feed efficiency traits and the REA were negligible (−0.05 and −0.01). Low correlations were estimated between feed efficiency and the REA at the phenotypic level (−0.02 and 0). BF and the REA were genetically correlated with a large standard error, while there was a positive phenotypic correlation between the BF and the REA.
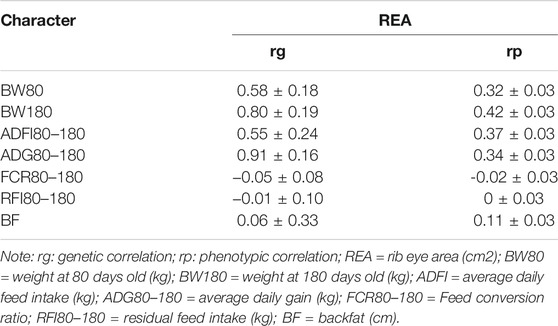
TABLE 2. Estimates of genetic (rg) and phenotypic (rp) correlations for rib eye area, carcass, and important economic traits in Male Hu sheep.
To identify variation in the REA in sheep genomes, we identified the candidate genes associated with an increased REA in Hu sheep. We performed WGS of Hu lambs in the high and low groups. We obtained a total of 700 Gb of raw data, with an average depth of 5-fold for each individual. The average number of reads was 58785931 and the average %GC was 43.6. (Supplementary Table S3). The effective sequencing rate was 99.42%, which suggested that the data had high quality and could be used for further in-depth analysis.
In the present study, three methods were used to identify SNPs and genes associated with the REA in Hu sheep. Figure 2 shows that population stratification did not appear. The top two principal components accounted for a small proportion of the variance (6.7 and 6.3%). In addition, we performed permutational multivariate analysis of variance (PERMANOVA) using vegan packages, which produced a p-value of 0.0014. This verified that there were no subgroups in the population (p < 0.05). To detect strongly selected signals, we searched the sheep genome for single SNPs with an increased genetic distance (FST). We set a threshold to select the top 20 SNPs and we used the PLINK software for PCA. The first five principal components were included in Fisher’s exact test. According to the p-value of every SNP, eleven significant SNPs (Supplementary Table S1) were identified for the REA at the secondary identified signal (p < 4.82
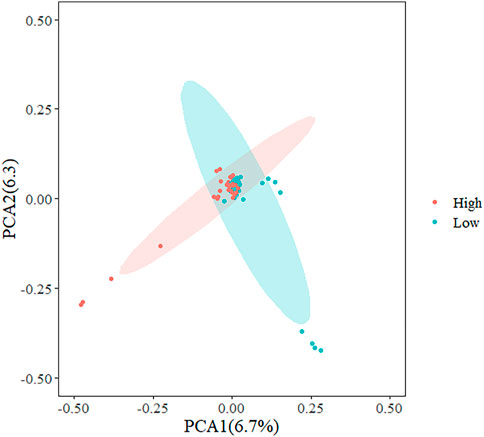
FIGURE 2. Principal component analysis (PCA) plots of Hu sheep whole genome sequencing data.
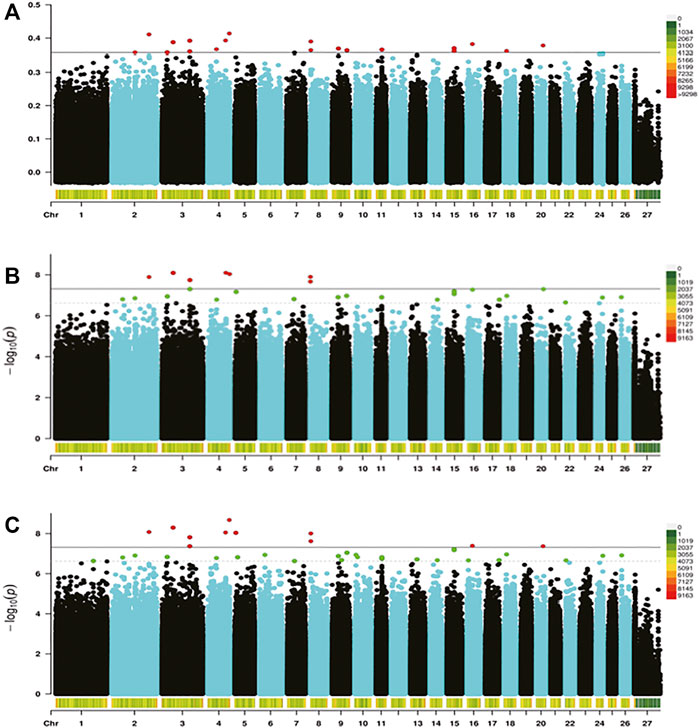
FIGURE 3. Genome-wide distribution of Fst (A), Fisher’s exact test (B), and the chi-squared test (C). The horizontal black line in the figure shows the threshold of methods at the secondary identified signal [-log (4.82
We found that the SNPs selected using the three methods were decreasing and coincident (Fst > Fisher’s exact > Chi-squared). Subsequently, seven target SNPs were selected that overlapped among the three methods and were annotated to the closest gene in the Oar_rambouillet_v1.0 genome. Six genes containing these seven SNPs were defined as candidate genes (Table 3).
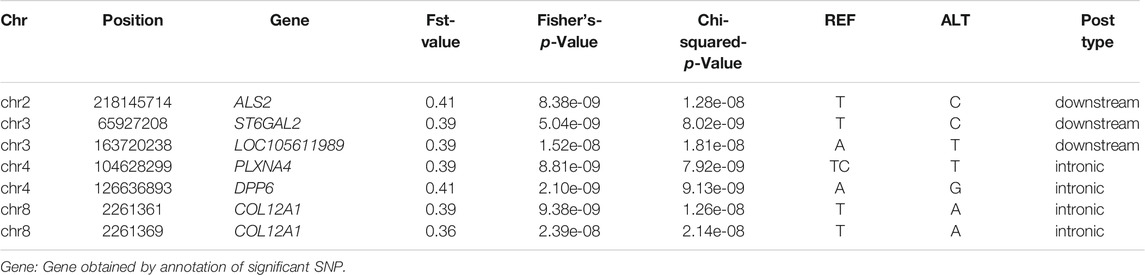
TABLE 3. The significant SNPs for the rib eye area in Hu sheep.
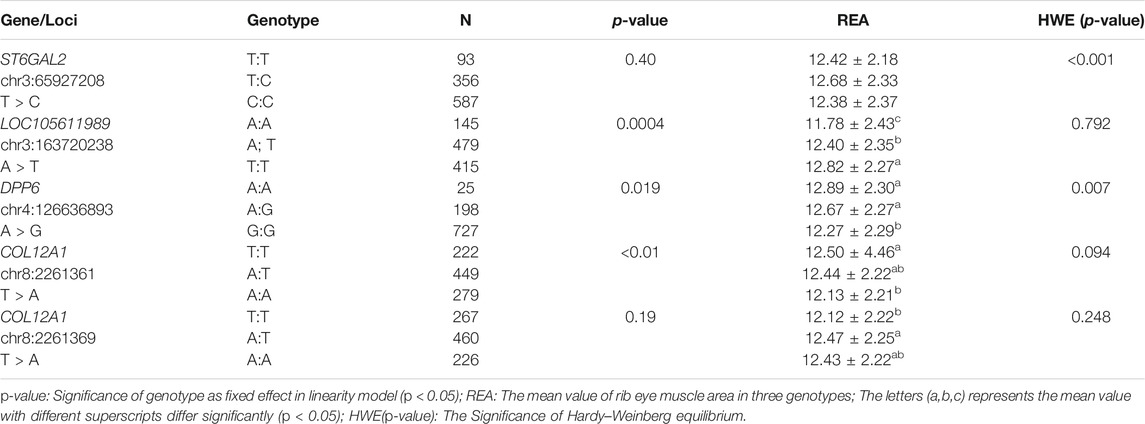
TABLE 4. Association between the REA and different genotypes of the ST6GAL2, LOC105611989, DPP6, and COL12A1 genes.
To determine whether the selected candidate genes had a significant effect in the REA, in the enlarged experimental population (n = 1050), five SNPs (ST6GAL2 (encoding ST6 beta-galactoside alpha-2,6-sialyltransferase 2) SNP g.65927208 T > C, LOC105611989 SNP g.65927208A > T, DPP6 (encoding dipeptidyl peptidase like 6) SNP g.126636893A > G, COL12A1 (encoding collagen type XII alpha 1 chain) SNP g.2261361 T > A, and COL12A1 SNP g.2261369 T > A) were subjected to genotyping, which generated three genotypes (Figure 4). The result of association analysis indicated that LOC105611989 SNP g.65927208A > T, DPP6 g.126636893 SNP A > G, COL12A1 SNP g.2261361 T > A, and COL12A1 SNP g.2261369 T > A were significantly associated with the REA (p < 0.05); however, ST6GAL2 SNP g.65927208 T > C did not have a significant impact on the REA. For LOC105611989, the male Hu sheep with the TT genotype had largest REA and those with the AA genotype had the smallest REA among the three genotypes (p < 0.05). The REA of male Hu sheep carrying the AA and AG genotypes of the DPP6 SNP g.126636893A > G was increased compared with that in male Hu sheep carrying the GG genotype (p < 0.05). The effect of the COL12A1 g.2261361 T > A and COL12A1 g.2261369 T > A SNPs s were significant on the REA. For COL12A1 SNP g.2261361 T > A, male Hu sheep with the TT genotype had a larger REA than those with the AA genotype. By contrast, the REA in the experimental population with the TT genotype of the COL12A1 g.2261369 T > A SNP was significantly lower compared with that in the sheep with the AT genotype.
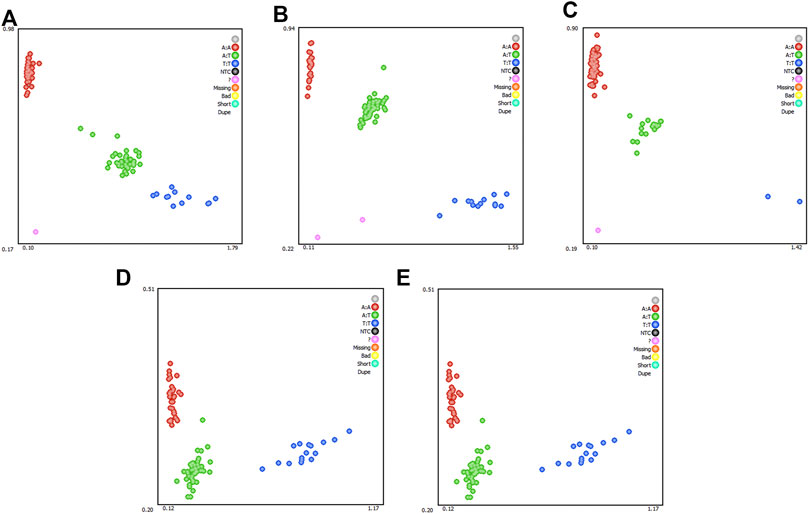
FIGURE 4. Genotyping of ST6GAL2 (A), LOC105611989 (B), DPP6 (C), and COL12A1 (D and E) single nucleotide polymorphisms (SNPs). Note: Red, green, and blue represents three genotypes, respectively; while the pink dots indicate genotyping failure.
LOC105611989 SNP g.65927208A > T, COL12A1 SNP g.2261361 T > A, and COL12A1 SNP g.2261369 T > A were in Hardy–Weinberg equilibrium (p > 0.05). However, ST6GAL2 SNP g.65927208 T > C and DPP6 SNP g.126636893A > G did not conform to the Hardy–Weinberg equilibrium (p < 0.05).
Genetic improvement has played an important role in productivity gains in animal farming. The REA is a valuable economic trait that could affect production traits in animals (Savoia et al., 2019). The REA has been reported in many studies that mainly investigated nutrition (Silva et al., 2019; Jiao et al., 2020; Redoy et al., 2020); however, there have been relatively few studies reporting the genetic mechanism of the REA, and it was not until 2013 that a GWAS for the REA in sheep was reported (Zhang et al., 2013), although GWAS studies had been used earlier to study the REA in other livestock.
In our study, we estimated the genetic parameters of the REA in Hu breeding, and candidate gene mining was carried out. The heritability of the REA-based genetic parameters with different models was moderate. Roden et al. reported lower estimates of for rib eye muscle depth and width (0.11 and 0.08) in Scottish Blackface breed than those in the present study (Roden et al., 2003). In our population, maternal genetics was not an important influence on the REA. Previous studies on different cattle breeds (Nellore, Red Angus, and Piedmontese) reported
In addition, we found interesting correlations between the REA and certain important economic traits. Positive genetic correlations were estimated between the REA and production traits (0.58 for BW80, 0.80 for BW180, 0.55 for ADFI, and 0.91 for ADG). As expected, the size of an individual has a decisive impact on the size of the REA. Mortimer et al. reported high genetic correlations (from 0.37 to 0.70) between the REA and body weight at different stages (Mortimer et al., 2018). Phenotype correlation analysis supported the results of the genetic correlation analysis (Table 2).
We identified negligible genetic correlations between REA and feed efficiency traits (−0.05 and −0.01), and ADFI and BW correlated positively with the REA, suggesting that animals with a larger REA grow faster and consume more feed, so it is expected that their feed efficiency would be the same. A negative genetic correlation between the measured muscle depth and feed efficiency traits (−0.3 ± 0.15) with RFI and −0.15 ± 0.18 with FCR) has been observed in other breeds (Tortereau et al., 2020). This correlation suggests that animals with a larger REA are expected to have excellent feed efficiency. In 2004, the genetic correlation between fat depth and the REA was estimated as 0.05 (Pollott and Greeff, 2004). In our study, negative genetic relationship between the REA and BF was estimated (0.06) However, the genetic correlation between the REA and BF had a large standard error. Fat serves as an energy store in animals. A previous study found evidence that the genetic correlation between fat reserves and production traits can change across environments (Pollott and Greeff, 2004). Based on the results of the genetic parameters, we suggest that the REA trait should be incorporated into breeding of Hu sheep.
The REA is commonly used to reflect the muscular development of the carcass. To further investigate the mechanisms affecting the REA, we identified genes that regulate the REA in the Hu sheep genome using three methods. SNPs were identified in six genes: ALS2 (encoding Alsin Rho guanine nucleotide exchange factor 2) SNP g.218145714 T > C, ST6GAL2 SNP g.65927208 T > C, LOC105611989 SNP g.163720238A > T, PLXNA4 (encoding plexin A4) SNP g.104628299 TC > T, DPP6 SNP g.126636893A > G, COL12A1 SNP g.2261361 T > A, and COL12A1 SNP g.2261369 T > A.
The mutations in the ALS2 gene may case Familial amyotrophic lateral sclerosis type 2, which is a juvenile autosomal recessive motor neuron disease. The ALS2 gene product, ALS2/alsin, forms a homophilic oligomer and acts as a guanine nucleotide–exchange factor (GEF) for the small GTPase Rab5. This oligomerization is crucial for both Rab5 activation and ALS2-mediated endosome fusion and maturation in cells (Asako et al., 2003; Sato et al., 2018). ALS2 might act as a modulator in neuronal differentiation and development through regulation of membrane dynamics (Otomo et al., 2008). Actin and myoglobulin is involved in guiding regulation of membrane dynamics (Poukkula et al., 2011). Macro pinocytosis is the cytoplasmic membrane folding mediated by actin that can non-selectively encapsulate a large number of extracellular nutrients and liquid macromolecules, and transport them to the lysosome for degradation after the cell is stimulated by nutrient factors or pho wave ester. Macro pinocytosis alters the nutritional physiology of muscle cells. The development and nutritional metabolism of muscle cells are inseparable from this process. The mutation of ALS2 has led to a certain degree of muscle atrophy in the longissimus dorsi muscle in Hu sheep. This caused the REA to become smaller. The association analysis of the larger group also supported this view.
Studies have reported that PLAXN4 and Semaphorin3A show a high degree of interaction (Quintá et al., 2014; Poltavski et al., 2019; Limoni et al., 2021). PLAXN4 is used as a star gene in the Axon guidance - Homo sapiens KEGG category. PLAXN4 acts directly upstream of Rac, p21-activated kinase (PAK), and RhoD functions. Rho GTPases are known to regulate actin dynamics (Ridley, 2006). In motile cells, during the process of mitosis, the activities of GTPases of different Rho families are separated in intracellular space (Pal et al., 2020). A previous study found that RhoD could stimulate actin polymerization and affect plasma membrane protrusion and/or vesicular traffic (Ridley, 2006). Pal et al. (2020) reported that manipulating Rac and Arp2/3 activity resulted in polar body defects during mitosis and meiosis in sea urchin embryos and sea star oocytes, and suggested that Rac and Arp2/3-mediated actin networks might directly antagonize Rho signaling. PAK is an effector downstream target of Rho-GTPases Rac1 and Cdc42, which can activate its downstream target cofilin via LIM kinase-1, and subsequently supports cell migration and invasion through the polymerization of actin filaments (Mierke et al., 2020). The Rac/PAK/GC/cGMP signaling pathway allows the action of RAC and PAK to affect actin simultaneously (Guo et al., 2010). Actin forms part of the muscle cytoskeleton. If there is a lack of actin production, the development and mitosis of the longissimus dorsi muscle will be affected, resulting in muscular dysplasia and thus reducing the rib eye area muscle.
DPP6 is an auxiliary subunit of the Kv4 family of voltage-gated K (+) channels, which is known to enhance channel surface expression and potently accelerate their kinetics. Many studies suggest that DPP6 is consistently and strongly associated with susceptibility to amyotrophic lateral sclerosis (ALS) in different human populations of European ancestry (Del Bo et al., 2008; Es et al., 2008; Lin et al., 2014). This suggests that DPP6 acts as a susceptibility gene for muscle atrophy symptoms in humans. It is possible that DPP6 has the same effect on muscle atrophy in animals.
After fitting multiple factors in the association analysis in a large population, we found that the COL12A gene is related to the size of the REA of Hu sheep. COL12A is mainly involved in the degradation of the extracellular matrix pathway and collagen chain trimerization. In 2014, a myopathy/anhydrotic ectodermal dysplasia (EDA)-like disease caused by heterozygous COL12A1 variants was reported (Punetha et al., 2017). Mice with Col12A1 knockout showed muscle weakness with decreased grip strength, combined with bone fragility, short stature, and kyphoscoliosis (Yaqun et al., 2014). Delbaere et al. (2020) believed that mixed myopathy was caused by defects in collagen XII and VI, and by variant-specific alterations in the extracellular matrix resulting from COL12A1 mutation. We believe that this disease also occurs in Hu sheep.
In addition, we performed genotyping and association analysis on the seven SNPs in the enlarged experimental population. Five loci were typed successfully and three loci were significantly associated with the REA. These three SNPs could be used for marker-assisted selection. Therefore, we hypothesized that these candidate genes might affect muscle development in Hu sheep. We cannot perform whole genome sequencing in a large Hu sheep population because of the cost; however, further studies are needed to confirm the biological effects of the identified SNPs in the rib eye area.
According to the association analysis of candidate genes, we found that in male Hu sheep ST6GAL2 SNP g. 65927208 T > C has no association with the REA. The results showed that the SNP has skewness in this population, which led to a lack of association with the REA. Although this research verified the association between candidate SNPs and the REA in a large population, verification at the cell and protein levels is still needed.
The results obtained in the present study showed that the rib eye area was heritable and there is genetic variability, which could theoretically be exploited for the genetic improvement of sheep. We identified LOC105611989 SNP g.65927208A > T, DPP6 SNP g.126636893A > G, COL12A1 SNP g.2261361 T > A, and COL12A1 SNP g.2261369 T > A, whose protein products have metabolic functions in muscle cells, as candidate genetic markers of the rib eye area. Our results could be applied to marker assisted breeding of sheep and are expected to improve for the slow genetic progress of the rib eye area in sheep. Moreover, this study provides important information for estimating the heritability parameters of the rib eye area and for molecular breeding of carcass traits in Hu sheep.
The datasets presented in this study can be found in online repositories. The names of the repository/repositories and accession number(s) can be found below: https://www.ncbi.nlm.nih.gov/search/all/?term=PRJNA779188.
The animal study was reviewed and approved by The Institutional Animal Care and Ethics Committee of Gansu Agriculture University.
YZ and WW conceived the study. FL, DZ, XL, QS, LZ, and YZ contributed to construction of the reference population and growth performance measurement. JW, DX, JC, WL, and CL contributed extracting DNA. BZ, XY, and XZ contributed to the calculation of the rib eye area. YZ, XZ, YKZ, XL, and WW analyzed the data. YZ wrote the paper. YZ and WW revised the paper. All authors read and approved the final manuscript.
This work was supported by the National Natural Science Foundation of China (grant no. 31760651), the National Joint Research on Improved Breeds of Livestock and Poultry (grant no.19210365), and the Earmarked Fund for China Agriculture Research System (grant no. CARS-38).
The authors declare that the research was conducted in the absence of any commercial or financial relationships that could be construed as a potential conflict of interest.
All claims expressed in this article are solely those of the authors and do not necessarily represent those of their affiliated organizations, or those of the publisher, the editors and the reviewers. Any product that may be evaluated in this article, or claim that may be made by its manufacturer, is not guaranteed or endorsed by the publisher.
The Supplementary Material for this article can be found online at: https://www.frontiersin.org/articles/10.3389/fgene.2022.824742/full#supplementary-material
Anderson, F., Pannier, L., Pethick, D. W., and Gardner, G. E. (2015). Intramuscular Fat in Lamb Muscle and the Impact of Selection for Improved Carcass Lean Meat Yield. Animal 9 (6), 1081–1090. doi:10.1017/S1751731114002900
Arias, P., Pini, A., Sanguinetti, G., Sprechmann, P., Cancela, P., Fernandez, A., et al. (2007). Ultrasound Image Segmentation with Shape Priors: Application to Automatic Cattle Rib-Eye Area Estimation. IEEE Trans. Image Process. 16 (6), 1637–1645. doi:10.1109/TIP.2007.896604
Asako, O., Shinji, H., Takeya, O., Hikaru, M., Ryota, K., Hitoshi, N., et al. (2003). ALS2, a Novel Guanine Nucleotide Exchange Factor for the Small GTPase Rab5, Is Implicated in Endosomal Dynamics. Hum. Mol. Genet. 12 (14), 1671. doi:10.1021/es001545w
Blasco, M., Campo, M. M., Balado, J., and Sañudo, C. (2019). Effect of Texel Crossbreeding on Productive Traits, Carcass and Meat Quality of Segureña Lambs. J. Sci. Food Agric. 99 (7), 3335–3342. doi:10.1002/jsfa.9549
Boldt, R. J., Speidel, S. E., Thomas, M. G., and Enns, R. M. (2018). Genetic Parameters for Fertility and Production Traits in Red Angus Cattle. J. Anim. Sci. 96 (10), 4100–4111. doi:10.1093/jas/sky294
Cemal, I., Karaman, E., Firat, M. Z., Yilmaz, O., Ata, N., and Karaca, O. (2016). Bayesian Inference of Genetic Parameters for Ultrasound Scanning Traits of Kivircik Lambs. Animal 11 (03), 375–381. doi:10.1017/S1751731116001774
Cockerham, B. S. W. C. (1984). Estimating F-Statistics for Analysis of Population Structure. Evolution 38 (6), 1359–1370. doi:10.2307/2408641
da Silva, J. R. C., de Carvalho, F. F. R., de Andrade Fereira, M., de Souza, E. J. O., Maciel, M. I. S., Barreto, L. M. G., et al. (2019). Carcass Characteristics and Meat Quality of Sheep Fed Alfalfa hay to Replace Bermuda Grass hay. Trop. Anim. Health Prod. 51 (8), 2455–2463. doi:10.1007/s11250-019-01962-7
Danecek, P., Auton, A., Abecasis, G., Albers, C. A., Banks, E., Depristo, M. A., et al. (2011). The Variant Call Format and VCFtools. Bioinformatics 27 (15), 2156–2158. doi:10.1093/bioinformatics/btr330
Dekkers, J. C. (2003). Commercial Application of Marker- and Gene-Assisted Selection in Livestock: Strategies and Lessons. J. Anim. Sci. 82 (E-Suppl), E313–E328. doi:10.2527/2004.8213_supplE313x
Del Bo, R., Ghezzi, S., Corti, S., Santoro, D., Prelle, A., Mancuso, M., et al. (2008). DPP6 Gene Variability Confers Increased Risk of Developing Sporadic Amyotrophic Lateral Sclerosis in Italian Patients. J. Neurol. Neurosurg. Psychiatry 79 (9), 1085. doi:10.1136/jnnp.2008.149146
Delbaere, S., Dhooge, T., Syx, D., Petit, F., Goemans, N., Destrée, A., et al. (2020). Novel defects in collagen XII and VI expand the mixed myopathy/Ehlers–Danlos syndrome spectrum and lead to variant-specific alterations in the extracellular matrix. Genet. Med. 22 (1), 112–123. doi:10.1038/s41436-019-0599-6
Gilmour, A. R., Gogel, B. J., Cullis, B. R., and Thompson, R. (2009). ASReml User Guide Release 3.0. Hemel Hempstead, United Kingdom: VSN International Ltd.
Greeff, J. C., Safari, E., Fogarty, N. M., Hopkins, D. L., Brien, F. D., Atkins, K. D., et al. (2015). Genetic Parameters for Carcass and Meat Quality Traits and Their Relationships to Liveweight and Wool Production in Hogget Merino Rams. J. Anim. Breed. Genet. 125 (3), 205–215. doi:10.1111/j.1439-0388.2007.00711.x
Guo, D., Zhang, J. J., and Huang, X. Y. (2010). A New Rac/PAK/GC/cGMP Signaling Pathway. Mol. Cell Biochem 334 (1-2), 99–103. doi:10.1007/s11010-009-0327-7
Jiao, J., Wang, T., Zhou, J., Degen, A. A., Gou, N., Li, S., et al. (2020). Carcass Parameters and Meat Quality of Tibetan Sheep and Small‐tailed Han Sheep Consuming Diets of Low‐protein Content and Different Energy Yields. J. Anim. Physiol. Anim. Nutr. 104 (4), 1010–1023. doi:10.1111/jpn.13298
Kefelegn, K., Suess, R., Mielenz, N., Schueler, L., and Lengerken, G. V. (1999). Genetic and Phenotypic Parameter Estimates of Growth and Carcass Value Traits in Sheep. J. Agric. Res. 35 (3), 287–298.
Kominakis, A., Hager-Theodorides, A. L., Zoidis, E., Saridaki, A., Antonakos, G., and Tsiamis, G. (2017). Combined GWAS and 'guilt by Association'-Based Prioritization Analysis Identifies Functional Candidate Genes for Body Size in Sheep. Genet. Sel Evol. 49 (1), 41. doi:10.1186/s12711-017-0316-3
Li, H., and Durbin, R. (2009). Fast and Accurate Short Read Alignment with Burrows-Wheeler Transform. Bioinformatics 25 (14), 1754–1760. doi:10.1093/bioinformatics/btp324
Li, Q., Wang, Y., Tan, L., Leng, J., Lu, Q., Tian, S., et al. (2018). Effects of Age on slaughter Performance and Meat Quality of Binlangjang Male buffalo. Saudi J. Biol. Sci. 25 (2), 248–252. doi:10.1016/j.sjbs.2017.10.001
Limoni, G., Murthy, S., Jabaudon, D., Dayer, A., and Niquille, M. (2021). PlexinA4-Semaphorin3A-mediated Crosstalk between Main Cortical Interneuron Classes Is Required for Superficial Interneuron Lamination. Cell Rep. 34 (4), 108644. doi:10.1016/j.celrep.2020.108644
Lin, L., Long, L. K., Hatch, M. M., and Hoffman, D. A. (2014). DPP6 Domains Responsible for its Localization and Function. J. Biol. Chem. 289 (46), 32153–32165. doi:10.1074/jbc.M114.578070
Lin, S., Wan, Z., Zhang, J., Xu, L., Han, B., and Sun, D. (2020). Genome-Wide Association Studies for the Concentration of Albumin in Colostrum and Serum in Chinese Holstein. Animals 10 (12), 2211. doi:10.3390/ani10122211
Mckenna, A., Hanna, M., Banks, E., Sivachenko, A., Cibulskis, K., Kernytsky, A., et al. (2010). The Genome Analysis Toolkit: A MapReduce Framework for Analyzing Next-Generation DNA Sequencing Data. Genome Res. 20 (9), 1297–1303. doi:10.1101/gr.107524.110
Meirelles, S. L., Gouveia, G. V., Gasparin, G., Alencar, M. M., Gouveia, J. J. S., and Regitano, L. C. A. (2011). Candidate Gene Region for Control of Rib Eye Area in Canchim Beef Cattle. Genet. Mol. Res. 10 (2), 1220–1226. doi:10.4238/vol10-2gmr1175
Mierke, C. T., Puder, S., Aermes, C., Fischer, T., and Kunschmann, T. (2020). Effect of PAK Inhibition on Cell Mechanics Depends on Rac1. Front. Cell Dev. Biol. 8, 13. doi:10.3389/fcell.2020.00013
Mortimer, S. I., Fogarty, N. M., van der Werf, J. H. J., Brown, D. J., Swan, A. A., Jacob, R. H., et al. (2018). Genetic Correlations between Meat Quality Traits and Growth and Carcass Traits in Merino Sheep1. J. Anim. Sci. 96 (9), 3582–3598. doi:10.1093/jas/sky232
Mortimer, S. I., Hatcher, S., Fogarty, N. M., van der Werf, J. H. J., Brown, D. J., Swan, A. A., et al. (2017). Genetic Correlations between Wool Traits and Carcass Traits in Merino Sheep1. J. Anim. Sci. 95 (6), 2385–2398. doi:10.2527/jas2017.162810.2527/jas.2017.1385
Mukiibi, R. (2020). Genetic Architecture of Quantitative Traits in Beef Cattle Revealed by Genome Wide Association Studies of Imputed Whole Genome Sequence Variants: II: Carcass merit Traits. BMC Genomics 21 (1), 38. doi:10.1186/s12864-019-6273-1
Otomo, A., Kunita, R., Suzuki-Utsunomiya, K., Mizumura, H., Onoe, K., Osuga, H., et al. (2008). ALS2/alsin Deficiency in Neurons Leads to Mild Defects in Macropinocytosis and Axonal Growth. Biochem. Biophysical Res. Commun. 370 (1), 87–92. doi:10.1016/j.bbrc.2008.01.177
Pal, D., Ellis, A., Sepúlveda-Ramírez, S. P., Salgado, T., Terrazas, I., Reyes, G., et al. (2020). Rac and Arp2/3-Nucleated Actin Networks Antagonize Rho during Mitotic and Meiotic Cleavages. Front. Cell Dev. Biol. 8, 591141. doi:10.3389/fcell.2020.591141
Palombo, V., Gaspa, G., Conte, G., Pilla, F., Macciotta, N., Mele, M., et al. (2020). Combined Multivariate Factor Analysis and GWAS for Milk Fatty Acids Trait in Comisana Sheep Breed. Anim. Genet. 51 (4), 630–631. doi:10.1111/age.12948
Pollott, G. E., and Greeff, J. C. (2004). Genotype × Environment Interactions and Genetic Parameters for Fecal Egg Count and Production Traits of Merino Sheep1. J. Anim. Sci. 82 (10), 2840–2851. doi:10.2527/2004.82102840x
Poltavski, D. M., Colombier, P., Hu, J., Duron, A., Black, B. L., and Makita, T. (2019). Venous Endothelin Modulates Responsiveness of Cardiac Sympathetic Axons to Arterial Semaphorin. Elife 8, e42528. doi:10.7554/eLife.42528
Poukkula, M., Kremneva, E., Serlachius, M., and Lappalainen, P. (2011). Actin-depolymerizing Factor Homology Domain: a Conserved Fold Performing Diverse Roles in Cytoskeletal Dynamics. Cytoskeleton 68 (9), 471–490. doi:10.1002/cm.20530
Punetha, J., Kesari, A., Hoffman, E. P., Gos, M., Kamińska, A., Kostera-Pruszczyk, A., et al. (2017). NovelCol12A1variant Expands the Clinical Picture of Congenital Myopathies with Extracellular Matrix Defects. Muscle Nerve 55 (2), 277–281. doi:10.1002/mus.25232
Purcell, S., Neale, B., Todd-Brown, K., Thomas, L., Ferreira, M. A. R., Bender, D., et al. (2007). PLINK: a Tool Set for Whole-Genome Association and Population-Based Linkage Analyses. Am. J. Hum. Genet. 81 (3), 559–575. doi:10.1086/519795
Quintá, H. R., Pasquini, J. M., Rabinovich, G. A., and Pasquini, L. A. (2014). Glycan-dependent Binding of Galectin-1 to Neuropilin-1 Promotes Axonal Regeneration after Spinal Cord Injury. Cell Death Differ 21 (6), 941–955. doi:10.1038/cdd.2014.14
Redoy, M. R. A., Shuvo, A. A. S., Cheng, L., and Al-Mamun, M. (2020). Effect of Herbal Supplementation on Growth, Immunity, Rumen Histology, Serum Antioxidants and Meat Quality of Sheep. Animal 14 (11), 2433–2441. doi:10.1017/S1751731120001196
Ridley, A. J. (2006). Rho GTPases and Actin Dynamics in Membrane Protrusions and Vesicle Trafficking. Trends Cell Biol. 16 (10), 522–529. doi:10.1016/j.tcb.2006.08.006
Roden, J. A., Merrell, B. G., Murray, W. A., and Haresign, W. (2003). Genetic Analysis of Live Weight and Ultrasonic Fat and Muscle Traits in a hill Sheep Flock Undergoing Breed Improvement Utilizing an Embryo Transfer Programme. Animalence 76 (03), 367–373. doi:10.1046/j.1365-2052.2003.01012.x10.1017/s1357729800058598
Sato, K., Otomo, A., Ueda, M. T., Hiratsuka, Y., Suzuki-Utsunomiya, K., Sugiyama, J., et al. (2018). Altered Oligomeric States in Pathogenic ALS2 Variants Associated with Juvenile Motor Neuron Diseases Cause Loss of ALS2-Mediated Endosomal Function. J. Biol. Chem. 293 (44), 17135–17153. doi:10.1074/jbc.RA118.003849
Savoia, S., Albera, A., Brugiapaglia, A., Di Stasio, L., Cecchinato, A., and Bittante, G. (2019). Heritability and Genetic Correlations of Carcass and Meat Quality Traits in Piemontese Young Bulls. Meat Sci. 156, 111–117. doi:10.1016/j.meatsci.2019.05.024
Smith, S. M., and Maughan, P. J. (2015). SNP Genotyping Using KASPar Assays. Methods Mol. Biol. 1245, 243–256. doi:10.1007/978-1-4939-1966-6_18
Tao, L., He, X. Y., Pan, L. X., Wang, J. W., Gan, S. Q., and Chu, M. X. (2020). Genome‐wide Association Study of Body Weight and Conformation Traits in Neonatal Sheep. Anim. Genet. 51 (2), 336–340. doi:10.1111/age.12904
Tong, J., and Sun, X. (2015). Genetic and Genomic Analyses for Economically Important Traits and Their Applications in Molecular Breeding of Cultured Fish. Sci. China Life Sci. 58 (2), 178–186. doi:10.1007/s11427-015-4804-9
Tortereau, F., Marie-Etancelin, C., Weisbecker, J.-L., Marcon, D., Bouvier, F., Moreno-Romieux, C., et al. (2020). Genetic Parameters for Feed Efficiency in Romane Rams and Responses to Single-Generation Selection. Animal 14 (4), 681–687. doi:10.1017/s1751731119002544
van Es, M. A., van Vught, P. W., Blauw, H. M., Franke, L., Saris, C. G., Van Den Bosch, L., et al. (2008). Genetic Variation in DPP6 Is Associated with Susceptibility to Amyotrophic Lateral Sclerosis. Nat. Genet. 40 (1), 29–31. doi:10.1038/ng.2007.52
Yaqun, Z., Daniela, Z., Yayoi, I., Shreya, G., Gudrun, S., Knut, B., et al. (2014). Recessive and Dominant Mutations in COL12A1 Cause a Novel EDS/myopathy Overlap Syndrome in Humans and Mice. Hum. Mol. Genet. 23 (9), 2339–2352. doi:10.1093/hmg/ddt627
Zhang, D., Zhang, X., Li, F., Li, C., La, Y., Mo, F., et al. (2019). Transcriptome Analysis Identifies Candidate Genes and Pathways Associated with Feed Efficiency in Hu Sheep. Front. Genet. 10, 1183. doi:10.3389/fgene.2019.01183
Keywords: whole genome sequencing, case-control GWAS, genetic parameters, association analysis, sheep breeding
Citation: Zhao Y, Zhang X, Li F, Zhang D, Zhang Y, Li X, Song Q, Zhou B, Zhao L, Wang J, Xu D, Cheng J, Li W, Lin C, Yang X, Zeng X and Wang W (2022) Whole Genome Sequencing Analysis to Identify Candidate Genes Associated With the rib eye Muscle Area in Hu Sheep. Front. Genet. 13:824742. doi: 10.3389/fgene.2022.824742
Received: 29 November 2021; Accepted: 14 February 2022;
Published: 14 March 2022.
Edited by:
Mudasir Ahmad Syed, Sher-e-Kashmir University of Agricultural Sciences and Technology, IndiaReviewed by:
Francesco Tiezzi, University of Florence, ItalyCopyright © 2022 Zhao, Zhang, Li, Zhang, Zhang, Li, Song, Zhou, Zhao, Wang, Xu, Cheng, Li, Lin, Yang, Zeng and Wang. This is an open-access article distributed under the terms of the Creative Commons Attribution License (CC BY). The use, distribution or reproduction in other forums is permitted, provided the original author(s) and the copyright owner(s) are credited and that the original publication in this journal is cited, in accordance with accepted academic practice. No use, distribution or reproduction is permitted which does not comply with these terms.
*Correspondence: Weimin Wang, d2FuZ3dtQGdzYXUuZWR1LmNu
Disclaimer: All claims expressed in this article are solely those of the authors and do not necessarily represent those of their affiliated organizations, or those of the publisher, the editors and the reviewers. Any product that may be evaluated in this article or claim that may be made by its manufacturer is not guaranteed or endorsed by the publisher.
Research integrity at Frontiers
Learn more about the work of our research integrity team to safeguard the quality of each article we publish.