
95% of researchers rate our articles as excellent or good
Learn more about the work of our research integrity team to safeguard the quality of each article we publish.
Find out more
ORIGINAL RESEARCH article
Front. Genet. , 07 March 2022
Sec. Human and Medical Genomics
Volume 13 - 2022 | https://doi.org/10.3389/fgene.2022.805961
This article is part of the Research Topic Cancer systems biology View all 16 articles
 Xin Zhou
1,2
†
Xin Zhou
1,2
†
 Jia-mi Huang
1,2
†
Jia-mi Huang
1,2
† Tian-man Li1,3Jun-qi Liu1,2Zhong-liu Wei1,2Chen-lu Lan1,2Guang-zhi Zhu1,2
 Xi-wen Liao
1,2Xin-ping Ye1,2
Xi-wen Liao
1,2Xin-ping Ye1,2
 Tao Peng
1,2*
Tao Peng
1,2*The purpose of this investigation was to assess the diagnostic and prognostic significance of ATP binding cassette subfamily C (ABCC) genes in hepatocellular carcinoma (HCC). The Student t-test was used to compare the expression level of ABCCs between HCC and paraneoplastic tissues. Receiver operating characteristic curve (ROC) analysis was applied for diagnostic efficiency assessment. The Kaplan–Meier method and Cox proportional hazards model were respectively applied for survival analysis. Genes with prognostic significance were subsequently used to construct prognostic models. From the perspective of genome-wide enrichment analysis, the mechanisms of prognosis-related ABCC genes were attempted to be elaborated by gene set enrichment analysis (GSEA). It was observed in the TCGA database that ABCC1, ABCC4, ABCC5, and ABCC10 were significantly upregulated in tumor tissues, while ABCC6 and ABCC7 were downregulated in HCC tissues. Receiver operating characteristic analysis revealed that ABCC7 might be a potential diagnostic biomarker in HCC. ABCC1, ABCC4, ABCC5, and ABCC6 were significantly related to the prognosis of HCC in the TCGA database. The prognostic significance of ABCC1, ABCC4, ABCC5, and ABCC6 was also observed in the Guangxi cohort. In the Guangxi cohort, both polymerase chain reaction and IHC (immunohistochemical) assays demonstrated higher expression of ABCC1, ABCC4, and ABCC5 in HCC compared to liver tissues, while the opposite was true for ABCC6. GSEA analysis indicated that ABCC1 was associated with tumor differentiation, nod-like receptor signal pathway, and so forth. It also revealed that ABCC4 might play a role in HCC by regulating epithelial-mesenchymal transition, cytidine analog pathway, met pathway, and so forth. ABCC5 might be associated with the fatty acid metabolism and KRT19 in HCC. ABCC6 might impact the cell cycle in HCC by regulating E2F1 and myc. The relationship between ABCC genes and immune infiltration was explored, and ABCC1,4,5 were found to be positively associated with infiltration of multiple immune cells, while ABCC6 was found to be the opposite. In conclusion, ABCC1, ABCC4, ABCC5, and ABCC6 might be prognostic biomarkers in HCC. The prognostic models constructed with ABCC1, ABCC4, ABCC5, and ABCC6 had satisfactory efficacy.
Hepatocellular carcinoma (HCC) generally followed cirrhosis given rise by metabolic disorder (Yang et al., 2019), chronic ethanol intake (Llovet et al., 2016), and hepatitis virus infection (Fujiwara et al., 2018). The leading metabolic risk factor for HCC is non-alcoholic fatty liver disease (NAFLD) (Zhang, 2018), which is mainly related to obesity and type 2 diabetes. Currently, it is acknowledged that hepatitis B virus (HBV) and hepatitis C virus (HCV) were the main infectious etiologies for cirrhosis and HCC. It is worth mentioning that viral hepatitis could skip cirrhosis and induced HCC directly and independently (El-Serag, 2012; Levrero and Zucman-Rossi, 2016). Besides the aforementioned factors, the intake of Aflatoxin B1 (AFB1) was also demonstrated to be related to HCC (Rushing and Selim, 2019). People in specific regions entailing relatively high exposure to Aflatoxin B1 were accompanied by high incidence and mortality of HCC (Long et al., 2008; Wogan et al., 2012; Zhang W et al., 2017). More than 8 million new cases of liver cancer occurred worldwide each year, which directly or indirectly gave rise to more than 4 million deaths worldwide each year (Torre et al., 2015; Bray et al., 2018). Asia has the highest incidence of liver cancer in the world, particularly in China, which accounts for almost half the global cases (Akinyemiju et al., 2017). At the same time, Asia is the high-incidence area of HBV and HCV (Gower et al., 2014; Polaris Observatory Collaborators, 2018). The main treatment methods of liver cancer mainly include surgical resection, transcatheter arterial chemoembolization (TACE), ablation, liver transplantation, radiotherapy, and so forth (Fattovich et al., 2004). Sorafenib, the multi-kinase inhibitor, is one of first-line drugs approved for the treatment of advanced HCC. Although it can improve survival, the long-term survival of HCC patients is limited due to the drug resistance. Hence, the discovery of new hub genes for developing HCC-targeted drugs and specific genes that improve and maintain drug susceptibility might be hopeful for advanced-stage HCC patients.
The ATP binding cassette subfamily C (ABCC) subfamily includes 13 members whose protein products take effect in transporters with different functional profiles, including ion transport, cell surface receptor, and toxin secretion activity (Childs and Ling, 1994; Dean and Allikmets, 2001; Robey et al., 2018; Yamada et al., 2018). The ATP-binding domain of the ABCC product possesses distinctive conserved motifs (Walker A and B motifs), which are separated by an uncertain sequence of around 100 amino acids (Dean et al., 2001). The distinctive interval and conserved motifs distinguish ABCC members from other ATP-binding proteins (Higgins et al., 1986). Genetic variations in these genes are substantiated in numerous research studies to be the cause or contributor to a variety of complex human diseases, including cystic fibrosis, neurological diseases, defects in cholesterol and bile transport, and drug responses. The ABCC subfamily plays an important role in the pharmacokinetics of endogenous and exogenous compounds. Studies have shown that the members of the ABCC family could transport drugs to the extracellular substances by virtue of ATP energy (Chen and Tiwari, 2011; Keppler, 2011; Leslie, 2012).
RNA-Seq data (FPKM) of 412 samples, 362 tumors, and 50 paraneoplastic tissues were acquired from the TCGA database (https://portal.gdc.cancer.gov/, accessed on 22 December 2019). The limma package was employed for normalization of this RNA-Seq data in R. Matched prognostic/clinicopathologic data of these 362 patients were acquired from UCSC Xena (http://xena.ucsc.edu/, accessed on 23 December 2019).
The HCC tissues and matched paracancer tissues of 102 patients hospitalized in the first affiliated hospital of Guangxi Medical University from September 2016 to December 2018 were collected after informed consent was obtained. Among them, excised tissues during surgery of 72 patients were well preserved in the Department of Pathology. Tissue slices of these patients were obtained from the Department of Pathology.
The expression levels of ABCCs in HCC and paraneoplastic tissues were extracted from the RNA-Seq Chip matrix in the TCGA database. The normality test was assessed using the Kolmogorov–Smirnov normality test. Student’s t-test was used to assess the statistical significance of ABCC genes’ expression between HCC and paraneoplastic tissues. The area under the curve (AUC) of the receiver operating characteristic curve (ROC) was used to access the diagnostic efficiency of each ABCC gene in HCC. AUC > 0.8 with p < 0.05 was considered as satisfactory diagnostic performance (Hosmer et al., 2013).
Tissue sections were sequentially placed in xylene and graded concentrations of ethanol to achieve hydration. Antigens were repaired with a pH 6.0 citrate repair solution (ZSGB-BIO, Beijing, China). Subsequent antigen–antibody reactions and color development reactions were performed with the help of a universal two-step detection kit (Mouse/Rabbit Enhanced Polymer Detection System). Immunohistochemical scores were assessed by two experienced pathologists. Antibodies for ABCC1, ABCC4, ABCC5, and ABCC6 were diluted according to the recommended concentrations of the manufacturer (Proteintech, Wuhan, China).
The patients in the TCGA database were divided into two groups in terms of the median value of each ABCC gene expression for survival analysis. The Kaplan–Meier method with a log-rank test was applied to assess the prognostic significance of each ABCC gene. The Cox proportional hazards model was applied to adjust the bias caused by prognosis-related clinicopathologic factors.
In terms of survival analysis results in the TCGA database, the prognostic significance of ABCC1, ABCC4, ABCC5, and ABCC6 was further validated in the Guangxi cohort.
For better predicting the prognosis and evaluating the combined effect of ABCCs, prognosis-related ABCCs (ABCC1, ABCC4, ABCC5, and ABCC6) were integrated in pairs into combined effect survival analysis. The patients were divided into four groups in terms of the expression level of ABCCs with details displayed in Table 2. The Kaplan–Meier method with the log-rank test and Cox proportional hazards model were applied to assess the prognostic significance.
Independent prognostic factors, including ABCCs and clinicopathologic features, were integrated to construct the nomogram in R with the rms package (Iasonos et al., 2008). In the nomogram, the risk degree of each variable in the nomogram was displayed by the integration line, and the total risk score is obtained by adding up the risk value of each variable (Zhang Z et al., 2017). The model was validated for calibration and discrimination using the bootstrap method (Wang et al., 2013).
The Cox proportional hazards model was used to assess the risk coefficient of ABCCs in overall survival. Then, the prognostic signature was constructed in terms of the expression of ABCCs and the corresponding risk coefficient. The formula of prognostic signature construction is as follows:
The Gene Ontology (GO) database, the integrated database of calculable information about the functions of genes, was comprehensively used for identifying unique biological properties of high-throughput transcriptome or genome data (The Gene Ontology Consortium, 2017; Chen L et al., 2017). KEGG is a collection of databases dealing with genomes, diseases, biological pathways, drugs, and chemical materials (Kanehisa et al., 2017). DAVID (The Database for Annotation, Visualization, and Integrated Discovery, https://david.ncifcrf.gov/) is an online bioinformatics tool to access the GO database and the KEGG database (Long et al., 2008). DAVID was used to access the enrichment of biological functions and pathways of ABCC genes in this investigation. Then, the enrichment biological functions and pathways were visualized in R Studio (Version 1.2.5033) with packages Goplot, Hmisc, and ggplot2 (Nolan et al., 2013; Ito and Murphy, 2013). The Biological Networks Gene Ontology tool (BiNGO) is an open-source online database, which was employed to determine the significantly overrepresented GO terms of ABCC genes (Maere et al., 2005). Functions and interactions of ABCC genes were performed in Genemania (http://genemania.org/. accessed on 11 August 2020) and STRING (https://string-db.org/. accessed on 11 August 2020), respectively (Szklarczyk et al., 2015; Luo et al., 2020).
GSEA is software with additional resources for analyzing, annotating, and interpreting standardized chip matrices. In this investigation, GSEA enrichment was used to analyze the enriched biological pathways of ABCC1, ABCC4, ABCC5, and ABCC6 in the TCGA database. The Oncogenic Signatures c2.all.v7.1.symbols.gmt data set was adopted as the reference data set. The biological pathways exported from GSEA with p < 0.05 and FDR < 0.25 were considered as significant results.
TIMER (http://timer.cistrome.org/) is a comprehensive resource for the systematical analysis of immune infiltrates across diverse cancer types, which provides immune infiltrates abundances estimated by multiple immune deconvolution methods. In this investigation, TIMER was accessed to explore the correlation between infiltrating immune cells and ABCC expression in HCC.
Several ABCC genes were discovered to be differentially expressed in HCC and paraneoplastic tissues based on the RNA-seq data of the TCGA database. ABCC1, ABCC4, ABCC5, and ABCC10 (Figures 1A,C,D,H) were significantly higher expressed in HCC tissues, but ABCC2, ABCC6, ABCC7, and ABCC9 (Figures 1B,E–G) were significantly lower expressed in HCC tissues. No significant differences in the expression of ABCC3, ABCC8, ABCC11, ABCC12, and ABCC13 were observed between liver and HCC tissues (Supplementary Figures S1A–E). The diagnostic efficacy of the genes differentially expressed between HCC and paraneoplastic tissues was subsequently evaluated using ROC curve analysis. Among them (ABCC1, ABCC2, ABCC4, ABCC5, ABCC6, ABCC7, ABCC9, and ABCC10), high diagnostic efficiencies of ABCC5 (AUC = 0.905, p < 0.001), ABCC7 (AUC = 0.878, p < 0.001), ABCC9 (AUC = 0.878, p < 0.001), and ABCC10 (AUC = 0.951, p < 0.001) (Figures 2A–D) were observed in HCC. The results of the diagnostic efficacy analysis of other ABCC genes are shown in Supplementary Figures S2A–I.
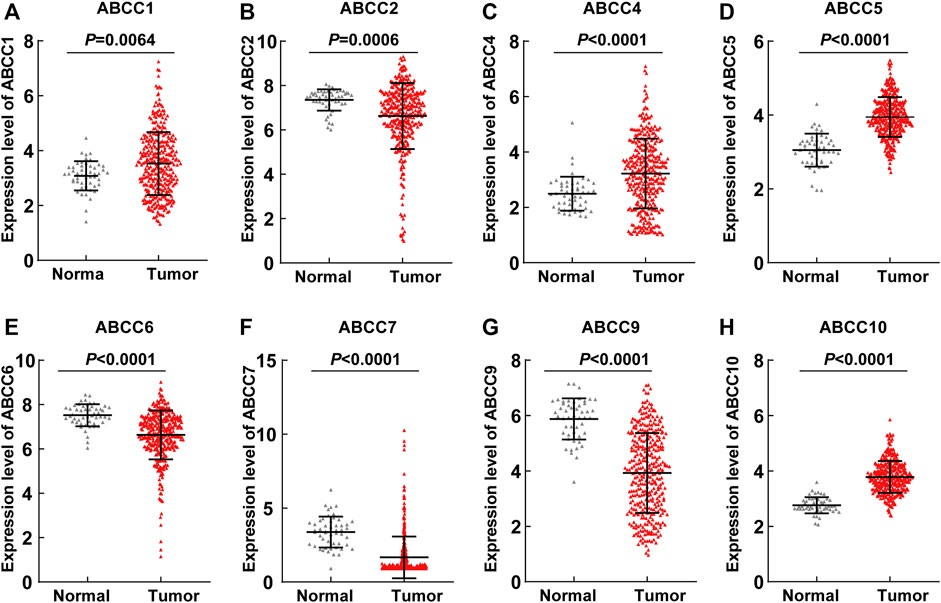
FIGURE 1. ABCC1, ABCC2, ABCC4, ABCC5, ABCC6, ABCC7, ABCC9, and ABCC10 were differently expressed between the HCC tissues and paraneoplastic tissues based on the RNA-seq data of the TCGA database: (A) ABCC1, (B) ABCC2, (C) ABCC4, (D) ABCC5, (E) ABCC6, (F) ABCC7, (G) ABCC9, and (H) ABCC10.
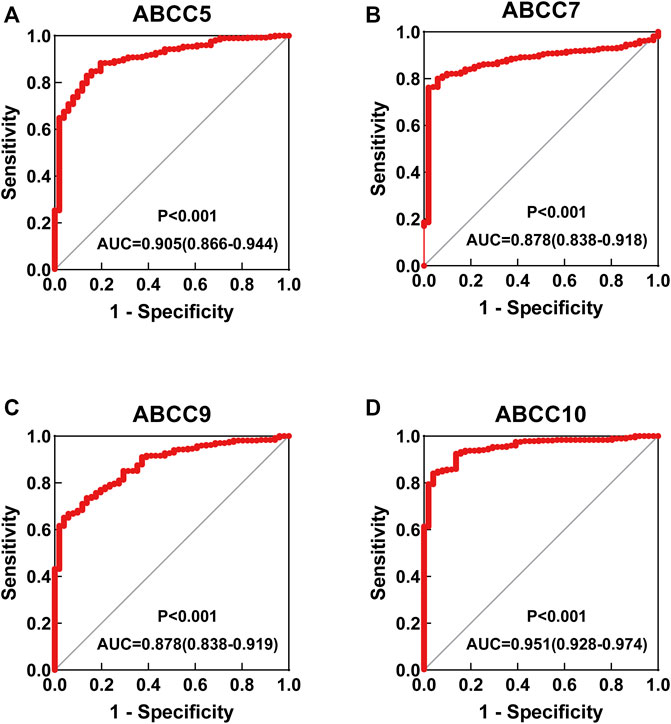
FIGURE 2. ROC curve for ABCC genes in the TCGA database: (A) ABCC5, (B) ABCC7, (C) ABCC9, and (D) ABCC10.
Subsequently, the prognostic significance of ABCC genes was systematically discussed. The clinicopathologic characteristics of 362 HCC tissues in the TCGA database are displayed in Supplementary Table S1. The expression levels of ABCC1 (log-rank p = 0.002, adjusted p = 0.008, adjusted HR = 1.656), ABCC4 (log-rank p = 0.026, adjusted p = 0.038, adjusted HR = 1.479), ABCC5 (log-rank p = 0.002, adjusted p = 0.001, adjusted HR = 1.928), and ABCC6 (log-rank p < 0.001, adjusted p = 0.001, adjusted HR = 0.534) were significantly associated with the overall survival of HCC patients in univariate and multivariate survival analysis (Table 1; Figures 3A–D). In terms of the prognostic value of a single ABCC gene, patients with high expression of ABCC1, ABCC4, or ABCC5 tend to be with a shorter median survival time, while high-expression ABCC6 was associated with longer survival. The results of survival analysis of other ABCC genes are shown in Supplementary Figures S3A–I.
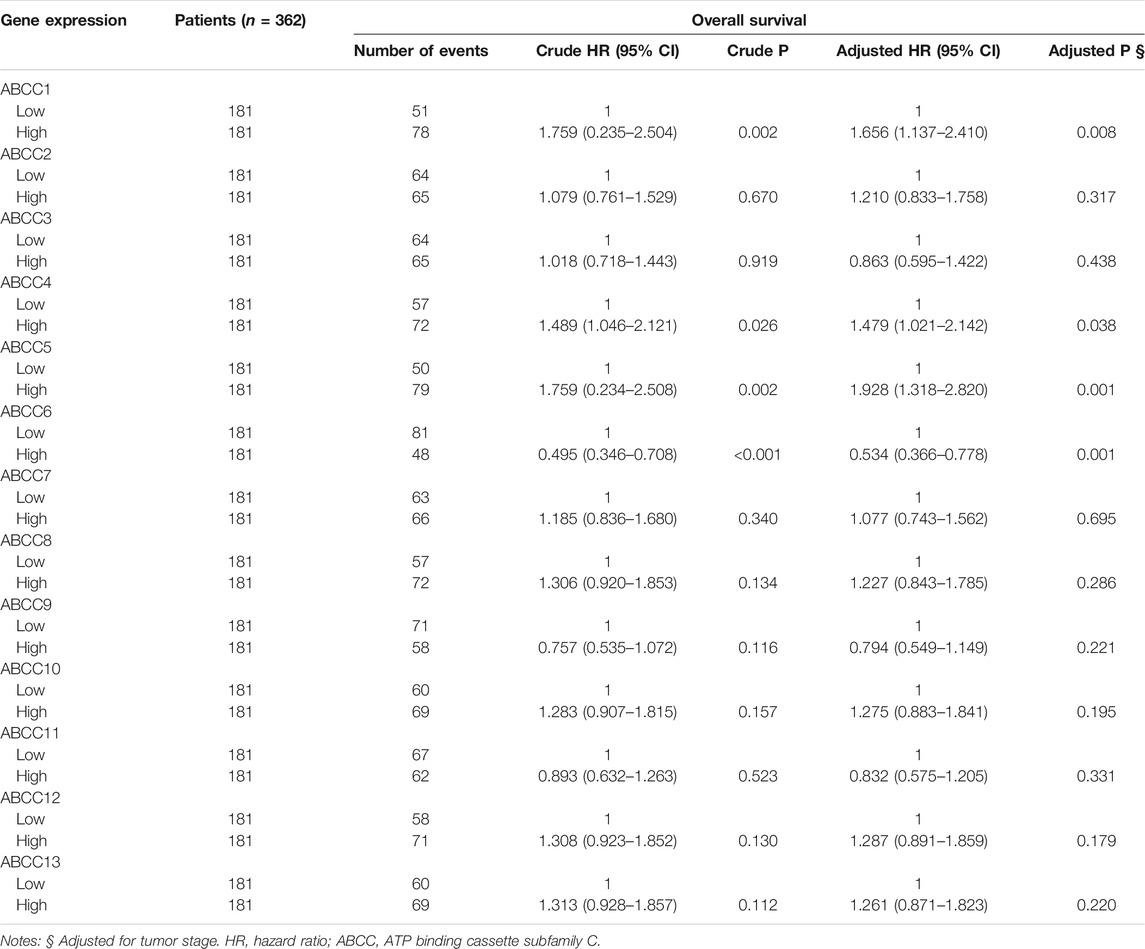
TABLE 1. Survival analysis results of ABCC genes in the TCGA database.
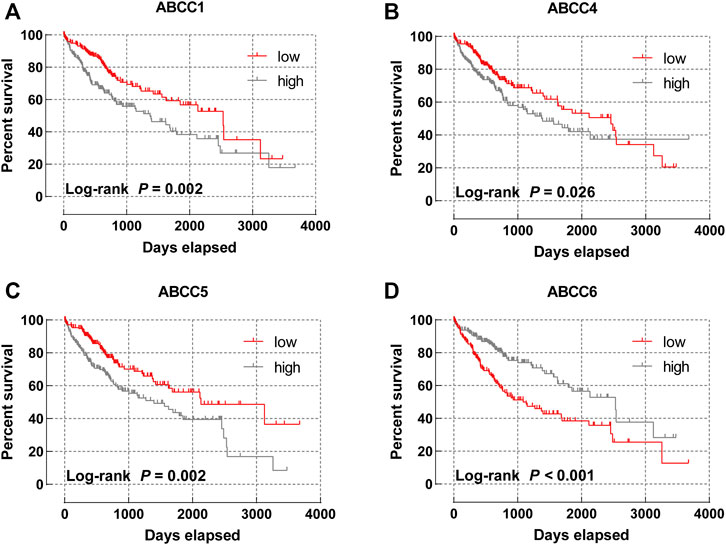
FIGURE 3. Survival curve of ABCC genes in the TCGA database: (A) ABCC1, (B) ABCC4, (C) ABCC5, and (D) ABCC6.
To more accurately predict the prognosis of HCC patients, multivariate survival analysis was integrated into the combined effect survival analysis. In the combined effect survival analysis, it was observed that there was an even bigger prognosis difference among groups in combined effect survival analysis (Table 2). Group C with high expression of ABCC1 and ABCC4 was significantly correlated to bad outcome (p = 0.001, Figure 4A), so were group 3 with high expression of ABCC1 and ABCC5 (p < 0.001, Figure 4B), group c with high expression of ABCC1 and low expression of ABCC4 (p < 0.001, Figure 4C), group Ⅲ with high expression of ABCC4 and ABCC5 (p = 0.001, Figure 4D), group ⅲ with high expression of ABCC4 and low expression of ABCC6 (p < 0.001, Figure 4E), and group γ with high expression of ABCC5 and low expression of ABCC6 (p < 0.001, Figure 4F).
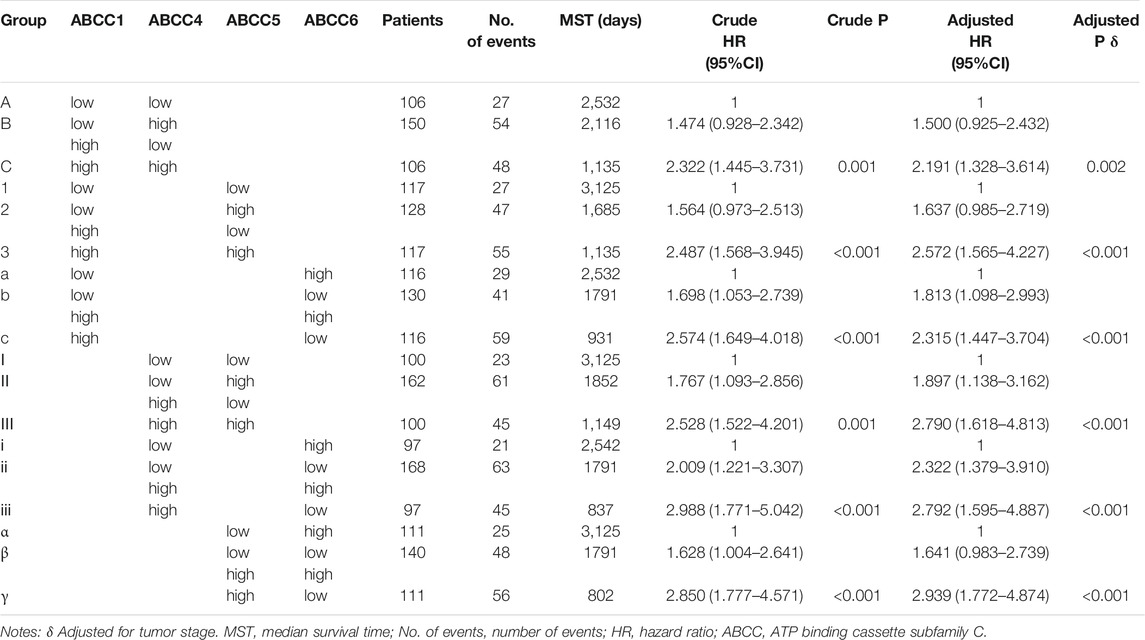
TABLE 2. Combined effect survival analysis of ABCC1, ABCC4, ABCC5, and ABCC6.
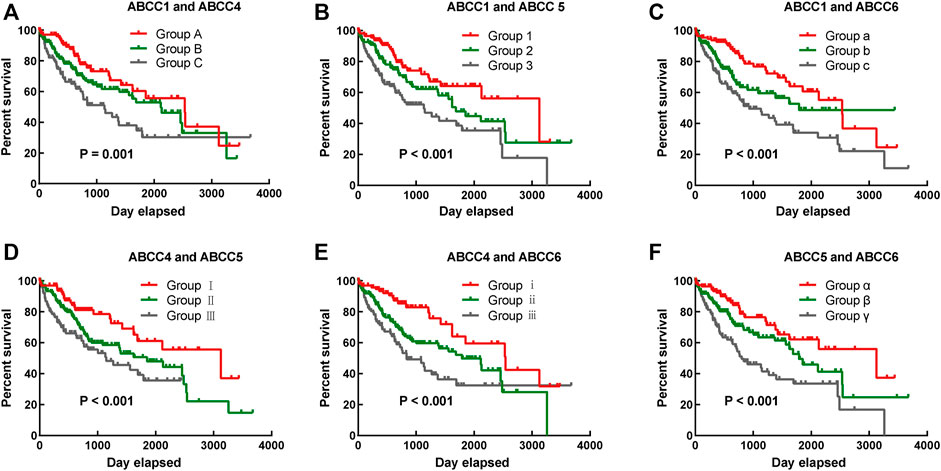
FIGURE 4. Combined effect survival analysis of ABCC1, ABCC4, ABCC5, and ABCC6 in the TCGA database: (A) combined effect survival analysis of ABCC1 and ABCC4, (B) combined effect survival analysis of ABCC1 and ABCC5, (C) combined effect survival analysis of ABCC1 and ABCC6, (D) combined effect survival analysis of ABCC4 and ABCC5, (E) combined effect survival analysis of ABCC4 and ABCC6, and (F) combined effect survival analysis of ABCC5 and ABCC6. The details about the groups are displayed in Table 2.
In the survival analysis, we found that ABCC1.4.5.6 was strongly associated with the prognosis of HCC. In addition, the clinical factor tumor stage could also partially distinguish patients with good and bad prognoses. Thus, a nomogram integrating clinical elements and ABCC gene expression was constructed in terms of the COX proportional hazards model. In the nomogram, the contribution of ABCC1, ABCC4, ABCC5, ABCC6, and clinicopathologic features to the overall survival of HCC patients was displayed by virtue of the length of the scales (Figure 5A). The calibration plot for 1-, 3-, and 5-year survival after surgery revealed a satisfactory overlap between calculation and reality (Figures 5B–D).
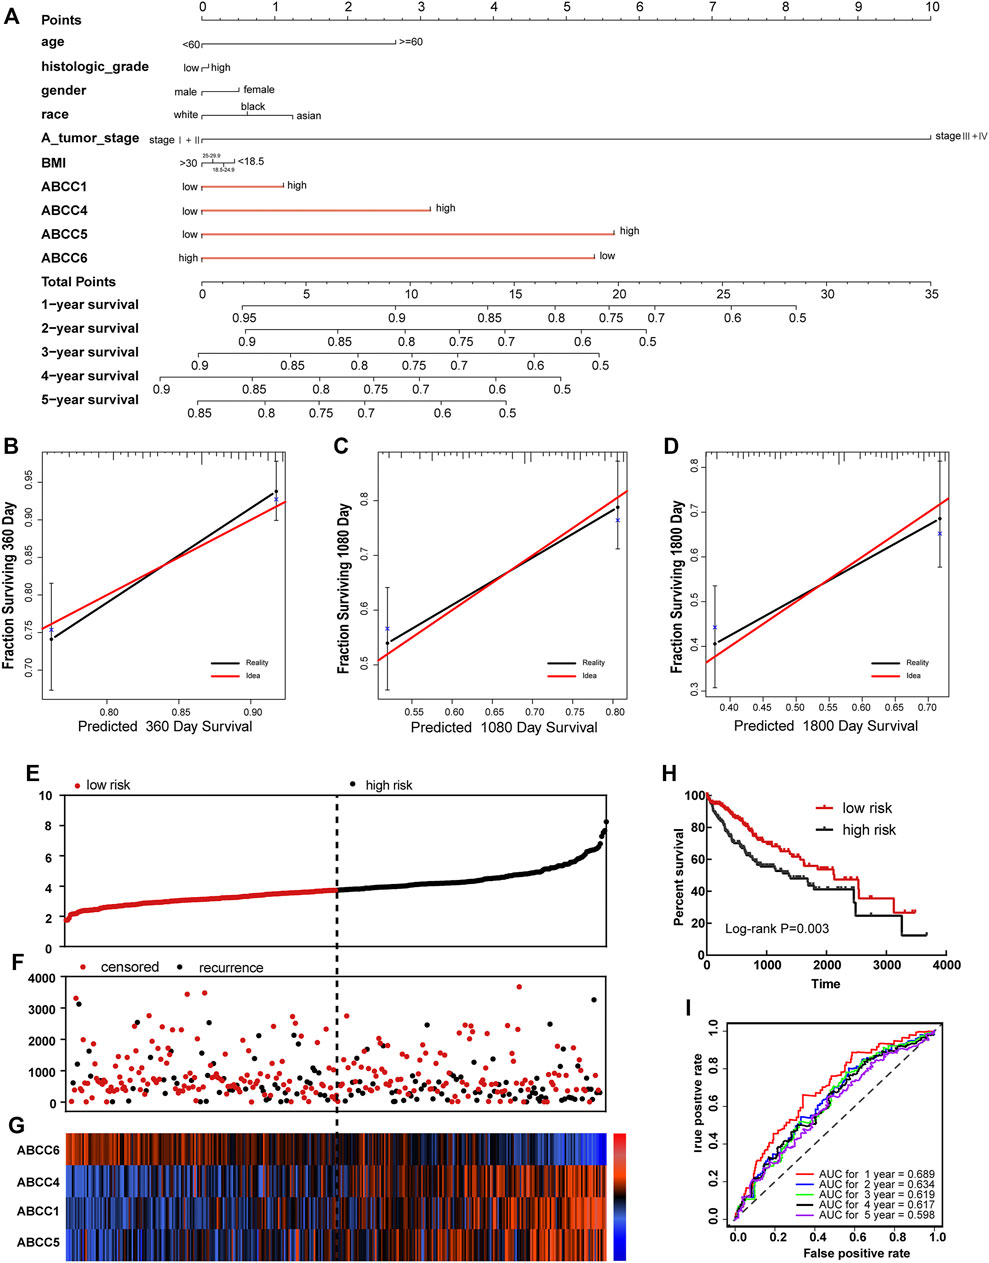
FIGURE 5. Nomogram and prognostic signature constructed in terms of ABCC1, ABCC4, ABCC5, and ABCC6 in the TCGA database: (A) Nomogram based on expression of ABCC genes and clinicopathologic features; (B) internal validation for 1-year survival; (C) internal validation for 3-year survival; (D) internal validation for 5-year survival; (E), scatter plot for risk score; (F) scatter plot for survival time (days); (G), heat map corresponding to the expression of ABCC1, ABCC4, ABCC5, and ABCC6; (H) survival analysis for high- and low-risk score groups; and (I) AUC for inspecting the efficiency of the prognostic signature for predicting long-term prognosis.
In terms of the expressions of ABCC1, ABCC4, ABCC5, and ABCC6, the prognostic signature for HCC patients was built in the TCGA database and Guangxi cohort. Each HCC patient was assigned with a risk score in terms of the expression of ABCC1, ABCC4, ABCC5, and ABCC6. In the prognostic signature built for the TCGA database, the risk score for each patient was displayed in the upper scatter plot, and the patients were divided into two groups based on the median value (Figure 5E). The survival time and survival status of specific patients can be observed from the middle scatter plot, which showed that the dots representing patients in the high-risk group tended to cluster lower (Figure 5F). The expression levels of ABCC1, ABCC4, ABCC5, and ABCC6 in patients were presented in the form of heat maps (Figure 5G). A significant difference in overall survival was observed between the high-risk and low-risk groups (Figure 5H, p = 0.003). The AUC value of the prognostic signature for 1-year, 3-year, and 5-year overall survival prediction was 0.689, 0.619, and 0.598, respectively (Figure 5I).
A total of 102patients who were hospitalized in the first affiliated hospital of Guangxi Medical University from September 2016 to December 2018 were taken into the group for validation. The baseline information for these patients is presented in Table 3. The expressions of ABCC in HCC tissues and in paraneoplastic tissues were detected by immunohistochemical (IHC) and polymerase chain reaction (PCR) assays, respectively. In the IHC assay, the expressions of ABCC1, ABCC4, and ABCC5 in HCC tissues were significantly higher than that of paraneoplastic tissues, while ABCC6 was higher expressed in paraneoplastic tissues (Figure 6A). The same expression trends of ABCC1, ABCC4, ABCC5, and ABCC6 were observed at the mRNA level (Figures 6B–E). The prognostic significance of ABCC1, ABCC4, ABCC5, and ABCC6 was also observed in the Guangxi HCC cohort (Figures 6F–I; Table 4).
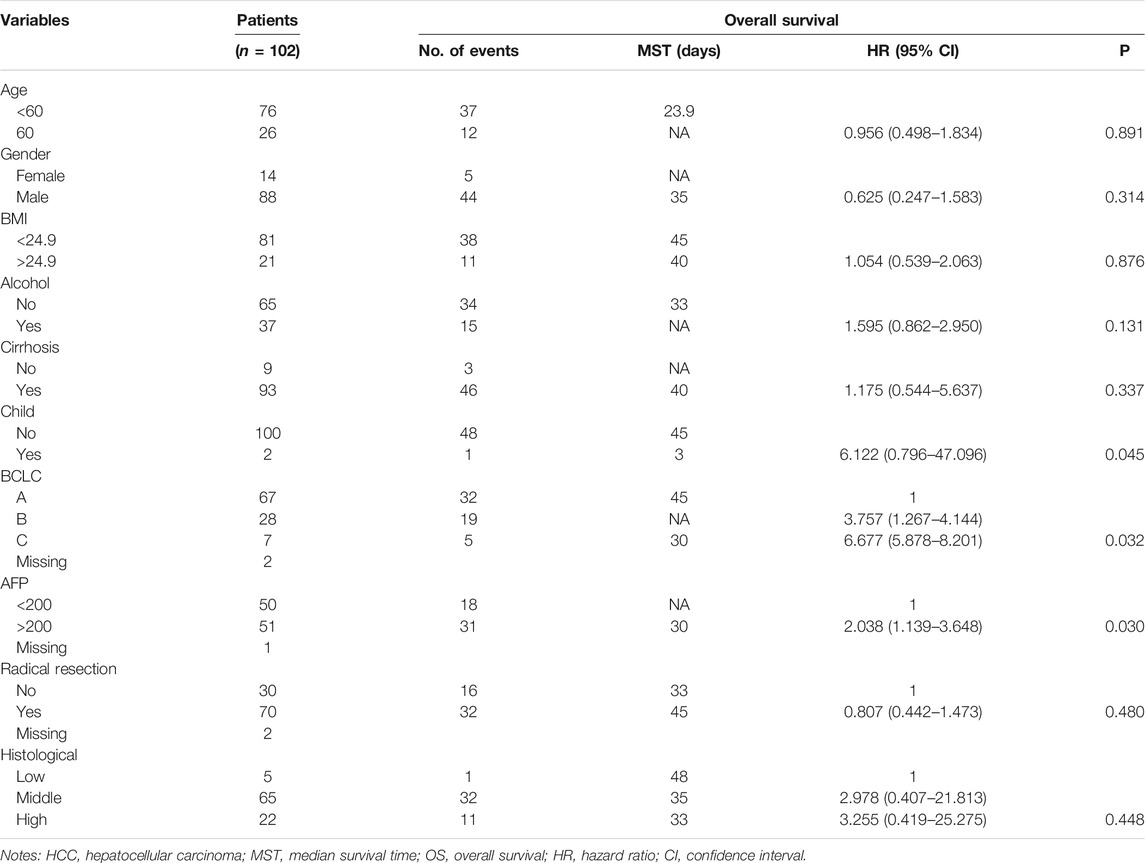
TABLE 3. Clinical characteristics of patients in HCC from Guangxi China.
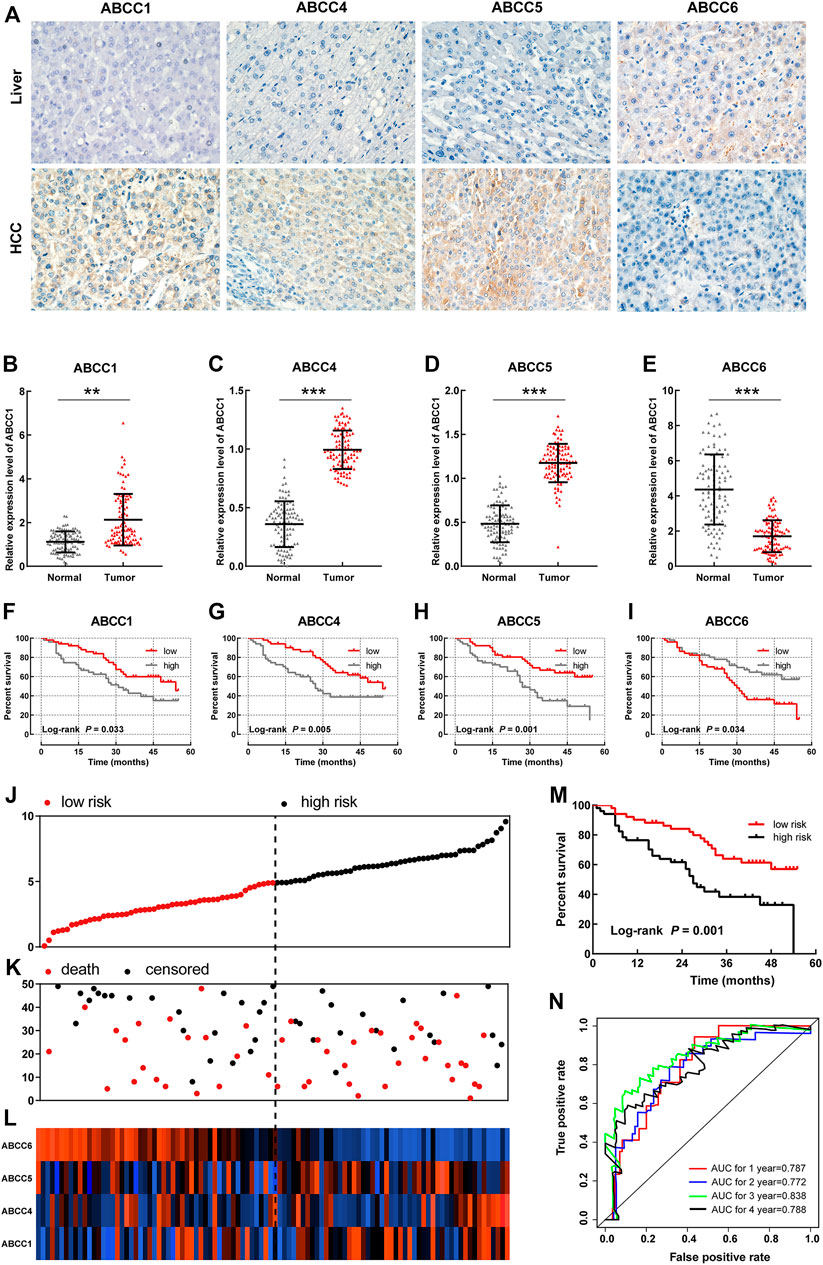
FIGURE 6. Validation for the prognostic significance of ABCC1, ABCC4, ABCC5, and ABCC6 in the Guangxi HCC cohort: (A) expression of ABCC1, ABCC4, ABCC5, and ABCC6 in HCC tissues and paraneoplastic tissues assessed by IHC assays; (B–E) histogram showing ABCC1, ABCC4, ABCC5, and ABCC6 expression levels in HCC tissues and paraneoplastic tissues assessed by PCR assays; (F–I) survival curve of ABCC1, ABCC4, ABCC5, and ABCC6 in the Guangxi HCC cohort; the patients were grouped based on median expression; (J) Scatter plot for risk score; (K) scatter plot for survival time (months); (L) heat map corresponding to the expression of ABCC1, ABCC4, ABCC5, and ABCC6; (M) survival analysis for high- and low-risk score groups; and (N) AUC for inspecting the efficiency of the prognostic signature for predicting long-term prognosis.
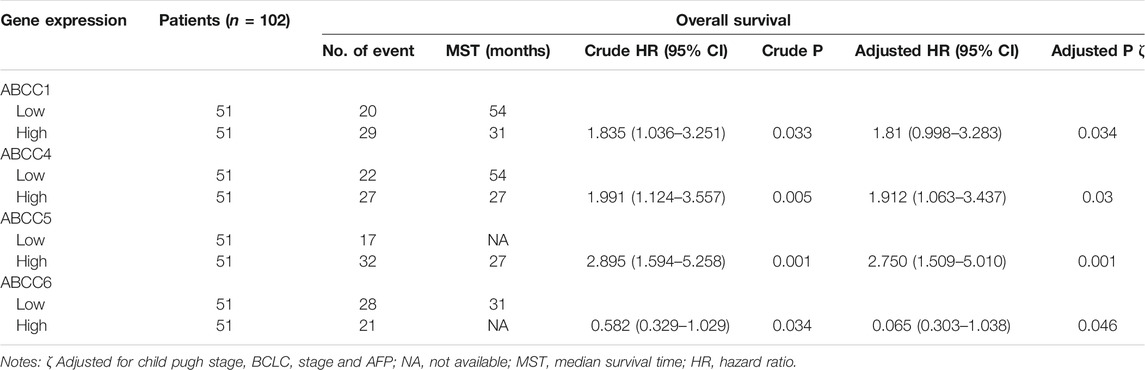
TABLE 4. Survival analysis results of ABCC genes in the Guangxi cohort.
In the prognostic signature built for the Guangxi cohort, patients were divided into two groups in terms of the risk score (Figure 6J). The same as above-mentioned, the dots representing patients in the high-risk group also tended to cluster lower (Figure 6K). The expression levels of ABCC1, ABCC4, ABCC5, and ABCC6 in patients were presented in the form of heat maps (Figure 6L). The prognosis of the high-risk group was significantly worse than that of the low-expression group (Figure 6M, p = 0.001). The AUC value of the prognostic signature for 1-year, 2-year, 3-year, and 4-year overall survival prediction was 0.787, 0.772, 0.838, and 0.788, respectively (Figure 6N). In the nomogram, the contribution of ABCC1, ABCC4, ABCC5, ABCC6, and clinicopathologic features to overall survival was displayed by the length of the corresponding scales (Supplementary Figure S4A). The calibration plot for 1-, 2- and 3-year survival after the surgery revealed a satisfactory overlap between calculation and reality (Supplementary Figures S4B–D).
The enrichment analysis of the ABCC gene by setting Homo sapiens as the background was performed on the DAVID online database for obtaining enrichment information about GO terms. The corresponding relationship between ABCCs and GO terms is displayed in Figure 7A. The enrichment analysis of GO showed that ABCCs were mainly related to ATP binding, ATP activity, transmembrane, and other biological functions (Figure 7B). The bubble color from red to green represents the biological function of the –log (p-value) from high to low. The network diagram of the relationship between enriched GO terms is shown in Figures 7C,D. Interactions of ABCCs which were analyzed from STRING and Genemania are respectively displayed in Figures 7E,F.
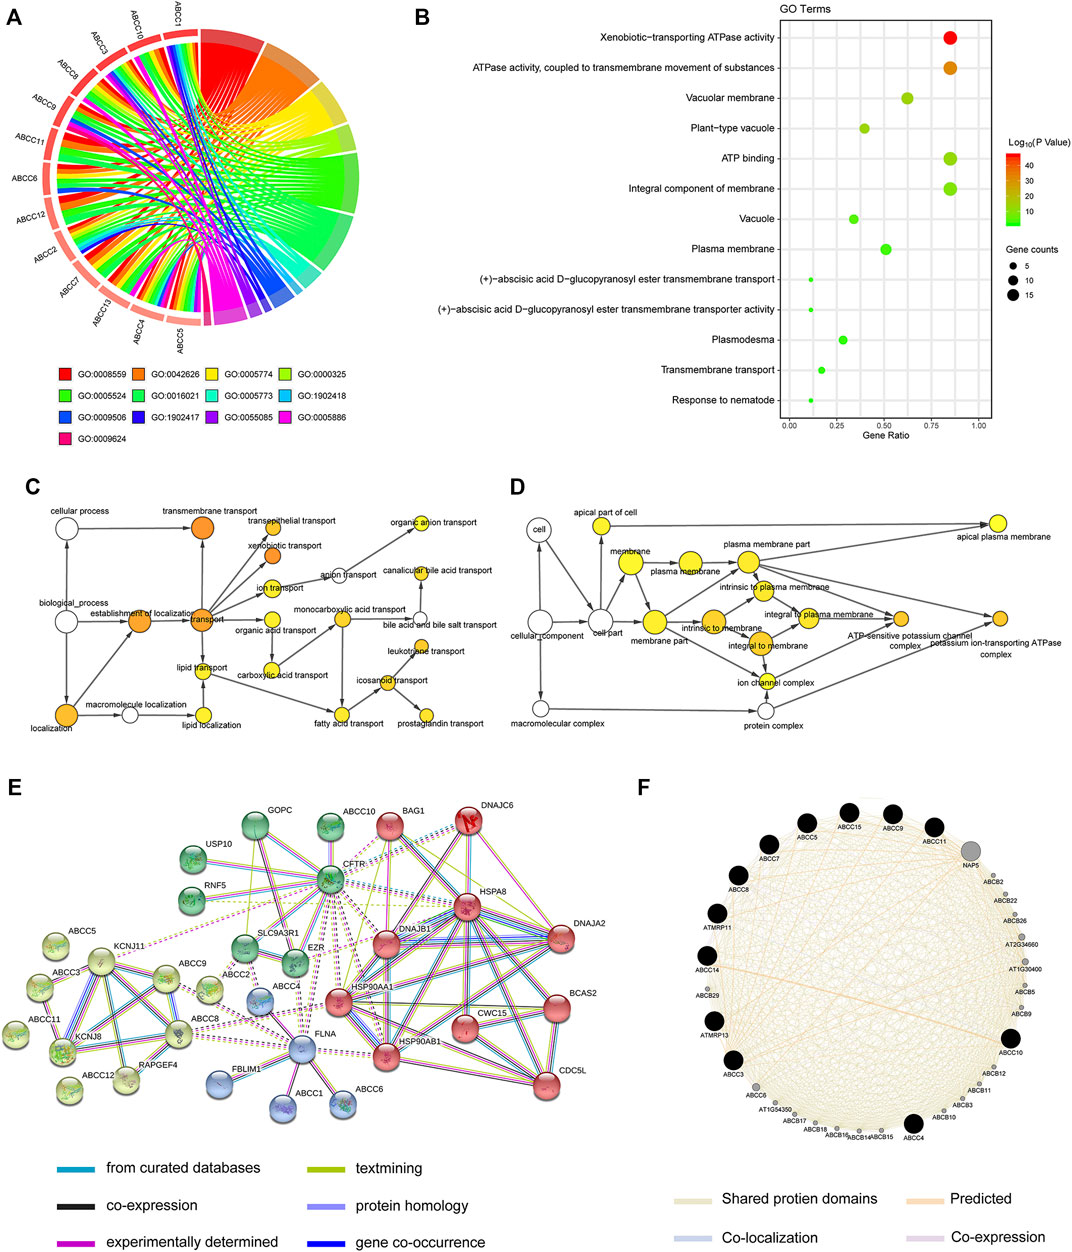
FIGURE 7. Biological function analysis for ABCC genes by bioinformatics: (A) circle plot for displaying the relationship between gene and GO term, (B) bubble plot for GO terms, (C-D) the network diagram of the relationship between enriched GO terms, (E-F) interactions of ABCCs that were analyzed from STRING and Genemania, respectively.
The GSEA results revealed that the expression of ABCC1 was associated with tumor differentiation, nod-like receptor signal pathway, resistance to the bcl2 inhibitor up, and so on (Figures 8A–F). The pathways that ABCC4 might regulate are shown in Figures 8G–L. ABCC5 might impact HCC by regulating the fatty acid metabolism and the expression of kt19 and myc (Figures 8M–O). The result of GSEA revealed that high expression of ABCC6 was accompanied with lower HCC late recurrence (Figure 8P). It also illustrated that ABCC6 might impact HCC by regulating E2F1 and myc (Figures 8Q,R).
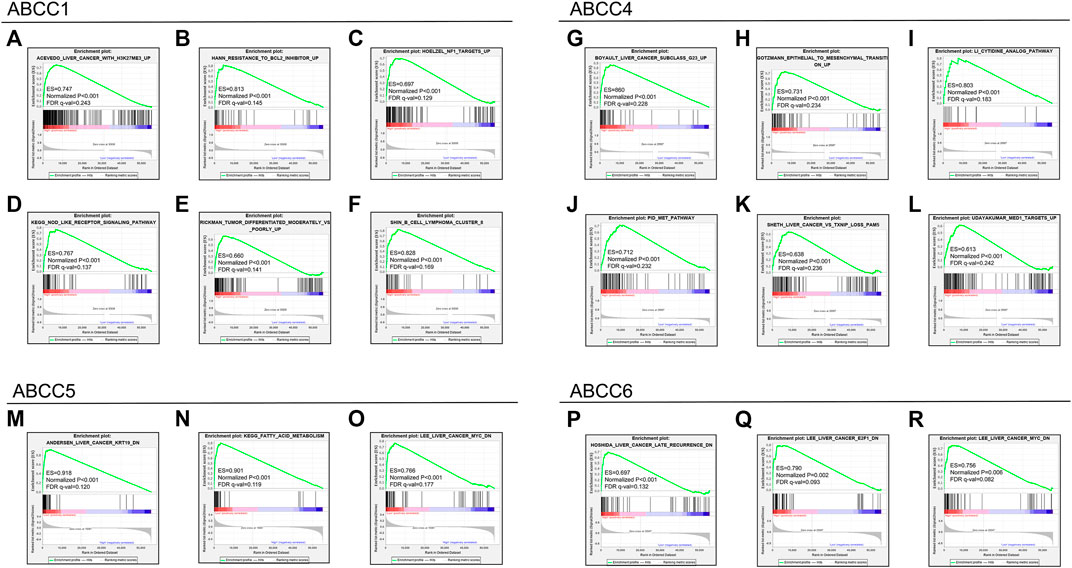
FIGURE 8. GSEA results for the ABCC genes in the TCGA database: (A–F) GSEA results for ABCC1 in HCC, (G–L) GSEA results for ABCC4 in HCC, (M–O) GSEA results for ABCC5 in HCC, and (P–R) GSEA results for ABCC6 in HCC.
The estimation of the abundance of immune cell infiltration showed that ABCC1, ABCC4, and ABCC5 were significantly positively associated with infiltration of immune cells, which include B cells, CD8+ T cells, CD4+ T cells, macrophages, neutrophils, and dendritic cells (Figures 9A–C). However, ABCC6 was negatively associated with the infiltration of immune cells (Figure 9D).
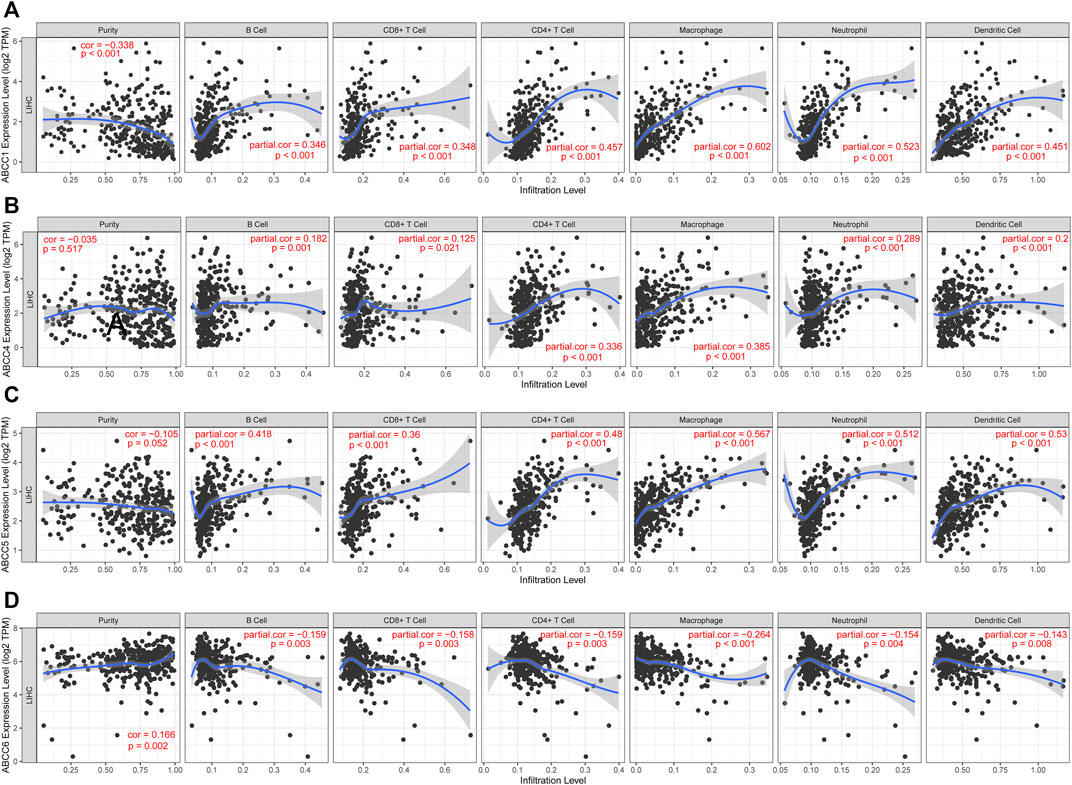
FIGURE 9. Correlation between ABCC gene expression and tumor-infiltrating immune cells: (A) scatter plot corresponding to ABCC1 expression and tumor-infiltrating immune cells, (B) scatter plot corresponding to ABCC4 expression and tumor-infiltrating immune cells, (C) scatter plot corresponding to ABCC5 expression and tumor-infiltrating immune cells, and (D) scatter plot corresponding to ABCC6 expression and tumor-infiltrating immune cells.
ABCC expressions were analyzed in two data sets, and consistent results were obtained. Compared with normal tissues, they revealed that ABCC1, ABCC4, ABCC5, and ABCC10 were significantly upregulated in HCC tissues, while ABCC6 and ABCC7 were significantly downregulated in HCC tissues. In the TCGA database, ABCC5, ABCC7, ABCC9, and ABCC10 were equipped with high diagnostic efficacy for HCC (AUC > 0.8). In GSE76427, the good diagnostic efficacy for HCC was only discovered in ABCC7. Combining the results of the two data sets, we consider ABCC7 as a potential diagnostic marker for HCC.
In the TCGA database, ABCC1, ABCC4, ABCC5, and ABCC6 were found to be associated with the prognosis of HCC, while further verification in GSE14250 indicated that only ABCC6 was significantly correlated to the prognosis. The results of survival analysis in the two data sets were very similar, although not identical. We observed that the expression of ABCC1 and ABCC5 was associated with the prognosis of liver cancer in both data sets. The reason for the different conclusions may lie in the population difference and inconformity in the causes of neoplasm. HCC patients in GSE76427 were mainly in the Asian population, and the proportion of hepatitis B virus infection was high. However, the majority of HCC patients in the TCGA database were Caucasian and the proportion of hepatitis B virus infection was low. The sample size of both databases is relatively large, and the follow-up data were also of high quality. The results from both databases should be reliable but may apply to different populations. Both clinicopathologic features and biomarker expression were included in the nomogram as prognostic dependent variables, with the length of each variable clearly reflecting its contribution to the prognosis of liver cancer.
Based on the four prognostic biomarkers obtained from the survival analysis, we further performed combined effect survival analysis, nomogram, and prognostic signature based on biomarker expression. The combined survival analysis had obvious advantages, and the prognostic difference between groups was more remarkable. The length of each variable in the nomogram clearly reflects its contribution to the prognosis of liver cancer.
ABCC1 transports drugs to the extracellular substances, thereby reducing the drug concentration and generating drug resistance in cancer (Wlcek and Stieger, 2014). In the liver, ABCC1 undertakes excretion of the drugs into the bile (Zhou, 2008). The ontogeny, localization, expression, and function of ABCC1 in HCC were reported in several research studies, and the previous reports mainly focused on the role of ABCC1 in HCC drug resistance (Flens et al., 1996; Nies et al., 2001; Vander Borght et al., 2005). It was reported that ABCC1 was significantly upregulated in the tissues of oxaliplatin-resistant, 5-fluorouracil-resistant, and sorafenib-resistant HCC patients (Ding et al., 2017; Huang et al., 2018; Ding et al., 2019). In HCC, increased ABCC1 expression was related to increasing dedifferentiation, tumor size, and microvascular invasion (Vander Borght et al., 2008; Zhou, 2008).
Located on the inner surface of the basal side of the liver cells, ABCC4 undertakes bile salt transport (Borst et al., 2007). Previous studies have shown that ABCC4 expression is extremely low in the normal adult liver and fetal liver (Sharma et al., 2013), and ABCC4 expression is significantly increased in cholestatic hepatocyte cell membranes (Gradhand et al., 2008; Sharma et al., 2013). Studies have shown that ABCC4 is highly expressed in HCC tissues (Sekine et al., 2011; Borel et al., 2012; Luo et al., 2020). Recently, ABCC4 was found to play an important role in HCC oncogenesis and development promoted by decreasing the haploid of p53 (Luo et al., 2020). In addition, ABCC4 could specifically and independently distinguish the aggressive subtypes of HCC (Gradhand et al., 2008).
Here are a few reports on ABCC5 in HCC, with the existing relevant study indicating that ABCC5 is highly expressed in the liver cancer tissues. Our findings in this investigation also confirm this conclusion.
T lymphocytes are known as the main cells of the tumor immunity. Cytotoxic CD8+T cells play a particularly vital role in anticancer immune response (Vesely et al., 2011; Raskov et al., 2021). Once successfully activated, CD8+T cells secreted death-inducing granules to enhance the killing effect of target cells (Basu et al., 2016). Accumulating evidence indicates that TRM (tissue-resident CD8+ memory T cells) is essential for suppressing cancer growth. In a mouse model, whether generated during tumorigenesis or prior to tumor challenge, antitumor TRM cells revealed suppression in cancer growth (Park et al., 2019). Regulatory T cells inhibit anticancer immunity by preventing the protective immunosurveillance of neoplasia and hindering antitumor immune responses in tumor-bearing hosts, thereby promoting the tumor progression (Sakaguchi et al., 2010; Wing and Sakaguchi, 2010; Togashi and Nishikawa, 2017).
B cells have a crucial part in the regulation of T cell response against tumors (Olkhanud et al., 2011; Tadmor et al., 2011). There is a crosstalk between the B and T lymphocytes in antitumor immunity (Blair et al., 2010; DiLillo et al., 2010). Natural killer cells (NK cells) in cancer are involved in priming a multilayered immune response to achieving long-lasting immunity against tumors, in which T cells are involved (Morandi et al., 2012; Ferlazzo and Moretta, 2014). Moreover, NK cells generate cytokines and chemokines that regulate immune responses. The function of non-NK ILCs (innate lymphoid cells, ILCs) in cancer remains unclear.
Combining this investigation and previous research studies, we could preliminarily conclude that ABCC1, ABCC4, and ABCC5 reduce drug sensitivity by influencing drug transport out of cells, thus resulting in a poor prognosis in these patients with HCC. In this study, we also found a significant positive correlation between ABCC1, ABCC4, and ABCC5 expression and immune cell infiltration.
There were no reports on ABCC6 in HCC before. The role of ABCC6 in HCC is completely opposite to that of ABCC1, ABCC4, and ABCC5. We found that ABCC6 expression was decreased in the liver cancer tissues, and the patients with low ABCC6 expression had a better prognosis. We speculate that ABCC6 may function through a completely different mechanism, and the specific findings need to be further studied.
The raw data supporting the conclusion of this article will be made available by the authors, without undue reservation.
XZ and J-mH formulated the research direction and inclusion criteria for this study. G-zZ and XZ were mainly responsible for data extraction and the elimination of cases that did not meet the inclusion criteria. X-pY and TP analyzed the data, drew charts, and wrote the manuscript. All authors read and approved the final manuscript. All authors made a significant contribution to the work reported, whether this is in the conception, study design, execution, acquisition of data, analysis, and interpretation or in all these areas; took part in drafting, revising or critically reviewing the article; gave final approval of the version to be published; have agreed on the journal to which the article has been submitted; and agree to be accountable for all aspects of the work.
This work was supported by the Key Laboratory of High-Incidence-Tumor Prevention and Treatment (Guangxi Medical University), Ministry of Education (grant nos. GKE 2018-01, GKE 2019-11, and GKE-ZZ202009); the Guangxi Key Laboratory for the Prevention and Control of Viral Hepatitis (No. GXCDCKL201902); and the Natural Science Foundation of Guangxi Province of China (grant no. 2020GXNSFAA159127).
The authors declare that the research was conducted in the absence of any commercial or financial relationships that could be construed as a potential conflict of interest.
All claims expressed in this article are solely those of the authors and do not necessarily represent those of their affiliated organizations or those of the publisher, the editors, and the reviewers. Any product that may be evaluated in this article or claim that may be made by its manufacturer is not guaranteed or endorsed by the publisher.
The authors thank the contributors TCGA database (https://cancergenome.nih.gov/) GSE14520 (https://www.ncbi.nlm.nih.gov/gds/?term=GSE145020) and GSE76427 (https://www.ncbi.nlm.nih.gov/gds/?term=GSE76427) for sharing the RNA-Sequencing of patients with pancreatic cancer on open access.
The Supplementary Material for this article can be found online at: https://www.frontiersin.org/articles/10.3389/fgene.2022.805961/full#supplementary-material
Supplementary Figure 1 | ABCC genes that were not found to be differentially expressed between HCC tissues and paraneoplastic tissues: (A) ABCC3, (B) ABCC8, (C) ABCC11, (D), ABCC12, and (E) ABCC13.
Supplementary Figure 2 | ROC curve for ABCC genes with average performance in diagnostic efficacy assessment: (A) ABCC1, (B) ABCC2, (C) ABCC3, (D) ABCC4, (E) ABCC6, (F) ABCC8, (G) ABCC11, (H) ABCC12, and (I) ABCC13.
Supplementary Figure 3 | Survival curves of ABCC genes not found to be associated with HCC prognosis: (A) ABCC2, (B) ABCC3, (C) ABCC7, (D) ABCC8, (E) ABCC9, (F) ABCC10, (G) ABCC11, (H) ABCC12, and (I) ABCC13.
Supplementary Figure 4 | Nomogram constructed based on ABCC1, ABCC4, ABCC5, and ABCC6 in the Guangxi cohort. (A) Nomogram based on expression of ABCC genes and clinicopathologic features; (B) internal validation for 1-year survival; (C) internal validation for 2-year survival; (D) internal validation for 3-year survival.
Supplementary Figure 5 | Workflow to summary manuscript.
ABCC, ATP binding cassette subfamily C; HCC, hepatocellular carcinoma; ROC, receiver operating characteristic curve; HBV, hepatitis B virus; HCV, hepatitis C virus; AUC, area under curve; GSEA, gene set enrichment analysis; IHC, Immunohistochemical.
Akinyemiju, T., Akinyemiju, T., Abera, S., Ahmed, M., Alam, N., Alemayohu, M. A., et al. (2017). The Burden of Primary Liver Cancer and Underlying Etiologies from 1990 to 2015 at the Global, Regional, and National Level: Results from the Global Burden of Disease Study 2015. JAMA Oncol. 3, 1683–1691. doi:10.1001/jamaoncol.2017.3055
Basu, R., Whitlock, B. M., Husson, J., Le Floc’h, A., Jin, W., Oyler-Yaniv, A., et al. (2016). Cytotoxic T Cells Use Mechanical Force to Potentiate Target Cell Killing. Cell 165, 100–110. doi:10.1016/j.cell.2016.01.021
Blair, P. A., Noreña, L. Y., Flores-Borja, F., Rawlings, D. J., Isenberg, D. A., Ehrenstein, M. R., et al. (2010). CD19(+)CD24(hi)CD38(hi) B Cells Exhibit Regulatory Capacity in Healthy Individuals but Are Functionally Impaired in Systemic Lupus Erythematosus Patients. Immunity 32, 129–140. doi:10.1016/j.immuni.2009.11.009
Borel, F., Han, R., Visser, A., Petry, H., van Deventer, S. J. H., Jansen, P. L. M., et al. (2012). Adenosine Triphosphate-Binding Cassette Transporter Genes Up-Regulation in Untreated Hepatocellular Carcinoma Is Mediated by Cellular microRNAs. Hepatology 55, 821–832. doi:10.1002/hep.24682
Borst, P., de Wolf, C., and van de Wetering, K. (2007). Multidrug Resistance-Associated Proteins 3, 4, and 5. Pflugers Arch. - Eur. J. Physiol. 453, 661–673. doi:10.1007/s00424-006-0054-9
Bray, F., Ferlay, J., Soerjomataram, I., Siegel, R. L., Torre, L. A., and Jemal, A. (2018). Global Cancer Statistics 2018: GLOBOCAN Estimates of Incidence and Mortality Worldwide for 36 Cancers in 185 Countries. CA: A Cancer J. Clinicians 68, 394–424. doi:10.3322/caac.21492
Chen, L., Zhang, Y. H., Wang, S., Zhang, Y., Huang, T., and Cai, Y. D. (2017). Prediction and Analysis of Essential Genes Using the Enrichments of Gene Ontology and KEGG Pathways. PloS one 12, e0184129. doi:10.1371/journal.pone.0184129
Chen, M., Liu, B., Xiao, J., Yang, Y., and Zhang, Y. (2017). A Novel Seven-Long Non-Coding RNA Signature Predicts Survival in Early Stage Lung Adenocarcinoma. Oncotarget 8, 14876–14886. doi:10.18632/oncotarget.14781
Chen, Z.-S., and Tiwari, A. K. (2011). Multidrug Resistance Proteins (MRPs/ABCCs) in Cancer Chemotherapy and Genetic Diseases. FEBS J. 278, 3226–3245. doi:10.1111/j.1742-4658.2011.08235.x
Childs, S., and Ling, V. (1994). The MDR Superfamily of Genes and its Biological Implications. Important Adv. Oncol., 21–36.
Dean, M., and Allikmets, R. (2001). Complete Characterization of the Human ABC Gene Family. J. Bioenerg. Biomembr 33, 475–479. doi:10.1023/a:1012823120935
Dean, M., Rzhetsky, A., and Allikmets, R. (2001). The Human ATP-Binding Cassette (ABC) Transporter Superfamily. Genome Res. 11, 1156–1166. doi:10.1101/gr.184901
DiLillo, D. J., Yanaba, K., and Tedder, T. F. (2010). B Cells Are Required for Optimal CD4+ and CD8+ T Cell Tumor Immunity: Therapeutic B Cell Depletion Enhances B16 Melanoma Growth in Mice. J. Immunol. 184, 4006–4016. doi:10.4049/jimmunol.0903009
Ding, J., Zhou, X.-T., Zou, H.-Y., and Wu, J. (2017). Hedgehog Signaling Pathway Affects the Sensitivity of Hepatoma Cells to Drug Therapy through the ABCC1 Transporter. Lab. Invest. 97, 819–832. doi:10.1038/labinvest.2017.34
Ding, Y., Li, S., Ge, W., Liu, Z., Zhang, X., Wang, M., et al. (2019). Design and Synthesis of Parthenolide and 5-Fluorouracil Conjugates as Potential Anticancer Agents against Drug Resistant Hepatocellular Carcinoma. Eur. J. Med. Chem. 183, 111706. doi:10.1016/j.ejmech.2019.111706
El-Serag, H. B. (2012). Epidemiology of Viral Hepatitis and Hepatocellular Carcinoma. Gastroenterology 142, 1264. doi:10.1053/j.gastro.2011.12.061
Fattovich, G., Stroffolini, T., Zagni, I., and Donato, F. (2004). Hepatocellular Carcinoma in Cirrhosis: Incidence and Risk Factors. Gastroenterology 127, S35–S50. doi:10.1053/j.gastro.2004.09.014
Ferlazzo, G., and Moretta, L. (2014). Dendritic Cell Editing by Natural Killer Cells. Crit. Rev. Oncog 19, 67–75. doi:10.1615/critrevoncog.2014010827
Flens, M. J., Zaman, G. J., van der Valk, P., Izquierdo, M. A., Schroeijers, A. B., Scheffer, G. L., et al. (1996). Tissue Distribution of the Multidrug Resistance Protein. Am. J. Pathol. 148, 1237–1247.
Fujiwara, N., Friedman, S. L., Goossens, N., and Hoshida, Y. (2018). Risk Factors and Prevention of Hepatocellular Carcinoma in the Era of Precision Medicine. J. Hepatol. 68, 526–549. doi:10.1016/j.jhep.2017.09.016
Gower, E., Estes, C., Blach, S., Razavi-Shearer, K., and Razavi, H. (2014). Global Epidemiology and Genotype Distribution of the Hepatitis C Virus Infection. J. Hepatol. 61, S45–S57. doi:10.1016/j.jhep.2014.07.027
Gradhand, U., Lang, T., Schaeffeler, E., Glaeser, H., Tegude, H., Klein, K., et al. (2008). Variability in Human Hepatic MRP4 Expression: Influence of Cholestasis and Genotype. Pharmacogenomics J. 8, 42–52. doi:10.1038/sj.tpj.6500451
Higgins, C. F., Hiles, I. D., Salmond, G. P. C., Gill, D. R., Downie, J. A., Evans, I. J., et al. (1986). A Family of Related ATP-Binding Subunits Coupled to many Distinct Biological Processes in Bacteria. Nature 323, 448–450. doi:10.1038/323448a0
Hosmer, D. W., Lemeshow, S., and Sturdivant, R. X. (2013). Assessing the Fit of the Model, Applied Logistic Regression, 153–225.
Huang, H., Chen, J., Ding, C. M., Jin, X., Jia, Z. M., and Peng, J. (2018). Lnc RNA NR 2F1‐ AS 1 Regulates Hepatocellular Carcinoma Oxaliplatin Resistance by Targeting ABCC 1 via miR‐363. J. Cell. Mol. Medi 22, 3238–3245. doi:10.1111/jcmm.13605
Iasonos, A., Schrag, D., Raj, G. V., and Panageas, K. S. (2008). How to Build and Interpret a Nomogram for Cancer Prognosis. J. Clin. Oncol. 26, 1364–1370. doi:10.1200/jco.2007.12.9791
Ito, K., and Murphy, D. (2013). Application of Ggplot2 to Pharmacometric Graphics. CPT Pharmacometrics Syst. Pharmacol. 2, e79. doi:10.1038/psp.2013.56
Kanehisa, M., Furumichi, M., Tanabe, M., Sato, Y., and Morishima, K. (2017). KEGG: New Perspectives on Genomes, Pathways, Diseases and Drugs. Nucleic Acids Res. 45, D353–D361. doi:10.1093/nar/gkw1092
Keppler, D. (2011). Multidrug Resistance Proteins (MRPs, ABCCs): Importance for Pathophysiology and Drug Therapy. Handb Exp. Pharmacol., 299–323. doi:10.1007/978-3-642-14541-4_8
Leslie, E. M. (2012). Arsenic-Glutathione Conjugate Transport by the Human Multidrug Resistance Proteins (MRPs/ABCCs). J. Inorg. Biochem. 108, 141–149. doi:10.1016/j.jinorgbio.2011.11.009
Levrero, M., and Zucman-Rossi, J. (2016). Mechanisms of HBV-Induced Hepatocellular Carcinoma. J. Hepatol. 64, S84–S101. doi:10.1016/j.jhep.2016.02.021
Llovet, J. M., Zucman-Rossi, J., Pikarsky, E., Sangro, B., Schwartz, M., Sherman, M., et al. (2016). Hepatocellular Carcinoma. Nat. Rev. Dis. Primers 2, 16018. doi:10.1038/nrdp.2016.18
Long, X. D., Ma, Y., Qu, D. Y., Liu, Y. G., Huang, Z. Q., Huang, Y. Z., et al. (2008). The Polymorphism of XRCC3 Codon 241 and AFB1-Related Hepatocellular Carcinoma in Guangxi Population, China. Ann. Epidemiol. 18, 572–578. doi:10.1016/j.annepidem.2008.03.003
Luo, Y.-D., Fang, L., Yu, H.-Q., Zhang, J., Lin, X.-T., Liu, X.-Y., et al. (2020). p53 Haploinsufficiency and Increased mTOR Signaling Define a Subset of Aggressive Hepatocellular Carcinoma. J. Hepatol. 74 (1), 96–108. doi:10.1016/j.jhep.2020.07.036
Maere, S., Heymans, K., and Kuiper, M. (2005). BiNGO: A Cytoscape Plugin to Assess Overrepresentation of Gene Ontology Categories in Biological Networks. Bioinformatics 21, 3448–3449. doi:10.1093/bioinformatics/bti551
Morandi, B., Mortara, L., Chiossone, L., Accolla, R. S., Mingari, M. C., Moretta, L., et al. (2012). Dendritic Cell Editing by Activated Natural Killer Cells Results in a More Protective Cancer-Specific Immune Response. PloS one 7, e39170. doi:10.1371/journal.pone.0039170
Nies, A. T., König, J., Pfannschmidt, M., Klar, E., Hofmann, W. J., and Keppler, D. (2001). Expression of the Multidrug Resistance Proteins MRP2 and MRP3 in Human Hepatocellular Carcinoma. Int. J. Cancer 94, 492–499. doi:10.1002/ijc.1498
Nolan, D. J., Ginsberg, M., Israely, E., Palikuqi, B., Poulos, M. G., James, D., et al. (2013). Molecular Signatures of Tissue-Specific Microvascular Endothelial Cell Heterogeneity in Organ Maintenance and Regeneration. Develop. Cel 26, 204–219. doi:10.1016/j.devcel.2013.06.017
Olkhanud, P. B., Damdinsuren, B., Bodogai, M., Gress, R. E., Sen, R., Wejksza, K., et al. (2011). Tumor-Evoked Regulatory B Cells Promote Breast Cancer Metastasis by Converting Resting CD4+ T Cells to T-Regulatory Cells. Cancer Res. 71, 3505–3515. doi:10.1158/0008-5472.can-10-4316
Park, S. L., Buzzai, A., Rautela, J., Hor, J. L., Hochheiser, K., Effern, M., et al. (2019). Tissue-resident Memory CD8+ T Cells Promote Melanoma-Immune Equilibrium in Skin. Nature 565, 366–371. doi:10.1038/s41586-018-0812-9
Polaris Observatory Collaborators (2018). Global Prevalence, Treatment, and Prevention of Hepatitis B Virus Infection in 2016: A Modelling Study. Lancet Gastroenterol. Hepatol. 3, 383–403. doi:10.1016/S2468-1253(18)30056-6
Raskov, H., Orhan, A., Christensen, J. P., and Gögenur, I. (2021). Cytotoxic CD8(+) T Cells in Cancer and Cancer Immunotherapy. Br. J. Cancer 124, 359–367. doi:10.1038/s41416-020-01048-4
Robey, R. W., Pluchino, K. M., Hall, M. D., Fojo, A. T., Bates, S. E., and Gottesman, M. M. (2018). Revisiting the Role of ABC Transporters in Multidrug-Resistant Cancer. Nat. Rev. Cancer 18, 452–464. doi:10.1038/s41568-018-0005-8
Rushing, B. R., and Selim, M. I. (2019). Aflatoxin B1: A Review on Metabolism, Toxicity, Occurrence in Food, Occupational Exposure, and Detoxification Methods. Food Chem. Toxicol. 124, 81–100. doi:10.1016/j.fct.2018.11.047
Sakaguchi, S., Miyara, M., Costantino, C. M., and Hafler, D. A. (2010). FOXP3+ Regulatory T Cells in the Human Immune System. Nat. Rev. Immunol. 10, 490–500. doi:10.1038/nri2785
Sekine, S., Ogawa, R., Ojima, H., and Kanai, Y. (2011). Expression of SLCO1B3 Is Associated with Intratumoral Cholestasis and CTNNB1 Mutations in Hepatocellular Carcinoma. Cancer Sci. 102, 1742–1747. doi:10.1111/j.1349-7006.2011.01990.x
Sharma, S., Ellis, E. C. S., Gramignoli, R., Dorko, K., Tahan, V., Hansel, M., et al. (2013). Hepatobiliary Disposition of 17-OHPC and Taurocholate in Fetal Human Hepatocytes: A Comparison with Adult Human Hepatocytes. Drug Metab. Dispos 41, 296–304. doi:10.1124/dmd.112.044891
Szklarczyk, D., Franceschini, A., Wyder, S., Forslund, K., Heller, D., Huerta-Cepas, J., et al. (2015). STRING V10: Protein-Protein Interaction Networks, Integrated over the Tree of Life. Nucleic Acids Res. 43, D447–D452. doi:10.1093/nar/gku1003
Tadmor, T., Zhang, Y., Cho, H.-M., Podack, E. R., and Rosenblatt, J. D. (2011). The Absence of B Lymphocytes Reduces the Number and Function of T-Regulatory Cells and Enhances the Anti-Tumor Response in a Murine Tumor Model. Cancer Immunol. Immunother. 60, 609–619. doi:10.1007/s00262-011-0972-z
The Gene Ontology Consortium (2017). Expansion of the Gene Ontology Knowledgebase and Resources. Nucleic Acids Res. 45, D331–D338. doi:10.1093/nar/gkw1108
Togashi, Y., and Nishikawa, H. (2017). Regulatory T Cells: Molecular and Cellular Basis for Immunoregulation. Curr. Top. Microbiol. Immunol. 410, 3–27. doi:10.1007/82_2017_58
Torre, L. A., Bray, F., Siegel, R. L., Ferlay, J., Lortet-Tieulent, J., and Jemal, A. (2015). Global Cancer Statistics, 2012. CA: A Cancer J. Clinicians 65, 87–108. doi:10.3322/caac.21262
Vander Borght, S., Komuta, M., Libbrecht, L., Katoonizadeh, A., Aerts, R., Dymarkowski, S., et al. (2008). Expression of Multidrug Resistance-Associated Protein 1 in Hepatocellular Carcinoma Is Associated with a More Aggressive Tumour Phenotype and May Reflect a Progenitor Cell Origin. Liver Int. 28, 1370–1380. doi:10.1111/j.1478-3231.2008.01889.x
Vander Borght, S., Libbrecht, L., Blokzijl, H., Nico Faber, K., Moshage, H., Aerts, R., et al. (2005). Diagnostic and Pathogenetic Implications of the Expression of Hepatic Transporters in Focal Lesions Occurring in normal Liver. J. Pathol. 207, 471–482. doi:10.1002/path.1852
Vesely, M. D., Kershaw, M. H., Schreiber, R. D., and Smyth, M. J. (2011). Natural Innate and Adaptive Immunity to Cancer. Annu. Rev. Immunol. 29, 235–271. doi:10.1146/annurev-immunol-031210-101324
Wang, Y., Li, J., Xia, Y., Gong, R., Wang, K., Yan, Z., et al. (2013). Prognostic Nomogram for Intrahepatic Cholangiocarcinoma after Partial Hepatectomy. J. Clin. Oncol. 31, 1188–1195. doi:10.1200/jco.2012.41.5984
Wing, K., and Sakaguchi, S. (2010). Regulatory T Cells Exert Checks and Balances on Self Tolerance and Autoimmunity. Nat. Immunol. 11, 7–13. doi:10.1038/ni.1818
Wlcek, K., and Stieger, B. (2014). ATP-Binding Cassette Transporters in Liver. Biofactors 40, 188–198. doi:10.1002/biof.1136
Wogan, G. N., Kensler, T. W., and Groopman, J. D. (2012). Present and Future Directions of Translational Research on Aflatoxin and Hepatocellular Carcinoma. A Review. Food Addit. Contam. A 29, 249–257. doi:10.1080/19440049.2011.563370
Yamada, A., Nagahashi, M., Aoyagi, T., Huang, W.-C., Lima, S., Hait, N. C., et al. (2018). ABCC1-Exported Sphingosine-1-Phosphate, Produced by Sphingosine Kinase 1, Shortens Survival of Mice and Patients with Breast Cancer. Mol. Cancer Res. 16, 1059–1070. doi:10.1158/1541-7786.mcr-17-0353
Yang, J. D., Hainaut, P., Gores, G. J., Amadou, A., Plymoth, A., and Roberts, L. R. (2019). A Global View of Hepatocellular Carcinoma: Trends, Risk, Prevention and Management. Nat. Rev. Gastroenterol. Hepatol. 16, 589–604. doi:10.1038/s41575-019-0186-y
Zhang, W., He, H., Zang, M., Wu, Q., Zhao, H., Lu, L.-L., et al. (2017). Genetic Features of Aflatoxin-Associated Hepatocellular Carcinoma. Gastroenterology 153, 249–262. doi:10.1053/j.gastro.2017.03.024
Zhang, X. (2018). NAFLD Related-HCC: The Relationship with Metabolic Disorders. Adv. Exp. Med. Biol. 1061, 55–62. doi:10.1007/978-981-10-8684-7_5
Zhang, Z., Geskus, R. B., Kattan, M. W., Zhang, H., and Liu, T. (2017). Nomogram for Survival Analysis in the Presence of Competing Risks. Ann. Translational Med. 5, 403. doi:10.21037/atm.2017.07.27
Keywords: HCC (hepatic cellular carcinoma), ABCC gene family, prognosis (carcinoma), nomogram, GSEA (gene set enrichment analysis)
Citation: Zhou X, Huang J-m, Li T-m, Liu J-q, Wei Z-l, Lan C-l, Zhu G-z, Liao X-w, Ye X-p and Peng T (2022) Clinical Significance and Potential Mechanisms of ATP Binding Cassette Subfamily C Genes in Hepatocellular Carcinoma. Front. Genet. 13:805961. doi: 10.3389/fgene.2022.805961
Received: 31 October 2021; Accepted: 15 February 2022;
Published: 07 March 2022.
Edited by:
Frank Emmert-Streib, Tampere University, FinlandReviewed by:
Asli Suner, Ege University, TurkeyCopyright © 2022 Zhou, Huang, Li, Liu, Wei, Lan, Zhu, Liao, Ye and Peng. This is an open-access article distributed under the terms of the Creative Commons Attribution License (CC BY). The use, distribution or reproduction in other forums is permitted, provided the original author(s) and the copyright owner(s) are credited and that the original publication in this journal is cited, in accordance with accepted academic practice. No use, distribution or reproduction is permitted which does not comply with these terms.
*Correspondence: Tao Peng, cGVuZ3Rhb2dtdUAxNjMuY29t, b3JjaWQub3JnLzAwMDAtMDAwMS02MTMzLTcwNzg=
† These authors have contributed equally to this work
Disclaimer: All claims expressed in this article are solely those of the authors and do not necessarily represent those of their affiliated organizations, or those of the publisher, the editors and the reviewers. Any product that may be evaluated in this article or claim that may be made by its manufacturer is not guaranteed or endorsed by the publisher.
Research integrity at Frontiers
Learn more about the work of our research integrity team to safeguard the quality of each article we publish.