- 1Department of Urology, the Second Affiliated Hospital of Kunming Medical University, Yunnan Institute of Urology, Kunming, China
- 2Department of Urology, the Second People’s Hospital of Baoshan, Baoshan, China
Background: Heat shock protein B8 (HSPB8) is expressed in various cancers. However, the functional and clinicopathological significance of HSPB8 expression in bladder cancer (BC) remains unclear. The present study sought to elucidate the clinicopathological features and prognostic value of HSPB8 in BC.
Methods: A BC RNA-seq data set was obtained from The Cancer Genome Atlas Urothelial Bladder Carcinoma (TCGA-BLCA) database, and the external validation dataset GSE130598 was downloaded from the GEO database. Samples in the TCGA-BLCA were categorized into two groups based on HSPB8 expression. Differentially expressed genes (DEGs) between the two groups were defined as HSPB8 co-expressed genes. Gene set enrichment analysis (GSEA), protein-protein interaction networks, and mRNA-microRNA (miRNA) interaction networks were generated to predict the function and interactions of genes that are co-expressed with HSPB8. Finally, we examined immune cell infiltration and constructed a survival prediction model for BC patients.
Results: The expression level of HSBP8 has a significant difference between cancer samples and normal samples, and its diagnosis effect was validated by the ROC curve. 446 differential expressed genes between HSBP8 high-expression and HSBP8 low expression groups were identified. Gene enrichment analysis and GSEA analysis show that these differential gene functions are closely related to the occurrence and development of BC and the metabolic pathways of BC. The cancer-related pathways included Cytokine-cytokine receptor Interaction, Focal adhesion, and Proteoglycans in cancer. PPI and protein-coding gene-miRNA network visualized the landscape for these tightly bounded gene interactions. Immune cell infiltration shows that B cells, CD4+T cells, and CD8+T cells have strongly different infiltration levels between the HSBP8 high exp group and low exp group. The survival prediction model shows that HSBP8 has strong prognosis power in the BLCA cohort.
Conclusion: Identifying DEGs may enhance understanding of BC development’s causes and molecular mechanisms. HSPB8 may play an essential role in BC progression and prognosis and serve as a potential biomarker for BC treatment.
Introduction
Bladder cancer (BC) occurs in the bladder mucosa and is the most common malignancy of the urinary system (Lenis et al., 2020). It is the fifth most common type of cancer worldwide, with an estimated 81,400 new cases and 17,000 related deaths in the United States in 2020 (Siegel et al., 2020). The most common histologic type of bladder cancer is uroepithelial cancer, accounting for more than 90% of all bladder cancers (Martinez Rodriguez., 2017). Based on the degree of muscle invasion, BC can be classified as non-muscle-invasive bladder cancer (NMIBC) and muscle-invasive bladder cancer (MIBC) (Kang et al., 2020). Recurrence remains a major challenge in the treatment of MIBC. Approximately 75% of patients initially present as NMIBC. Though these patients typically undergo aggressive treatments including, surgery, immunotherapy, chemotherapy, and radiotherapy, the patient response remains variable and unpredictable. About 10–30% of patients with NMIBC may relapse and progress to MIBC (Witjes et al., 2021), and the 5-years overall survival (OS) rate remains unsatisfactory. In addition, the cost of BC treatment poses a heavy burden on patients and society. The prognosis of BC patients is difficult to predict because there are no clinical biomarkers or parameters that can reliably reflect disease progression. Additionally, individual differences play important roles in determining the efficacy of thetreatment of BC. Therefore, clarifying the potential molecular mechanisms involved in BC carcinogenesis, proliferation, and recurrence and identifying novel potential biomarkers is crucial for early diagnosis, prognosis evaluation, and treatment.
Heat shock protein B8 (HSPB8, also known as small stress protein-like protein [sHSP22], protein kinase H11, E2-induced gene 1 protein [E2IG1], or alpha-crystallin C chain [CRYAC]), is a member of the small heat shock protein superfamily and contains a conserved α-crystallin domain at the C-terminal (F. Li et al., 2018). Various cellular functions have been linked to HSPB8, such as cytoskeleton stabilization, autophagy, oxidative stress, apoptosis, differentiation, and proliferation (L. L. Yu et al., 2021). In addition, studies have reported that HSPB8 exerts both beneficial and detrimental effects on cancer proliferation, invasion, and migration (Cristofani et al., 2021). For instance, HSPB8 expression is upregulated in breast cancer (Piccolella et al., 2017), multiple myeloma (Hamouda et al., 2014), lung cancer (L. L. Yu et al., 2021), and ovarian cancer (Suzuki et al., 2015). In these cancer types, HSPB8 promotes proliferation and suppresses apoptosis. For other tumors, including glioblastoma (Modem et al., 2011), prostate cancer (Hu et al., 2020), and hepatocarcinoma (Wang et al., 2020), HSPB8 is aberrantly methylated and expressed at low levels. Thus, the role of HSPB8 in cancer has attracted increasing attention. However, the expression and significance of HSPB8 in BC have not yet been characterized.
In this study, we investigated the correlation between HSPB8 expression and BC characteristics and analyzed the prognostic role of HSPB8 expression in BC based on RNA-seq data from TCGA and GEO datasets. In addition, we analyzed the expression levels of HSPB8 in BC and normal tissues and determined the correlation between HSPB8 expression and patient prognosis in terms of OS. Additionally, we examined the potential diagnostic and prognostic value of HSPB8 using patient data from the TGCA and GEO databases. Then, we elucidated its biological significance by performing enrichment analysis, molecular interaction network analysis, and immune infiltration correlation analysis. Our study highlights that HSPB8 may be a new predictor of BC diagnosis and prognosis and is a promising therapeutic target.
Materials and Methods
Data Download and Processing
We downloaded the gene expression data matrix of 433 samples (19 normal samples and 414 bladder cancer samples) from The Cancer Genome Atlas (TCGA) data portal (https://portal.gdc.cancer.gov/) as the training set. The microarray dataset GSE130598 analyzed using the GPL26612 platform was extracted from the Gene Expression Omnibus (GEO) database for the validation set. This dataset contains 24 normal samples and 24 tumor samples (Chandrashekar et al., 2020). The normalize between arrays function in the limma package (Ritchie et al., 2015) was used for background correction and data normalization.
Differential Target Gene Co-expression Analysis
We grouped the target gene HSPB8 into high and low expression groups based on the median expression value in the test set derived from The Cancer Genome Atlas Urothelial Bladder Carcinoma (TCGA-BLCA) database. The differentially expressed genes (DEGs) between the high and low HSPB8 expression groups in the TCGA-BLCA and GSE130598 datasets were screened using the limma package. The DEG heatmap and volcano map was plotted using the ggplot2 package (Ito and Murphy, 2013). The intersection of the two groups of DEGs was examined using a Venn diagram. The correction of multiple testing was applied. All the DEGs had p < 0.05 and |log2FC|>1.
Target Gene Correlation Analysis
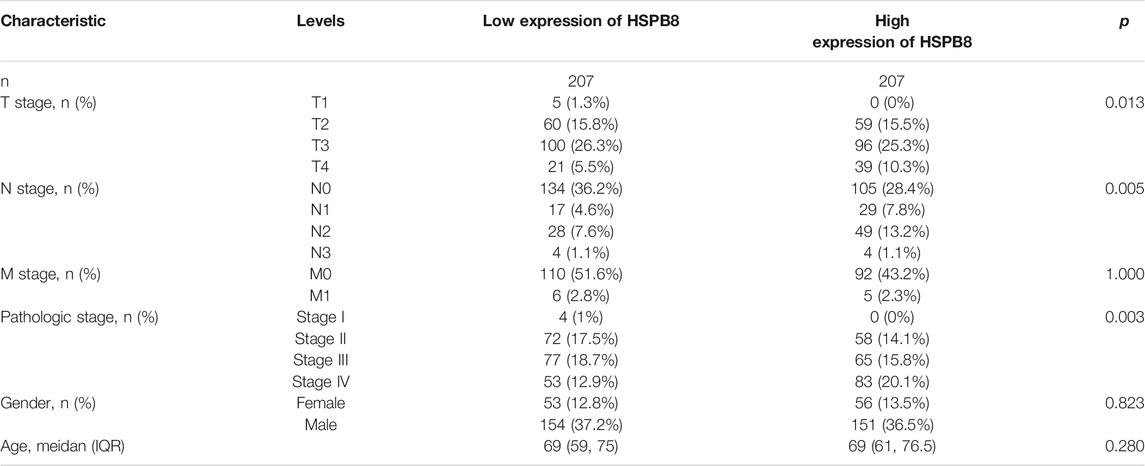
We analyzed differences in HSPB8 expression between normal and tumor tissues. A ROC curve was generated to verify the diagnostic efficiency of HSPB8. The results indicate that HSPB8 is a significant diagnostic marker. The GEPIA platform (http://gepia.cancer-pku.cn/) (Tang et al., 2017) was used to analyze the body map of the median expression distribution of HSPB8 in tumors and normal samples. Additionally, patient base line data was shown (Table 1).
Friends/GO/KEGG Enrichment Analysis
To analyze the functional correlation between the key genes, we used the R package GOSemSim (G. Yu, 2020) to calculate the functional correlation of DEGs. The GO function annotation analysis is commonly used for large-scale gene enrichment studies and identified involved biological process (BP), molecular function (MF), and cellular component (CC) (Ashburner et al., 2000). KEGG is a widely used database that stores information about genomes, biological pathways, diseases, and drugs (Kanehisa et al., 2017). We used the clusterProfiler package (G. Yu et al., 2012) to perform the GO function analysis and KEGG pathway enrichment analysis on the DEGs related to BC.
Gene Set Enrichment Analysis
Gene set enrichment analysis (GSEA) was used to evaluate the distribution of the genes in a pre-defined gene set. The genes were ranked by phenotype correlation to determine their contribution to the phenotype (Subramanian et al., 2007). We obtained c2. cp.v7.0. symbols.gmt from the MSigDB database and performed GSEA using the R package ClusterProfiler between the high and low HSPB8 expression groups in the TCGA-BLCA data set.
Protein-Protein Interaction (PPI) Network Construction and Module Analysis
We constructed a molecular interaction network between high and low HSPB8 expression groups for DEGs. First, we performed protein-protein interaction (PPI) network analysis using the STRING database (Szklarczyk et al., 2019). Cytoscape is an open-source bioinformatics software program used to visualize molecular interaction networks. MCODE, a Cytoscape plug-in, was used to explore the PPI network hub genes. Then, hub genes with clear clustering were used as the target genes. MicroRNAs (miRNAs) that interact with the target genes were predicted using the TarBase (Karagkouni et al., 2018), miRecords (F. Xiao et al., 2009), and miRTarBase (H. Y. Huang et al., 2020) databases.
Immune Cell Composition Assessment Analysis
Cell-type identification by estimating relative subsets of RNA transcripts (CIBERSORT) is based on the principle of linear support vector regression to deconvolve transcriptome expression matrices and estimate the composition and abundance of immune cells in a mixed cell population (B. Chen et al., 2018). We uploaded the gene expression matrix data to CIBERSORT and filtered the output for samples with p < 0.05 to derive the immune cell composition matrix. Heatmaps were drawn using the pheatmap package to demonstrate the composition distribution of the 22 immune cell types between the high and low HSPB8 expression groups. The core plot package was used to draw correlation heat maps to visualize the correlation of the composition of 22 immune cell types. ggplot2 was used to draw violin maps to visualize the differences in the composition of 22 immune cell types.
Construction and Verification of Clinical Prediction Models
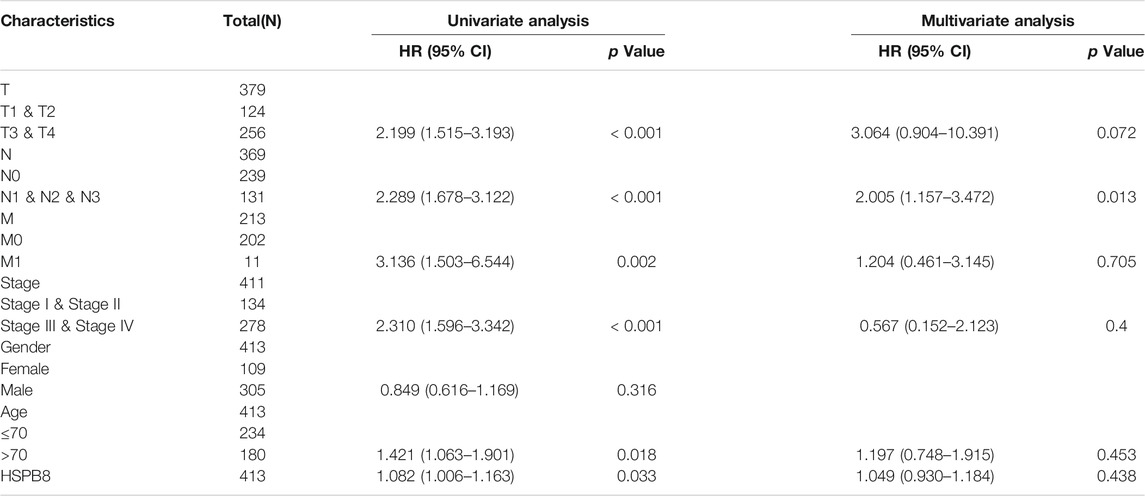
To assess whether HSPB8 expression and clinicopathological features can predict patient prognosis, we performed univariate and multivariate Cox regression analysis to understand whether the independent predictive power of risk scores and clinicopathological features are related to OS.
Construction and Verification of Immune-Related Risk Prediction Model
We obtained immune-related genes from the ImmPort database (https://www.immport.org/) (Bhattacharya et al., 2018). This database assembles raw data from clinical trials, mechanistic studies, and cellular and molecular measurements. Templates for data representation and standard operating procedures were created to facilitate data transfer. We intersected the expressed genes from the high and low HSPB8 expression groups with immune-related genes. The TCGA-BLCA clinical data were also combined to construct risk prediction models for the immune-related genes. The least absolute shrinkage and selection operator (LASSO) algorithm was used to analyze the prognosis-related hub genes for dimensionality reduction analysis and feature selection (Tibshirani, 1996). The coefficients obtained by LASSO regression were weighted to each normalized gene expression value, and the following risk scoring formula was established:
We first examined the correlation between the expression of immune-related gene hub genes in different tumors in the TCGA database and the ability of the risk score to predict the prognosis of patients with different tumors. Subsequently, whether the risk scores combined with patient clinicopathological characteristics can predict OS was analyzed using univariate and multivariate Cox analysis, and a clinical prediction line graph (Nomogram) was constructed. Kaplan-Meier survival curves were generated to show survival differences. A log-rank test was performed to assess the difference in survival duration between the two patient groups. The correlation between clinical subgroup variables was also explored based on the risk scores.
Statistical Analysis
All data were analyzed using R software (version 4.0.2). To compare continuous variables in two groups, normally distributed variables were analyzed using independent Student’s t-tests. Mann-Whitney U tests were used to analyze differences between non-normally distributed variables. The Chi-square test or Fisher’s exact test analyzed categorical data. The Wilcoxon test was used for two-group comparisons, and the Kruskal–Wallis test was used for multi-group comparisons. ROC curves and AUC values were obtained using the R package pROC. All statistical tests were two-tailed, and results with p < 0.05 were considered statistically significant.
Results
Differential Expression of Target Genes and Validation of Diagnostic Performance
We performed background correction, and data normalization on the two data sets, and the gene expression before and after data normalization is shown in Figure 1 (A-B: GSE130598; C-D: TCGA-BLCA). We first compared the differences between high and low HSPB8 expression groups in the TCGA-BLCA and GSE130598 data sets (Figures 1E,F). A ROC curve was generated to verify the diagnostic efficiency of HSPB8 in the TCGA-BLCA dataset (AUC = 0.905). The results indicate that HSPB8 was a good predictive marker (Figure 1G). Next, the GEPIA platform was used to analyze the median expression distribution of HSPB8 in tumors and normal samples (Figure 1H). Additionally, patient base line data was shown (Table 1).
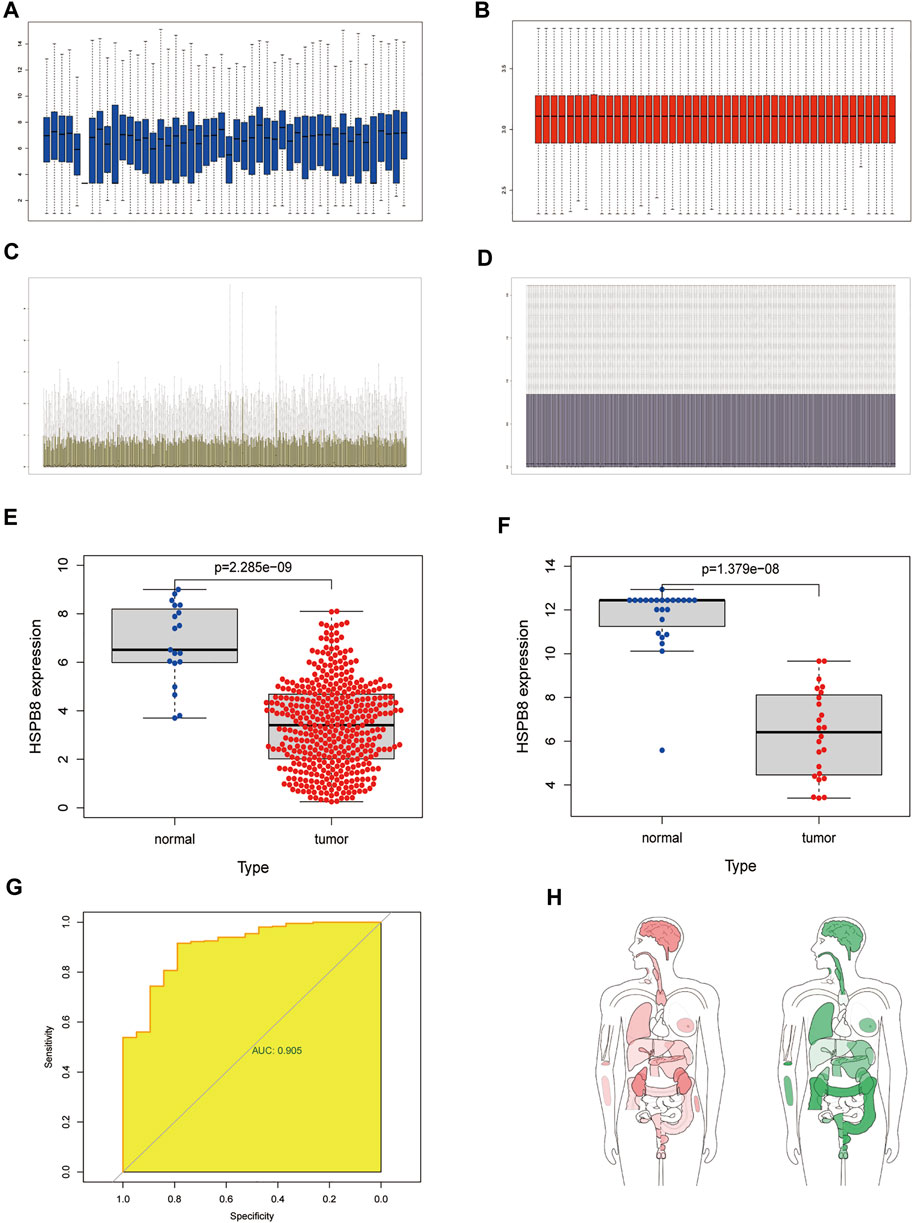
FIGURE 1. Differentially expressed target genes and diagnostic validation in bladder cancer. (A) mRNA expression profile from the GSE130598 dataset before normalization; (B) mRNA expression profile of the GSE130598 dataset after normalization; (C) mRNA expression profile from the TCGA-BLCA dataset before normalization; (D) mRNA expression profile of the TCGA-BLCA dataset after normalization; (E) Box plot of the differences in HSPB8 expression between the tumor and normal groups in theTCGA-BLCA dataset. Each point represents a sample. Blue represents normal tissue,and red represents tumor tissue; (F) Box plot of the differences in HSPB8 expression between the tumor and normal groups in the GSE130598 dataset. Each point represents a sample.Blue indicates normal tissue and red indicates tumor tissue. (G) Receiver operating characteristic(ROC) curve of HSPB8 in the TCGA-BLCA dataset; (H) HSPB8 distribution bodymap in tumor and normal samples, red represents tumor tissue (left), green represents normal tissue (right).
Differential Expression of Target Gene
We conducted differential expression analysis of the mRNA expression profile matrix derived from the TCGA-BLCA (Figures 2A,B) and GSE130598 datasets (Figures 2C,D). The differentially expressed genes between the high and low HSPB8 expression groups in the TCGA-BLCA and GSE130598 datasets are shown as heatmaps and volcano plots.
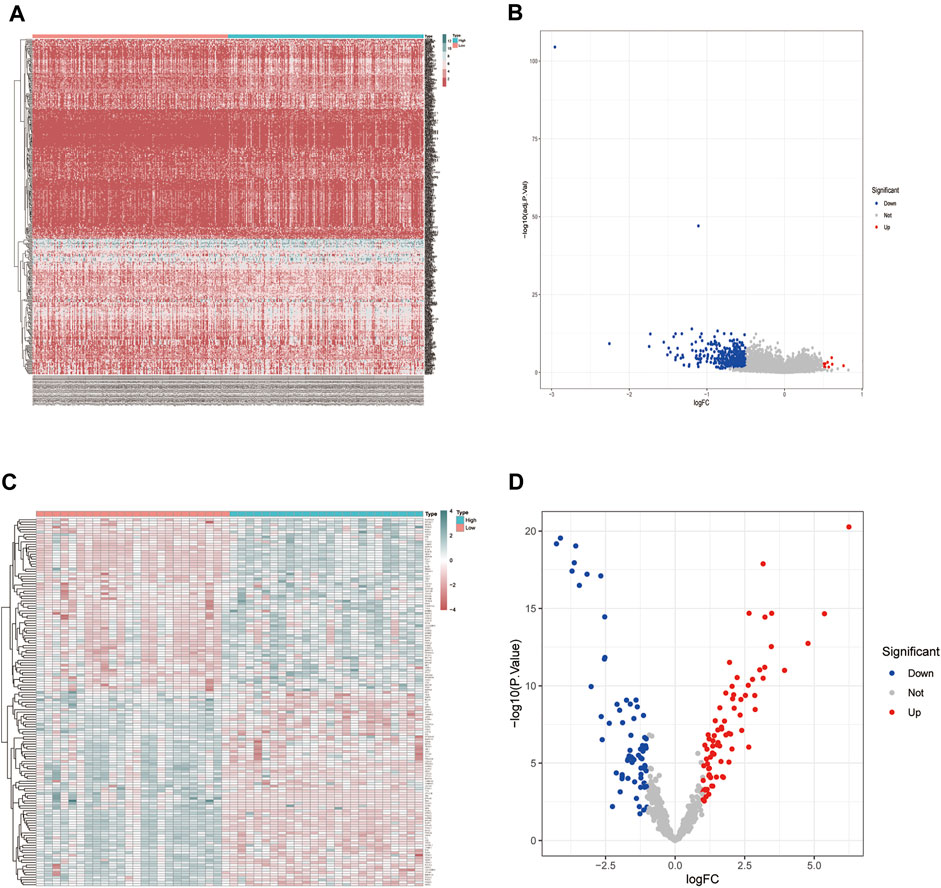
FIGURE 2. Differentially expressed gene distribution in the TCGA-BLCA dataset. (A) Heatmap of the HSPB8 expression between the high and low expression groups from the TCGA-BLCA dataset; (B) Volcano plot of gene expression in the high and low HSPB8 expression groups from the TCGA-BLCA dataset; (C) Heatmap of gene expression between the high and low HSPB8 expression groups in the GSE130598 dataset; (D) Volcano plot of gene expression between the high and low HSPB8 expression groups in the GSE130598 dataset.
Co-Expression Gene Friends Analysis and GO/KEGG Enrichment Analysis
We took the intersection of DEGs between the high and low HSPB8 expression groups in the TCGA-BLCA (training set) and GSE130598 datasets (validation set) and displayed them as Venn diagrams (Figure 3A). HSPB8 was differentially expressed in both the training and validation sets. We compared the DEGs between the high and low HSPB8 expression groups using genes co-expressed with HSPB8. We identified co-expressed genes that are functionally related to HSPB8 by analyzing the functional correlation between genes co-expressed with HSPB8. The horizontal axis of the gene co-expression analysis reflects the correlation size, and the vertical axis shows the names of the co-expressed genes associated with the HSPB8 function (Figure 3B). GO, and KEGG enrichment analysis was performed using the clusterProfiler package. The GO enrichment analysis entries are presented as a bar chart (Figure 3C) and a bubble chart (Figure 3D). The KEGG enrichment analysis entries are shown as a bar graph (Figure 3E) and an enrichment graph (Figure 3F). Table 2 and Table 3 show the GO and KEGG enrichment entries that met the screening threshold, respectively. GO enrichment analysis showed that the genes co-expressed with HSPB8 were mostly associated with humoral immune response, complement activation, positive regulation of leukocyte migration, growth factor binding, peptidase regulatory activity, cytokine binding, and proteoglycan. The KEGG enrichment analysis showed that co-expressed genes were mostly enriched in cytokine-cytokine receptor interaction, protein digestion and absorption, proteoglycans in cancer, complement and coagulation cascade, viral protein-cytokine and cytokine receptor interaction, and bladder cancer and other related pathways. These results indicate that HSPB8 and its co-expressed genes may be related to BLCA development.
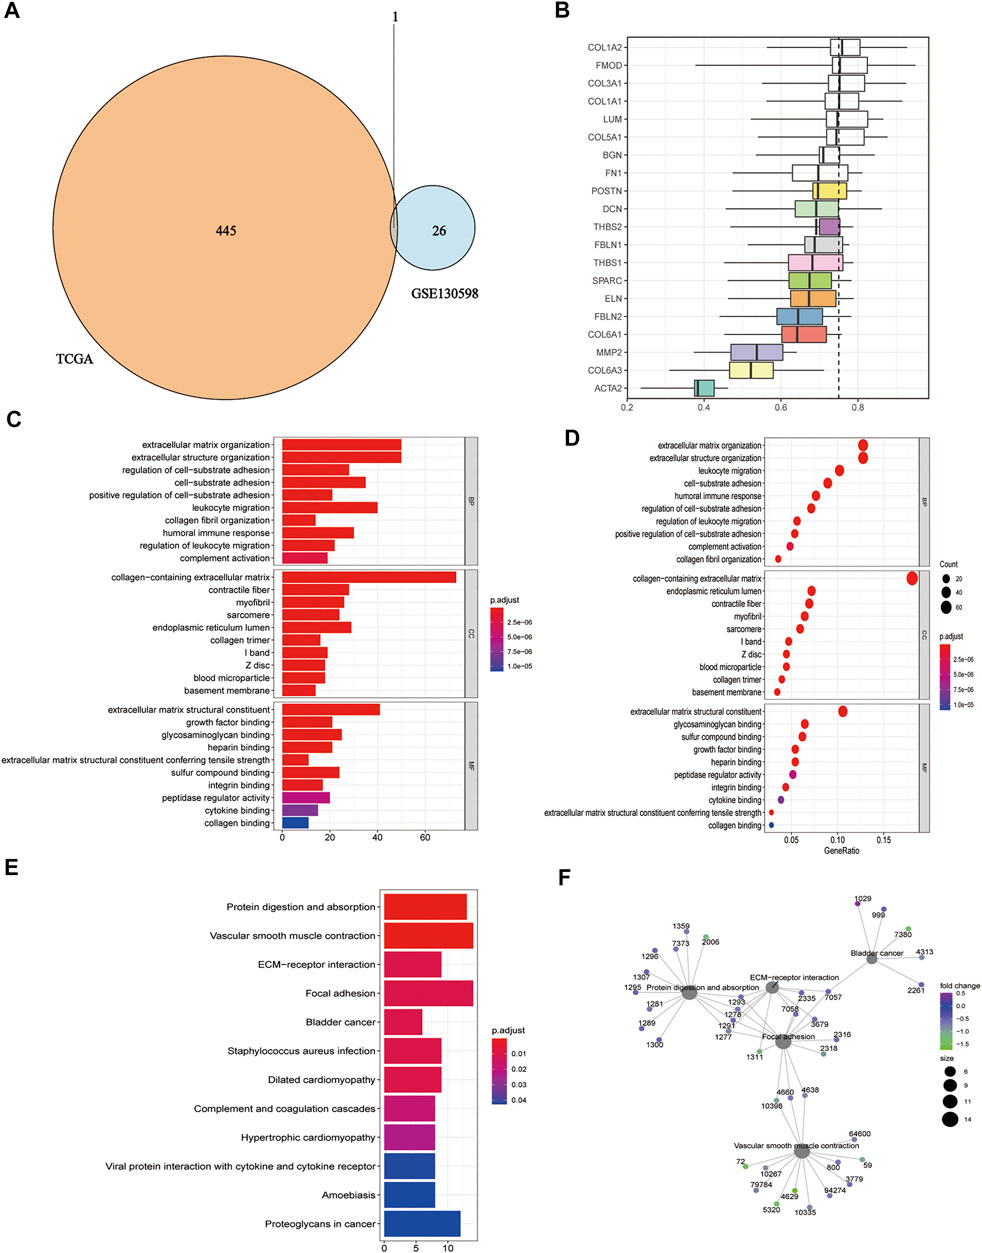
FIGURE 3. Gene ontology and KEGG enrichment analysis. (A) Venn diagram showing the co-expressed DEGs in the TCGA-BLCA and GSE130598 datasets; (B) Summary of functional similarities of the co-expressed genes; (C) GO enrichment analysis bar graph. The length of the bar represents the number of enriched genes, and the color represents the significance level (increasing from blue to red); (D) GO enrichment analysis bubble chart. The bubble size represents the number of enriched genes, and the color represents the significance level (increasing from blue to red); (E) KEGG enrichment analysis bar graph. The length of the bar represents the number of enriched genes, and the color represents the significance level (p.adjust < 0.05, increasing from blue to red, p-value adjusted for multiple comparisons); (F) KEGG enrichment analysis network diagram. Each point represents an enrichment term, and the color represents the significance level (p < 0.05, increasing from green to blue, p-values adjusted for multiple comparisons).
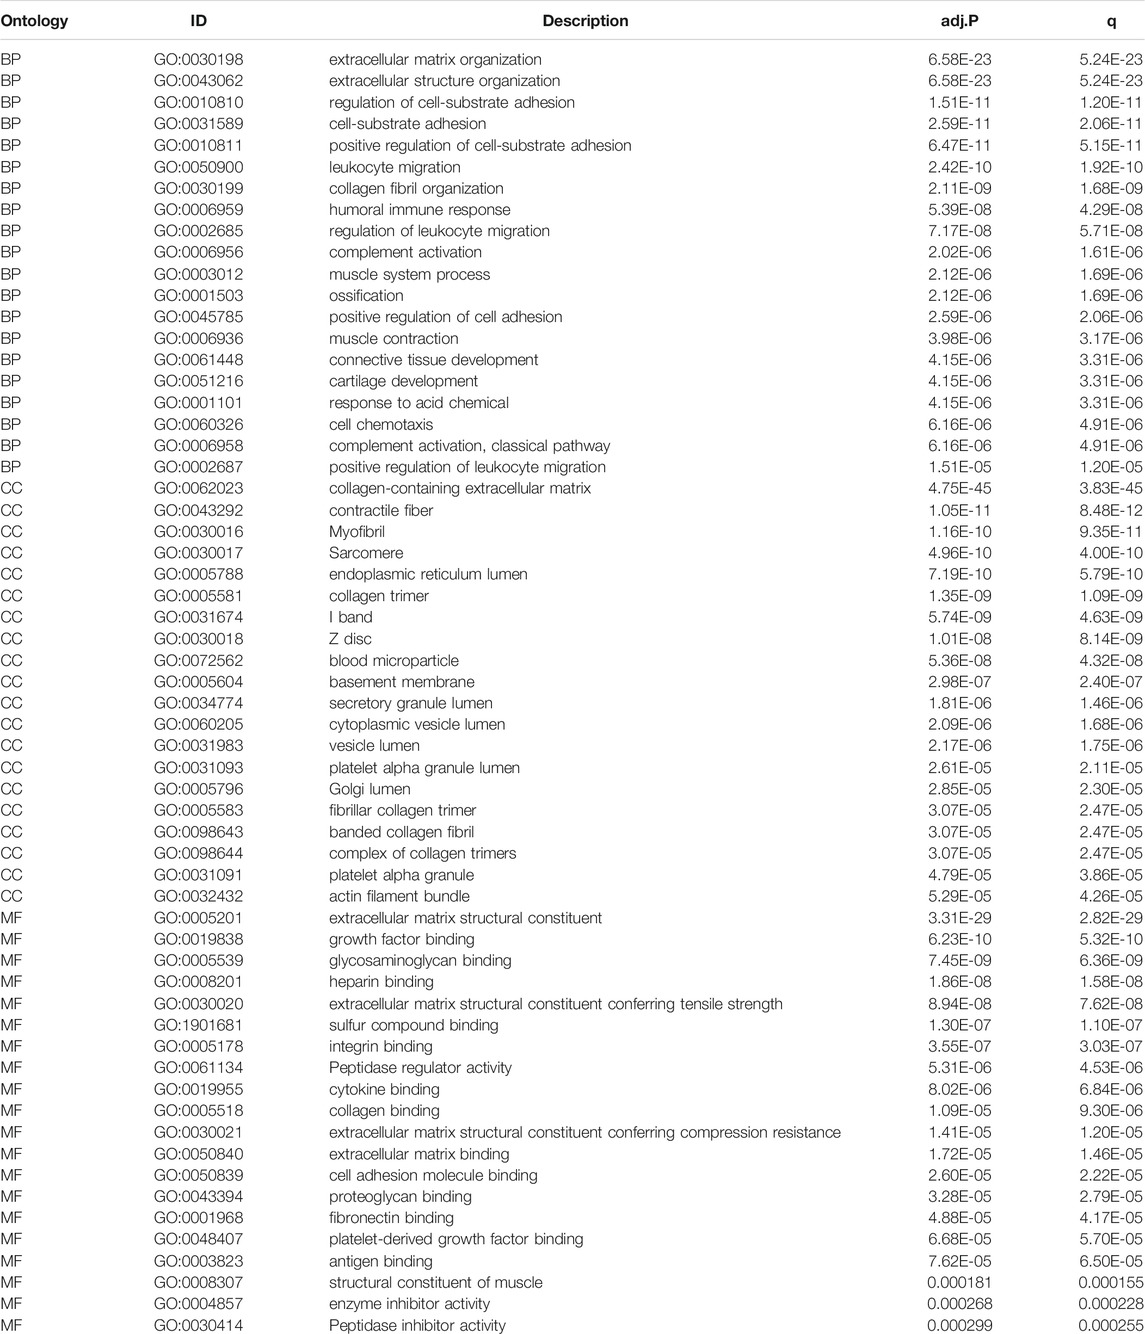
TABLE 2. The GO enrichment analysis of DEGs results between HSPB8 high expression group and low expression group. The pathways with p.adjust< 0.05 and qvalue< 0.05 are considered to be significantly enriched, showing the Top20 enrichment items of each category.

TABLE 3. KEGG pathway enrichment analysis of DEGs between HSPB8 high expression and low expression groups.
KEGG Enrichment Analysis Pathway Diagram
The pathways with >10 genes enriched by KEGG enrichment analysis included cytokine-cytokine receptor interactions, vascular smooth muscle contraction, adhesion, protein digestion, absorption, and proteoglycan pathways in cancer (Figure 4). Genes labeled in green in the pathway map reflect DEGs.
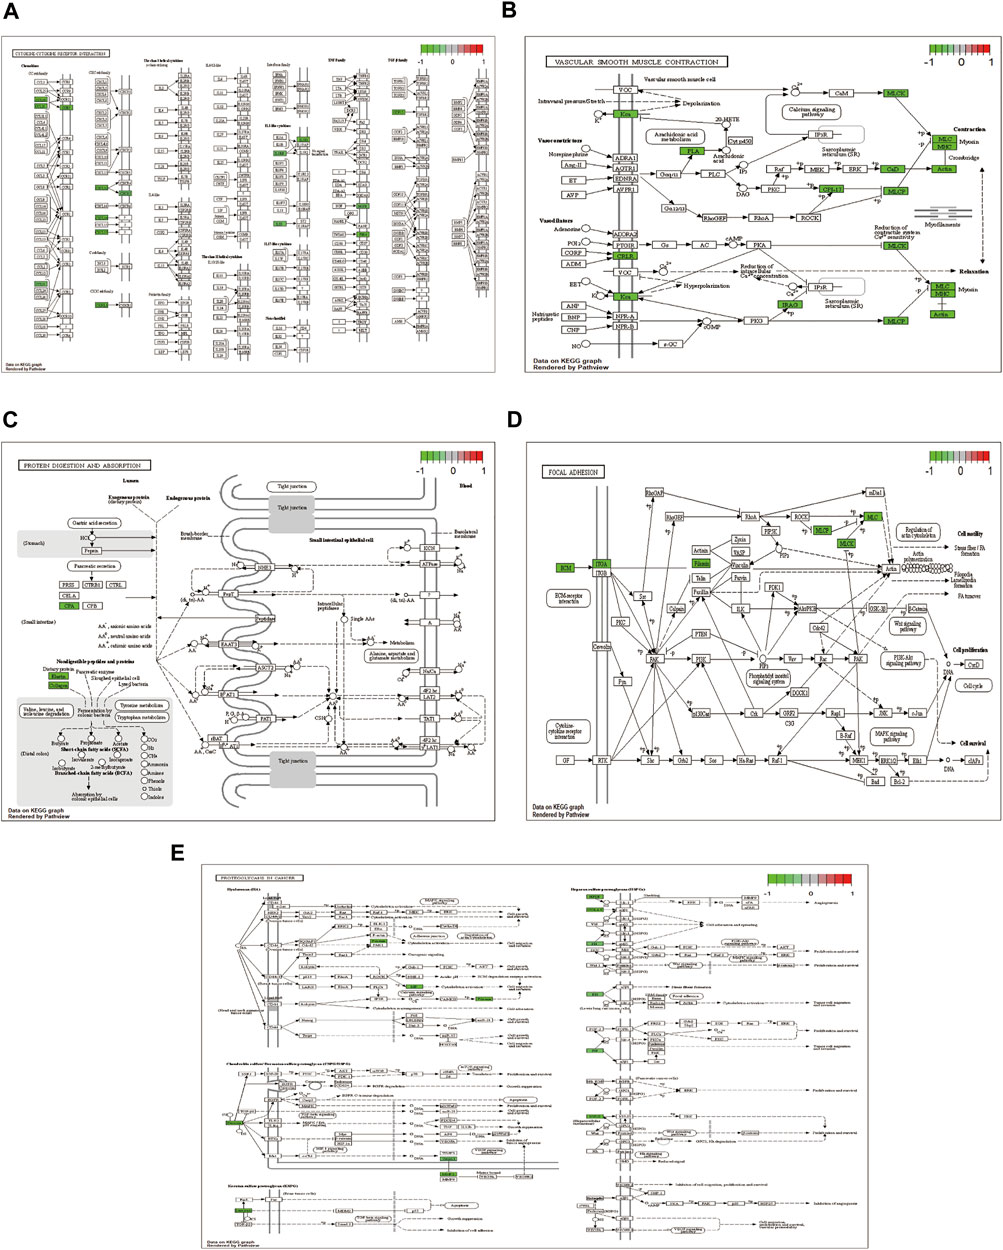
FIGURE 4. KEGG enrichment analysis showing (A) cytokine-cytokine receptor interaction; (B) vascular smooth muscle contraction; (C) focal adhesion; (D) protein digestion and absorption; and (E) proteoglycans in cancer pathway diagram.
Protein-Protein Interaction Network Construction
We constructed molecular interaction networks between the DEGs’ high and low HSPB8 expression groups. PPI network analysis was performed using the STRING database and visualized using Cytoscape (Figure 5A). Hub genes were further analyzed using the MCODE plug-in (Figures 5B–E). We used the most closely linked set of hub genes obtained from the MCODE analysis as target genes and predicted the miRNAs that interact with the target genes using the TarBase, miRecords, and miRTarBase databases (Figure 5F).
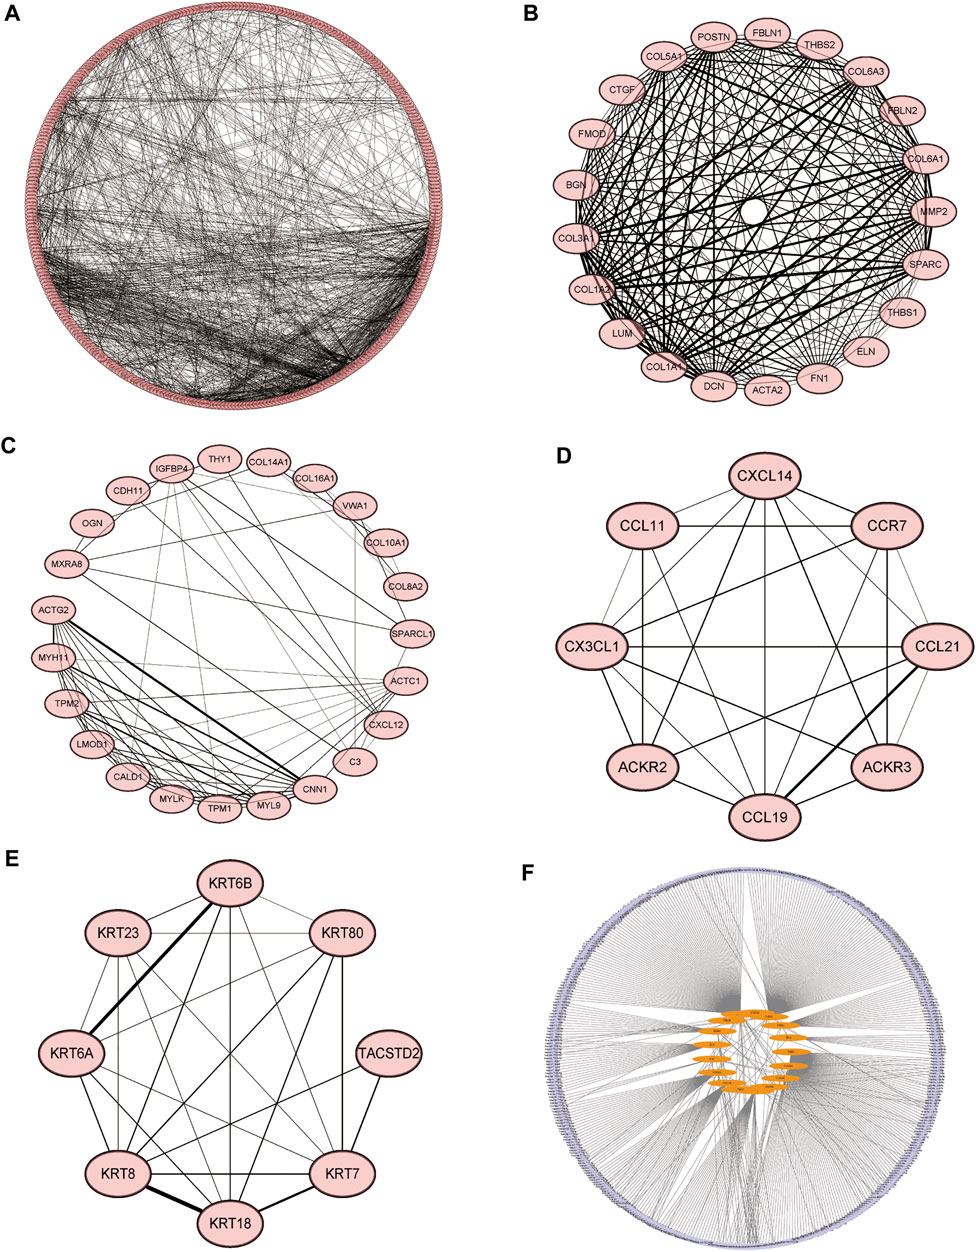
FIGURE 5. Molecular interaction networks. (A) Protein-protein interaction network analysis was performed on DEGs between the high and low HSPB8 expression groups using the STRING database. Cytoscape was used for visualization. (B–E) The MCODE plug-in was used to analyze hub genes, which include the four groups with the largest number of clusters; (F) The most closely linked hub genes were used as target genes, and the miRNAs that interact with the target genes were predicted by the TarBase, miRecords, and miRTarBase databases to construct a molecular interaction network.
Gene Set Enrichment Analysis
We performed GSEA on the TCGA-BLCA dataset using the clusterProfiler package to analyze the gene expression matrix. The file, c2. all.v7.0. entrez.gmt, was used as the reference gene set. The enrichment analysis was performed using the gseGO and gseKEGG functions. The top 30 entries with p. adjust <0.05 were visualized (Figures 6A–F; Table 4). The results were mostly enriched in the response group signaling pathways in cancer, NF-kB pathway, lymphocyte pathway, CD40 pathway, IL17, IL3, IL5, P53, ERK5, NO2IL12, ALK2 pathway, and cytokine linkage pathway.
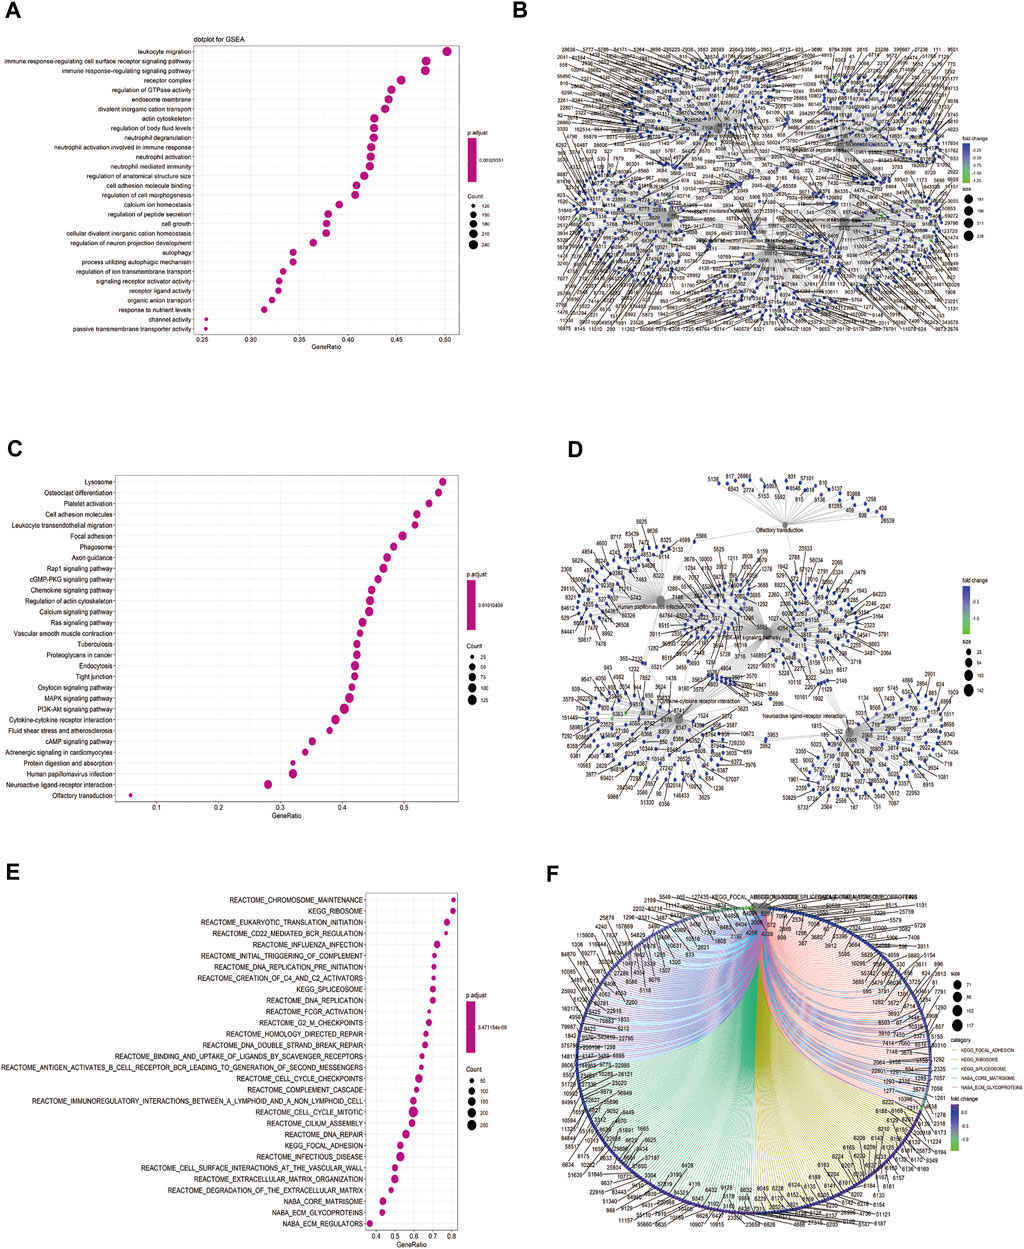
FIGURE 6. Gene set enrichment analysis (GSEA). (A) Bubble chart showing the GO terms enriched between the high and low HSPB8 expression groups in the TCGA-BLCA dataset; (B) Enrichment plots of the GO terms between the high and low HSPB8 expression groups in the TCGA-BLCA dataset; (C) Bubble chart of the enriched KEGG terms between the high and low HSPB8 expression groups in the TCGA-BLCA data set; (D) Enrichment plot of the KEGG terms between the high and low HSPB8 expression groups in the TCGA-BLCA dataset; (E) Bubble chart of the enriched GSEA entries between the high and low HSPB8 expression groups in the TCGA-BLCA dataset; (F) Chordogram of GSEA term enrichment between the high and low HSPB8 expression groups in the TCGA-BLCA dataset.
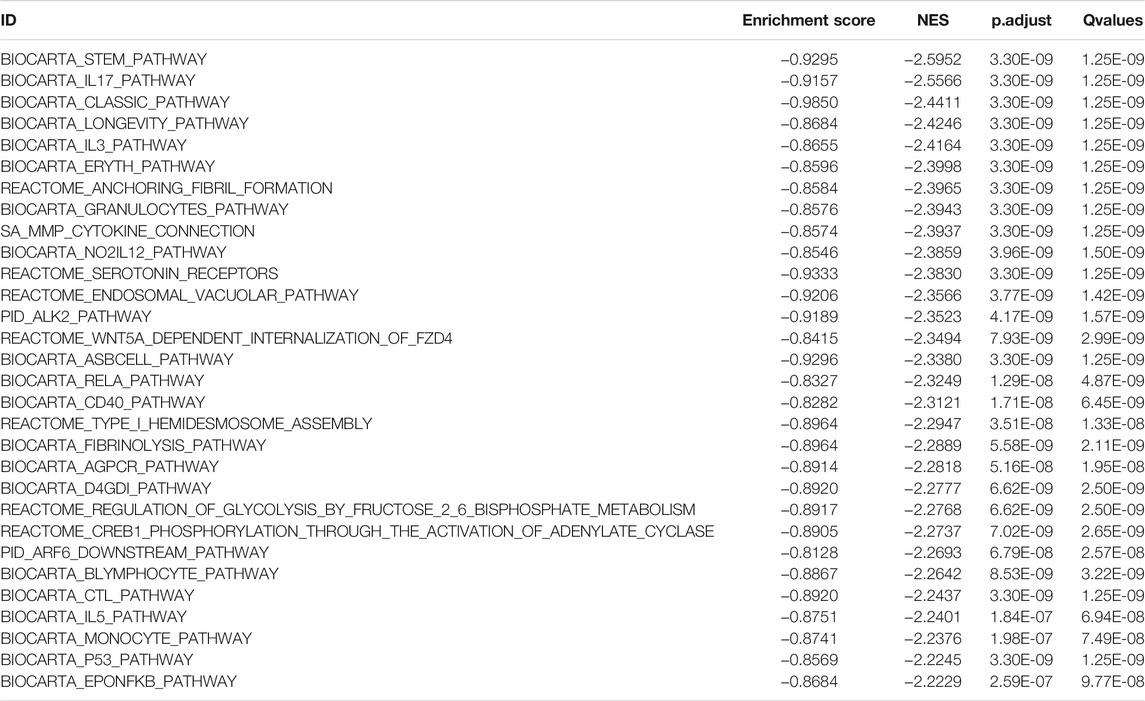
TABLE 4. TCGA-BLCA data set HSPB8 high expression group and low expression group Top30 NES absolute value GSEA enrichment analysis results list.
Differential Analysis of Immune Cell Composition
We used the CIBERSORT algorithm to deconvolute the gene expression matrices and derive the immune cell composition matrix (Figure 7, TCGA-BLCA dataset; Figure 8, GSE130598 dataset). The par function calculated the immune cell percentage, and stacked histograms (Figure 7A, Figure 8A) and heatmaps (Figure 7B, Figure 8B) were plotted. A correlation heat map was plotted to visualize the correlation of composition by 22 immune cell types (Figure 7C, Figure 8C), with red representing positive correlations and blue representing negative correlations. The differences in the composition by the 22 immune cell types amounts were plotted in violin plots (Figure 7D, Figure 8D). The results showed significant differences between the groups in the composition of various immune cells, including B cells, CD4+ T cells, and CD8+ T cells.
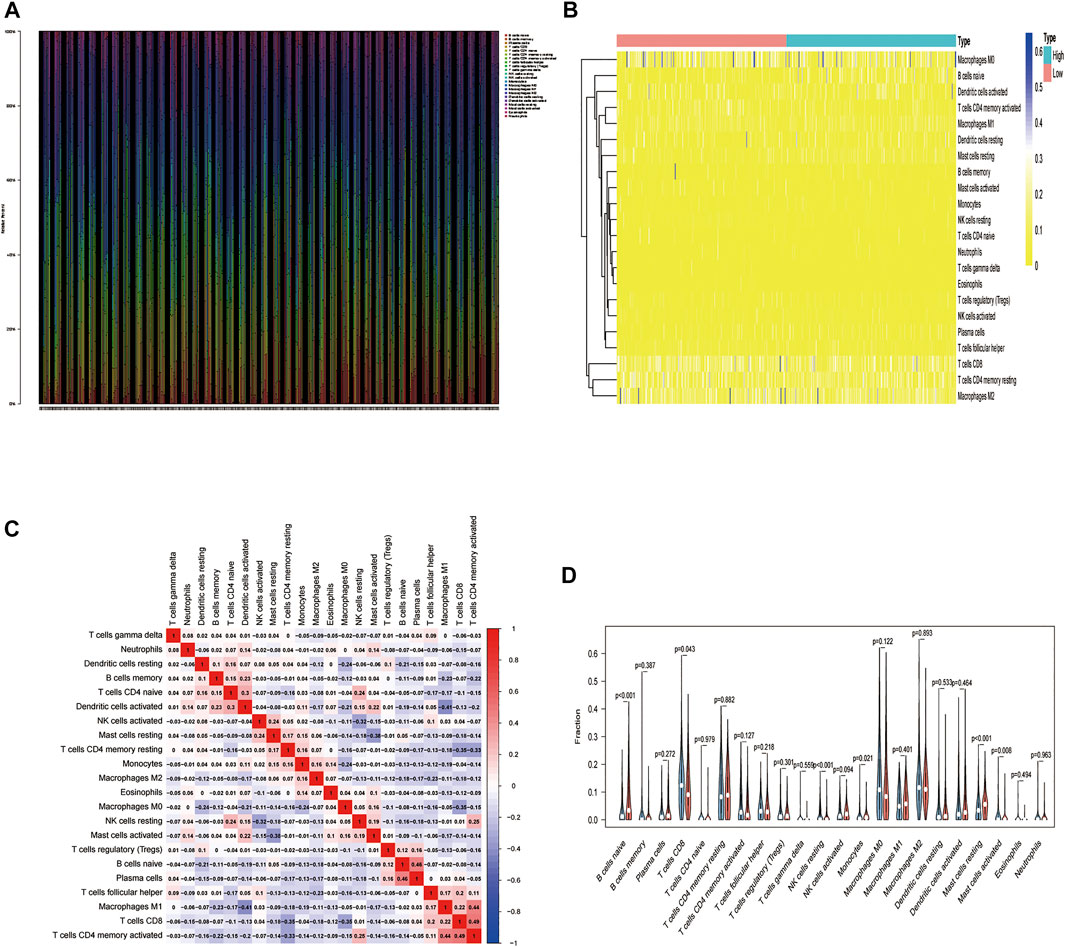
FIGURE 7. The relationship between HSPB8 expression and immune cell composition in the TCGA-BLCA data set. (A) Immune cell composition in the high and low HSPB8 expression groups. The proportion of composition by 22 immune cell types in tumor samples is shown in the stacked histogram; (B) The relationship between immune cell composition and HSPB8 expression; (C) The correlation of immune cell composition in the 22 samples. Red represents positive correlations, and blue represents negative correlations; (D) Immune cell composition in the high and low HSPB8 expression groups, as analyzed using the CIBERSORT algorithm.
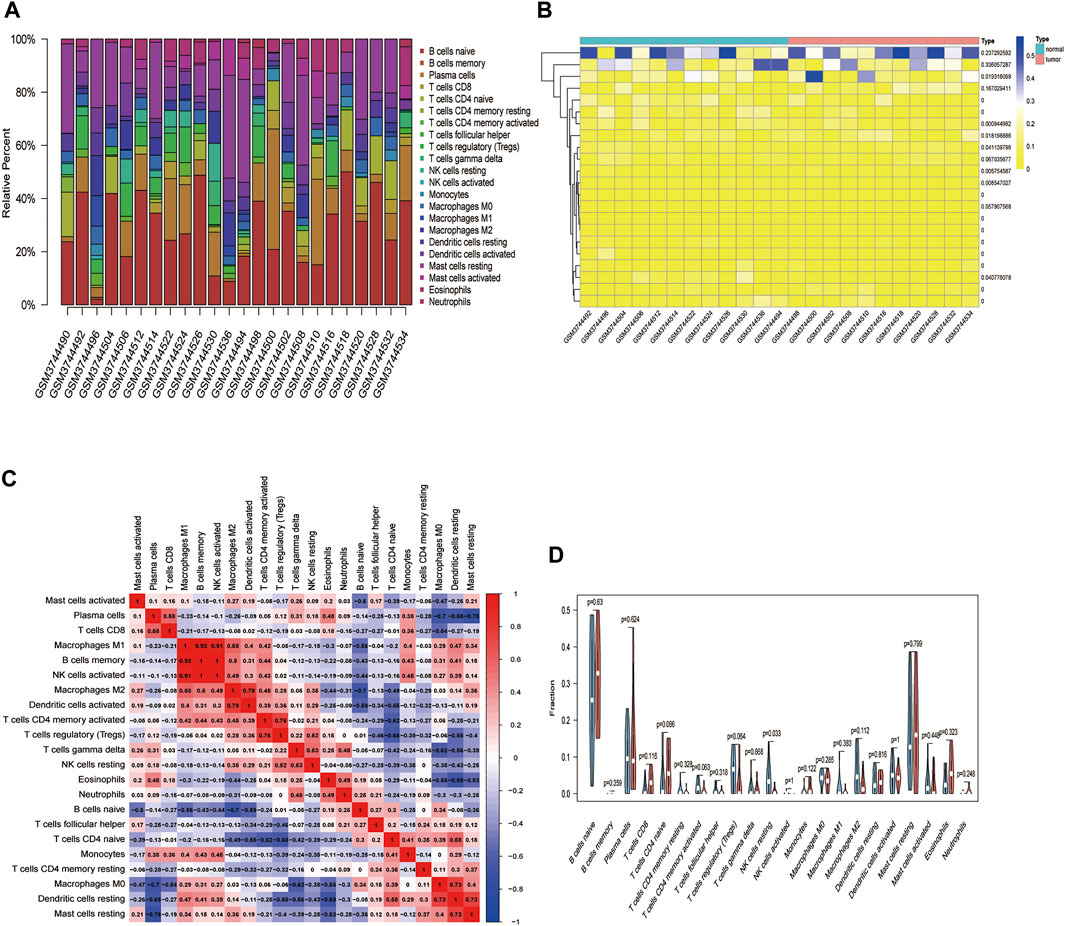
FIGURE 8. The relationship between HSPB8 expression and immune cell composition in the GSE130598 data set. (A) Immune cell composition in the high and low HSPB8 expression groups. The proportion of composition by 22 immune cell types in tumor samples is shown in the stacked histogram; (B) The relationship between immune cell composition and HSPB8 expression; (C) The correlation of immune cell composition in the 22 samples. Red represents positive correlations, and blue represents negative correlations; (D) Immune cell composition in the high and low HSPB8 expression groups, as analyzed using the CIBERSORT algorithm.
Construction of a Prognostic Risk Model of Immune-Related Co-expressed Genes of HSPB8
We examined whether HSPB8 expression affects the overall survival of BLCA patients (Figure 9A). We first intersected the genes co-expressed with HSPB8 and immune-related genes (Figure 9B). Next, we combined clinical data from the TCGA-BLCA dataset to construct a risk prediction model for this set of immune-related genes (Figure 9C) and plotted the risk curves (top), survival status (middle), and risk heat map (bottom) (Figure 9D). To demonstrate the personalized assessment of patient prognosis using risk scores combined with clinicopathological features, we tested the immune-related gene expression risk models in different tumors from the TCGA database and the predictive power of risk scores to determine patients’ prognosis with different patients tumors. Then, the predictive ability of risk scores combined with clinicopathological features to project BLCA patient prognosis was analyzed using univariate and multifactorial Cox analysis (Figures 9E,F; Table 5).
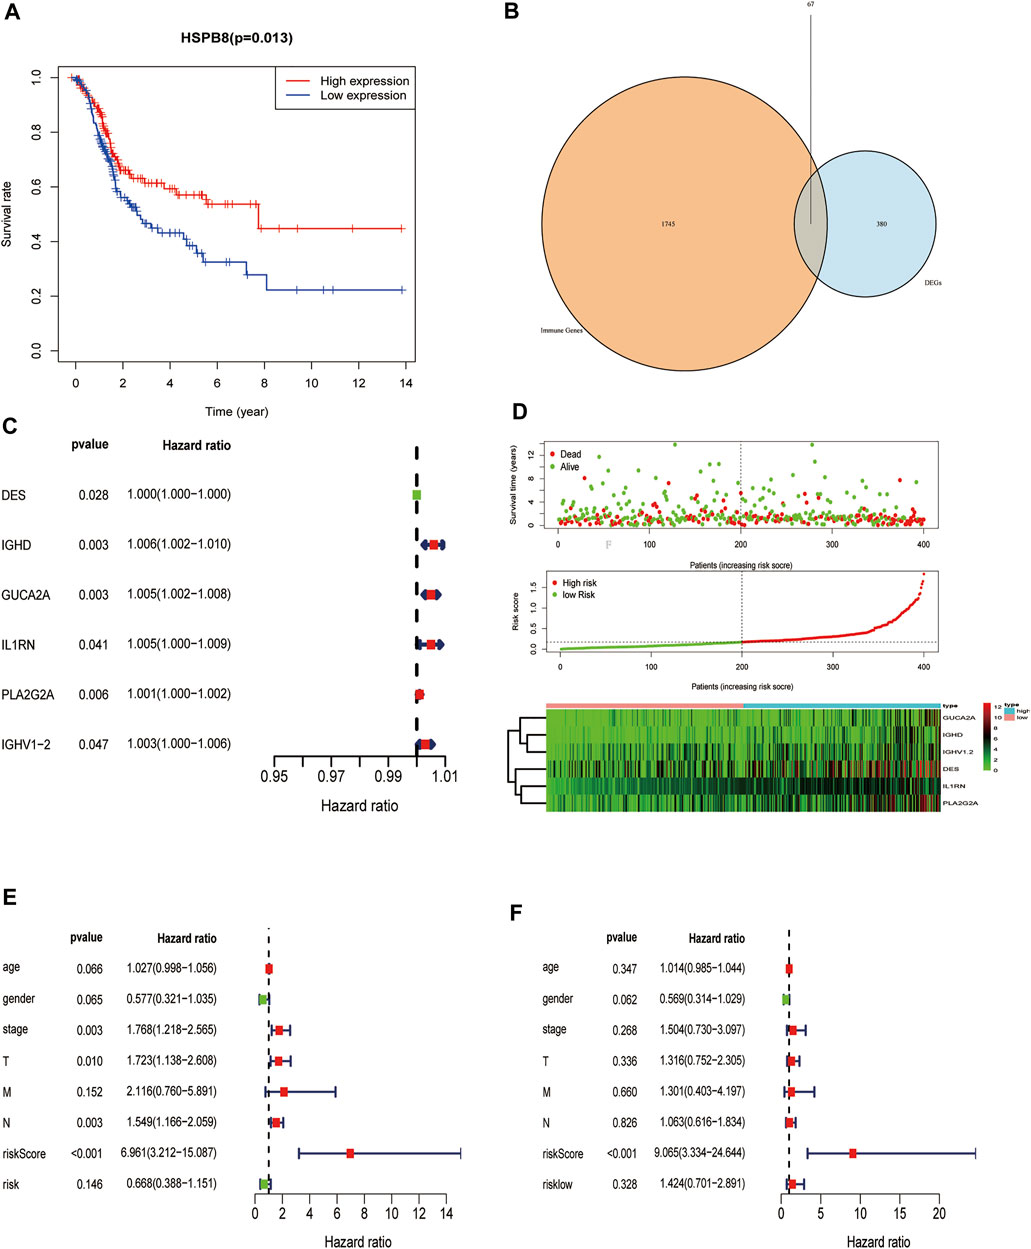
FIGURE 9. Construction of a prognostic risk model of immune-related genes co-expressed with HSPB8. (A) HSPB8 expression affects the overall survival of BC patients; (B) The intersection of HSPB8 co-expressed genes with immune-related genes; (C) Combination of TCGA-BLCA clinical data, HSPB8 expression, and co-expressed immune-related genes were used to construct the risk prediction model; (D) The risk curve of HSPB8 co-expressed, immune-related gene risk model (top), survival status (middle), and risk heatmap (bottom); (E) Forest plot showing univariate Cox regression analysis of the predictive power of risk scores combined with clinicopathological characteristics of patients for BC prognosis; (F) Forest diagram showing multivariate Cox analysis of the predictive ability of risk scores combined with clinicopathological characteristics of patients for BC prognosis.
Decreased Expression of HSPB8 Predicts a Poor Prognosis in Patients With BLCA
To further explore the impact of the risk model gene set on the BLCA patient survival and prognosis, we analyzed the OS between high and low-risk groups using it as a risk factor in the clinical survival data from the TCGA database (Figure 10A). The survROC package was used to predict whether the clinical variables included in the analysis accurately predicted BLCA patient survival and prognosis based on the AUC value of the prognostic risk score (AUC = 0.659). The results indicated that the gene set had some accuracy for the OS prognosis of BLCA. A nomogram for clinical prediction was also constructed (Figure 10C). Correlation analysis of the clinical subgroup variables was explored based on risk scores to demonstrate differences between clinical subgroups (Figure 10D).
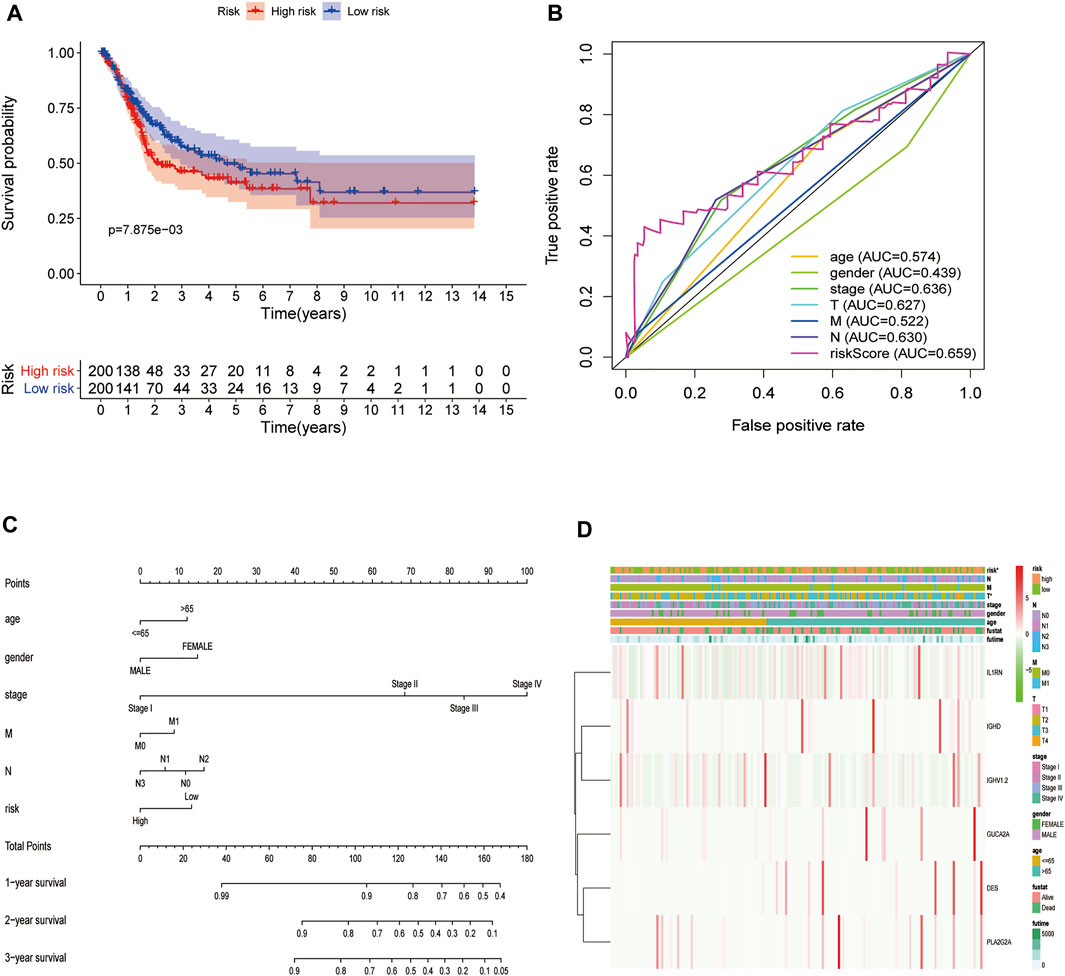
FIGURE 10. Decreased expression of HSPB8 predicts a poor prognosis in patients with BLCA. (A) Overall survival between the high and low-risk groups from the TCGA-BLCA database; (B) The BLCA prognostic value of each clinical variable and its accuracy ROC curve; (C) Construction of a clinical prediction nomogram; (D) Correlation analysis of clinical subgroup variables based on the risk score and the differences between the clinical subgroups shown as a heatmap.
Discussion
BC is among the most prevalent malignancies of the genitourinary system and has been identified as the fourth and 10th leading cause of cancer-related deaths in males and females, respectively (Ma et al., 2018). The pathogenesis of BC is complex and involves several factors, including intrinsic genetic factors and extrinsic environmental factors, such as smoking, chemical pollution, genetic mutation, and single nucleotide polymorphisms (Cai et al., 2019; Turner et al., 2019; Xu Chenyang et al., 2020). With the rapid advancements in molecular biology techniques, BC research and treatment have been greatly improved. However, the long-term prognosis of BC remains unsatisfactory, and the pathogenesis associated with BC progression remains elusive. Microarray and bioinformatics analyses have significantly enhanced our understanding of disease occurrence and the development of molecular mechanisms. These analyses are necessary to explore genetic alternations and identify potential diagnostic biomarkers. However, when using single microarray datasets, high false-positive rates and biased results have been observed. Therefore, novel, highly specific, sensitive, and effective biomarkers are urgently required for BC diagnosis and treatment. This study explored the gene expression profile and BC pathogenesis using high-throughput transcriptome data obtained from TCGA and GEO datasets. We show that the expression of HSPB8, which is involved in the regulation of cell proliferation, apoptosis, and carcinogenesis, is related to BC progression and prognosis. We comprehensively analyzed HSPB8 expression its clinical relevance and explored its potential diagnostic and prognostic value in BC.
Analysis of hub genes using the MCODE plug-in identified CCL21 as a gene related to HSPB8 expression in BC. Recent studies have shown that chemokines such as IL-8 can enhance chemoresistance and cancer stem cell-like properties (Lu et al., 2016). The atypical ACKR4, which is expressed in epithelial cells of the bladder, is a high-affinity receptor for CCL21. Further, CCL21 perfusion in the rat bladder increases bladder excitability and increases c-fos activity in spinal cord neurons (Offiah et al., 2016). CXCL14 (also known as BRAK) is involved in tumorigenesis. Pancreatic and prostate cancers show increased CXCL14 expression, while other cancer types, including cancers of breast, kidneys, and cervix, show downregulated CXCL14 expression (Nagarsheth et al., 2017). Furthermore, CXCL14 expression is inhibited by DNA methylation in lung cancer cells, resulting in reduced tumor growth.
GO enrichment analysis of genes co-expressed with HSPB8 were enriched in humoral immune response, complement activation, positive regulation of leukocyte migration, growth factor binding, peptidase regulatory activity, cytokine binding, proteoglycan binding, and peptidase inhibitor activity pathways. Complement system activation is tightly regulated by a network of proteins known as the complement activation regulator, limiting host complement activation and thus preventing self-injury (Amet et al., 2012). Excessive complement activation in the tumor microenvironment is associated with inflammation and tumor growth (Reis et al., 2019). Non-covalent interaction of proteoglycans with HyA (an important non-proteoglycan) occurs via hyaluronan binding motifs (Shih and Varghese, 2019). Tumor cells express different membrane proteins such as endothelial growth factor receptor (EGFR) and cell surface proteoglycans, making it possible for molecules to bind specifically to these proteins (Y. F. Xiao et al., 2015). KEGG enrichment analysis showed gene enrichment in cytokine-cytokine receptor interactions, vascular smooth muscle contraction, adhesion, protein digestion and absorption, cancer smooth muscle contraction, and proteoglycan pathway in cancer. Cytokine-cytokine receptor activation leads to key immune signaling pathways that regulate cancer development and progression (X. Chen et al., 2020). Furthermore, apart from differentially expressed genes in BC, miRNA expression affects cell cycle progression, epithelial-mesenchymal transition, cytokine-cytokine receptor interactions, and downstream cancer pathways, including phosphatidylinositol 3-kinase (PI3K)-Akt signaling and mitogen-activated protein kinase signaling pathways (Lee et al., 2018).
In the present study, GSEA was performed to investigate the potential signaling pathways in BC with high HSPB8 expression. Our results suggested that BC patients with high HSPB8 expression have increased gene expression related to the response group signaling pathway, NF-κB pathway, lymphocyte pathway, CD40 pathway, IL17, IL3, IL5, P53, ERK5, NO2IL12, ALK2 pathway, and cytokine linkage pathway in cancer. Recent studies have shown that inflammatory signaling pathways are involved in carcinogenesis via activation of NF-κB signaling (Sun et al., 2019), which may act as a downstream pathway regulating BC proliferation and progression (Xu Jing et al., 2020). Immune response pathways are involved in inflammatory bowel disease, leukocyte transendothelial migration, complement system, coagulation cascade, chemokine signaling pathways, toll-like receptor signaling pathways, B-cell receptor signaling pathway, systemic lupus erythematosus, platelet activation, and IL-17 signaling pathway (Du et al., 2019).
The tumor microenvironment affects the occurrence and recurrence of tumors and plays an important role in tumor immunotherapy outcomes. Tumor-infiltrating immune cells are an indispensable component of the tumor microenvironment, and their composition and distribution are related to cancer prognosis (B. Li et al., 2016). Previous studies have reported that the location, type, and density of inflammatory infiltrating cells in colorectal cancer are better predictors of survival than clinical and histopathological factors (Galon et al., 2006). Given the critical role of the tumor microenvironment in cancer progression, and because tumor-infiltrating immune cells are an integral part of the tumor microenvironment, we investigated the relationship between HSPB8 expression status and immune infiltration in BC. Our results showed significant differences between groups for various immune cells such as B cells, CD4+ T cells, and CD8+ T cells. Huang et al. (Y. Huang et al., 2015)observed that CD8+ T cells are key factors influencing tumor immunotherapy. Their role depends on the composition of the accompanying inflammatory cells, including macrophages, B cells, and CD4 TILs.
Similarly, Matsumoto et al. (Matsumoto et al., 2016) found that increased CD4+ and CD8+ T cell infiltration is associated with better clinical outcomes in triple-negative breast cancer. In BC, CD8+ T cells and memory-activated CD4+ T cells showed increased infiltration and abundance in a high-TMB group that correlated with prolonged OS and a lower risk of recurrence (Zhang et al., 2020). Therefore, we inferred that HSPB8 impacts the immune microenvironment of BC participates in the regulation of BC tumor immunity can be used as a prognostic indicator for BC and can reflect the immune status of patients.
Despite performing a thorough computational analysis, the present study has several limitations. First, the data were obtained from public databases, so the quality of the raw data cannot be appraised. Second, the sample size was relatively small, and the study failed to cover patients from different ethnicities and regions. In addition, the retrospective design may have caused inevitable inherent bias. Therefore, further studies with larger sample size and a prospective design are warranted to increase the statistical power and achieve more meaningful outcomes applicable to wider populations. Finally, although microarray-based bioinformatic analysis is a powerful tool to understand the molecular mechanisms and identify potential biomarkers, further experimental evidence is required to fully elucidate the underlying mechanisms related to HSPB8 expression in BC.
Conclusion
In summary, the current study suggests that HSPB8 may be a promising diagnostic and prognostic molecular marker for BC. However, extensive prospective studies are required to verify the clinical application of HSPB8 in the personalized management of BC. Thus, further experimental validation should be performed to validate the biological role of HSPB8 in BC.
Data Availability Statement
The data used and analyzed during the current study are available from The Cancer Genome Atlas (TCGA) (https://portal.gdc.cancer.gov/) and Gene Expression Omnibus (GEO) (https://www.ncbi.nlm.nih.gov/geo). The names of the repository/repositories and accession number(s) can be found in the article/Supplementary Material.
Author Contributions
ZT, YH, and SF participated in the design of this study, and they drafted the manuscript. XD and YZ performed bioinformatics analyses and assisted with analyzing other data. XZ, HW, and JW helped to revise the manuscript. All authors have read and approved the final manuscript.
Conflict of Interest
The authors declare that the research was conducted in the absence of any commercial or financial relationships that could be construed as a potential conflict of interest.
Publisher’s Note
All claims expressed in this article are solely those of the authors and do not necessarily represent those of their affiliated organizations, or those of the publisher, the editors, and the reviewers. Any product that may be evaluated in this article, or claim that may be made by its manufacturer, is not guaranteed or endorsed by the publisher.
Acknowledgments
We thank the Gene Expression Omnibus (GEO) and The Cancer Genome Atlas (TCGA) Database for sharing many data. This work was supported by the National Natural Science Foundation of China (No. 82060464) and the Yunnan Provincial Education Department Scientific Research Fund Project (2022Y221).
References
Amet, T., Ghabril, M., Chalasani, N., Byrd, D., Hu, N., Grantham, A., et al. (2012). CD59 Incorporation Protects Hepatitis C Virus against Complement-Mediated Destruction. Hepatology 55, 354–363. doi:10.1002/hep.24686
Ashburner, M., Ball, C. A., Blake, J. A., Botstein, D., Butler, H., Cherry, J. M., et al. (2000). Gene Ontology: Tool for the Unification of Biology. Nat. Genet. 25, 25–29. doi:10.1038/75556
Bhattacharya, S., Dunn, P., Thomas, C. G., Smith, B., Schaefer, H., Chen, J., et al. (2018). ImmPort, toward Repurposing of Open Access Immunological Assay Data for Translational and Clinical Research. Sci. Data 5, 180015. doi:10.1038/sdata.2018.15
Cai, A., Bian, K., Chen, F., Tang, Q., Carley, R., Li, D., et al. (2019). Probing the Effect of Bulky Lesion-Induced Replication Fork Conformational Heterogeneity Using 4-Aminobiphenyl-Modified DNA. Molecules 24, 1566. doi:10.3390/molecules24081566
Chandrashekar, D. S., Chakravarthi, B. V. S. K., Robinson, A. D., Anderson, J. C., Agarwal, S., Balasubramanya, S. A. H., et al. (2020). Therapeutically Actionable PAK4 Is Amplified, Overexpressed, and Involved in Bladder Cancer Progression. Oncogene 39, 4077–4091. doi:10.1038/s41388-020-1275-7
Chen, B., Khodadoust, M. S., Liu, C. L., Newman, A. M., and Alizadeh, A. A. (2018). Profiling Tumor Infiltrating Immune Cells with CIBERSORT. Methods Mol. Biol. 1711, 243–259. doi:10.1007/978-1-4939-7493-110.1007/978-1-4939-7493-1_12
Chen, X., Li, X., Hu, X., Jiang, F., Shen, Y., Xu, R., et al. (2020). LUM Expression and its Prognostic Significance in Gastric Cancer. Front. Oncol. 10, 605. doi:10.3389/fonc.2020.00605
Cristofani, R., Piccolella, M., Crippa, V., Tedesco, B., Montagnani Marelli, M., Poletti, A., et al. (2021). The Role of HSPB8, a Component of the Chaperone-Assisted Selective Autophagy Machinery, in Cancer. Cells 10, 335. doi:10.3390/cells10020335
Du, G., Xiao, M., Zhu, Q., Zhou, C., Wang, A., and Cai, W. (2019). Intestinal Transcriptional Profiling Reveals Fava Bean-Induced Immune Response in DBA/1 Mice. Biol. Res. 52, 9. doi:10.1186/s40659-019-0216-9
Galon, J., Costes, A., Sanchez-Cabo, F., Kirilovsky, A., Mlecnik, B., Lagorce-Pagès, C., et al. (2006). Type, Density, and Location of Immune Cells within Human Colorectal Tumors Predict Clinical Outcome. Science 313, 1960–1964. doi:10.1126/science.1129139
Hamouda, M.-A., Belhacene, N., Puissant, A., Colosetti, P., Robert, G., Jacquel, A., et al. (2014). The Small Heat Shock Protein B8 (HSPB8) Confers Resistance to Bortezomib by Promoting Autophagic Removal of Misfolded Proteins in Multiple Myeloma Cells. Oncotarget 5, 6252–6266. doi:10.18632/oncotarget.2193
Hu, D., Jiang, L., Luo, S., Zhao, X., Hu, H., Zhao, G., et al. (2020). Development of an Autophagy-Related Gene Expression Signature for Prognosis Prediction in Prostate Cancer Patients. J. Transl Med. 18, 160. doi:10.1186/s12967-020-02323-x
Huang, H.-Y., Lin, Y.-C. -D., Li, J., Huang, K.-Y., Shrestha, S., Hong, H.-C., et al. (2020). miRTarBase 2020: Updates to the Experimentally Validated microRNA-Target Interaction Database. Nucleic Acids Res. 48, D148–d154. doi:10.1093/nar/gkz896
Huang, Y., Ma, C., Zhang, Q., Ye, J., Wang, F., Zhang, Y., et al. (2015). CD4+ and CD8+ T Cells Have Opposing Roles in Breast Cancer Progression and Outcome. Oncotarget 6, 17462–17478. doi:10.18632/oncotarget.3958
Ito, K., and Murphy, D. (2013). Application of Ggplot2 to Pharmacometric Graphics. CPT: Pharmacometrics Syst. Pharmacol. 2, 79. doi:10.1038/psp.2013.56
Kanehisa, M., Furumichi, M., Tanabe, M., Sato, Y., and Morishima, K. (2017). KEGG: New Perspectives on Genomes, Pathways, Diseases and Drugs. Nucleic Acids Res. 45, D353–D361. doi:10.1093/nar/gkw1092
Kang, W., Wang, Q., Dai, Y., Wang, H., Wang, M., Wang, J., et al. (2020). Hypomethylation of PlncRNA-1 Promoter Enhances Bladder Cancer Progression through the miR-136-5p/Smad3 axis. Cell Death Dis 11, 1038. doi:10.1038/s41419-020-03240-z
Karagkouni, D., Paraskevopoulou, M. D., Chatzopoulos, S., Vlachos, I. S., Tastsoglou, S., Kanellos, I., et al. (2018). DIANA-TarBase V8: a Decade-Long Collection of Experimentally Supported miRNA-Gene Interactions. Nucleic Acids Res. 46, D239–d245. doi:10.1093/nar/gkx1141
Lee, E., Collazo-Lorduy, A., Castillo-Martin, M., Gong, Y., Wang, L., Oh, W. K., et al. (2018). Identification of microR-106b as a Prognostic Biomarker of P53-like Bladder Cancers by ActMiR. Oncogene 37, 5858–5872. doi:10.1038/s41388-018-0367-0
Lenis, A. T., Lec, P. M., Chamie, K., and Mshs, M. (2020). Bladder Cancer. JAMA 324, 1980–1991. doi:10.1001/jama.2020.17598
Li, B., Severson, E., Pignon, J.-C., Zhao, H., Li, T., Novak, J., et al. (2016). Comprehensive Analyses of Tumor Immunity: Implications for Cancer Immunotherapy. Genome Biol. 17, 174. doi:10.1186/s13059-016-1028-7
Li, F., Xiao, H., Hu, Z., Zhou, F., and Yang, B. (2018). Exploring the Multifaceted Roles of Heat Shock Protein B8 (HSPB8) in Diseases. Eur. J. Cel Biol. 97, 216–229. doi:10.1016/j.ejcb.2018.03.003
Lu, L.-L., Chen, X.-H., Zhang, G., Liu, Z.-C., Wu, N., Wang, H., et al. (2016). CCL21 Facilitates Chemoresistance and Cancer Stem Cell-like Properties of Colorectal Cancer Cells through AKT/GSK-3β/Snail Signals. Oxidative Med. Cell Longevity 2016, 1–14. doi:10.1155/2016/5874127
Ma, Z., Xue, S., Zeng, B., and Qiu, D. (2018). lncRNA SNHG5 Is Associated with Poor Prognosis of Bladder Cancer and Promotes Bladder Cancer Cell Proliferation through Targeting P27. Oncol. Lett. 15, 1924–1930. doi:10.3892/ol.2017.7527
Martinez Rodriguez, R. H., Buisan Rueda, O., and Ibarz, L. (2017). H., Buisan Rueda, O., Ibarz, LBladder Cancer: Present and Future. Medicina Clínica (English Edition) 149, 449–455. doi:10.1016/j.medcli.2017.06.00910.1016/j.medcle.2017.10.005
Matsumoto, H., Thike, A. A., Li, H., Yeong, J., Koo, S.-l., Dent, R. A., et al. (2016). Increased CD4 and CD8-Positive T Cell Infiltrate Signifies Good Prognosis in a Subset of Triple-Negative Breast Cancer. Breast Cancer Res. Treat. 156, 237–247. doi:10.1007/s10549-016-3743-x
Modem, S., Chinnakannu, K., Bai, U., Reddy, G. P.-V., and Reddy, T. R. (2011). Hsp22 (HspB8/H11) Knockdown Induces Sam68 Expression and Stimulates Proliferation of Glioblastoma Cells. J. Cel. Physiol. 226, 2747–2751. doi:10.1002/jcp.22868
Nagarsheth, N., Wicha, M. S., and Zou, W. (2017). Chemokines in the Cancer Microenvironment and Their Relevance in Cancer Immunotherapy. Nat. Rev. Immunol. 17, 559–572. doi:10.1038/nri.2017.49
Offiah, I., Didangelos, A., Dawes, J., Cartwright, R., Khullar, V., Bradbury, E. J., et al. (2016). The Expression of Inflammatory Mediators in Bladder Pain Syndrome. Eur. Urol. 70, 283–290. doi:10.1016/j.eururo.2016.02.058
Piccolella, M., Crippa, V., Cristofani, R., Rusmini, P., Galbiati, M., Cicardi, M. E., et al. (2017). The Small Heat Shock Protein B8 (HSPB8) Modulates Proliferation and Migration of Breast Cancer Cells. Oncotarget 8, 10400–10415. doi:10.18632/oncotarget.14422
Reis, E. S., Mastellos, D. C., Hajishengallis, G., and Lambris, J. D. (2019). New Insights into the Immune Functions of Complement. Nat. Rev. Immunol. 19, 503–516. doi:10.1038/s41577-019-0168-x
Ritchie, M. E., Phipson, B., Wu, D., Hu, Y., Law, C. W., Shi, W., et al. (2015). Limma powers Differential Expression Analyses for RNA-Sequencing and Microarray Studies. Nucleic Acids Res. 43, e47. doi:10.1093/nar/gkv007
Shih, Y. V., and Varghese, S. (2019). Tissue Engineered Bone Mimetics to Study Bone Disorders Ex Vivo: Role of Bioinspired Materials. Biomaterials 198, 107–121. doi:10.1016/j.biomaterials.2018.06.005
Siegel, R. L., Miller, K. D., and Jemal, A. (2020). Cancer Statistics, 2020. CA A. Cancer J. Clin. 70, 7–30. doi:10.3322/caac.21590
Subramanian, A., Kuehn, H., Gould, J., Tamayo, P., and Mesirov, J. P. (2007). GSEA-P: a Desktop Application for Gene Set Enrichment Analysis. Bioinformatics 23, 3251–3253. doi:10.1093/bioinformatics/btm369
Sun, T., Gao, J., Han, D., Shi, H., and Liu, X. (2019). Fabrication and Characterization of Solid Lipid Nano-Formulation of Astraxanthin against DMBA-Induced Breast Cancer via Nrf-2-Keap1 and NF-kB and mTOR/Maf-1/PTEN Pathway. Drug Deliv. 26, 975–988. doi:10.1080/10717544.2019.1667454
Suzuki, M., Matsushima-Nishiwaki, R., Kuroyanagi, G., Suzuki, N., Takamatsu, R., Furui, T., et al. (2015). Regulation by Heat Shock Protein 22 (HSPB8) of Transforming Growth Factor-α-Induced Ovary Cancer Cell Migration. Arch. Biochem. Biophys. 571, 40–49. doi:10.1016/j.abb.2015.02.030
Szklarczyk, D., Gable, A. L., Lyon, D., Junge, A., Wyder, S., Huerta-Cepas, J., et al. (2019). STRING V11: Protein-Protein Association Networks with Increased Coverage, Supporting Functional Discovery in Genome-wide Experimental Datasets. Nucleic Acids Res. 47, D607–D613. doi:10.1093/nar/gky1131
Tang, Z., Li, C., Kang, B., Gao, G., Li, C., and Zhang, Z. (2017). GEPIA: a Web Server for Cancer and normal Gene Expression Profiling and Interactive Analyses. Nucleic Acids Res. 45, W98–w102. doi:10.1093/nar/gkx247
Tibshirani, R. J. (1996). Regression Shrinkage and Selection via the LASSO. J. R. Stat. Soc. Ser. B: Methodological 73, 273–282. doi:10.1111/j.2517-6161.1996.tb02080.x
Turner, M. C., Gracia‐Lavedan, E., Cirac, M., Castaño‐Vinyals, G., Malats, N., Tardon, A., et al. (2019). Ambient Air Pollution and Incident Bladder Cancer Risk: Updated Analysis of the Spanish Bladder Cancer Study. Int. J. Cancer 145, 894–900. doi:10.1002/ijc.32136
Wang, J., Miao, Y., Ran, J., Yang, Y., Guan, Q., and Mi, D. (2020). Construction Prognosis Model Based on Autophagy-Related Gene Signatures in Hepatocellular Carcinoma. Biomarkers Med. 14, 1229–1242. doi:10.2217/bmm-2020-0170
Witjes, J. A., Bruins, H. M., Cathomas, R., Compérat, E. M., Cowan, N. C., Gakis, G., et al. (2021). European Association of Urology Guidelines on Muscle-Invasive and Metastatic Bladder Cancer: Summary of the 2020 Guidelines. Eur. Urol. 79, 82–104. doi:10.1016/j.eururo.2020.03.055
Xiao, F., Zuo, Z., Cai, G., Kang, S., Gao, X., and Li, T. (2009). miRecords: an Integrated Resource for microRNA-Target Interactions. Nucleic Acids Res. 37, D105–D110. doi:10.1093/nar/gkn851
Xiao, Y.-F., Jie, M.-M., Li, B.-S., Hu, C.-J., Xie, R., Tang, B., et al. (2015). Peptide-Based Treatment: A Promising Cancer Therapy. J. Immunol. Res. 2015, 1–13. doi:10.1155/2015/761820
Xu, Chenyang, C., Lin, X., Qian, W., Na, R., Yu, H., Jia, H., et al. (2020). Genetic Risk Scores Based on Risk-Associated Single Nucleotide Polymorphisms Can Reveal Inherited Risk of Bladder Cancer in Chinese Population. Medicine 99, e19980. doi:10.1097/md.0000000000019980
Xu, Jing, J., Wei, Q., and He, Z. (2020). Insight into the Function of RIPK4 in Keratinocyte Differentiation and Carcinogenesis. Front. Oncol. 10, 1562. doi:10.3389/fonc.2020.01562
Yu, G. (2020). Gene Ontology Semantic Similarity Analysis Using GOSemSim. Methods Mol. Biol. 2117, 207–215. doi:10.1007/978-1-0716-0301-710.1007/978-1-0716-0301-7_11
Yu, G., Wang, L.-G., Han, Y., and He, Q.-Y. (2012). clusterProfiler: an R Package for Comparing Biological Themes Among Gene Clusters. OMICS: A J. Integr. Biol. 16, 284–287. doi:10.1089/omi.2011.0118
Yu, L.-L., Wang, Y., Xiao, Z.-K., and Chen, S.-S. (2021). Heat Shock Protein B8 Promotes Proliferation and Migration in Lung Adenocarcinoma A549 Cells by Maintaining Mitochondrial Function. Mol. Cel Biochem 476, 187–197. doi:10.1007/s11010-020-03896-3
Keywords: HSPB8, microarray, biomarker, bladder cancer, prognosis
Citation: Tan Z, Fu S, Huang Y, Duan X, Zuo Y, Zhu X, Wang H and Wang J (2022) HSPB8 is a Potential Prognostic Biomarker that Correlates With Immune Cell Infiltration in Bladder Cancer. Front. Genet. 13:804858. doi: 10.3389/fgene.2022.804858
Received: 29 October 2021; Accepted: 03 February 2022;
Published: 07 March 2022.
Edited by:
Maxim Freidin, King’s College London, United KingdomReviewed by:
Basavaraj Mallikarjunayya Vastrad, KLE Society’s College Of Pharmacy, IndiaChunfu Zheng, University of Calgary, Canada
Copyright © 2022 Tan, Fu, Huang, Duan, Zuo, Zhu, Wang and Wang. This is an open-access article distributed under the terms of the Creative Commons Attribution License (CC BY). The use, distribution or reproduction in other forums is permitted, provided the original author(s) and the copyright owner(s) are credited and that the original publication in this journal is cited, in accordance with accepted academic practice. No use, distribution or reproduction is permitted which does not comply with these terms.
*Correspondence: Jiansong Wang, wangjiansong@kmmu.edu.cn; Haifeng Wang, highphone@126.com
†These authors have contributed equally to this work
 Zhiyong Tan
 Shi Fu
 Yinglong Huang
 Xianzhong Duan
 Yigang Zuo
 Xiaorui Zhu
 Haifeng Wang
 Jiansong Wang