 Muthukumar Balamurugan
 Ruma Banerjee
 Sunitha Manjari Kasibhatla
 Archana Achalere
 Rajendra Joshi
- HPC—Medical and Bioinformatics Applications Group, Centre for Development of Advanced Computing, Innovation Park, Pune, India
A total of two lineages of Mycobacterium tuberculosis var. africanum (Maf), L5 and L6, which are members of the Mycobacterium tuberculosis complex (MTBC), are responsible for causing tuberculosis in West Africa. Regions of difference (RDs) are usually used for delineation of MTBC. With increased data availability, single nucleotide polymorphisms (SNPs) promise to provide better resolution. Publicly available 380 Maf samples were analyzed for identification of “core-cluster-specific-SNPs,” while additional 270 samples were used for validation. RD-based methods were used for lineage-assignment, wherein 31 samples remained unidentified. The genetic diversity of Maf was estimated based on genome-wide SNPs using phylogeny and population genomics approaches. Lineage-based clustering (L5 and L6) was observed in the whole genome phylogeny with distinct sub-clusters. Population stratification using both model-based and de novo approaches supported the same observations. L6 was further delineated into three sub-lineages (L6.1–L6.3), whereas L5 was grouped as L5.1 and L5.2 based on the occurrence of RD711. L5.1 and L5.2 were further divided into two (L5.1.1 and L5.1.2) and four (L5.2.1–L5.2.4) sub-clusters, respectively. Unassigned samples could be assigned to definite lineages/sub-lineages based on clustering observed in phylogeny along with high-confidence posterior membership scores obtained during population stratification. Based on the (sub)-clusters delineated, “core-cluster-specific-SNPs” were derived. Synonymous SNPs (137 in L5 and 128 in L6) were identified as biomarkers and used for validation. Few of the cluster-specific missense variants in L5 and L6 belong to the central carbohydrate metabolism pathway which include His6Tyr (Rv0946c), Glu255Ala (Rv1131), Ala309Gly (Rv2454c), Val425Ala and Ser112Ala (Rv1127c), Gly198Ala (Rv3293) and Ile137Val (Rv0363c), Thr421Ala (Rv0896), Arg442His (Rv1248c), Thr218Ile (Rv1122), and Ser381Leu (Rv1449c), hinting at the differential growth attenuation. Genes harboring multiple (sub)-lineage-specific “core-cluster” SNPs such as Lys117Asn, Val447Met, and Ala455Val (Rv0066c; icd2) present across L6, L6.1, and L5, respectively, hinting at the association of these SNPs with selective advantage or host-adaptation. Cluster-specific SNPs serve as additional markers along with RD-regions for Maf delineation. The identified SNPs have the potential to provide insights into the genotype–phenotype correlation and clues for endemicity of Maf in the African population.
1 Introduction
The genus Mycobacterium is known to cause tuberculosis (TB), which infects ∼10 million people worldwide annually (Coscolla and Gagneux 2014; Gagneux 2018; Global Tuberculosis Report 2021). The disease burden associated with TB is enormous, and Africa is one of the severely affected continents (Gehre et al., 2016; Global Tuberculosis Report 2021). Human TB is caused mainly by the organism Mycobacterium tuberculosis (M. tuberculosis), which belongs to the Mycobacterium tuberculosis complex (MTBC) (Gagneux 2018; Kanabalan et al., 2021). MTBC is responsible for TB in humans and animals (Brosch et al., 2002; Gagneux 2018). MTBC lineages have undergone specific deletion of large sequences in their genomes, known as the region of difference (RD), which enables delineation (Brosch et al., 2002). Lineage-wise classification of MTBC is also enabled using restriction fragment length polymorphism (RFLP) and PCR, such as mycobacterial interspersed repetitive units-variable number of tandem repeats (MIRU-VNTR) spoligotyping (Jeon et al., 2018).
There are seven lineages of MTBC, of which lineages L1–L4 and L7 comprise the Mycobacterium tuberculosis sensu stricto (majorly infecting humans), and L5 and L6 consist of Mycobacterium tuberculosis var. africanum (hereafter referred to as Maf) (Blouin et al., 2012; Firdessa et al., 2013; Riojas et al., 2018; Gagneux 2018). Additional lineages include two recently identified lineages, namely, L8 and L9 (Ngabonziza et al., 2020; Coscolla et al., 2021) and other animal-adapted strains (Gagneux 2018). According to RD-based classification, L5 and L6 evolved from their most recent ancestor that underwent RD9 deletion (Gagneux 2018). Besides RD9 deletion, L5 has also undergone RD711 deletion, and L6 has undergone RD7, RD8, RD10 (as also seen in the animal-adapted strains of MTBC), and RD702 deletion (de Jong et al., 2010b). Phylogenetically, this places L5 closer to the human-adapted MTBC and L6 closer to the animal-adapted strains (Gagneux 2018). Recent studies have further classified L5 based on the presence and absence of RD711 (Ates et al., 2018; Coscolla et al., 2021; Comín et al., 2021).
Circulation of all MTBC lineages has been reported in Africa, thereby suggesting the emergence of MTBC from a common ancestor in Africa and its spread and expansion to the rest of the world through human migration (Gagneux et al., 2006, Wirth et al., 2008, Comas et al., 2013; Gehre et al., 2016, Rutaihwa et al., 2019, O’Neill et al., 2019; Coscolla et al., 2021). Among the human-associated MTBC, most of the lineages are found to be geographically widespread. Maf (L5 and L6) is restricted, particularly to the western region of West Africa and is known to cause 40–50% of TB in West Africa (Chatterjee and Pramanik 2015; Gehre et al., 2016; Winglee et al., 2016; Baya et al., 2020). Conversely, L7–L9 are limited to East Africa (Blouin et al., 2012; Firdessa et al., 2013; Ngabonziza et al., 2020; Coscolla et al., 2021). The geographical restriction of Maf infection is still elusive; however, few studies have reported the occurrence of TB due to Maf in other parts of the world, mostly in individuals who have migrated from the endemic parts of Africa (Isea-Peña et al., 2012; Comín et al., 2021). Such pathogens having adaptation to infect specific hosts restricted to a particular geographical location are termed as “specialists,” and this behavior may be attributed to the strict host–pathogen interactions which are relatively understudied (Brites and Gagneux, 2015; Asante-Poku et al., 2016; Sriswasdi et al., 2017).
L5 and L6 are known to differ substantially from other MTBC members in terms of genetic diversity, growth, and metabolism (Yeboah-Manu et al., 2017). Compared to M.tuberculosis, L5 and L6 are reported to have an attenuated and slower growth in culture along with lower bacterial load and delayed disease progression (Cá et al., 2019; Baya et al., 2020). L6 is known to be an opportunistic pathogen owing to mutations in genes essential for growth and contributes toward latent TB burden in West Africa (de Jong et al., 2005; de Jong et al., 2010a; Gehre et al., 2013; Ofori-Anyinam et al., 2017). Similar studies for L5 genomics are limited that has been highlighted earlier (Yeboah-Manu et al., 2017; Ates et al., 2018; Coscolla et al., 2021; Sanoussi et al., 2021). A slower response to TB treatment for L6 was observed when compared to other sensu stricto lineages (Diarra et al., 2018). Identification and treatment of latent TB are essential for reducing deaths caused by TB, as emphasized by the “End TB Strategy” of the World Health Organization (WHO) (Uplekar and Raviglione 2015; WHO 2015a, WHO 2015b; Zellweger et al., 2020). There is a lot of interest to understand the variation of Maf with respect to epidemiology and virulence (Asante-Poku et al., 2016; Stucki et al., 2016; Yeboah-Manu et al., 2017; Gagneux 2018; Ates et al., 2018; Coscolla et al., 2021). Phylogenomic distribution studies of MTBC lineages using comparative genomics approaches are studied extensively (Brosch et al., 2002, Gagneux et al., 2006; Vasconcellos et al., 2010, Gehre et al., 2016; Gagneux 2018; Coscolla et al., 2021).
Apart from long sequence polymorphisms, such as RDs and tandem repeats, signature genome-wide single nucleotide polymorphism (SNP)-based stratification approaches promise to provide valuable insights into the genomic diversity and help delineate the epidemiology of the circulating strains (Lipworth et al., 2019; Napier et al., 2020).
Population stratification studies based on genome-wide SNPs enable unraveling the genetic diversity existing within bacterial populations (Takuno et al., 2012; Lee et al., 2015; Castillo et al., 2020). Earlier studies by Lee et al. (2015) using M.tuberculosis pertaining to a specific geographical location provided insight into the role of evolutionary forces that shape the pathogen evolution vis-a-vis its environment. Hence, understanding population stratification would aid in rapid identification of (sub)-lineages, which is of great significance in tuberculosis research and may help in understanding the origin and predicting future outbreaks through the identification of rapid diagnostic markers (MacLean et al., 2019; Singh et al., 2019). To gain an insight into the population genetic characteristic of Maf samples (L5 and L6), an integrative approach using de novo and model-based clustering methods along with different population genomics approaches have been carried out based on the genome-wide variant profile generated with reference to Mycobacterium tuberculosis H37Rv. The variants identified may also have the potential to serve as robust genetic markers for differentiation of lineages and sub-lineages and provide clues towards host adaptation of Maf.
2 Materials and Methods
2.1 Data Collection and Processing
Sequence data of whole-genome belonging to 572 Maf samples were downloaded from NCBI Sequence Read Archive (SRA) available as of December 2019, with the keyword-based search “Mycobacterium africanum.” Samples were collected from multiple SRA projects. Quality check was carried out for each sample using FastQC (Andrews, 2010). Read quality >28 were retained, and poor quality reads were trimmed by TrimGalore (Babraham Bioinformatics, 2019). Reference mapping for all Maf samples was carried out using BWA-MEM (version 0.7.17) with Mycobacterium tuberculosis H37Rv (Refseq id: NC_000962.3) genome as reference (Cole et al., 1998; Li 2013). Samples with less than a million reads were further filtered based on read depth (minimum DP 5X) and mapping quality (MQ > 40) criteria (Supplementary Table S1).
SAMtools/BCFtools were used for sorting, indexing, and merging of samples (Li 2011). Lineage identification was performed using a RD-Analyzer (Faksri et al., 2016). Variant calling for all samples was carried out with ploidy as “1” using GATK HaplotypeCaller (McKenna et al., 2010). Default parameters were used for haplotype calling, viz., base quality score ≥10 and mapping quality ≥20. Independent runs of CombineGVCF followed by genotype calling were carried out for L5 and L6 samples. SNPs pertaining to the PE and PPE regions along with phages and insertion sequences were excluded from the analysis (Stucki et al., 2016). Variants were further filtered to remove SNPs present in only one sample (referred to as “singleton SNPs”), absent in >50% of the samples along with removal of tri- and multi-allelic sites. All SNPs were annotated using SnpEff (version 4.3t) with Mycobacterium tuberculosis H37Rv (NC_000962.3) as the reference annotations (Cingolani et al., 2012). SNPs were functionally classified as per their annotations reported in TubercuList (Lew et al., 2011). SNPs that had only a single alternate allele across all samples referred to as “alternate homozygous SNPs” were analyzed (Zojer et al., 2017). Drug-resistant genes were identified from the literature, and SNPs belonging to these genes were annotated (Gygli et al., 2017; Ghosh et al., 2020). The variant calling format (vcf) file pertaining to the homozygous SNPs were processed using customized in-house generated scripts to obtain FASTA sequences of individual samples. CD-HIT was used for removal of identical sequences (Li and Godzik 2006).
Additional 270 Maf samples were used for validation (Supplementary Table S2). A similar protocol for read quality checking and reference mapping was followed as stated previously. Variant calling for the validation set was performed using Pilon version 1.23 (Walker et al., 2014) (Figure 1).

FIGURE 1. Flowchart for genetic diversity analysis of Mycobacterium africanum.
2.2 Phylogenetic Analysis
A total of three datasets viz., all Maf (L5 and L6) samples (#380 termed as D1), all L6 samples (#197 termed as D2), and all L5 samples (#183 termed as D3) were analyzed independently. Multiple sequence alignment (MSA) of the polymorphic sites of each of these three datasets was obtained using MAFFT (v7.450) (Katoh et al., 2002). Maximum likelihood (ML) phylogenetic tree was generated using parallel MPI implementation of RAxML ver. 8 (Stamatakis, 2014). The general time reversible model of nucleotide substitution under the gamma model of rate heterogeneity (GTRCAT) was used with 1,000 bootstraps (Lanave et al., 1984; Gatto et al., 2007). The trees were visualized using iTOL (Letunic and Bork, 2019).
2.3 Population Stratification
Both model and non-model based methods were used for analyzing the underlying population structure of Maf. For model-based analysis, ParallelStructure (Besnier and Glover, 2013), which is an implementation of STRUCTURE tool (Pritchard et al., 2000) capable of taking advantage of multi-core computing architecture, was used. R version 3.4.4 and package parallel_structure available on a 2 TB RAM Ubuntu 18.04.5 LTS server were used for running the parallelSTRUCTURE tool. Parsimonious informative (PI) sites were derived from multiple genome alignment using MEGAX (Kumar et al., 2018). Linkage equilibrium was estimated using LIAN (Haubold and Hudson 2000) with 10,000 replicates. Admixture and linkage models with correlated allele frequencies were used for population structure estimation. A total of ten independent simulations of Markov chain Monte Carlo (MCMC) were used to derive the optimal number of clusters (k) with three sets of burn-in and burn-length (combination of 100,000–300,000; 150,000–350,000; 200,000–400,000). Optimal k was chosen based on the Evanno method (Evanno et al., 2005) as implemented in Structure Harvester (Earl and vonHoldt 2012). A cutoff of ≥0.05 was used for membership assignment to a given cluster.
2.4 De Novo Clustering Methods
Along with model-based approaches such as STRUCTURE and phylogenetic reconstruction, de novo method, namely, K-means clustering along with other non-model-based approaches requiring prior information, viz., discriminant analysis of principal components (DAPC), was also performed on the SNP profile of Maf samples. (Jombart et al., 2010; Grünwald and Goss, 2011, Montano et al., 2015). These methods were implemented on SNP data with reduced dimensions using principal component analysis (PCA).
K-means clustering was performed using PCA components explaining 95% of the variance in the data and was analyzed on three datasets (D1–D3) independently. To arrive at an optimal number of clusters for each data set, two layers of optimization were applied. First, an elbow plot was obtained, which gave the range of the optimal number of clusters near the elbow. Further on, classification performance measures, such as Davies Bouldin and Silhouette indices, were calculated. The lowest value of the Davies Bouldin index and highest value of the Silhouette index estimate the optimal number of K-means clustering, as both the indices complement each other.
2.5 Population Stratification Using Discriminant Analysis of Principal Components
As an exploratory option, a multivariate method, DAPC available in R package adegnet, was also used to infer the genetic structure of the Maf datasets (Jombart, 2008; Jombart et al., 2010; Grünwald and Goss, 2011, Montano et al., 2015). The discriminant analysis (DA) method uses populations defined a priori to maximize the genetic variation present between groups and minimize the within-group variation (Jombart, 2008). The dimensionality of the data is reduced using PCA followed by assessment of different predefined groups or clusters performed on the basis of DA components, resulting in posterior membership probability value for each sample to a defined cluster. These membership probability values are further analyzed to arrive at the optimal number of clusters where the variation of underlying data can be efficiently explained. The vcf file was read into R by using the vcfR tool to create a vcfR object (Knaus and Grünwald, 2017). This object was further converted into a genlight object using the vcfR2genlight function, providing ploidy information as “1” along with the predetermined population information obtained using STRUCTURE output. The genlight object retains only the “alternate homozygous SNPs” in the dataset. PCA was performed using the glPCA function in R. The maximum number of PCA components which explains 95% of the cumulative variance of SNP profiles were taken into account for DA. To avoid overfitting of the data, the optimal number of PCs required to explain the separation of individuals into predefined groups was achieved using the xval cross-validation function in R. DAPC was computed using the optimal number of PCs obtained through xval cross-validation. To obtain the number of discriminant functions to be retained, F-statistics for DA eigenvalues was calculated. These retained DA components define the membership probability of each sample in the population. The scatter plots and membership probability plots were obtained using the ggplot2 package in R (Wickham 2016).
2.6 Estimation of Genetic Diversity for the Clusters Obtained
Fixation index (Fst) and average pairwise nucleotide diversity indices per site (
2.7 Identification of Cluster-Specific Unique Single Nucleotide Polymorphisms
Clusters/sub-populations in the given dataset were identified using a combination of phylogenetic and population stratification analysis. SNPs present in at least one isolate of a cluster and absent in members across other clusters are termed “total-cluster-specific” SNPs. “Core-cluster-specific” SNPs were derived using “total-cluster-specific” SNPs with additional criteria of the SNPs being present across all samples in the cluster. The “core-subcluster-specific-SNP” was derived from the “total-subcluster-specific-SNPs” using the same criteria of SNP being present in all members of the sub-cluster (Figure 2). Functional annotations were carried out using SnpEff (Cingolani et al., 2012), Tuberculist (Lew et al., 2011), Kyoto Encyclopedia of Genes and Genomes (Kanehisa et al., 2017), and BioCyc (Karp et al., 2019). Core-cluster-specific SNPs were also analyzed in the context of previous studies (Ates et al., 2018; Coscolla et al., 2021). Synonymous SNPs obtained for each cluster were used as biomarkers for the identification of Maf samples.
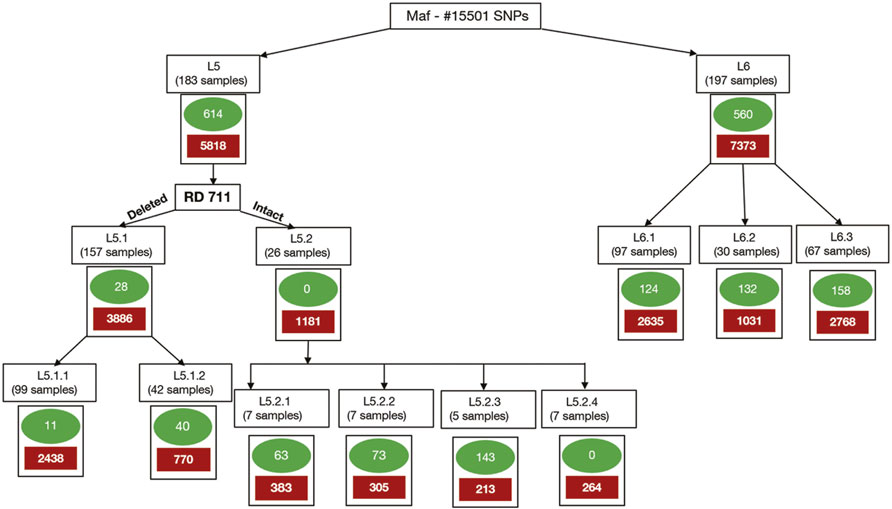
FIGURE 2. Methodology for identification of core-cluster-specific SNPs. Cluster-specific-core SNPs are represented by green ovals, and cluster-specific-total SNPs are represented by solid red boxes.
2.8 Validation of Cluster-Specific Single Nucleotide Polymorphisms
Core-cluster-specific synonymous SNPs were used to validate the (sub)-lineage identity in a validation dataset of 270 samples. Synonymous SNPs were preferred because these are under relatively lower selection pressure (Coll et al., 2014). Synonymous SNPs associated with drug-resistant genes were demarcated and validation was carried out, both including and excluding these SNPs. An additional criterion of occurrence of RD711 was used for validating L5 samples. The SNPs obtained for L6 clusters were also mapped with existing growth attenuation and expression studies (Gehre et al., 2013; Ofori-Anyinam et al., 2017).
3 Results
3.1 Reference Mapping, Filtering and Variant Calling
Of the 572 Maf samples, 497 passed the quality check and 75 needed trimming because of poor quality. Of the 75, 18 were discarded due to insufficient read lengths after trimming. The remaining 554 were used for lineage identification based on RD regions. Of these, 235 samples belonged to L6 lineage, and 173 samples were identified as belonging to L5 lineage. The remaining 34 samples could not be identified based on RD-regions and were termed “unidentified” (Supplementary Table S1). Further removal of samples that did not fit the DP and MQ criteria resulted in a total of 157 (L5), which also harbored the RD711 deletion and 192 (L6) samples and were used for SNP identification. Of the unidentified samples, three were not included in the present study (termed “intermediates”) as they were found to branch independently between L5 and L6 samples in the phylogenetic tree (Supplementary Table S1 and Supplementary Figure S1). All samples, including 31 unidentified, were further subjected to variant calling, which revealed a total of 38,343 variants. Variants were filtered according to the criteria mentioned in the Methods section, which resulted in a total of 15,501 SNPs that were used for downstream analysis.
3.2 Phylogenetic Analysis
Whole-genome phylogeny revealed lineage-wise (L5 and L6) clustering of samples (Supplementary Datasheet S1). In the L6 cluster (in particular L6.3), five unidentified samples lacked RD702 (SRA Accession ID: ERR751293, SRR998600, SRR998602, SRR998741, and SRR998742). Furthermore, three samples were found to branch out independently, serving as intermediaries between the L5 and L6 clusters, and as explained earlier, were excluded for further analysis (Supplementary Figure S1). The rest of the unidentified 26 samples, which lacked the RD711 region, were found to cluster along with the L5 samples. Phylogenetic analyses of L6 samples revealed three independent monophyletic clusters representing L6.1, L6.2, and L6.3 sub-lineages (Figure 3). In addition, a small monophyletic cluster (SRA Accession ID: SRR1162716, SRR998647, and SRR998646) was found at the base of L6.1. In the case of the L5 phylogenetic tree, six major monophyletic clusters were observed. Seven samples (SRA Accession ID: ERR1023216, ERR1082139, ERR751335, ERR751290, ERR702413, ERR751343, and ERR751322) were found to cluster as the outermost branch of the 26 unidentified samples which lacked RD711 deletion (Figure 4).
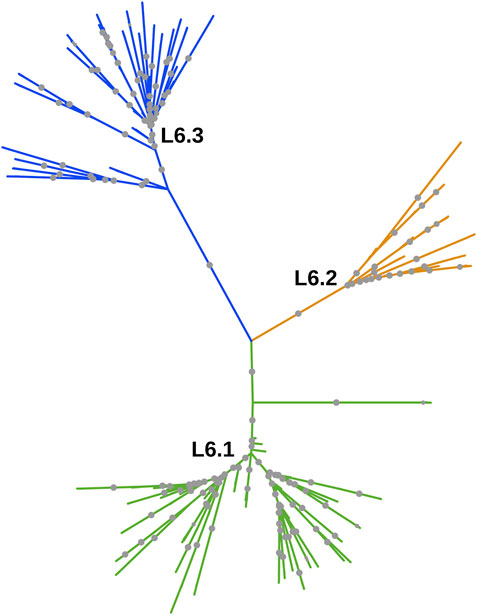
FIGURE 3. Phylogenetic tree of Mycobacterium africanum L6 samples derived using the maximum likelihood method, as implemented in RAxML based on genome-wide SNPs. Significant bootstrap values > 70% are represented by solid gray circles.
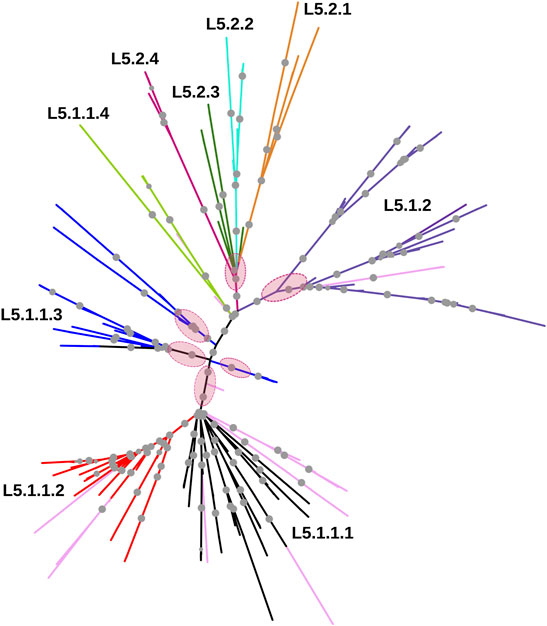
FIGURE 4. Phylogenetic tree of Mycobacterium africanum L5 samples derived using the maximum likelihood method, as implemented in RAxML based on genome-wide SNPs. Pink circles represent the six major monophyletic clusters observed. Samples marked in light pink represent admixed samples as reported by the STRUCTURE tool. Significant bootstrap values >70% are represented by solid gray circles.
3.3 Population Stratification Analysis Using STRUCTURE
A set of 15,390 PI sites belonging to 380 Maf samples (dataset D1) were obtained from the multiple genome alignment (Table 1). Linkage disequilibrium calculated in terms of ISA was found to be 0.15. Population structure analysis revealed an optimal peak at k = 2 which corresponds to L5 and L6 lineages, respectively (Figure 5A, Supplementary Table S3). A set of 7,373 SNPs for L6 (dataset D2) and 5,818 SNPs for L5 (dataset D3), respectively, was used for the identification of PI sites independently (Table 1). Fine-level clustering of L6 lineage (dataset D2 with 7028 PI sites) revealed an optimal peak at k = 3 that corresponds to three independent sub-lineages viz., L6.1 (100 samples), L6.2 (30 samples), and L6.3 (67 samples) (Figure 5B) while three samples were found to be admixed with relatively higher membership to L6.1 and lower membership to L6.2 (Supplementary Table S4). L5 samples did not cluster as per the occurrence of RD711 in the absence of prior population information. Hence, RD711 was used as a marker to demarcate L5 lineage (Comín et al., 2021). This resulted in two groups (Group 1 with RD711: 157 samples and Group 2 without RD711: 26 samples), each of which was then subjected to population stratification analysis. A total of 4,633 and 1,931 SNPs for L5.1 and L5.2, respectively, were used for the identification of PI sites independently (Table 1). Group 1 (157 samples, 4147 PI sites) had an optimal peak at k = 2 and a minor peak at k = 6 (Figure 5C). The membership coefficients at k = 2 revealed that the two clusters correspond to L5.1.1 and L5.1.2 while 16 samples were found to be admixed, of which seven (ERR751315, ERR702407, ERR439931, ERR1023217, ERR1082137, ERR751310, and ERR702409) were found to share major membership to L5.1.1 and nine (ERR1023216, ERR751290, ERR751304, ERR751305, ERR702413, ERR751322, ERR751343, ERR1082139, and ERR751335) were found to share major membership to L5.1.2 (Figure 5C, Supplementary Table S5).
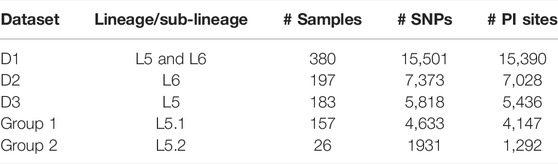
TABLE 1. Details of datasets and their corresponding total number of SNPs and PI sites used for the study.
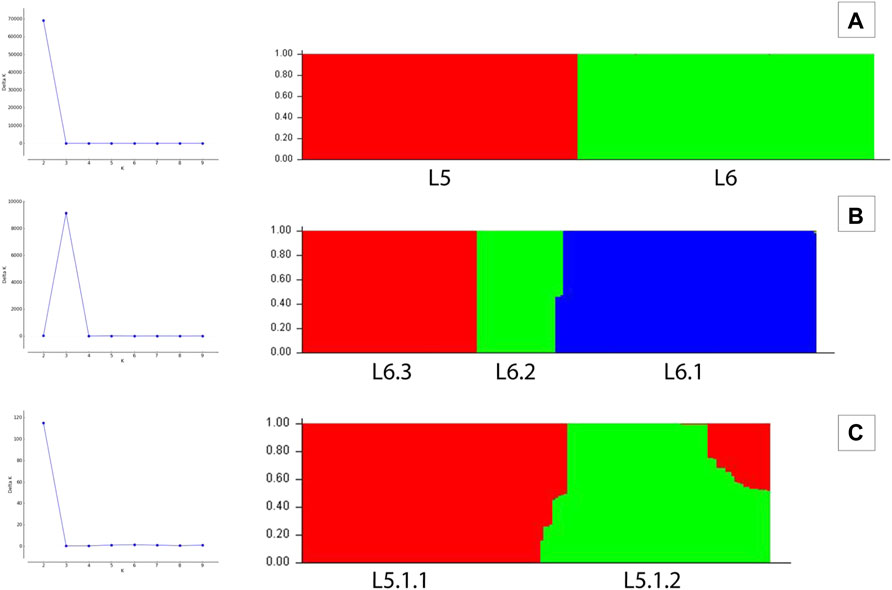
FIGURE 5. (A–C) Population stratification of Mycobacterium africanum based on genome-wide SNPs [(A) population structure of 380 samples of lineages L5 and L6 at k = 2; (B) population structure of 197 samples of lineage L6 at k = 3; (C) population structure of 157 samples of sub-lineage L5.1 at k = 2].
In case of L5.1, the minor peak at k = 6 revealed five clusters based on major membership coefficient values >0.9 with the sixth cluster having membership coefficient ≤0.3 (L5.1.1_minor) (Supplementary Figure S2A, Supplementary Table S6). Of the five clusters, four subdivided L5.1.1 into L5.1.1.1 (#29 samples) with 13 admixed (12 samples having major and minor membership to L5.1.1.1 and L5.1.1_minor cluster, respectively, and one sample having major and minor membership to L5.1.1.1 and L5.1.1.3, respectively), L5.1.1.2 (#36 samples) with three admixed (major and minor membership to L5.1.1.2 and L5.1.1_minor cluster, respectively), L5.1.1.3 (#27 samples) with one admixed (ERR1023216 having major membership to L5.1.1.3 and minor membership to L5.1.2 and L5.1.1.4), and L5.1.1.4 (#5 samples) with one admixed (ERR751290 having major membership coefficient to L5.1.1.4 and minor membership to L5.1.1.3). The six major monophyletic clusters observed in case of the L5 phylogenetic tree corroborated with the five clusters of L5.1 (L5.1.1.1–L5.1.1.4 and L5.1.2) and one cluster of L5.2, of which cluster L5.1.1.4 corresponds to the outermost branch of L5.2 samples (Figure 4). The fifth cluster corresponds to L5.1.2 (#40 samples) with two admixed (ERR439949 and ERR439973 having major and minor membership coefficients to L5.1.2 and L5.1.1.4, respectively) (Supplementary Table S6). Group 2 (26 samples, 1292 PI sites) had an optimal peak at k = 4 which corresponds to L5.2.1–L5.2.4 sub-lineages with one admixed sample (Supplementary Figure S2B, Supplementary Table S7).
3.4 Sub-Lineage Mapping With Previous Studies
The observed L6 sub-lineages agreed with previous study (Coscolla et al., 2021). L5 had been classified into three groups, namely, L5.1, L5.2, and L5.3 by Coscolla et al. (2021) (Supplementary Table S8). The further classification of the L5.1 sub-lineage proposed in this study is in partial agreement with that reported by Coscolla et al. (2021) (Table 2, Supplementary Table S8). L5.2 and L5.3 of Coscolla et al. (2021) correspond to L5.2.1 and L5.2.2 (proposed in this study). It is worth noting that members belonging to L5.2.3 and L5.2.4 (proposed in this study) remained unassigned in earlier studies (Coscolla et al., 2021) (Supplementary Table S9). L5.2 of Ates et al. (2018) also corresponds to L5.2.1 proposed in this study.
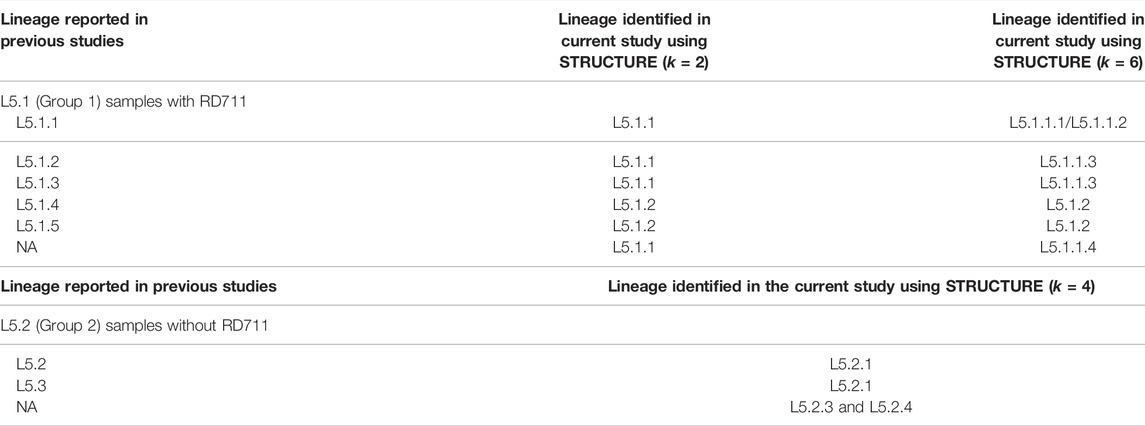
TABLE 2. Comparison of L5 (sub)-lineage mapping with previous studies.
3.5 Population Stratification Analysis Using De Novo Clustering Methods
PCA analysis of dataset D1 (L5 and L6) (Table 1) revealed a total of 38 PCs accounting for 95% of the total variability in the data which was selected for further analysis (Supplementary Figure S3). The first PC (∼80% variance) differentiated D1 into L5 and L6 lineages (Figure 6A). This agrees with the optimal value of k = 2 obtained using K-means clustering optimization methods (Supplementary Table S10A–C). Further PCA analysis of dataset D2 (L6) revealed three distinct sub-clusters, namely, L6.1, L6.2, and L6.3 (Figure 6B), that find agreement with K-means (Supplementary Figure S4, Supplementary Table S11A–C). PCA and K-means clustering approaches of the dataset D3 (L5) remained inconclusive. Hence, clustering of L5 samples using prior knowledge of the occurrence of RD711 was carried out (Comín et al., 2021). Group 1 consisting of 157 L5 samples with the presence of RD711 marker, revealed two major clusters differentiated on PC1 (∼24% variance) (Figure 6C). Taking into account the variation along PC2 (∼8% variance) six sub-clusters were obtained which partially supported the minor peak (k = 6) obtained using STRUCTURE (Figure 6C, Supplementary Figure S5). Of the six sub-clusters, five corroborated with earlier reports (Coscolla et al., 2021), with an additional sub-cluster, namely L5.1.1.4, reported exclusively in this study (Figure 6C, Supplementary Tables S6, S8). Group 2 consisting of 26 L5 samples with the absence of RD711 marker, revealed the presence of four distinct clusters across PC1 (∼24% variance) and PC2 (∼22% variance) (Figure 6D, Supplementary Figure S6, Supplementary Tables S7, S9). However, K-means clustering could not resolve the L5 sub-lineages based on RD711.
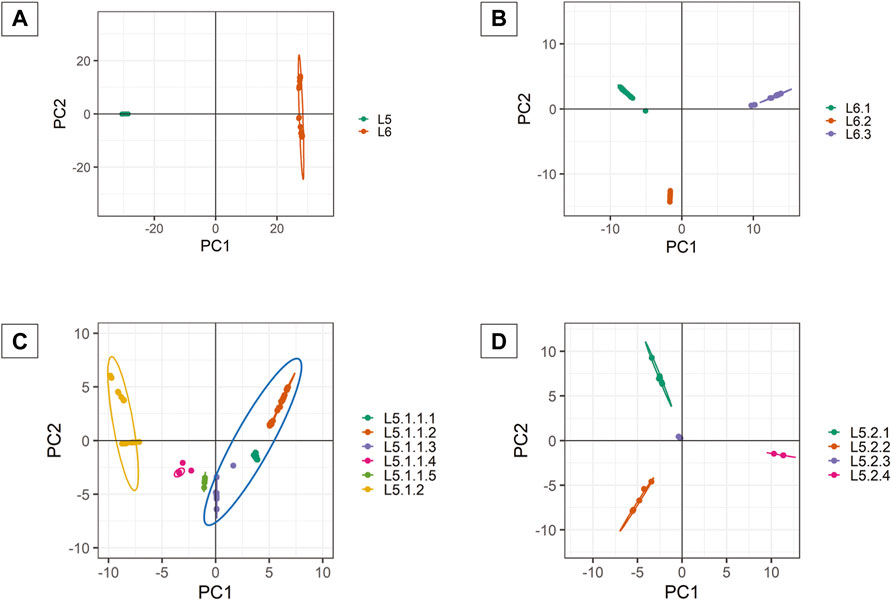
FIGURE 6. (A–D) PCA plots of Mycobacterium africanum derived using genome-wide SNPs [(A) PCA distribution of 380 samples belonging to lineages L5 and L6; (B) PCA distribution of 197 samples belonging to lineage L6; (C) PCA distribution of 157 samples belonging to sub-lineage L5.1; (D) PCA distribution of 26 samples belonging to sub-lineage L5.2].
3.6 Population Stratification Analysis Using Discriminant Analysis of Principal Components
DAPC clustering for all the datasets (D1, D2, and D3) (Table 1) was performed on a priori clustering information obtained from phylogeny, STRUCTURE, and PCA. Therefore, k = 2 was chosen for DAPC analysis of dataset D1. Along PC1, the Maf samples are differentiated into two clusters. Intra-population differentiation for L6 was observed along the PC2 axis (Figure 6A). Based on xval cross-validation, 5 PCs (88.7% of the total variance) and one discriminant eigenvalue were found to explain the two distinct clusters obtained, viz., L5 and L6 (Supplementary Figures S3, S7, S8). The lineage-wise clusters obtained were further used for fine-grain clustering to extract the sub-lineages present, if any.
DAPC clustering of the dataset D2 (L6) was carried out at k = 3 using 54 PCs (∼95% variance), and the resulting clusters are in agreement with that obtained from other approaches (Figure 6B, Supplementary Figure S9). Cross-validation determined 10 PCs (∼69.44% variance) to be optimal along with two discriminant eigenvalues that explain three distinct sub-clusters of L6, namely L6.1, L6.2, and L6.3 (Supplementary Figures S9, S10).
Group 1 and 2 of L5 samples, viz., L5.1 (with RD711) and L5.2 (without RD711), were subjected to DAPC clustering independently using k = 2 and k = 4, respectively. A total of 55 PCs (∼95% variance) were used for clustering L5.1, whereas 12 PCs (95% of the variance) were used for Group 2 (Figure 6C, Supplementary Figure S5). Cross-validation indicated 50 PCs (∼94% variance) and 4 PCs (64.94% of the total variance) to be optimal for Group1 and Group2, respectively (Supplementary Figures S11, S12). DAPC analysis using 50 PCs and one discriminant eigenvalue was found to explain two distinct sub-clusters obtained for Group1, namely L5.1.1 and L5.1.2 (Supplementary Figure S13). Similarly, four optimal PCs and two discriminant eigenvalues explained four distinct sub-clusters for Group2, namely L5.2.1, L5.2.2, L5.2.3, and L5.2.4 (Supplementary Figure S14).
3.7 Estimation of Maf Genetic Diversity
The highest genetic differentiation was observed between L5 and L6 lineages (Fst = 0.89). The population differentiation index for the three L6 sub-lineages varied from 0.59–0.65 (Supplementary Table S12). Fst between L5.1.1 and L5.1.2 was 0.46, whereas, for the four L5.2 sub-clusters it was found ranging from 0.39–0.74. In the case of five L5.1 sub-clusters Fst from 0.3–0.64 (Supplementary Table S12).
The whole-genome average pairwise nucleotide diversity (π) within the L6 samples was found to be 0.06, whereas the same within L5 samples was found to be 0.05, which supports the fact that L6 is more genetically diverse than L5. Furthermore, π was reported to vary between 0.076–0.18 for the L6 sub-clusters (Supplementary Table S13). π within the L5.1 and L5.2 clusters were found to be 0.06 and 0.04, respectively. Within cluster variation between L5.1 and L5.2 sub-clusters were also studied, which revealed the highest nucleotide diversity of 0.48 for the L5.2.4 sub-cluster. Based on the sub-optimal peak for L5.1 (k = 6) obtained in STRUCTURE, π was calculated for each of the sub-clusters. With the removal of two admixed samples from L5.1.2, the π reduced from 0.23 to 0.13 (Supplementary Table S13).
3.8 Identification of Core-Cluster-Specific Single Nucleotide Polymorphisms
Total-cluster-specific SNPs identified in L5 are 5,818 which belong to 2,553 genes. Similarly, for L6, 7,373 SNPs belonging to 2,835 genes were identified (Table 1). Genes involved in drug resistance are also part of this set. Drug-resistant TB is a major challenge, and hence genes involved in drug resistance in Maf “total-cluster-specific-SNPs” were annotated even though drug resistance is rare in Maf as compared to M.tuberculosis (Asante-Poku et al., 2015; Acquah et al., 2021). A total of 24 genes involved in drug resistance that contain 79 SNPs were found to be part of L6-“total-cluster-specific” SNPs (Supplementary Table S14). Similarly, in case of L5, 20 drug-resistant genes containing 69 SNPs were found to be part of L5- “total-cluster-specific” SNPs (Supplementary Table S15).
3.8.1 L6-Specific Single Nucleotide Polymorphisms
A total of 602 L6-specific SNPs were identified, of which 331 are missense and seven are stop-gained while the rest are synonymous and upstream SNPs (Figure 2; Table 3, Supplementary Table S14). Population stratification analysis of L6 samples revealed three sub-lineages L6.1, L6.2, and L6.3 for which sub-cluster specific SNPs 123, 132, and 158 were identified (Table 3, Supplementary Table S14). The identified sub-cluster specific SNPs (obtained in our study) mapped onto Maf samples of respective sub-lineage as detailed by Coscolla et al. (2021). Coscolla et al. (2021) also reported a set of sub-lineage specific SNPs, which remained unmapped with the “core-cluster-specific” SNPs obtained in our study (Supplementary Figure S15) but mapped with the “total-cluster-specific” SNPs for the L6 dataset. This highlights the fact that the sub-lineage specific SNPs of Coscolla et al., 2021 do not satisfy the criteria of being present across all samples. The synonymous SNPs identified in our study were used for the validation of sub-lineage specificity (Supplementary Table S14).
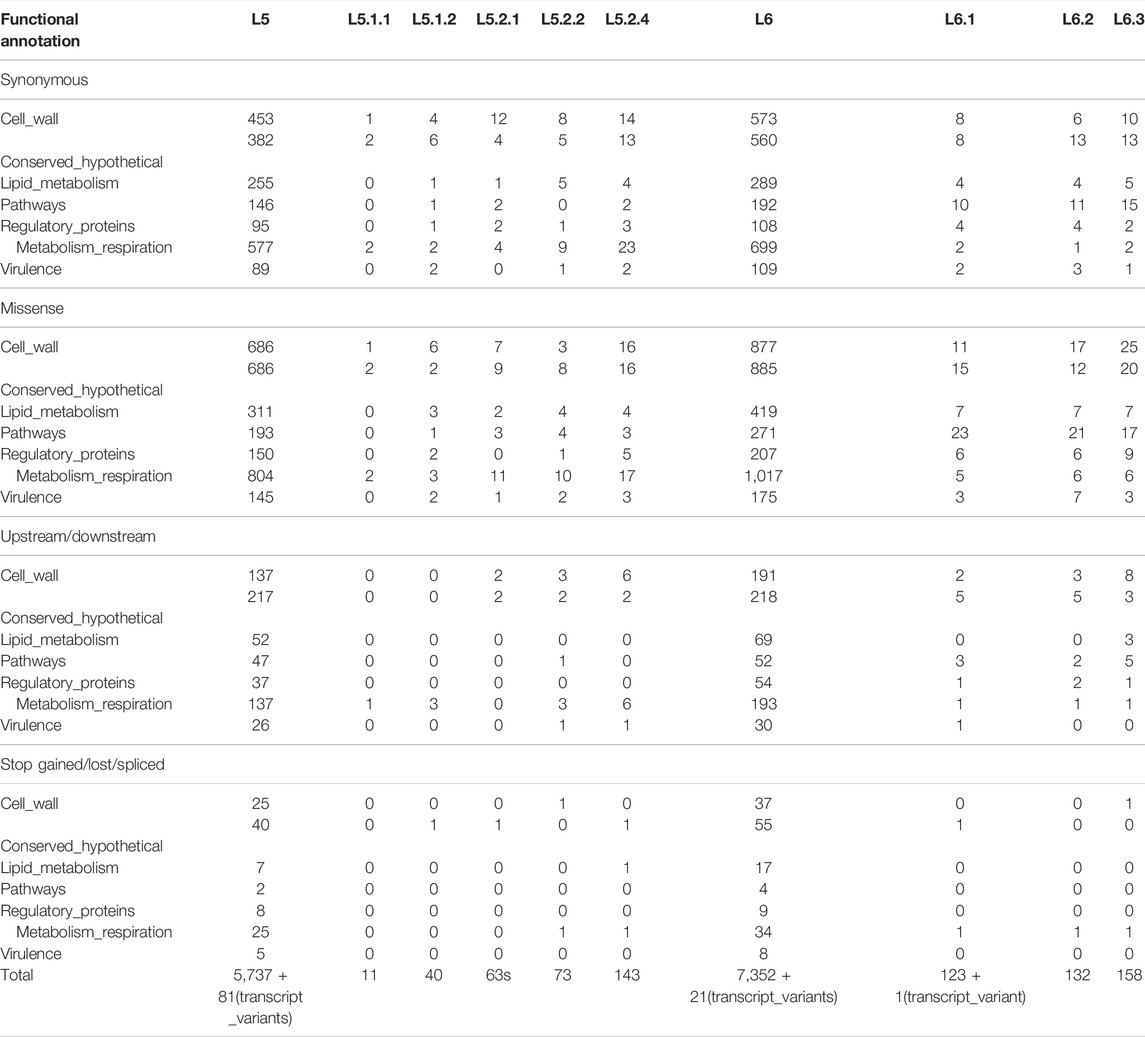
TABLE 3. Summary of L5 and L6 (sub)cluster-specific-core SNPs.
Functional mapping of “core-cluster-specific” missense SNPs of L6 and its sub-lineages was carried out to understand its role in growth attenuation and adaptation to hypoxia (Gehre et al., 2013; Ofori-Anyinam et al., 2017; Ofori-Anyinam et al., 2020) (Table 4, Supplementary Table S16). It is interesting to note that all genes harboring the missense mutations were found to have lower expression in L6, which aid growth in microaerophilic environments (Ofori-Anyinam et al., 2017).
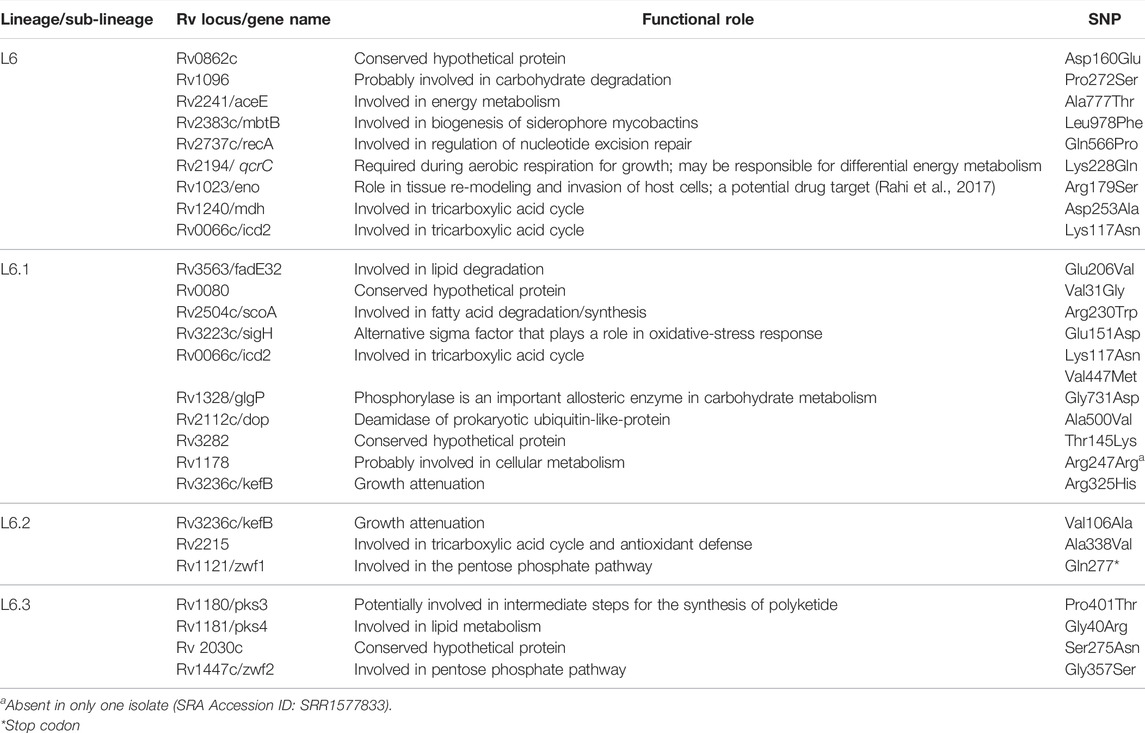
TABLE 4. Functional mapping of core-cluster-specific missense SNPs of L6 with literature support (Gehre et al., 2013; Ofori-Anyinam et al., 2017; Ofori-Anyinam et al., 2020) functional role obtained from Mycobrowser (url: https://mycobrowser.epfl.ch/).
3.8.2 L5-Specific Single Nucleotide Polymorphisms
A total of 648 SNPs were found to be unique to the L5 cluster. Of these, 331, 7, 191, and 7 were found to be missense, stop-gained, synonymous, and upstream SNPs, respectively. A total of 11 core-cluster-specific SNPs were identified for the L5.1 sub-cluster; however, none were found for the L5.2 sub-cluster (Figure 2; Table 2, Supplementary Table S15).
It should be noted that 57 and 68 L5.2-specific SNPs reported by Coscolla et al. (2021) and Ates et al. (2018), respectively, are in agreement with our findings of L5.2.1 core-cluster-specific-SNPs (#63), except 9 SNPs belonging to PE-PPE/repeat region of Ates et al. (2018). Additional six SNPs, identified in the current study, viz., Ala126Ala (Rv1558), Trp687* (Rv 2082), Ala120Val (Rv2205c), upstream SNP −4,469 (Rv3424c), Gly236Asp (Rv3710), and Gly81Gly (Rv3792) are also found to be present across all L5.2 samples (as per nomenclature given by Coscolla et al. (2021) and isolates characterized in their study) (Supplementary Figure S16, Supplementary Table S15).
Similarly, previously identified L5.3-specific SNPs [#62 as reported by Coscolla et al. (2021)] are also in agreement with our findings of core-L5.2.2-specific SNPs (#73) with an exception of Ala189Glu (Rv0180c). Additional 12 SNPs [Tyr126* (Rv0217c), Val174Leu (Rv0809), Ala69Glu (Rv0848), Phe249Phe (Rv0930), Arg302Arg (Rv1188), and Cys34Phe (Rv1317c), upstream SNP -3721 (Rv1749c), Asn372Ser (Rv2874), Gly18Asp (Rv3251c), Asn234Asn (Rv3534c), Ser84Gly (Rv3608c), and Ile150Thr (Rv3842c)] were reported in our study which were found to be absent in L5.3 (#19 of the total 25 L5.3 isolates reported by Coscolla et al. (2021)) (Supplementary Figure S16, Supplementary Table S15). It is worth noting that no unique SNPs were found to be present in the L5.2.4 cluster.
The synonymous SNPs for L5 (sub)lineages were used for the validation of sub-lineage specificity (Supplementary Table S15). Earlier reported L5 (#12 SNPs) and L6 (#10 SNPs) specific synonymous biomarker SNPs were found to be in complete agreement with our study (Napier et al., 2020). The Maf (sub)lineage-specific SNPs reported in the current study were found to be exclusive and did not show any match with the previously reported MTBC-lineage specific SNPs listed by Napier et al. (2020).
Functional mapping of L5-“core-cluster-specific” missense SNPs was carried out to understand genotype-phenotype correlation (Ofori-Anyinam et al., 2020) (Table 5, Supplementary Table S15).
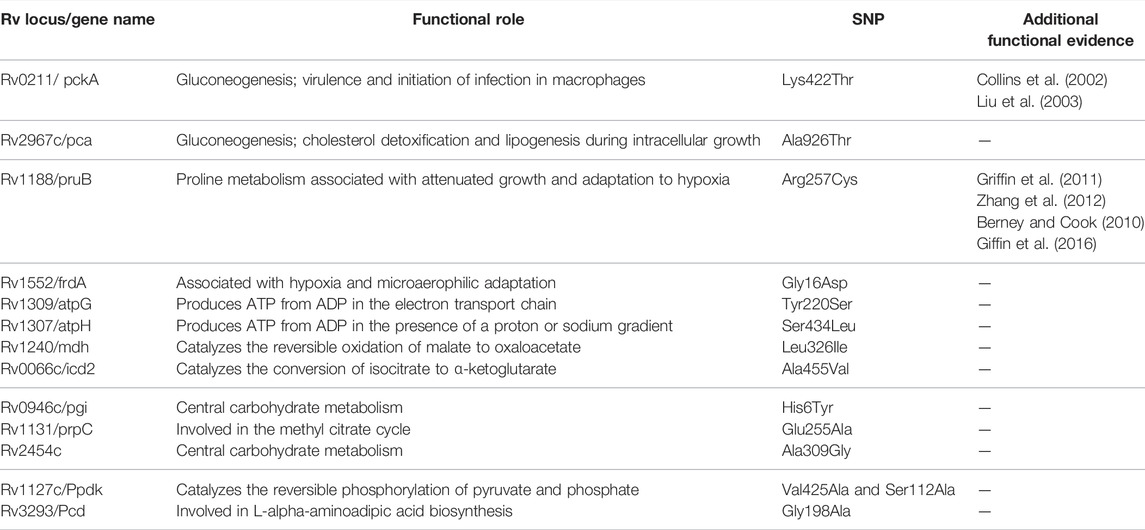
TABLE 5. Functional mapping of core-cluster-specific missense SNPs of L5 with literature support (Ofori-Anyinam et al., 2020), and functional role obtained from MycoBrowser (url: https://mycobrowser.epfl.ch/).
3.8.3 Validation of Cluster-Specific Single Nucleotide Polymorphisms
Variant calling was performed for the validation dataset of 270 samples and filtered using MQ and DP. Every sample in the validation dataset was then classified based on the presence of “sub-cluster specific synonymous SNP set” which helped in lineage/sub-lineage assignment. Validation was carried out by both including and excluding the SNPs associated with genes involved in drug resistance and the results were found to be consistent. Of the 270 samples in the validation dataset, 85 and 185 were identified as L5 and L6, respectively. Of the 85 L5 samples, 68 and 13 were identified as L5.1.1 and L5.1.2, respectively. These samples were also found to harbor the RD711 deletion as re-verified through RD-based studies. Of the remaining four samples, one and three were classified as L5.2.1 and L5.2.2, respectively. All the L5.2 samples lacked RD711 deletion, as confirmed by RD-based studies. Of the 185 L6 samples, 131, 20, and 34 were identified as L6.1, L6.2, and L6.3, respectively (Supplementary Table S2).
4 Discussion and Conclusion
The human-adapted MTBC exhibits a phylogeographical evolutionary pattern, amongst which Maf samples display strong geographic association with the West-African inhabitants (Isea-Peña et al., 2012; Comín et al., 2021; Coscolla et al., 2021). Lineage identification is of considerable significance in tuberculosis control, as it helps in quick diagnosis leading to effective treatment and prevention of potential future outbreaks (Dou et al., 2017; Napier et al., 2020). Although extensive studies pertaining to the differentiation of L5 and L6 have been carried out in the past, recent reports revealed the existence of underlying sub-lineages (Ates et al., 2018; Coscolla et al., 2021; Sanoussi et al., 2021). Methods such as phylogeny and PCA have been used to understand the lineage distribution of L5 and L6, with reports of incongruous clustering of L5 (Coscolla et al., 2021). Recent studies have also suggested clustering of L5 using “RD711” and other large sequence polymorphisms (Comín et al., 2021; Coscolla et al., 2021, Sanoussi et al., 2021). Taking these observations into cognizance, an attempt was made to understand the fine-level population stratification of Maf, especially L5 and its sub-lineages using SNPs with the aid of model- and non-model-based clustering approaches.
Lineage-wise clustering was observed in the whole-genome phylogenetic tree with the three samples branching independently serving as ‘distinct intermediates’ between L5 and L6 clusters (Supplementary Figure S1). Owing to insufficient data for intermediate branches, these samples were excluded from further population genomics analysis. Model-based approaches such as STRUCTURE can be used when linkage disequilibrium is negligible in the data. In Maf samples, we found low linkage disequilibrium, which agrees with that reported for other MTBC isolates (Supply et al., 2003). Population stratification of Maf indicated two major clusters, corresponding to L5 and L6. Lineage L6 is known to be geographically restricted to West Africa, whereas L5 is known to move from West Africa to Central Africa (Coscolla et al., 2021). L6 samples clustered into three distinct sub-clusters in the phylogenetic tree, which hints at a well-differentiated genetic structure, as is also observed in earlier studies (Otchere et al., 2018; Coscolla et al., 2021). These three sub-clusters were found to be independently homogeneous populations with high Fst and moderate genetic diversity (within members of each sub-cluster), wherein only three samples were found to be admixed (Supplementary Tables S12, S13).
In case of L5, the clusters were not clearly resolved in the phylogenetic tree, as is evident from smaller branch lengths suggesting lower genetic differentiation. Based on the RD711 marker, L5 samples were distributed into two groups viz., L5.1 and L5.2. The observed Fst between L5.1 and L5.2 was found to be lower than L6 sub-clusters (Supplementary Table S12). Relatively lower nucleotide diversity was observed in L5.1 sub-clusters when compared with that of L5.2 sub-clusters, which may be attributed to the fact that fewer samples were available for L5.2. It should be mentioned that genome-wide Fst is dependent on the number of samples studied.
The use of stringent criteria for membership assignment using STRUCTURE helped to identify admixed samples for delineation of clusters with high confidence. PCA and DAPC further support these observations wherein with reduced data dimensions, the Maf clustering remained the same as observed in STRUCTURE and phylogeny analysis. The clusters thus identified were used to derive “total/core-cluster-specific-SNPs” by filtering admixed samples. SNPs belonging to genes involved in drug resistance accounted for ∼1% of the total SNP set in both lineages. They were retained as the prevalence of drug resistance in Maf is very rare (Asante-Poku et al., 2015; Acquah et al., 2021). The “core-sub-cluster-specific” SNPs were derived by taking into account the “total-cluster-specific-SNPs”. This strategy ensured the identification of exclusive SNPs for each (sub)-cluster (Figure 2). Furthermore, the lineage-specific (L5 and L6) synonymous SNPs identified in our study were found to be in complete agreement with the specific biomarker SNPs reported in earlier studies (Napier et al., 2020). The occurrence of different “core-cluster-specific” SNPs in the same gene across different (sub)lineages hints at the association of these SNPs towards selective advantage or (host)-adaptation (Ofori-Anyinam et al., 2020). Few missense SNPs that are part of “core-cluster-specific” SNP data for L5 and L6 (sub)lineages (obtained in our study) corroborate with the deleterious mutations observed in genes part of central carbon metabolism and electron transport chain. This provides clues to the existing metabolic differences in Maf (Ofori-Anyinam et al., 2020). These missense SNPs hint towards the slow growth in L5 which may be due to their possible role in impairing energy metabolism and its related pathways. For instance, both pca and mdh genes carry missense mutations in L5, the production of oxaloacetate may hence get affected. It is interesting to note that “core-cluster-specific” SNPs belonging to genes part of the pentose phosphate pathway were found only in L6 and its sub-lineages. Hence, the proposed “core-cluster-specific” non-synonymous SNPs have the potential to be studied further to understand their specific roles in fitness, adaptation to specific ecological niches and growth.
The synonymous “core-cluster-specific-SNPs” were used for lineage assignment in the validation dataset, which revealed consistent performance both by including and excluding SNPs belonging to drug resistance–associated genes (Table 3, Supplementary Tables S14, S15). This observation supports the reports of sporadic occurrence of drug resistance in Maf (Acquah et al., 2021; Asante-Poku et al., 2015). The synonymous “core-cluster-specific-SNPs” were able to delineate previously unassigned 154 Maf samples (Supplementary Tables S1, S2). The absence of core-SNPs in the L5.2.3 sub-cluster may be due to higher π along with absence of monophyletic clustering. A total of seven samples belonging to L5.2.1 were recognized as previously identified sub-lineage L5.2 (Ates et al., 2018; Coscolla et al., 2021). However, two samples (SRA Acc ID: ERR2383622 and ERR2383618), previously described as NRC1 and 69, respectively (Ates et al., 2018), were found to group distinctly into a new sub-cluster, L5.2.2, in our study. Few Maf samples clustering with L5.2.3 and L5.2.4 in our study remained unassigned previously (Coscolla et al., 2021). Hence, this extensive analysis using different model-based and de novo methods aided to understand the population stratification within the L5 lineage. These (sub)lineage-specific SNPs can not only serve as biomarkers for rapid identification along with the previous barcodes developed for MTBC (Napier et al., 2020) but also enable further delineation of Maf (L5 and L6) sub-lineages. The “core-cluster-specific-SNPs,” when accompanied with appropriate functional experiments, promise to enhance our understanding of genotype–phenotype association.
This study provides an overview of the underlying genetic diversity of the Maf samples with additional emphasis on L5 sub-lineages. The methodology described has the potential to be extended to studies involving all MTBC lineages. Improved genetic diversity delineation of Maf is possible with the availability of additional Maf whole-genome samples and use of a suitable pan-genome or more closely related Maf genome as reference (instead of M. tuberculosis H37Rv). In conclusion, the identified cluster-specific SNPs can serve as markers and help in comprehending the “specialist” characteristics apart from understanding the evolutionary trajectory of MTBC.
5 Standard Biosecurity and Institutional Safety Procedures
The study only involves bioinformatics analysis of publicly available M. africanum samples, and hence standard biosafety and institutional safety procedures are not in the scope of the article.
Data Availability Statement
The original contributions presented in the study are included in the article/Supplementary Material, further inquiries can be directed to the corresponding author.
Author Contributions
MB, RB, SK, and AA performed the analysis and interpreted the results. MB, RB, and SK prepared the figures and tables. RB and SK wrote the manuscript. RB and RJ conceived and designed the experiments. MB, RB, SK, AA, and RJ read and reviewed the manuscript.
Funding
This research work is funded by the National Supercomputing Mission (NSM) of the Government of India.
Conflict of Interest
The authors declare that the research was conducted in the absence of any commercial or financial relationships that could be construed as a potential conflict of interest.
Publisher’s Note
All claims expressed in this article are solely those of the authors and do not necessarily represent those of their affiliated organizations, or those of the publisher, the editors, and the reviewers. Any product that may be evaluated in this article, or claim that may be made by its manufacturer, is not guaranteed or endorsed by the publisher.
Acknowledgments
The authors thank the BRAF facility of C-DAC for HPC infrastructure. The authors would also like to thank Dr. Janaki C. H. for her scientific review and critical comments.
Supplementary Material
The Supplementary Material for this article can be found online at: https://www.frontiersin.org/articles/10.3389/fgene.2022.800083/full#supplementary-material
Supplementary DataSheet S1 | Phylogenetic tree of Mycobacterium africanum (D1 dataset).
Supplementary Figure S1 | Phylogenetic tree of 383 Mycobacterium africanum samples.
Supplementary Figure S2 | Population stratification of L5.1.1 & L5.2.
Supplementary Figure S3 | Cumulative PCA plot of Mycobacterium africanum (D1 dataset).
Supplementary Figure S4 | Cumulative PCA plot of Mycobacterium africanum L6 (D2 dataset).
Supplementary Figure S5 | Cumulative PCA plot of Mycobacterium africanum L5.1 (Group1 dataset).
Supplementary Figure S6 | Cumulative PCA plot of Mycobacterium africanum L5.2 (Group 2 dataset).
Supplementary Figure S7 | DAPC scatter plot of Mycobacterium africanum (D1 dataset).
Supplementary Figure S8 | Crossvalidation plot of Mycobacterium africanum (D1 dataset) using xval DAPC.
Supplementary Figure S9 | DAPC scatter plot of Mycobacterium africanum L6 (D2 dataset).
Supplementary Figure S10 | Crossvalidation plot of Mycobacterium africanum L6 (D2 dataset) using xval DAPC.
Supplementary Figure S11 | Crossvalidation plot of Mycoacterium africanum L5.1 (Group 1 dataset) using xval DAPC.
Supplementary Figure S12 | Crossvalidation plot of Mycobacterium africanum L5.2 (Group 2 dataset) using xval DAPC.
Supplementary Figure S13 | DAPC scatter plot of Mycobacterium africanum L5.1 (Group 1 dataset).
Supplementary Figure S14 | DAPC scatter plot of Mycobacterium africanum L5.2 (Group 2 dataset).
Supplementary Figure S15 | Comparison of L6-core-cluster-specific SNPs with the existing literature.
Supplementary Figure S16 | Comparison of L5-core-cluster-specific SNPs with the existing literature.
Supplementary Table S1 | Lineage information and SRA accession details of Mycobacterium africanum samples used for understanding genetic diversity.
Supplementary Table S2 | Mapping of lineage for Mycobacterium africanum samples used for validation of identified core-cluster-specific-SNPs.
Supplementary Table S3 | Population stratification of L5 and L6 samples of M. africanum at k = 2.
Supplementary Table S4 | Population stratification of L6 samples of M. africanum at k = 3.
Supplementary Figure S5 | Population stratification of L5.1 samples of M. africanum at k = 2.
Supplementary Figure S6 | Population stratification of L5.1 samples of M. africanum at k = 6.
Supplementary Figure S7 | Population stratification of L5.2 samples of M. africanum at k = 4.
Supplementary Table S8 | Comparison of lineage assignment for L5 (Group 1) samples with existing literature.
Supplementary Table S9 | Comparison of lineage assignment for L5 (Group 2) samples with existing literature.
Supplementary Table S10 | A‐C: Population stratification of Mycobacterium africanum (D1 dataset) using de novo clustering.
Supplementary Table S11 | A‐C: Population stratification of Mycobacterium africanum L6 (D2 dataset) using de novo clustering.
Supplementary Table S12 | Fst values of Mycobacterium africanum L6 and L5 sub-clusters.
Supplementary Table S13 | Pi values of L5 and l6 (sub)clusters (obtained using STRUCTURE tool).
Supplementary Table S14 | Detailed list of L6-cluster-specific SNPs.
Supplementary Table S15 | Detailed list of L5-cluster-specific SNPs.
Supplementary Table S16 | Mapping of L6-core-cluster-specific SNPs with growth attenuation studies.
Abbreviations
DAPC, discriminant analysis of principal components; Fst, fixation index; L5, Mycobacterium tuberculosis var. africanum lineage 5; L6, Mycobacterium tuberculosis var. africanum lineage 6; Maf, Mycobacterium tuberculosis var. africanum; MIRU-VNTR, mycobacterial interspersed repetitive units-variable number of tandem repeats (MIRU-VNTR) spoligotyping; MTBC, Mycobacterium tuberculosis complex; PCA, principal component analysis; PCR, polymerase chain reaction; RDs, regions of difference; RFLP, restriction fragment length polymorphism; SNP, single nucleotide polymorphism; SRA, Sequence Read Archive; TB, tuberculosis; WHO, World Health Organization.
References
Acquah, S., Asare, P., Osei-Wusu, S., Morgan, P., Afum, T., and Asandem, T. (2021). Molecular Epidemiology and Drug Susceptibility Profiles of Mycobacterium Tuberculosis Complex Isolates From Northern Ghana. Int. J. Infect. Dis. 109, 294–303. doi:10.1016/j.ijid.2021.07.020
Andrews, S. FastQC: a Quality Control Tool for High Throughput Sequence Data (2010). Available at: http://www.bioinformatics.babraham.ac.uk/projects/fastqc. [Accessed: Jan 31, 2020]
Asante-Poku, A., Otchere, I. D., Danso, E., Mensah, D. D., Bonsu, F., Gagneux, S., et al. (2015). Evaluation of GenoType MTBDRplus for the Rapid Detection of Drug-Resistant Tuberculosis in Ghana. Int. J Tuberc. Lung Dis. 19 (8), 954–959. doi:10.5588/ijtld.14.0864
Asante-Poku, A., Otchere, I. D., Osei-Wusu, S., Sarpong, E., Baddoo, A., Forson, A., et al. (2016). Molecular Epidemiology of Mycobacterium Africanum in Ghana. BMC Infect. Dis. 16, 385. doi:10.1186/s12879-016-1725-6
Ates, L. S., Dippenaar, A., Sayes, F., Pawlik, A., Bouchier, C., Ma, L., et al. (2018). Unexpected Genomic and Phenotypic Diversity of Mycobacterium Africanum Lineage 5 Affects Drug Resistance, Protein Secretion, and Immunogenicity. Genome Biol. Evol. 10 (8), 1858–1874. doi:10.1093/gbe/evy145
Babraham Bioinformatics., Trim Galore: a Wrapper Tool Around Cutadapt and FastQC to Consistently Apply Quality and Adapter Trimming to FastQ Files, with Some Extra Functionality for MspI-Digested RRBS-type (Reduced Representation Bisufite-Seq) Libraries (2019). Available at: https://www.bioinformatics.babraham.ac.uk/projects/trim_galore/ [Accessed: March 7, 2020].
Baya, B., Diarra, B., Diabate, S., Kone, B., Goita, D., Sarro, Y. d. S., et al. (2020). Association of Mycobacterium Africanum Infection with Slower Disease Progression Compared with Mycobacterium Tuberculosis in Malian Patients with Tuberculosis. Am. J. Trop. Med. Hyg. 102 (1), 36–41. doi:10.4269/ajtmh.19-0264
Berney, M., and Cook, G. M. (2010). Unique Flexibility in Energy Metabolism Allows Mycobacteria to Combat Starvation and Hypoxia. PloS one 5 (1), e8614. doi:10.1371/journal.pone.0008614
Besnier, F., and Glover, K. A. (2013). ParallelStructure: a R Package to Distribute Parallel Runs of the Population Genetics Program STRUCTURE on Multi-Core Computers. PloS one 8 (7), e70651. doi:10.1371/journal.pone.0070651
Blouin, Y., Hauck, Y., Soler, C., Fabre, M., Vong, R., Dehan, C., et al. (2012). Significance of the Identification in the Horn of Africa of an Exceptionally Deep Branching Mycobacterium tuberculosis Clade. PloS one 7 (12), e52841. doi:10.1371/journal.pone.0052841
Brites, D., and Gagneux, S. (2015). Co‐evolution of M Ycobacterium Tuberculosis and H Omo Sapiens. Immunol. Rev. 264 (1), 6–24. doi:10.1111/imr.12264
Brosch, R., Gordon, S. V., Marmiesse, M., Brodin, P., Buchrieser, C., Eiglmeier, K., et al. (2002). A New Evolutionary Scenario for the Mycobacterium tuberculosis Complex. Proc. Natl. Acad. Sci. U.S.A. 99 (6), 3684–3689. doi:10.1073/pnas.052548299
Cá, B., Fonseca, K. L., Sousa, J., Maceiras, A. R., Machado, D., Sanca, L., et al. (2019). Experimental Evidence for Limited In Vivo Virulence of Mycobacterium Africanum. Front. Microbiol. 10, 2102. doi:10.3389/fmicb.2019.02102
Castillo, A. I., Chacón-Díaz, C., Rodríguez-Murillo, N., Coletta-Filho, H. D., and Almeida, R. P. P. (2020). Impacts of Local Population History and Ecology on the Evolution of a Globally Dispersed Pathogen. BMC genomics 21 (1), 369. doi:10.1186/s12864-020-06778-6
Chatterjee, D., and Pramanik, A. K. (2015). Tuberculosis in the African Continent: A Comprehensive Review. Pathophysiology 22 (1), 73–83. doi:10.1016/j.pathophys.2014.12.005
Cingolani, P., Platts, A., Wang, L. L., Coon, M., Nguyen, T., Wang, L., et al. (2012). A Program for Annotating and Predicting the Effects of Single Nucleotide Polymorphisms, SnpEff. Fly 6 (2), 80–92. doi:10.4161/fly.19695
Cole, S. T., Brosch, R., Parkhill, J., Garnier, T., Churcher, C., Harris, D., et al. (1998). Deciphering the Biology of Mycobacterium tuberculosis from the Complete Genome Sequence. Nature 393 (6685), 537–544. doi:10.1038/31159
Coll, F., McNerney, R., Guerra-Assunção, J. A., Glynn, J. R., Perdigão, J., Viveiros, M., et al. (2014). A Robust SNP Barcode for Typing Mycobacterium tuberculosis Complex Strains. Nat. Commun. 5, 4812. doi:10.1038/ncomms5812
Collins, D. M., Wilson, T., Campbell, S., Buddle, B. M., Wards, B. J., Hotter, G., et al. (2002). Production of Avirulent Mutants of Mycobacterium Bovis with Vaccine Properties by the Use of Illegitimate Recombination and Screening of Stationary-phase Cultures. Microbiology (Reading, England) 148 (Pt 10), 3019–3027. doi:10.1099/00221287-148-10-3019
Comas, I., Coscolla, M., Luo, T., Borrell, S., Holt, K. E., Kato-Maeda, M., et al. (2013). Out-of-Africa Migration and Neolithic Coexpansion of Mycobacterium tuberculosis with Modern Humans. Nat. Genet. 45 (10), 1176–1182. doi:10.1038/ng.2744
Comín, J., Monforte, M. L., Monforte, M. L., Samper, S., and Otal, I.Aragonese Working Group on Molecular Epidemiology of Tuberculosis (EPIMOLA) (2021). Analysis of Mycobacterium Africanum in the Last 17 Years in Aragon Identifies a Specific Location of IS6110 in Lineage 6. Sci. Rep. 11 (1), 10359. doi:10.1038/s41598-021-89511-x
Coscolla, M., and Gagneux, S. (2014). Consequences of Genomic Diversity in Mycobacterium tuberculosis. Semin. Immunol. 26 (6), 431–444. doi:10.1016/j.smim.2014.09.012
Coscolla, M., Gagneux, S., Menardo, F., Loiseau, C., Ruiz-Rodriguez, P., Borrell, S., et al. (2021). Phylogenomics of Mycobacterium Africanum Reveals a New Lineage and a Complex Evolutionary History. Microb. genomics 7 (2), 000477. doi:10.1099/mgen.0.000477
de Jong, B. C., Adetifa, I., Walther, B., Hill, P. C., Antonio, M., Ota, M., et al. (2010a). Differences between Tuberculosis Cases Infected withMycobacterium Africanum, West African Type 2, Relative to Euro-AmericanMycobacterium Tuberculosis: an Update. FEMS Immunol. Med. Microbiol. 58 (1), 102–105. doi:10.1111/j.1574-695X.2009.00628.x
de Jong, B. C., Antonio, M., and Gagneux, S. (2010b). Mycobacterium Africanum-Review of an Important Cause of Human Tuberculosis in West Africa. Plos Negl. Trop. Dis. 4 (9), e744. doi:10.1371/journal.pntd.0000744
de Jong, B. C., Hill, P. C., Brookes, R. H., Otu, J. K., Peterson, K. L., Small, P. M., et al. (2005). Mycobacterium Africanum: a New Opportunistic Pathogen in HIV Infection? AIDS (London, England) 19 (15), 1714–1715. doi:10.1097/01.aids.0000185991.54595.41
Diarra, B., Kone, M., Togo, A. C. G., Sarro, Y. d. S., Cisse, A. B., Somboro, A., et al. (2018). Mycobacterium Africanum (Lineage 6) Shows Slower Sputum Smear Conversion on Tuberculosis Treatment Than Mycobacterium tuberculosis (Lineage 4) in Bamako, Mali. PloS one 13 (12), e0208603. doi:10.1371/journal.pone.0208603
Dou, H.-Y., Lin, C.-H., Chen, Y.-Y., Yang, S.-J., Chang, J.-R., Wu, K.-M., et al. (2017). Lineage-specific SNPs for Genotyping of Mycobacterium tuberculosis Clinical Isolates. Sci. Rep. 7 (1), 1425. doi:10.1038/s41598-017-01580-z
Earl, D. A., and vonHoldt, B. M. (2012). STRUCTURE HARVESTER: a Website and Program for Visualizing STRUCTURE Output and Implementing the Evanno Method. Conservation Genet. Resour. 4 (2), 359–361. doi:10.1007/s12686-011-9548-7
Evanno, G., Regnaut, S., and Goudet, J. (2005). Detecting the Number of Clusters of Individuals Using the Software STRUCTURE: a Simulation Study. Mol. Ecol. 14 (8), 2611–2620. doi:10.1111/j.1365-294X.2005.02553.x
Faksri, K., Xia, E., Tan, J. H., Teo, Y.-Y., and Ong, R. T.-H. (2016). In Silico region of Difference (RD) Analysis of Mycobacterium tuberculosis Complex from Sequence Reads Using RD-Analyzer. BMC genomics 17 (1), 847. doi:10.1186/s12864-016-3213-1
Firdessa, R., Berg, S., Hailu, E., Schelling, E., Gumi, B., Erenso, G., et al. (2013). Mycobacterial Lineages Causing Pulmonary and Extrapulmonary Tuberculosis, Ethiopia. Emerg. Infect. Dis. 19 (3), 460–463. doi:10.3201/eid1903.120256
Gagneux, S., DeRiemer, K., Van, T., Kato-Maeda, M., de Jong, B. C., Narayanan, S., et al. (2006). Variable Host-Pathogen Compatibility in Mycobacterium tuberculosis. Proc. Natl. Acad. Sci. U.S.A. 103 (8), 2869–2873. doi:10.1073/pnas.0511240103
Gagneux, S. (2018). Ecology and Evolution of Mycobacterium tuberculosis. Nat. Rev. Microbiol. 16 (4), 202–213. doi:10.1038/nrmicro.2018.8
Gatto, L., Catanzaro, D., and Milinkovitch, M. C. (2007). Assessing the Applicability of the GTR Nucleotide Substitution Model through Simulations. Evol. Bioinform Online 2, 145–155. doi:10.1177/117693430600200020
Gehre, F., Kumar, S., Kendall, L., Ejo, M., Secka, O., Ofori-Anyinam, B., et al. (2016). A Mycobacterial Perspective on Tuberculosis in West Africa: Significant Geographical Variation of M. Africanum and Other M. tuberculosis Complex Lineages. Plos Negl. Trop. Dis. 10 (3), e0004408. doi:10.1371/journal.pntd.0004408
Gehre, F., Otu, J., DeRiemer, K., de Sessions, P. F., Hibberd, M. L., Mulders, W., et al. (2013). Deciphering the Growth Behaviour of Mycobacterium Africanum. Plos Negl. Trop. Dis. 7 (5), e2220. doi:10.1371/journal.pntd.0002220
Ghosh, A., N., S., and Saha, S. (2020). Survey of Drug Resistance Associated Gene Mutations in Mycobacterium tuberculosis, ESKAPE and Other Bacterial Species. Sci. Rep. 10 (1), 8957. doi:10.1038/s41598-020-65766-8
Giffin, M. M., Shi, L., Gennaro, M. L., and Sohaskey, C. D. (2016). Role of Alanine Dehydrogenase of Mycobacterium tuberculosis during Recovery from Hypoxic Nonreplicating Persistence. PloS one 11 (5), e0155522. doi:10.1371/journal.pone.0155522
Global Tuberculosis Report. Global Tuberculosis Report (2021): Available at: https://www.who.int/tb/publications/global_report/en/ [Accessed October 20, 2021]
Griffin, J. E., Gawronski, J. D., Dejesus, M. A., Ioerger, T. R., Akerley, B. J., and Sassetti, C. M. (2011). High-resolution Phenotypic Profiling Defines Genes Essential for Mycobacterial Growth and Cholesterol Catabolism. Plos Pathog. 7 (9), e1002251. doi:10.1371/journal.ppat.1002251
Grünwald, N. J., and Goss, E. M. (2011). Evolution and Population Genetics of Exotic and Re-emerging Pathogens: Novel Tools and Approaches. Annu. Rev. Phytopathol. 49, 249–267. doi:10.1146/annurev-phyto-072910-095246
Gygli, S. M., Borrell, S., Trauner, A., and Gagneux, S. (2017). Antimicrobial Resistance in Mycobacterium tuberculosis: Mechanistic and Evolutionary Perspectives. FEMS Microbiol. Rev. 41 (3), 354–373. doi:10.1093/femsre/fux011
Haubold, B., and Hudson, R. R. (2000). LIAN 3.0: Detecting Linkage Disequilibrium in Multilocus Data. Bioinformatics 16 (9), 847–849. doi:10.1093/bioinformatics/16.9.847
Isea-Peña, M. C., Brezmes-Valdivieso, M. F., González-Velasco, M. C., Lezcano-Carrera, M. A., López-Urrutia-Lorente, L., Martín-Casabona, N., et al. (2012). Mycobacterium Africanum, an Emerging Disease in High-Income Countries? Int. J Tuberc. Lung Dis. 16 (10), 1400–1404. doi:10.5588/ijtld.12.0142
Jeon, S., Lim, N., Park, S., Park, M., and Kim, S. (2018). Comparison of PFGE, IS6110-RFLP, and 24-Locus MIRU-VNTR for Molecular Epidemiologic Typing of Mycobacterium tuberculosis Isolates with Known Epidemic Connections. J. Microbiol. Biotechnol. 28 (2), 338–346. doi:10.4014/jmb.1704.04042
Jombart, T. (2008). Adegenet: a R Package for the Multivariate Analysis of Genetic Markers. Bioinformatics (Oxford, England) 24 (11), 1403–1405. doi:10.1093/bioinformatics/btn129
Jombart, T., Devillard, S., and Balloux, F. (2010). Discriminant Analysis of Principal Components: a New Method for the Analysis of Genetically Structured Populations. BMC Genet. 11, 94. doi:10.1186/1471-2156-11-94
Kanabalan, R. D., Lee, L. J., Lee, T. Y., Chong, P. P., Hassan, L., Ismail, R., et al. (2021). Human Tuberculosis and Mycobacterium tuberculosis Complex: A Review on Genetic Diversity, Pathogenesis and Omics Approaches in Host Biomarkers Discovery. Microbiol. Res. 246, 126674. doi:10.1016/j.micres.2020.126674
Kanehisa, M., Furumichi, M., Tanabe, M., Sato, Y., and Morishima, K. (2017). KEGG: New Perspectives on Genomes, Pathways, Diseases and Drugs. Nucleic Acids Res. 45 (D1), D353–D361. doi:10.1093/nar/gkw1092
Karp, P. D., Billington, R., Caspi, R., Fulcher, C. A., Latendresse, M., Kothari, A., et al. (2019). The BioCyc Collection of Microbial Genomes and Metabolic Pathways. Brief. Bioinformatics 20 (4), 1085–1093. doi:10.1093/bib/bbx085
Katoh, K., Misawa, K., Kuma, K., and Miyata, T. (2002). MAFFT: a Novel Method for Rapid Multiple Sequence Alignment Based on Fast Fourier Transform. Nucleic Acids Res. 30 (14), 3059–3066. doi:10.1093/nar/gkf436
Knaus, B. J., and Grünwald, N. J. (2017). Vcfr : a Package to Manipulate and Visualize Variant Call Format Data in R. Mol. Ecol. Resour. 17 (1), 44–53. doi:10.1111/1755-0998.12549
Kumar, S., Stecher, G., Li, M., Knyaz, C., and Tamura, K. (2018). MEGA X: Molecular Evolutionary Genetics Analysis across Computing Platforms. Mol. Biol. Evol. 35 (6), 1547–1549. doi:10.1093/molbev/msy096
Lanave, C., Preparata, G., Sacone, C., and Serio, G. (1984). A New Method for Calculating Evolutionary Substitution Rates. J. Mol. Evol. 20 (1), 86–93. doi:10.1007/BF02101990
Lee, R. S., Radomski, N., Proulx, J.-F., Levade, I., Shapiro, B. J., McIntosh, F., et al. (2015). Population Genomics of Mycobacterium tuberculosis in the Inuit. Proc. Natl. Acad. Sci. U.S.A. 112 (44), 13609–13614. doi:10.1073/pnas.1507071112
Letunic, I., and Bork, P. (2019). Interactive Tree of Life (iTOL) V4: Recent Updates and New Developments. Nucleic Acids Res. 47 (W1), W256–W259. doi:10.1093/nar/gkz239
Lew, J. M., Kapopoulou, A., Jones, L. M., and Cole, S. T. (2011). TubercuList - 10 Years after. Tuberculosis 91 (1), 1–7. doi:10.1016/j.tube.2010.09.008
Li, H. (2013). Aligning Sequence Reads, Clone Sequences and Assembly Contigs with BWA-MEM. arXiv: Genomics. arXiv [Preprint] arXiv:1303.3997. doi:10.6084/M9.FIGSHARE.963153.V1
Li, H. (2011). A Statistical Framework for SNP Calling, Mutation Discovery, Association Mapping and Population Genetical Parameter Estimation from Sequencing Data. Bioinformatics 27 (21), 2987–2993. doi:10.1093/bioinformatics/btr509
Li, W., and Godzik, A. (2006). Cd-hit: a Fast Program for Clustering and Comparing Large Sets of Protein or Nucleotide Sequences. Bioinformatics 22 (13), 1658–1659. doi:10.1093/bioinformatics/btl158
Lipworth, S., Jajou, R., de Neeling, A., Bradley, P., van der Hoek, W., Maphalala, G., et al. (2019). SNP-IT Tool for Identifying Subspecies and Associated Lineages ofMycobacterium tuberculosisComplex. Emerg. Infect. Dis. 25 (3), 482–488. doi:10.3201/eid2503.180894
Liu, K., Yu, J., and Russell, D. G. (2003). pckA-Deficient Mycobacterium Bovis BCG Shows Attenuated Virulence in Mice and in Macrophages. Microbiology (Reading, England) 149 (Pt 7), 1829–1835. doi:10.1099/mic.0.26234-0
MacLean, E., Broger, T., Yerlikaya, S., Fernandez-Carballo, B. L., Pai, M., and Denkinger, C. M. (2019). A Systematic Review of Biomarkers to Detect Active Tuberculosis. Nat. Microbiol. 4 (5), 748–758. doi:10.1038/s41564-019-0380-2
McKenna, A., Hanna, M., Banks, E., Sivachenko, A., Cibulskis, K., Kernytsky, A., et al. (2010). The Genome Analysis Toolkit: a MapReduce Framework for Analyzing Next-Generation DNA Sequencing Data. Genome Res. 20 (9), 1297–1303. doi:10.1101/gr.107524.110
Montano, V., Didelot, X., Foll, M., Linz, B., Reinhardt, R., Suerbaum, S., et al. (2015). Worldwide Population Structure, Long-Term Demography, and Local Adaptation of Helicobacter pylori. Genetics 200 (3), 947–963. doi:10.1534/genetics.115.176404
Napier, G., Campino, S., Merid, Y., Abebe, M., Woldeamanuel, Y., Aseffa, A., et al. (2020). Robust Barcoding and Identification of Mycobacterium tuberculosis Lineages for Epidemiological and Clinical Studies. Genome Med. 12 (1), 114. doi:10.1186/s13073-020-00817-3
Ngabonziza, J. C. S., Loiseau, C., Marceau, M., Jouet, A., Menardo, F., Tzfadia, O., et al. (2020). A Sister Lineage of the Mycobacterium tuberculosis Complex Discovered in the African Great Lakes Region. Nat. Commun. 11 (1), 2917. doi:10.1038/s41467-020-16626-6
O'Neill, M. B., Shockey, A., Zarley, A., Aylward, W., Eldholm, V., Kitchen, A., et al. (2019). Lineage Specific Histories of Mycobacterium tuberculosis Dispersal in Africa and Eurasia. Mol. Ecol. 28 (13), 3241–3256. doi:10.1111/mec.15120
Ofori-Anyinam, B., Dolganov, G., Van, T., Davis, J. L., Walter, N. D., Garcia, B. J., et al. (2017). Significant under Expression of the DosR Regulon in M. tuberculosis Complex Lineage 6 in Sputum. Tuberculosis 104, 58–64. doi:10.1016/j.tube.2017.03.001
Ofori-Anyinam, B., Riley, A. J., Jobarteh, T., Gitteh, E., Sarr, B., Faal-Jawara, T. I., et al. (2020). Comparative Genomics Shows Differences in the Electron Transport and Carbon Metabolic Pathways of Mycobacterium Africanum Relative to Mycobacterium tuberculosis and Suggests an Adaptation to Low Oxygen Tension. Tuberculosis 120, 101899. doi:10.1016/j.tube.2020.101899
Otchere, I. D., Coscollá, M., Sánchez-Busó, L., Asante-Poku, A., Brites, D., Loiseau, C., et al. (2018). Comparative Genomics of Mycobacterium Africanum Lineage 5 and Lineage 6 from Ghana Suggests Distinct Ecological Niches. Sci. Rep. 8 (1), 11269. doi:10.1038/s41598-018-29620-2
Pritchard, J. K., Stephens, M., and Donnelly, P. (2000). Inference of Population Structure Using Multilocus Genotype Data. Genetics 155 (2), 945–959. doi:10.1093/genetics/155.2.945
Rahi, A., Matta, S. K., Dhiman, A., Garhyan, J., Gopalani, M., Chandra, S., et al. (2017). Enolase of Mycobacterium tuberculosis Is a Surface Exposed Plasminogen Binding Protein. Biochim. Biophys. Acta (Bba) - Gen. Subjects 1861 (1 Pt A), 3355–3364. doi:10.1016/j.bbagen.2016.08.018
Riojas, M. A., McGough, K. J., Rider-Riojas, C. J., Rastogi, N., and Hazbón, M. H. (2018). Phylogenomic Analysis of the Species of the Mycobacterium tuberculosis Complex Demonstrates that Mycobacterium Africanum, Mycobacterium Bovis, Mycobacterium Caprae, Mycobacterium Microti and Mycobacterium Pinnipedii Are Later Heterotypic Synonyms of Mycobacterium tuberculosis. Int. J. Syst. Evol. Microbiol. 68 (1), 324–332. doi:10.1099/ijsem.0.002507
Rozas, J., Ferrer-Mata, A., Sánchez-DelBarrio, J. C., Guirao-Rico, S., Librado, P., Ramos-Onsins, S. E., et al. (2017). DnaSP 6: DNA Sequence Polymorphism Analysis of Large Data Sets. Mol. Biol. Evol. 34 (12), 3299–3302. doi:10.1093/molbev/msx248
Rutaihwa, L. K., Sasamalo, M., Jaleco, A., Hella, J., Kingazi, A., Kamwela, L., et al. (2019). Insights into the Genetic Diversity of Mycobacterium tuberculosis in Tanzania. PloS one 14 (4), e0206334. doi:10.1371/journal.pone.0206334
Sanoussi, C. N. D., Coscolla, M., Ofori-Anyinam, B., Otchere, I. D., Antonio, M., Niemann, S., et al. (2021). Mycobacterium tuberculosis Complex Lineage 5 Exhibits High Levels of Within-Lineage Genomic Diversity and Differing Gene Content Compared to the Type Strain H37Rv. Microb. genomics 7 (7), 000437. doi:10.1099/mgen.0.000437
Singh, P., Saket, V. K., and Kachhi, R. (2019). Diagnosis of TB from Conventional to Modern Molecular Protocols. Front. Biosci. 11, 38–60. doi:10.2741/E845
Sriswasdi, S., Yang, C.-c., and Iwasaki, W. (2017). Generalist Species Drive Microbial Dispersion and Evolution. Nat. Commun. 8 (1), 1162. doi:10.1038/s41467-017-01265-1
Stamatakis, A. (2014). RAxML Version 8: a Tool for Phylogenetic Analysis and post-analysis of Large Phylogenies. Bioinformatics (Oxford, England) 30 (9), 1312–1313. doi:10.1093/bioinformatics/btu033
Stucki, D., Brites, D., Jeljeli, L., Coscolla, M., Liu, Q., Trauner, A., et al. (2016). Mycobacterium tuberculosis Lineage 4 Comprises Globally Distributed and Geographically Restricted Sublineages. Nat. Genet. 48 (12), 1535–1543. doi:10.1038/ng.3704
Supply, P., Warren, R. M., Bañuls, A.-L., Lesjean, S., Van Der Spuy, G. D., Lewis, L.-A., et al. (2003). Linkage Disequilibrium between Minisatellite Loci Supports Clonal Evolution of Mycobacterium tuberculosis in a High Tuberculosis Incidence Area. Mol. Microbiol. 47 (2), 529–538. doi:10.1046/j.1365-2958.2003.03315.x
Takuno, S., Kado, T., Sugino, R. P., Nakhleh, L., and Innan, H. (2012). Population Genomics in Bacteria: a Case Study of Staphylococcus aureus. Mol. Biol. Evol. 29 (2), 797–809. doi:10.1093/molbev/msr249
Uplekar, M., and Raviglione, M. (2015). WHO's End TB Strategy: From Stopping to Ending the Global TB Epidemic. Indian J. Tuberculosis 62 (4), 196–199. doi:10.1016/j.ijtb.2015.11.001
Vasconcellos, S. E. G., Huard, R. C., Niemann, S., Kremer, K., Santos, A. R., Suffys, P. N., et al. (2010). Distinct Genotypic Profiles of the Two Major Clades of Mycobacterium Africanum. BMC Infect. Dis. 10, 80. doi:10.1186/1471-2334-10-80
Walker, B. J., Abeel, T., Shea, T., Priest, M., Abouelliel, A., Sakthikumar, S., et al. (2014). Pilon: an Integrated Tool for Comprehensive Microbial Variant Detection and Genome Assembly Improvement. PloS one 9 (11), e112963. doi:10.1371/journal.pone.0112963
WHO (World Health Organization) (2015a). The End TB Strategy. Geneva: WHO. http://www.who.int/tb/End_TB_brochure.pdf.
WHO (World Health Organization) (2015b). “The End TB Strategy,” in Fact Sheet (Geneva: WHO). http://www.who.int/tb/post2015_TBstrategy.pdf?ua=1.
Wickham, H. (2016). ggplot2: Elegant Graphics for Data Analysis. New York: Springer-Verlag. ISBN 978-3-319-24277-4. doi:10.1007/978-3-319-24277-4
Winglee, K., Manson McGuire, A., Maiga, M., Abeel, T., Shea, T., Desjardins, C. A., et al. (2016). Whole Genome Sequencing of Mycobacterium Africanum Strains from Mali Provides Insights into the Mechanisms of Geographic Restriction. Plos Negl. Trop. Dis. 10 (1), e0004332. doi:10.1371/journal.pntd.0004332
Wirth, T., Hildebrand, F., Allix-Béguec, C., Wölbeling, F., Kubica, T., Kremer, K., et al. (2008). Origin, Spread and Demography of the Mycobacterium tuberculosis Complex. Plos Pathog. 4 (9), e1000160. doi:10.1371/journal.ppat.1000160
Yeboah-Manu, D., de Jong, B. C., and Gehre, F. (2017). The Biology and Epidemiology of Mycobacterium Africanum. Adv. Exp. Med. Biol. 1019, 117–133. doi:10.1007/978-3-319-64371-7_6
Zellweger, J. P., Sotgiu, G., Corradi, M., and Durando, P. (2020). The Diagnosis of Latent Tuberculosis Infection (LTBI): Currently Available Tests, Future Developments, and Perspectives to Eliminate Tuberculosis (TB). Med. Lav 111 (3), 170–183. doi:10.23749/mdl.v111i3.9983
Zhang, Y. J., Ioerger, T. R., Huttenhower, C., Long, J. E., Sassetti, C. M., Sacchettini, J. C., et al. (2012). Global Assessment of Genomic Regions Required for Growth in Mycobacterium tuberculosis. Plos Pathog. 8 (9), e1002946. doi:10.1371/journal.ppat.1002946
Keywords: Mycobacterium africanum, population genomics, SNP, lineage, bioinformatics
Citation: Balamurugan M, Banerjee R, Kasibhatla SM, Achalere A and Joshi R (2022) Understanding the Genetic Diversity of Mycobacterium africanum Using Phylogenetics and Population Genomics Approaches. Front. Genet. 13:800083. doi: 10.3389/fgene.2022.800083
Received: 13 November 2021; Accepted: 14 March 2022;
Published: 13 April 2022.
Edited by:
Narjol González-Escalona, United States Food and Drug Administration, United StatesReviewed by:
Diana Machado, New University of Lisbon, PortugalEzekiel Green, University of Johannesburg, South Africa
Arash Ghodousi, Vita-Salute San Raffaele University, Italy
Copyright © 2022 Balamurugan, Banerjee, Kasibhatla, Achalere and Joshi. This is an open-access article distributed under the terms of the Creative Commons Attribution License (CC BY). The use, distribution or reproduction in other forums is permitted, provided the original author(s) and the copyright owner(s) are credited and that the original publication in this journal is cited, in accordance with accepted academic practice. No use, distribution or reproduction is permitted which does not comply with these terms.
*Correspondence: Rajendra Joshi, rajendra@cdac.in
†These authors have contributed equally to this work