
94% of researchers rate our articles as excellent or good
Learn more about the work of our research integrity team to safeguard the quality of each article we publish.
Find out more
ORIGINAL RESEARCH article
Front. Genet., 03 February 2022
Sec. Livestock Genomics
Volume 13 - 2022 | https://doi.org/10.3389/fgene.2022.772115
 Tong Mu1†
 Honghong Hu1†
 Xiaofang Feng1
 Yanfen Ma1,2
 Ying Wang1Jiamin Liu1Baojun Yu1Wan Wen3
 Juan Zhang1
 Yaling Gu1*
Long noncoding RNAs (lncRNAs) play an important regulatory role in various biological processes as a key regulatory factor. However, the complete expression profile of lncRNAs in dairy cows and its function in milk fat synthesis are unknown. In this study, RNA sequencing (RNA-seq) was used to research the whole genome expression of lncRNAs and mRNA transcripts in high and low milk fat percentage (MFP) bovine mammary epithelial cells (BMECs), and joint analysis was carried out. We identified a total of 47 differentially expressed genes (DEGs) and 38 differentially expressed lncRNAs (DELs, Padj <0.05), enrichment analysis screened out 11 candidate DEGs that may regulate milk fat metabolism. Downregulated differential gene ENPP2 (The expression level in BMECs of high milk fat dairy cows was lower than that of low milk fat cows) and upregulated differential gene BCAT1 are more likely to participate in the milk fat metabolism, and its function needs further experiments verification. The enrichment analysis of target genes predicted by DELs identified 7 cis (co-localization) and 10 trans (co-expression) candidate target genes related to milk lipid metabolism, corresponding to a total of 18 DELs. Among them, the targeting relationship between long intervening/intergenic noncoding RNA (lincRNA) TCONS_00082721 and FABP4 is worthy of attention. One hundred and fifty-six competing endogenous RNAs (ceRNAs) interaction regulation networks related to milk fat metabolism were constructed based on the expression information of DELs, differential microRNAs (miRNAs), and lipid metabolism-related target genes. The regulatory network centered on miR-145 will be the focus of subsequent experimental research. The ceRNAs regulatory network related to TCONS_00082721 and TCONS_00172817 are more likely to be involved in milk fat synthesis. These results will provide new ways to understand the complex biology of dairy cow milk fat synthesis and provide valuable information for breed improvement of Chinese Holstein cow.
Milk quality is affected by many factors, such as population genetic structure, reproductive performance, feeding and management, and is closely related to the main raw material composition of milk. Milk fat is an important component in butter and yogurt, and its content and composition are the main reference elements in milk quality evaluation (Mu et al., 2021). Nowadays, milk fat content is not only one of the important indicators of core competitiveness of dairy industry, but also the main target feature of dairy cow breeding (Li et al., 2015). To a certain extent, it also plays an important role in nutrition and metabolism during human growth and development (Chen et al., 2019). Therefore, theory exploration on milk fat formation and regulation and the improvement of milk fat content become one the focuses of lactating biology research.
In the past, many scholars have extensively studied the complex regulatory mechanisms of mammary gland development and elucidated the main pathways of milk fat synthesis (including de novo synthesis and absorption of FA in the blood) (Bauman et al., 2006). Quantitative real-time reverse transcription PCR (qRT-PCR) can better discover the transcriptional regulation steps of milk fat synthesis. High-throughput sequencing has identified a series of effective genes and regulatory factors in milk fat metabolism (Xu et al., 2010). The study of gene regulation mainly depends on protein-coding genes. However, more and more evidence suggests that non-coding RNAs (ncRNAs), which are mistaken for “transcriptional noise”, are also important factors in regulating complex developmental processes in organisms (Ma et al., 2017). Long noncoding RNAs (lncRNAs) are newly identified long-stranded non-coding RNAs in the breast. It is more than 200 nucleotides in length and is more tissue-specific than coding genes (Xu et al., 2016). lncRNAs have a more complex mode of action on genes than microRNAs (miRNAs). Currently, transcriptional interference is a more mature regulatory model of regulation (Fatica and Bozzoni, 2014). Functional studies have found that lncRNAs regulate gene expression at epigenetic, transcriptional and post-transcriptional levels in mammals, and also play key regulatory roles in a variety of biological processes (Yeong-Hwan et al., 2018). In regulating milk fat metabolism in goats, Yu et al. (2017) found that compared with early lactation, the expression trend of lncRNAs TCONS-00144434, TCONS-00148514 and TCONS-00055666 during mature lactation was the same as that of FASN, LPL, GPAM and MSMO1 with the function of fatty acid biosynthesis and cholesterol storage (the full names of all genes in this paper are shown in Supplementary Table S1). However, the specific regulatory mechanism needs to be further studied. Chao et al. (2017) found that the target genes of TCONS_00162862 were involved in lipid transporter protein activity, ligase activity, and fatty acid transport in dairy cow, and mainly enriched in MAPK, PI3K-Akt, and insulin signaling pathways. Zheng et al. (2018) performed transcriptome sequencing on four breast tissues of Holstein cows during peak lactation and late lactation, and found that the target genes of differentially expressed LNC-XLOC_274111 were FABP3 and FABP4, which would encode fatty acid-binding proteins in the bovine mammary gland. The target genes of XLOC_000752 were significantly enriched in PPAR, AMPK, and insulin signaling pathways, as well as glycerol metabolism pathways.
So far, research on lncRNAs in milk fat metabolism of ruminants are scarce. The functions and expression profiles of lncRNAs in the bovine mammary gland are still unclear, and there are even fewer studies on differentially expressed lncRNAs (DELs) for differences in high and low milk fat percentage (MFP). In addition, the dynamic pattern of the interaction of ceRNA in milk fat synthesis remains is unknown. To better understand the metabolic process of milk fat synthesis during lactation, Holstein cows with extreme differences in MFP were screened, fresh milk was collected and bovine mammary epithelial cells (BMECs) were isolated. The differentially expressed genes (DEGs) and DELs related to milk fat synthesis in the same lactation stage were screened by transcriptomics technology, and the predicting lncRNAs to target miRNAs and constructing a ceRNA regulatory network of genes, miRNAs and lncRNAs related to milk fat metabolism. It is an important step in understanding the complex biological processes involved in milk production, and provides valuable information for the improvement of Chinese Holstein cow breeds.
In this study, BMECs were isolated and cultured from milk samples of dairy cows. Two hundred milliliter milk samples were collected from each dairy cow, and aseptic operation was strictly carried out during the sampling process, so there was no harm to dairy cows.
245 first calving Holstein cows with the same feeding background (Table 1), similar age and in the middle and late stage of lactation (150–220 days) were selected from Ningxia Nongkeng Helanshan Maosheng dairy farm. Early, middle and late milk samples of each cow were collected for dairy herd improvement (DHI) determination. Holstein cows with high MFP (n = 4) and low MFP (n = 4) with somatic cell count (SCC) less than 100,000/mL were selected (Table 2). Fresh milk samples were aseptically collected into 50 ml centrifuge tubes, and four tubes per cow were collected for a total of 200 ml. Tighten the cap of the bottle, seal and sterilize it, put it in a thermos flask containing 37°C sterile water, and return it to the laboratory for later use.
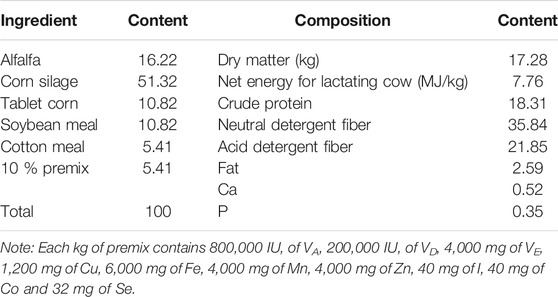
TABLE 1. Ingredient and nutrient composition in diet (dry matter basis) %.
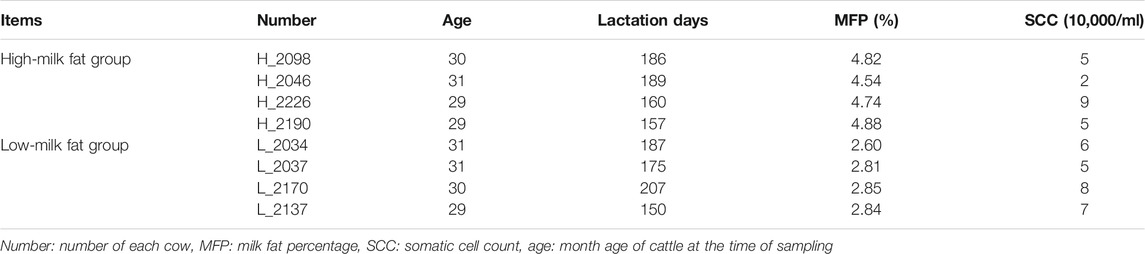
TABLE 2. High and low MFP and SCC of Holstein cow.
The composition of the complete culture medium and culture method were the same as those of Duan et al. (2017). When the cells grew to 80% (F2 generation), total cellular RNA (Takara, Dalian, China) was extracted. To exclude genomic DNA contamination, DNAase (Takara, Dalian, China) was used for reverse transcriptional preprocessing (Takara, Dalian, China). Primers were designed using Primer Premier 5.0 and PCR amplification was performed for genes specifically expressed in BMECs related to milk fat synthesis and keratin 8 (Takara, Dalian, China).
PCR reaction procedure: pre-denaturation at 94°C for 4 min, denaturation at 94°C for 30 s, annealing (Supplementary Table S2 for annealing temperature) for 30 s, extension at 72°C for 30 s, 35 cycles, 72°C extensions for 10 min.
The basic identification of BMECs is the same as that of Shen et al. (2016). The triglyceride (TAG) content of BMECs was determined by using the triglyceride enzymatic assay kit (Applygen, Beijing, China) of the high-fat samples. Then the protein concentration of the sample was measured by using the BCA protein content detection kit, and the TAG content was adjusted for the protein concentration per mg.
The Trizol method was used to extract total RNA from BMECs (F2) of high and low MFP cows, and the quality of RNA samples was strictly controlled. The integrity of RNA and DNA contamination were analyzed by agarose gel electrophoresis. The concentration and purity of RNA (OD260/280) were detected by Nanodrop, and the integrity of RNA was accurately detected by Agilent 2100 bioanalyzer. The 260/280 ratio of all samples was approximately 2.0, and the RNA integrity index (RIN) was ≥8.0.
A chain-specific library was constructed by removing ribosomal RNA. First, ribosomal RNA was removed from the total RNA, and RNase R enzyme was used to break RNA into short fragments of 250–300 bp, and cDNA was synthesized. The purified double-stranded cDNA was repaired at the end, added A tail and connected to the sequencing junction. Finally, the library was amplified by PCR and the library was obtained.
After passing the library inspection, Illumina PE150 sequencing was performed. After the original data is obtained, the reads with adapter, N (undetermined base information) ratio greater than 0.002, and low-quality bases with a read length of more than 50% are removed. After sequencing error rates (Q20 and Q30) and GC content distribution checks, clean reads for subsequent analysis were obtained. tophat2 (http://tophat.cbcb.umd.edu), Hisat2 (http://ccb.jhu.edu/software/hisat2), and STAR (http://code.google.com/p/rna-star) software were used to compare and analyze the RNA sequencing (RNA-seq) data (the reference genome version is bos_taurus_Ensembl_97).
The level of gene expression was quantified using fragments per kilobase of exon per millions of reads (FPKM) value. Expression difference significance analysis was performed using edgeR software (Smyth et al., 2010). The corrected p-value (Padj) was used to determine the significance level, and Padj <0.05 was used as the standard of differential significance, while |log2FoldChange|>1.5 was another important criterion for screening DELs and DEGs. Co-localization of lncRNAs with protein-coding genes was used to find genes within 100 kb upstream and downstream of lncRNAs, and co-expression was used to predict the target genes of lncRNAs. The gene ontology (GO) database was used to enrich cellular composition (CC), biological process (BP), and molecular function (MF) of DEGs and target genes of DELs. Kyoto encyclopedia of genes and genomes (KEGG) was used to identify the major biochemical metabolic pathways and signal transduction pathways involved in genes. The protein interaction network between DEGs and DELs target genes was analyzed by STRING database (https://string-db.org/) and further visualized using Cytoscape (http://www.cytos-cape.org/).
MiRanda database was used with the default parameters to identify conserved miRNA target sites in the 3′UTR of lncRNAs (total score ≥140, total energy ≤ -15 kcal/mol; John et al., 2004). MiRNAs target gene prediction was based on the intersection of miRanda (total score ≥140, total energy ≤ -15 kcal/mol) and RNAhybrid (mfe ≤ -20 kcal/mol, p < 0.05; John et al., 2004; Jan and Marc, 2006).
To confirm the sequencing results, eight DEGs and DELs were randomly selected for qRT-PCR validation, respectively. First-strand cDNA synthesis was performed using the PrimeScript RT kit (Takara, Dalian, China). qRT-PCR (three replicates) was performed by SYBR Premix Ex Taq™II (Takara, Dalian, China) on the Bio-Rad CFX96 Touch™ Real-Time PCR Detection System (Bio-Rad, Hercules, CA, United States). Amplification procedure: 95°C for 30 s, 95°C for 5 s, annealing for 30 s, 40 cycles. qRT-PCR primers were designed using Primer Premier 5.0 with primers spanning at least one intron, and the sequence and annealing temperature of each primer are shown in Supplementary Table S2.
The data were filtered by Microsoft Excel 2016, and the relative expressions of DEGs and DELs were analyzed by the 2−ΔΔCt method and normalized by the GAPDH gene. The data were analyzed using SAS 9.2 (SAS Institute, Cary, NC, United States) with a linear mixed model for one-way ANOVA.
As shown in Figure 1, the fresh milk (per 40 ml) of dairy cows with high MFP and low MFP was centrifuged at 1,000 r/min for 10 min. It is found that the milk fat layer area of high MFP dairy cows are higher than that of low MFP dairy cows, and there are also different milk fat layer thickness (Figures 1A,B). The isolated BMECs is a unique “pebble” epithelial cells shape, and Figures 1C–F is the flow chart of the isolation BMECs, genetics, growth, and cell secretory characteristics are normal (Zheng et al., 2018). The cell growth curve conforms to the “S” rule, indicating that the isolated cells have grown well (Hu et al., 2009). Keratin 18 belongs to the intermediate fibrin family, is participated in the formation of the cytoskeleton, and is the marker of epithelial cells (Hu et al., 2009). In this study, immunofluorescence showed that keratin 18 was positive (Figures 1G,H), and the expression of keratin 8 (epithelial cell-specific protein) was detected in both high and low groups (Figure 2A), indicating that the isolated cells had specific epithelial cell characteristics (Lu et al., 2012). Chromosome analysis showed that the cells were in a normal diploid configuration and contained 60 chromosomes, which was consistent with the chromosome number of dairy cows (Figure 1I).
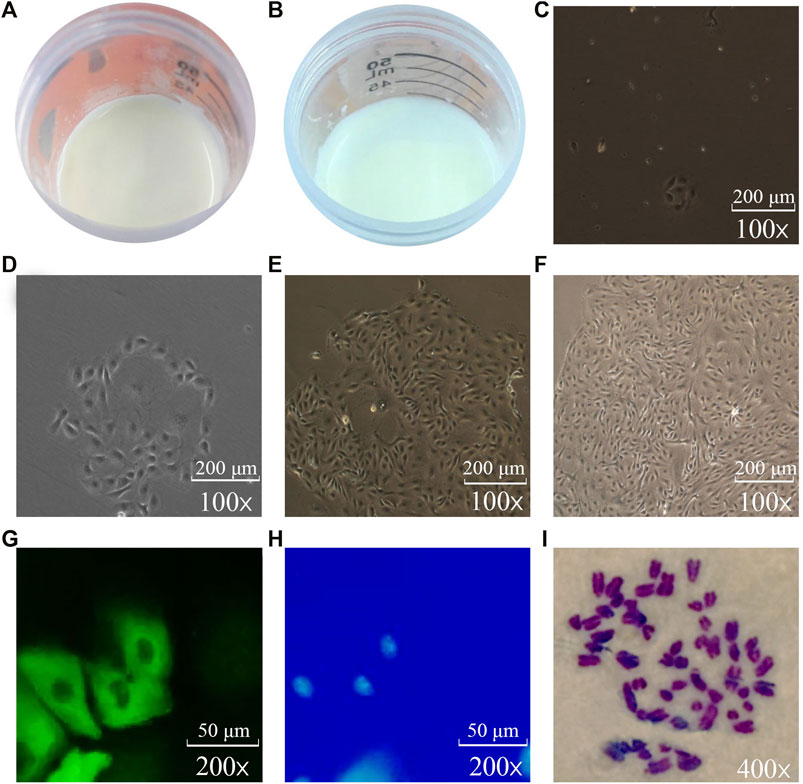
FIGURE 1. Isolation, culture and identification of BMECs (C–F: 10*10; G, H: 10*20; I: 10*40). (A): Thickness and area of milk fat layer after centrifugation of high-milk fat milk. (B): Thickness and area of milk fat layer after centrifugation of low-milk fat milk. (C): Single-cell clone of BMECs can be seen after 3 days of isolation and culture. (D): Single-cell clones of BMECs gradually expand after 5 days of culture. (E): BMECs have begun to proliferate rapidly after 7 days. (F): After 13 days of isolation and culture, BMECs can be rapidly covered with the bottom of the bottle. (G): BMECs labeled with green fluorescence. (H): Nuclei stained blue by DAPI in the same visual field. (I): Chromosomes under oil microscope.
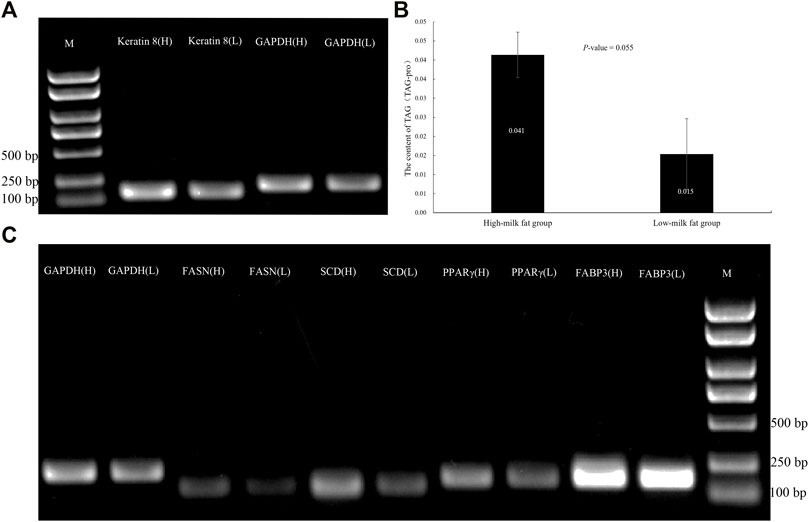
FIGURE 2. BMECs TAG content and expression level of adipogenic genes and keratin 8 in high and low MFP. (A): Expression of keratin 8 in BMECs of dairy cows with high and low MFP. (B): Content of TAG in BMECs of dairy cows with high and low MFP. (C): Expression of adipogenic genes in BMECs of dairy cows with high and low MFP. M, DL2000 DNA marker, H, high-milk fat group, L, low-milk fat group.
Shen et al. (2016) showed that the isolated BMECs maintained cell-specific genetic, structural, and biological functions in the 2nd and 5th passages. To confirm whether the BMECs isolated from the high-milk fat group and low-milk fat group have the differences in milk fat synthesis at the cellular level, we detected the changes in the TAG content and adipogenic gene expression of F2 generation BMECs. The results found that there was a great difference in TAG content, and the expression levels of fat-related genes SCD, PPAR γ, and FABP3 were higher in high-milk fat group than those in low-milk fat group, which further confirmed the difference between high and low MFP groups at the molecular level. It has laid a reliable material foundation for subsequent transcriptome sequencing and other experiments (Figure 2).
Using Illumina PE150 sequencing platform, 81 605 996 ∼ 97 102 888 and 78 710 246 ∼ 88 676 080 raw_reads were obtained in high and low MFP BMECs, and 80 633 532 ∼ 94 731 948 and 76 807 276 ∼ 86 508 476 clean_reads were obtained after removing the adapter related, containing N and low quality, respectively. The sequencing error rate of the 8 samples is 0.02%, Q20 is greater than 97%, Q30 is greater than 94%, the GC content is about 53%, which ensures the accuracy of the subsequent analysis. The genomic distribution of clean_reads showed that most of the clean_reads were located in the exon region (61.79–70.27%), the intergenic region (20.96–24.41%), and the intron region (8.03–14.46%) of the bovine genome.
CPC/PFAM/CNCI software predicted that there were 25,702 novel_mRNA with coding potential and 7602 candidate novel_lncRNAs without coding potential. Among all the candidate novel_lncRNAs, the lncRNAs located in the intergenic region account for 51.8%, the antisense contains 24.75%, the sense overlapping contains 23.50%, and no sense intronic. After obtaining the FPKM of all transcripts, the distribution of transcripts expression levels of different samples was shown by block diagram (Figure 3A), indicating that the BMECs expression level in cows with high MFP was slightly higher than that in cows with low MFP. The correlation of gene expression level between samples is an important index for testing the experimental reliability and sample selection. In this study, the correlation coefficients of the intra-group and inter-group samples were calculated based on the FPKM values of all genes in each sample and drawn into a heat map (Figure 3B). As can be seen from the figure, intra-group correlation coefficients are all above 0.96, graeter than the ideal sampling and experimental conditions (R2 = 0.92), indicating a high degree of similarity in expression patterns among samples and a difference between groups. Therefore, we think that the transcriptome sequencing results are reliable and can be used for subsequent analysis.
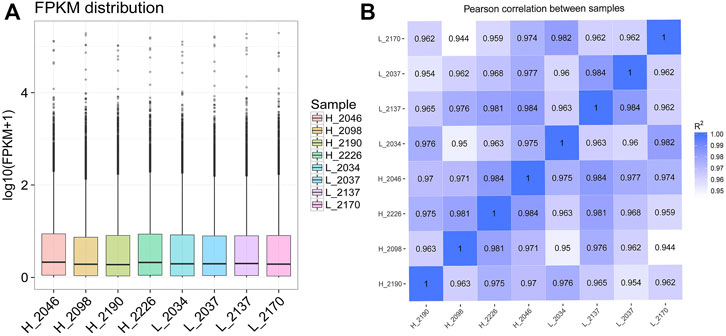
FIGURE 3. Expression level distribution and correlation analysis of each sample. (A): The box diagram of different sample expression values, in which the abscissa is the sample name and the ordinate is log10 (FPKM + 1). The box diagram of each region corresponds to five statistics (from top to bottom, the maximum, upper quartile, median, lower quartile, and minimum). (B): The heat maps for the correlation analysis between samples. FPKM, Fragments per kilobase of exon per million fragments mapped, R2, Pearson correlation coefficient.
Fifteen thousand five hundred and seventy-three mRNAs were common to the high and low milk fat groups, with 717 and 614 mRNAs specifically expressed in the high and low milk fat groups for the differential mRNAs screened, respectively. However, the number of lncRNAs shared between the high-milk fat group and the low-milk fat group was relatively small (4,666), with 372 specific lncRNAs in the high-milk fat group and 365 lncRNAs in the low-milk fat group. A total of 47 DEGs and 38 DELs were screened from BMECs with high and low MFP (Padj <0.05). The FPKM of DEGs and DELs were transformed by log10 (FPKM+1) and then clustered by heat map (Figure 4). DEGs or DELs with similar expression patterns cluster together and differ significantly in color, indicating that these genes share a common function or are involved in a common metabolic pathways. Compared with the low-milk fat group, 24/27 DEGs/DELs expression in the high-milk fat group was significantly upregulated, and 23/11 DEGs/DELs expression was significantly downregulated.
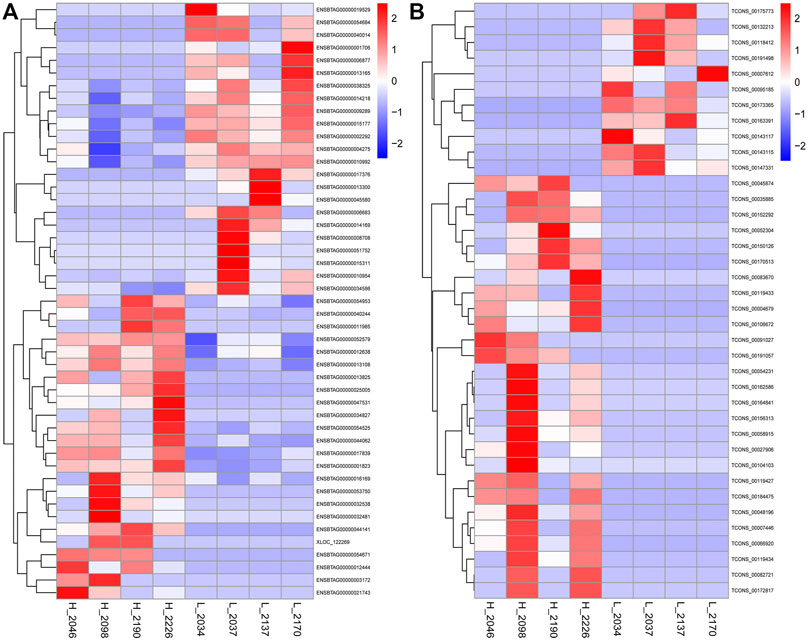
FIGURE 4. Hierarchical clustering of DEGs and DELs. (A): The DEGs clustering heat map, the abscissa is the sample, the ordinate is the DEGs, the left side clusters the genes according to the degree of similarity of expression, the expression is gradually upregulated from blue to red, and the number is the relative expression after homogenization. (B): The DELs clustering heat map.
Based on the functional enrichment analysis of 47 DEGs, a total of 173 significantly enriched GO items were identified, as shown in Figure 5A, showing the first 20 significantly enriched GO items (the same below). Among the significantly enriched GO items, the BP related to lipid metabolism is the regulation of phospholipid translocation, positive regulation of phospholipid translocation, and glycerophospholipid catabolic process. The MF item is triglyceride lipase activity, lipase activity, aminophospholipid transporter activity, phosphodiesterase I activity, sterol esterase activity, and carboxylic ester hydrolase activity. KEGG enrichment analysis showed that six signaling pathways were significantly enriched (Figure 5B), and the pathways related to lipid metabolism were Wnt, Rap1 and 2-Oxocarboxylic acid metabolism. 11 DEGs that may regulate milk fat metabolism were screened out (Table 3). The enrichment of GO/KEGG is shown in Supplementary Table S3. PDGFD, BCAT1, and APOL3 genes expression were upregulated, while ATP8A2, PTPRR, KCNMA1, ZFYVE28, ENPP2, DKK1, CES4A, and CTSH genes expression were downregulated. ENPP2 gene is significantly enriched to BP, MF, and KEGG pathway related to lipid metabolism, and it is inferred that it is more likely to regulate milk fat metabolism.
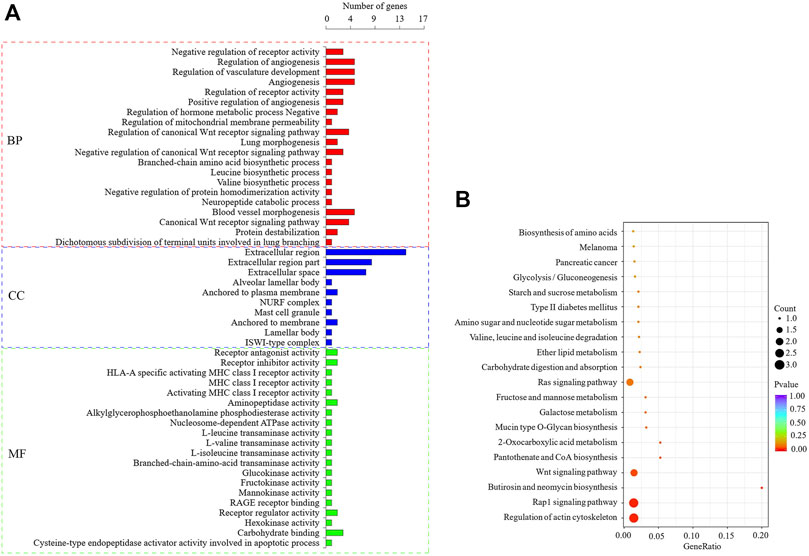
FIGURE 5. GO and KEGG enrichment analysis of DEGs. (A): The first 20 significant GO items (p < 0.05), when less than 20, only show significant enrichment items, the latter is the same. (B): The first 20 KEGG enrichment results.
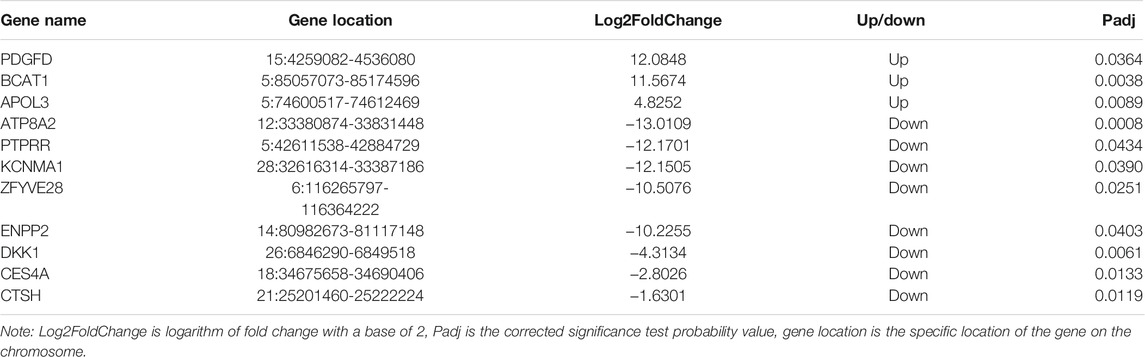
TABLE 3. Candidate DEGs related to milk fat metabolism.
The target genes (cis) of DELs predicted by co-localization were enriched to 258 significant GO items (p < 0.05), as shown in Figure 6A. In the significantly enriched GO items, the BP is related to lipid metabolism that regulates the secretion of arachidonic acid, and MF is lipid phosphatase activity. KEGG enrichment analysis showed that seven signal pathways were significantly enriched (Figure 6B), among which Fc gamma R-mediated phagocytosis was related to lipid metabolism. Through enrichment analysis, seven candidate target genes that may regulate milk fat metabolism were screened, namely VARS2, ITGA6, ATP4A, PPAP2C, FGF1, AMPH, and SYK. The enrichment of GO/KEGG is shown in Supplementary Table S4.
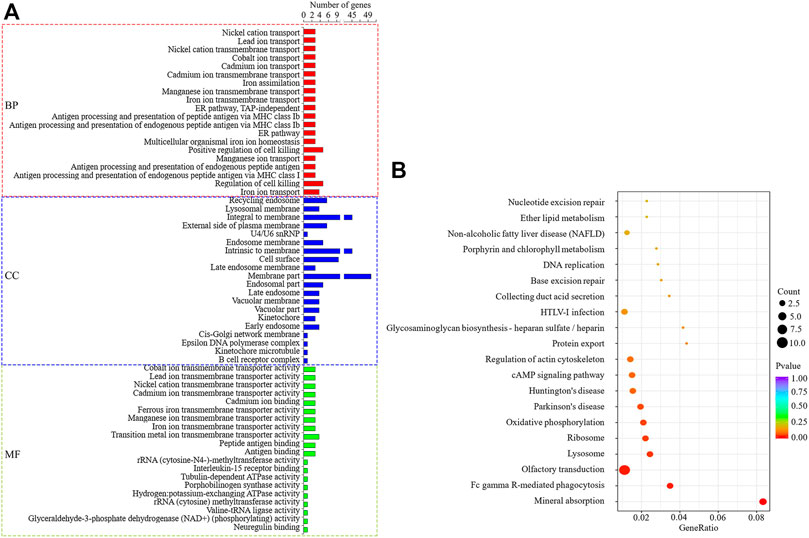
FIGURE 6. GO and KEGG enrichment analysis of DELs target genes predicted by co-localization. (A): The first 20 significant GO items (p < 0.05). (B): The first 20 KEGG enrichment results.
The co-expression predicted DELs target genes (trans) were significantly enriched to 509 GO items (p < 0.05), as shown in Figure 7A. Among them, BP related to lipid metabolism includes lipid metabolic process, long-chain fatty-acyl-CoA biosynthetic process, fatty acid extension, fatty acid transport and negative regulation of triglyceride biosynthetic process, and so on. MF items includes fatty acid synthase activity, fatty acid transporter activity, long-chain fatty acid-binding, and lysophospholipid transporter activity, and so on. The target genes were significantly enriched to 17 signal pathways (p < 0.05) (Figure 7B), among which the pathways related to lipid metabolism include PPAR, cAMP, Fatty acid metabolism and Fc epsilon RI. Under the condition that the correlation coefficient between DELs and target gene expression was greater than 0.97, 10 target genes that might regulate milk fat metabolism were screened out, namely PLA2G4E, INPP4B, FABP3, ACADSB, FABP4, OXSM, FABP7, GPX1, CYP27A1, and ALOX12 genes. The GO/KEGG enrichment is shown in Supplementary Table S5. Among the 10 lipid metabolism-related target genes, the gene expression of PLA2G4E, FABP4, FABP3, and ACADSB was upregulated (p < 0.05), while the gene expression of FABP7 and CYP27A1 was downregulated (p < 0.05). The upregulation genes of PLA2G4E, FABP4 and OXSM is significantly enriched in lipid metabolism-related BP, MF and KEGG. Therefore, these three genes and their corresponding DELs need more attention in the follow-up functional mechanism research.
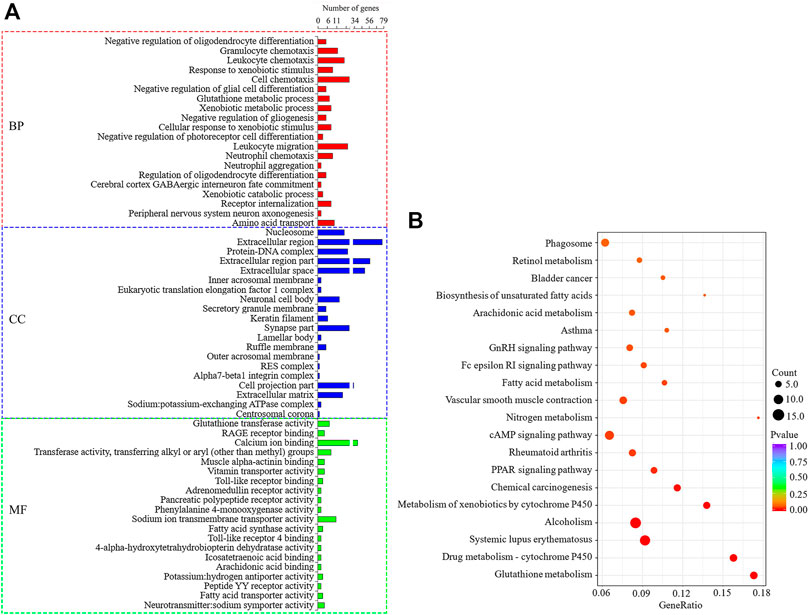
FIGURE 7. GO and KEGG enrichment analysis of DELs target genes predicted by co-expression. (A): The first 20 significant GO items (p < 0.05). (B): The first 20 KEGG enrichment results.
The 17 lipid metabolism-related target genes were predicted and screened by co-localization and co-expression. All DELs that regulate these target genes are shown in Table 4. A total of 18 DELs that may be related to milk fat metabolism were screened and their corresponding relationships with target genes are shown in Supplementary Tables S6, S7. Among the 18 DELs that may be related to milk fat metabolism, 12 were upregulated and six were downregulated. Bold font is the DELs predicted by both co-localization and co-expression that may regulate milk fat metabolism. Italic is the DELs corresponding to the target genes (PLA2G4E, FABP4, and OXSM), which is significantly enriched in BP, MF, and KEGG. These are also the lncRNAs that need more attention in further experiments.

TABLE 4. DELs related to lipid metabolism predicted by co-expression and co-localization.
The interaction between 18 DELs and lipid metabolism-related target genes is shown in Figure 8. A lncRNA may interact with multiple lipid metabolism-related genes, and a gene may also be regulated by multiple lncRNAs. Among the target genes related to lipid metabolism, the expression trend of significantly upregulated or downregulated genes is consistent with the targeted regulation of DELs, which is not only in line with the general mode of action of lncRNAs on genes but also the focus of subsequent experiments.
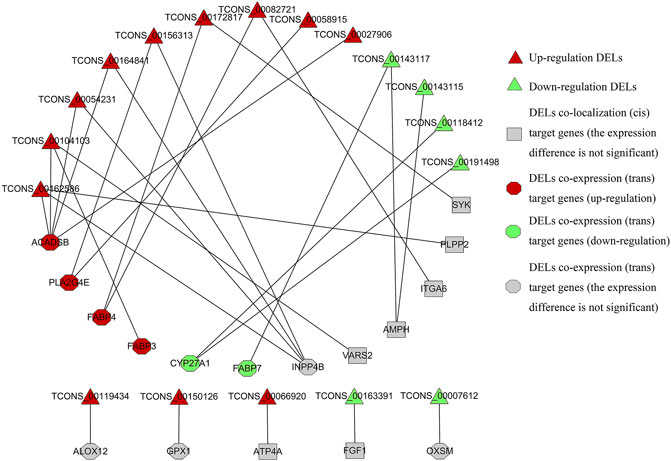
FIGURE 8. Regulatory relationship between DELs and target genes related to lipid metabolism.
The differential miRNAs used in this section were derived from the small RNA sequencing results of the research team (Supplementary Table S8). LncRNAs can act as precursor molecules of miRNAs. When looking for lncRNAs that interact with miRNAs, it is necessary to filter out lncRNAs that may be precursors of miRNAs. Based on the homology between lncRNAs and miRNAs precursors, we use Blastn software to search for such lncRNAs, and the results are listed in Supplementary Table S9. Then, the lncRNAs corresponding to differential miRNAs were predicted by miRanda software, and miRNAs regulated by the DELs are screened. The target genes of differential miRNAs were predicted and cross-differentiated by using two software, miRanda, and RNAhybrid. Based on ceRNA theory, we searched the lncRNAs_target gene pairs with the same miRNAs binding sites, construction of lncRNA_miRNA _mRNA regulatory relationship with lncRNAs as a decoy, miRNAs as core and mRNAs as the target, and calculation of Pearson correlation coefficients for the expression of lncRNA_miRNA and miRNA_mRNA (Figure 9).
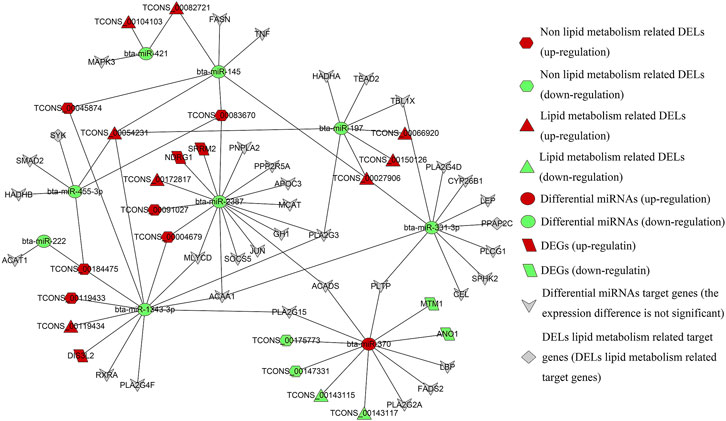
FIGURE 9. Regulatory network of DELs differential miRNAs_ target genes.
As shown in the regulatory network diagram, all lipid metabolism-related target genes SYK and PPAP2C (cis) are also the target genes of lipid metabolism DELs, constituting the regulatory relationships of TCONS_00054231_bta-miR-455-3p_SYK, TCONS_00184475 _bta-miR-455-3p_SYK, and TCONS_00027906_bta-miR-331-3p_PPAP2C. The upregulated genes DIS3L2, SRRM2, NDRG1 and the downregulated genes ANO1 and MTM1 are the DEGs screened in this study, and 18 ceRNAs regulatory networks contain these DEGs. Also, lipid metabolism-related DELs are involved in a total of 76 ceRNAs regulatory networks, including 10 lncRNAs, 8 miRNAs, and 32 genes. There are 80 ceRNAs regulatory networks involved in lipid metabolism-unrelated DELs, consisting of 8 lncRNAs, six miRNAs, and 24 genes, are enriched for target genes GO/KEGG as shown in Supplementary Table S10. Downregulated bta-miR-2387 is a differential miRNA with the largest number of potential lipid metabolism-related target genes (13) and only interacts with lipid metabolism-related differential lncRNA TCONS_00172817. Non-lipid metabolism-related differences lncRNA TCONS_00004679, TCONS_00091027, and TCONS_00083670 may all play a regulatory role in bta-miR-2387.
It has been shown that the downregulation of bta-miR-145 among many differential miRNAs can regulate the lipid droplet formation and TAG accumulation (Wang et al., 2017). Therefore, the regulatory relationship centered on bta-miR-145 is one of the focuses of our subsequent experiments. Notably, TCONS_00027906, TCONS_00054231, TCONS_ 00082721, TCONS_00045874, and TCONS_00083670 act together on bta-miR-145, which in turn regulates the expression of FASN, which was a potential regulatory network for probing the mechanism of milk fat regulation of the potential regulatory network. The downregulated expression of bta-miR-421, bta-miR-331-3p and bta-miR-197 was a lipid metabolism DELs that specifically targets lipid metabolism-related differential miRNAs, while bta-miR-222 was a non-lipid metabolism differential lncRNA specifically targets lipid metabolism-related differential miRNAs. Interestingly, among the numerous lipid metabolism-related differential miRNAs, only bta-miR-370 is an upregulated differential miRNA, while the rest are downregulated.
Within the entire regulatory network relationship, the differential miRNAs were negatively correlated with DELs expression in all samples (8) with a correlation coefficient of -0.10 to -0.75. There was a negative correlation between differential miRNAs and the expression of some target genes (-0.10 to -0.67). e.g.: bta-miR-370 with MTM1, ANO1, PLA2G15, FADS2 genes; bta-miR-2387 with SRRM2, NDRG1, PPP2R5A genes; bta-miR-455-3p with SMAD2, HADHB genes; bta-miR-1343-3p with RXRA, DIS3L2, PLA2G4F genes; bta-miR-331-3p with PLTP, SPHK2, LEP, CYP26B1, TBL1X genes; bta-miR-197 with TBL1X genes (Supplementary Table S11). We need to focus on the lncRNA_miRNA_mRNA interaction regulatory network with negative correlation and targeted relationship in the subsequent experiments.
Protein interaction network analysis of DEGs (11) screened the possible regulation of milk lipid metabolism, target genes predicted by the co-localization and co-expression of DELs (17), and lipid metabolism-related genes corresponding to differential miRNAs targeted by DELs (34), the results are shown in Figure 10. There are 49 nodes and 113 interaction link sets in the protein interaction network diagram, with an enriched p-value of 1.0e-16 and a confidence level of 0.4 (moderate). The different colored bonds represent the source of evidence for protein interactions, and the more bonds involved in biological functions, the more likely they are. The PLTP、PPP2R5A、SOCS5、APOC3、VARS2、ITGA6、PDGFD、BCAT1、ATP8A2、KCNMA1、ZFYVE28、CES4A and CTSH genes are not represented in the figure because they do not interact with each other or with other genes. The interaction among HADHA、ACAT1、ACAA1、HADHB、ACADS and ACADSB, FABP3, FABP4, and FABP7, FASN, OXSM, and MCAT are strongly supported by the data with very high intensity as can be seen from the figure. Secondly, SYK and PLCG1, TNF and JUN, PPAP2C and SPHK2, TBL1X and RXRA may also have shared functions between genes. Notably, MAPK3 has a strong interaction with several lipid metabolism-related genes (JUN, SMAD2, GH1, SPHK2, FASN, PTPRR, PLA2G4E, PLA2G4F, PLA2G4D, FGF1, and PLCG1), respectively, and may jointly play an important role in regulating milk lipid metabolism. The remaining genes also interacted with each other. Although the data support is relatively small, they still have some reference value.
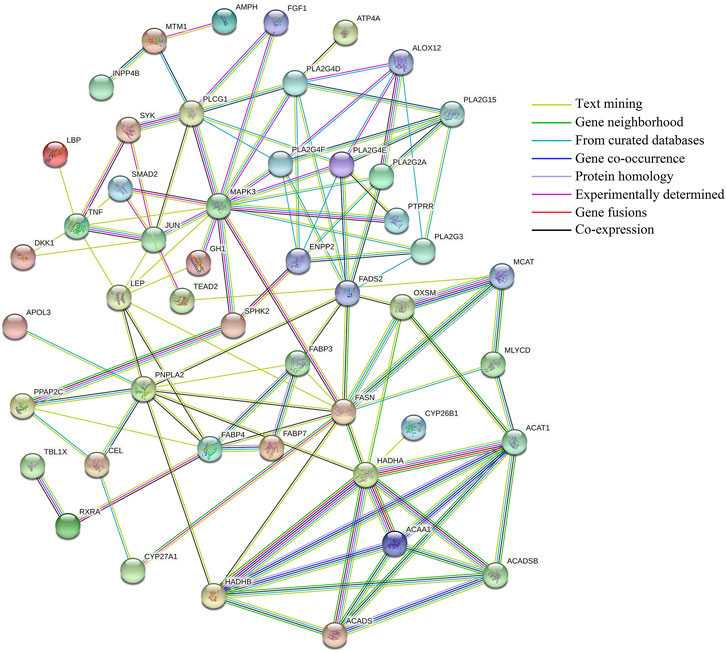
FIGURE 10. Protein interaction network analysis. Lines of different colors indicate different supporting evidence for protein interactions.
We randomly selected 8 DELs and 8 DEGs, analyzed their relative expression levels by qRT-PCR in high and low groups (three repeats), and converted the difference multiplea by log2FoldChange. As shown in Figure 11, the results of the qRT-PCR were consistent with those of RNA-seq, which confirmed the accuracy of transcriptome sequencing.
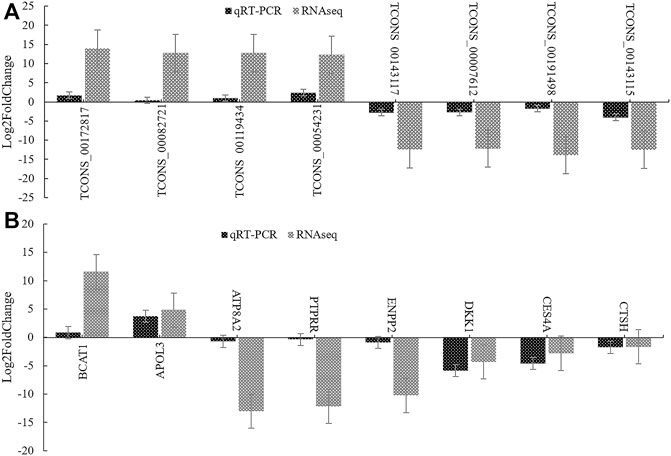
FIGURE 11. qRT-PCR verification of DEGs and DELs. (A): The verification result of DELs. (B): The verification result of DEGs. log2FoldChange is logarithm of fold change with a base of 2.
It has been confirmed that many genes are involved in the lactation initiation, maintenance and growth and development of the mammary gland through direct or indirect regulation, such as ErbB3, IL-8 and FGF2 (Bach et al., 2017; Williams et al., 2017; Dai et al., 2018). In this study, a total of 11 candidate DEGs related to lipid metabolism were screened and enriched in PI3K-Akt, MAPK, and Wnt lipid metabolism-related pathways (Kessenbrock et al., 2017; Bing et al., 2018). The downregulated ENPP2 gene is significantly enriched in BP, MF, and lipid metabolism-related pathways, and it has been shown that the lack of ENPP2 has a significant protective effect on hepatic steatosis, suggesting a possible role of ENPP2 gene in the metabolism of milk lipids (Brandon et al., 2019). Dong et al. (2020) found that the expression of PDGFD in adipose tissue of obese individuals was higher than that of lean individuals. In this study, PDGFD was also highly expressed in BMECs with high MFP; meanwhile, the downregulated gene KCNMA1 also showed a downregulated trend in white adipose tissue and hypertrophied adipocytes of mice on the high-fat diet (Nishizuka et al., 2016), which confirmed the reliability of sequencing, suggesting that PDGFD and KCNMA1 may play an important role in milk fat metabolism. BCAT1 is a branched-chain aminotransferase that has been shown to mainly affect MFP, milk protein percentage, and milk yield of dairy cows (Fang et al., 2014). CES4A has also been shown to be mainly involved in lipid metabolism (Holmes et al., 2010). However, how BCAT1 and CES4A regulate milk fat synthesis has not yet been reported This will be the focus of our future research. It is worth noting that the latest literature reportes that the differentially downregulated DKK1 related to lipid metabolism seems to play a significant role in promoting obesity in mice (Colditz et al., 2020), which is inconsistent with the results of this study. It may be related to different species or tissues in the study. Other lipid metabolism-related DEGs APOL3, ATP8A2, PTPRR, ZFYVE28, and CTSH have been reported to associate with kidney disease (Pays, 2021), nerve disease (Choi et al., 2019), ovarian cancer (Wang et al., 2019), glomerular filtration barrier (Zambrano et al., 2018) and atherosclerosis (Lim and Chow, 2006).
LncRNAs can regulate gene expression within 100 kb (cis), and can also change the expression of distant mRNAs (trans) (Guttman et al., 2009). The functional enrichment analysis of 38 target genes of DELs showed that 17 target genes (10 co-expression and seven co-localization) were enriched in lipid metabolism-related pathways. Among them, FABP3, FABP4, and FABP7 are trans-target genes. Studies have confirmed that these genes encode highly abundant fatty acid-binding proteins in bovine mammary glands and transport long-chain fatty acids to the endoplasmic reticulum to synthesize TAG (Bionaz and Loor, 2008). Protein interaction network analysis showed that the interactions between FABP3, FABP4, and FABP7 were also strongly supported by data, which further indicated that they may have similar functions and participate in common BP.
Based on bioinformatics analysis, a total of 18 candidate DELs that may affect milk fat synthesis in dairy cows were screened out. A lncRNA may target multiple genes related to lipid metabolism, and a gene may be regulated by multiple lncRNAs (Zheng et al., 2018). These results indicated that lncRNAs were diverse in regulating the function of target genes. In addition, some of the lipid metabolism-related target genes are also significantly upregulated or downregulated. The target genes expression trends are consistent with the DELs that may be targeted and regulated, which is consistent with the general mode of action of lncRNAs on genes (Cesana et al., 2011), and further reflects the accuracy of the sequencing results. It is worth noting that FABP4 is a gene encoding a highly rich fatty acid-binding proteins in the mammary gland, which may have a targeting relationship with TCONS _00082721 and TCONS _00172817 (Dong et al., 2020). Among all lncRNAs related to lipid metabolism, TCONS_00082721, TCONS_00119434, TCONS_00191498, TCONS_00007612, TCONS_ 00118412, and TCONS_00163391 are long intervening/intergenic noncoding RNAs (lincRNAs). Because lincRNAs do not overlap with exon sequences in organisms and show a higher degree of tissue specificity (Moran. et al., 2011) and disease specificity (Iyer et al., 2015). They are involved in chromatin modification, epigenetic regulation, genomic imprinting, transcriptional control, and mRNA processing before and after translation (Ulitsky and Bartel, 2013). Therefore, lincRNAs related to milk fat metabolism will be the focus of our subsequent studies. The lncRNAs that might regulate milk fat metabolism are predicted by co-localization and co-expression to be TCONS_00104103, TCONS_00162586, TCONS_00172817, TCONS_00082721, and TCONS_00143117. Interestingly, the lincRNA TCONS_00082721 with FABP4 as the candidate target gene is also a DELs that regulates milk fat metabolism predicted by the co-localization and co-expression. To clarify this hypothesis, it needs to be further verified in functional experiments. These findings will be of great significance for further research on the mechanism of milk fat synthesis in dairy cows.
As an important regulatory factor, miRNAs can change the expression of target mRNA and involve widely in various biological processes. In recent years, more and more studies have shown that lncRNAs have the function of sponge adsorption of miRNAs and can shield the inhibition or degradation of target genes by competitive binding of miRNAs. And rapidly upregulate its expression (Wang et al., 2018; Zhang and Lu, 2018). In this study, we first predicted the targeted differential miRNAs of DELs and then predicted the target genes of differential miRNAs. Thirty-four target genes related to lipid metabolism of differential miRNAs with DELs targeting relationship were screened out by GO/KEGG enrichment analysis.
Protein interaction network analysis showed that the target genes HADHA, HADHB, ACAA1, ACADS, ACADSB, and ACAT1 had a strong interaction relationship and might have common functions. HADHB is involved in the β-oxidation of fatty acids and catalyzes the second to fourth steps of the β-oxidation of fatty acid. The other five genes are acyltransferases or dehydrogenases, which play important regulatory roles in the β-oxidation of fatty acids (Fernándezhernando et al., 2011). Also, the interaction between FASN, OXSM, and MCAT genes is strongly supported by the data. FASN is an enzyme involved in fatty acid (FA) synthesis and plays a significant role in the formation of new adipogenesis in mammals. It has been found that the variation of FASN is related to a variety of dairy traits, including milk fat content, total milk solid content and peak milk yield, etc (Matsumoto et al., 2012); Shi et al. (2019) found that FASN variation can be used as a genetic marker to improve milk fat content and milk solid level of yaks. The co-overexpression of SCAP + SREBP1 will also lead to the increase in the abundance of FASN gene mRNA and the formation of lipid droplets (Han et al., 2018). In short, the current study on the FASN gene in the milk fat synthesis has been relatively mature at present. OXSM is a 3-oxyacyl -[acyl carrier protein] synthase. Xiong et al. (2020) found that OXSM has inhibitory effects on fat catabolism, fat anabolism, and fatty acid oxidation, and promotes glycerol transport and polyunsaturated fatty acid synthesis. MCAT is also an important gene involved in lipid metabolism (Ghadge et al., 2020). Therefore, there is an inevitable interaction between FASN, OXSM, and MCAT genes, and they all play a potential role together in the regulation of lipid metabolism. MAPK3 plays a major role in autophagy, and there is evidence that MAPK3 is involved in lipid metabolism (Xiao et al., 2016). We also found that the MAPK3 gene has a strong interaction with multiple lipid metabolism-related genes (JUN, SMAD2, GH1, SPHK2, FASN, PTPRR, PLA2G4E, PLA2G4F, PLA2G4D, FGF1, and PLCG1). It is speculated that this gene may play a crucial role in the lipid metabolism process, and the detailed mechanism needs further study.
Through functional analysis, a total of 156 milk fat metabolism-related ceRNAs were constructed in this study. Among the miRNAs targeted by DELs, miR-145 is significantly upregulated in the mammary gland of mid-lactation high milk fat cows (Xia et al., 2021) and has been shown to regulate lipid drop-formation and TAG accumulation in goat mammary epithelial cells (Wang et al., 2017). The regulatory network centered on miR-145 will be the focus of subsequent experimental research. Since TCONS_00082721 is a differential lincRNA predicted by co-localization and co-expression that may regulate milk fat metabolism, the competitive regulatory relationship between TCONS_00082721_miR-145_FASN and TCONS_ 00082721_miR-145_TNF will be further studied and cell experiments will be carried out to verify the interaction and function between them. The target gene predicted by TCONS_00172817 is FABP4 (Dong et al., 2020), which encodes a highly abundant fatty acid-binding protein in the mammary glands of dairy cows. These lncRNAs may regulate milk fat metabolism predicted by the co-localization and co-expression. Therefore, the ceRNAs regulatory network related to TCONS_00172817 is likely to be involved in the process of milk fat synthesis and needs attention. For non-lipid metabolism DELs,TCONS_00045874 and TCONS_00083670 may play a role in miR-145, regulating the expression of lipid metabolism-related genes FASN (Han et al., 2018) and TNF (Alexis et al., 2018). Among all the DELs related to lipid metabolism targeted differential miRNAs, bta-miR-2387 has the most abundant predicted target genes, which may be an important gene in the process of milk fat synthesis in dairy cows. Therefore, the ceRNAs regulatory network with bta-miR-2387 as the core will have more choices in functional verification of its interaction and function, and the possibility of success will also be greater. To sum up, the ceRNAs network analysis was performed on the transcriptome data (mRNA, miRNAs, lncRNAs) obtained from BMECs with high and low MFP. It provides a new way to understand the function of genes in the biological process of milk fat metabolism, and it also provides a new perspective for studying the lactation process of dairy cows.
In this study, 38 DELs and 47 DEGs were identified in BMECs, all DELs were newly identified. The identification of novel lncRNAs significantly expanded the repertoire of lncRNAs for dairy cows and consequently will help to understand the functions of the bovine lncRNAs. Eighteen lipid metabolism-related DELs and 11 lipid metabolism-related DEGs of were screened by functional enrichment analysis, while 156 ceRNAs interactions regulatory networks related to milk lipid metabolism were constructed, suggesting that ceRNAs may be involved in the lactation process. Our studies provides a new way to understand the gene functions in milk lipid metabolism in ruminant livestock.
All data generated or analyzed in this study are included in this article [and its Supplementary Material], and the datasets have been submitted to the SRA database with the accession number PRJNA730595. Access to the data of permanent link to https://www.ncbi.nlm.nih. gov/sra/PRJNA730595.
TM: Sample collection, data processing and article writing. HH: Sample collection, article modification and visualization. XF, YW, BY, JL, WW and JZ: Sample collection and verified by qRT-PCR. YM: Article grammar modification. YG: Conceptual analysis, writing-review and editing.
This project is supported by the special breeding project of high quality and high yield dairy cows in the Ningxia Autonomous region (Grant No: 2019NYYZ05) and modern agro-industry technology research system (CARS-36).
The authors declare that the research was conducted in the absence of any commercial or financial relationships that could be construed as a potential conflict of interest.
All claims expressed in this article are solely those of the authors and do not necessarily represent those of their affiliated organizations, or those of the publisher, the editors, and the reviewers. Any product that may be evaluated in this article, or claim that may be made by its manufacturer, is not guaranteed or endorsed by the publisher.
We would like to thank Wen Huiyu, Director of Maosheng pasture of He Lanshan in Ningxia state farm, for his support in collecting samples for this study.
The Supplementary Material for this article can be found online at: https://www.frontiersin.org/articles/10.3389/fgene.2022.772115/full#supplementary-material
BMECs, bovine mammary epithelial cells; BP, biological process; CC, cellular composition; DEGs, differentially expressed genes; DELs, differentially expressed lncRNAs; DHI, dairy herd improvement; FPKM, quantified using fragments per kilobase of exon per millions of reads; GO, gene ontology; KEGG, kyoto encyclopedia of genes and genomes; LncRNAs, long noncoding RNAs; lincRNA, long intervening/intergenic noncoding RNA; miRNAs, microRNAs; MFP, milk fat percentage; MF, molecular function; ncRNAs, non-coding RNAs; Padj, the corrected P-value; RNA-seq, RNA sequencing; qRT-PCR, quantitative real-time reverse transcription PCR; SCC, somatic cell count; TAG, triglyceride.
Alexis, S., Nagadhara, D., Philip, N., Donna, P., Ethan, K., Bradley, W., et al. (2018). ABCA1 Overexpression in Endothelial Cells In Vitro Enhances ApoAI-Mediated Cholesterol Efflux and Decreases Inflammation. Hum. Gene Ther. 30, 236–248. doi:10.1089/hum.2018.120
Bach, K., Pensa, S., Grzelak, M., Hadfield, J., Adams, D. J., Marioni, J. C., et al. (2017). Differentiation Dynamics of Mammary Epithelial Cells Revealed by Single-Cell RNA Sequencing. Nat. Commun. 8, 2128. doi:10.1038/s41467-017-02001-5
Bauman, D. E., Mather, I. H., Wall, R. J., and Lock, A. L. (2006). Major Advances Associated with the Biosynthesis of Milk. J. Dairy Sci. 89, 1235–1243. doi:10.3168/jds.s0022-0302(06)72192-0
Yang, B., Jiao, B., Ge, W., Zhang, X., Wang, S., Zhao, H., et al. (2018). Transcriptome Sequencing to Detect the Potential Role of Long Non-coding RNAs in Bovine Mammary Gland during the Dry and Lactation Period. BMC Genomics 19, 605. doi:10.1186/s12864-018-4974-5
Bionaz, M., and Loor, J. J. (2008). ACSL1, AGPAT6, FABP3, LPIN1, and SLC27A6 Are the Most Abundant Isoforms in Bovine Mammary Tissue and Their Expression Is Affected by Stage of Lactation. J. Nutr. 138, 1019–1024. doi:10.1093/jn/138.6.1019
Brandon, J. A., Kraemer, M., Vandra, J., Halder, S., Ubele, M., Morris, A. J., et al. (2019). Adipose-derived Autotaxin Regulates Inflammation and Steatosis Associated with Diet-Induced Obesity. Plos One 14, e0208099. doi:10.1371/journal.pone.0208099
Cesana, M., Cacchiarelli, D., Legnini, I., Santini, T., Sthandier, O., Chinappi, M., et al. (2011). A Long Noncoding RNA Controls Muscle Differentiation by Functioning as a Competing Endogenous RNA. Cell 147, 358–369. doi:10.1016/j.cell.2011.09.028
Tong, C., Chen, Q., Zhao, L., Ma, J., Ibeagha-Awemu, E. M., and Zhao, X. (2017). Identification and Characterization of Long Intergenic Noncoding RNAs in Bovine Mammary Glands. BMC Genomics 18, 468. doi:10.1186/s12864-017-3858-4
Chen, Z., Chu, S., Wang, X., Fan, Y., Zhan, T., Arbab, A. A. I., et al. (2019). microRNA-106b Regulates Milk Fat Metabolism via ATP Binding Cassette Subfamily A Member 1 (ABCA1) in Bovine Mammary Epithelial Cells. J. Agric. Food Chem. 67, 3981–3990. doi:10.1021/acs.jafc.9b00622
Choi, H., Andersen, J. P., and Molday, R. S. (2019). Expression and Functional Characterization of Missense Mutations in ATP8A2 Linked to Severe Neurological Disorders. Hum. Mutat. 40, 2353–2364. doi:10.1002/humu.23889
Colditz, J., Picke, A. K., Hofbauer, L. C., and Rauner, M. (2020). Contributions of Dickkopf-1 to Obesity-Induced Bone Loss and Marrow Adiposity. JBMR Plus 4, e10364. doi:10.1002/jbm4.10364
Dai, W.-t., Zou, Y.-x., White, R. R., Liu, J.-x., and Liu, H.-y. (2018). Transcriptomic Profiles of the Bovine Mammary Gland during Lactation and the Dry Period. Funct. Integr. Genomics 18, 125–140. doi:10.1007/s10142-017-0580-x
Dong, K., Yang, M., Han, J., Ma, Q., Han, J., Song, Z., et al. (2020). Genomic Analysis of Worldwide Sheep Breeds Reveals PDGFD as a Major Target of Fat-Tail Selection in Sheep. BMC Genomics 21, 800–819. doi:10.1186/s12864-020-07210-9
Duan, A. Q., Pang, C. Y., Zhu, P., Deng, T. X., Lu, X. R., Ma, X. Y., et al. (2017). Isolation, Culture and Identification of buffalo Mammary Epithelial Cells from Milk. China Anim. Husb. Vet. Med. 44, 3243–3249. doi:10.16431/j.cnki.1671-7236.2017.11.019
Fang, M., Fu, W., Jiang, D., Zhang, Q., Sun, D., Ding, X., et al. (2014). A Multiple-SNP Approach for Genome-wide Association Study of Milk Production Traits in Chinese Holstein Cattle. Plos One 9, e99544. doi:10.1371/journal.pone.0099544
Fatica, A., and Bozzoni, I. (2014). Long Non-coding RNAs: New Players in Cell Differentiation and Development. Nat. Rev. Genet. 15, 7–21. doi:10.1038/nrg3606
Fernández-Hernando, C., Suárez, Y., Rayner, K. J., and Moore, K. J. (2011). MicroRNAs in Lipid Metabolism. Curr. Opin. Lipidol. 22, 86–92. doi:10.1097/mol.0b013e3283428d9d
Ghadge, A. A., Harsulkar, A. M., Diwan, A. G., and Kuvalekar, A. A. (2020). Gender Dependent Differences in Lipid Metabolism in Individuals with Type 2 Diabetes Mellitus. J. Diabetes Metab. Disord. 19, 967–977. doi:10.1007/s40200-020-00589-y
Guttman, M., Amit, I., Garber, M., French, C., Lin, M. F., Feldser, D., et al. (2009). Chromatin Signature Reveals over a Thousand Highly Conserved Large Non-Coding RNAs in Mammals. Nature 458, 223–227. doi:10.1038/nature07672
Han, L. Q., Gao, T. Y., Yang, G. Y., and Loor, J. J. (2018). Overexpression of SREBF Chaperone (SCAP) Enhances Nuclear SREBP1 Translocation to Upregulate Fatty Acid Synthase (FASN) Gene Expression in Bovine Mammary Epithelial Cells. J. Dairy Sci. 101, 6523–6531. doi:10.3168/jds.2018-14382
Holmes, R. S., Wright, M. W., Laulederkind, S. J. F., Cox, L. A., Hosokawa, M., Imai, T., et al. (2010). Recommended Nomenclature for Five Mammalian Carboxylesterase Gene Families: Human, Mouse, and Rat Genes and Proteins. Mamm. Genome 21, 427–441. doi:10.1007/s00335-010-9284-4
Hu, H., Wang, J., Bu, D., Wei, H., Zhou, L., Li, F., et al. (2009). In Vitro Culture and Characterization of a Mammary Epithelial Cell Line from Chinese Holstein Dairy Cow. Plos One 4, e7636. doi:10.1371/journal.pone.0007636
Iyer, M. K., Niknafs, Y. S., Malik, R., Singhal, U., Sahu, A., Hosono, Y., et al. (2015). The Landscape of Long Noncoding RNAs in the Human Transcriptome. Nat. Genet. 47, 199–208. doi:10.1038/ng.3192
Jan, K., and Marc, R. (2006). RNAhybrid: microRNA Target Prediction Easy, Fast and Flexible. Nucleic Acids Res. 34, 451–454.
John, B., Enright, A. J., Aravin, A., Tuschl, T., Sander, C. C., and Marks, D. S. (2004). Human microRNA Targets. Plos Biol. 2, e363. doi:10.1371/journal.pbio.0020363
Kessenbrock, K., Smith, P., Steenbeek, S. C., Pervolarakis, N., Kumar, R., Minami, Y., et al. (2017). Diverse Regulation of Mammary Epithelial Growth and Branching Morphogenesis through Noncanonical Wnt Signaling. Proc. Natl. Acad. Sci. USA 114, 3121–3126. doi:10.1073/pnas.1701464114
Li, D., Xie, X., Jie, W., Bian, Y., Li, Q., Gao, X., et al. (2015). MiR-486 Regulates Lactation and Targets the PTEN Gene in Cow Mammary Glands. Plos One 10, e118284. doi:10.1371/journal.pone.0118284
Lim, W., and Chow, V. (2006). Gene Expression Profiles of U937 Human Macrophages Exposed to Chlamydophila Pneumoniae And/or Low Density Lipoprotein in Five Study Models Using Differential Display and Real-Time RT-PCR. Biochimie 88, 367–377. doi:10.1016/j.biochi.2005.11.001
Lu, C., Yang, R., Liu, B., Li, Z., Zhao, Z., Shen, B., et al. (2012). Establishment of Two Types of Mammary Epithelial Cell Lines from Chinese Holstein Dairy Cow. J. Anim. Vet. Adv. 11, 1166–1172. doi:10.3923/javaa.2012.1166.1172
Ma, Q., Li, L., Tang, Y., Fu, Q., Liu, S., Hu, S., et al. (2017). Analyses of Long Non-coding RNAs and mRNA Profiling through RNA Sequencing of MDBK Cells at Different Stages of Bovine Viral Diarrhea Virus Infection. Res. Vet. Sci. 115, 508–516. doi:10.1016/j.rvsc.2017.09.020
Matsumoto, H., Inada, S., Kobayashi, E., Abe, T., Hasebe, H., Sasazaki, S., et al. (2012). Identification of SNPs in the FASN Gene and Their Effect on Fatty Acid Milk Composition in Holstein Cattle. Livestock Sci. 144, 281–284. doi:10.1016/j.livsci.2011.12.003
Moran, N. C., Cole, T., Loyal, G., Magdalena, K., Barbara, T. V., Aviv, R., et al. (2011). Integrative Annotation of Human Large Intergenic Noncoding RNAs Reveals Global Properties and Specific Subclasses. Gene Dev. 25, 1915–1927. doi:10.1101/gad.17446611
Mu, T., Hu, H. H., Ma, Y. F., Feng, X. F., Zhang, J., and Gu, Y. L. (2021). Regulation of Key Genes for Milk Fat Synthesis in Ruminants. Front. Nutr. 8, 963. doi:10.3389/fnut.2021.765147
Nishizuka, M., Horinouchi, W., Yamada, E., Ochiai, N., Osada, S., and Imagawa, M. (2016). KCNMA1, a Pore-Forming α-subunit of BK Channels, Regulates Insulin Signalling in Mature Adipocytes. Febs Lett. 590, 4372–4380. doi:10.1002/1873-3468.12465
Pays, E. (2021). The Function of Apolipoproteins L (APOLs): Relevance for Kidney Disease, Neurotransmission Disorders, Cancer and Viral Infection. FEBS J. 288, 360–381. doi:10.1111/febs.15444
Shen, B., Zhang, L., Lian, C., Lu, C., Zhang, Y., Pan, Q., et al. (2016). Deep Sequencing and Screening of Differentially Expressed microRNAs Related to Milk Fat Metabolism in Bovine Primary Mammary Epithelial Cells. Ijms 17, 200. doi:10.3390/ijms17020200
Shi, B., Jiang, Y., Chen, Y., Zhao, Z., Zhou, H., Luo, Y., et al. (2019). Variation in the Fatty Acid Synthase Gene (FASN) and its Association with Milk Traits in Gannan Yaks. Animals 9, 613. doi:10.3390/ani9090613
Smyth, G. K., Robinson, M. D., and McCarthy, D. J. (2010). edgeR: A Bioconductor Package for Differential Expression Analysis of Digital Gene Expression Data. Bioinformatics 26, 139–140. doi:10.1093/bioinformatics/btp616
Ulitsky, I., and Bartel, D. P. (2013). lincRNAs: Genomics, Evolution, and Mechanisms. Cell 154, 26–46. doi:10.1016/j.cell.2013.06.020
Wang, H., Shi, H., Luo, J., Yi, Y., Yao, D., Zhang, X., et al. (2017). MiR-145 Regulates Lipogenesis in Goat Mammary Cells via TargetingINSIG1and Epigenetic Regulation of Lipid-Related Genes. J. Cel. Physiol. 232, 1030–1040. doi:10.1002/jcp.25499
Wang, R., Zhang, S., Chen, X., Li, N., Li, J., Jia, R., et al. (2018). CircNT5E Acts as a Sponge of miR-422a to Promote Glioblastoma Tumorigenesis. Cancer Res. 78, 4812–4825. doi:10.1158/0008-5472.can-18-0532
Wang, Y., Cao, J., Liu, W., Zhang, J., Wang, Z., Zhang, Y., et al. (2019). Protein Tyrosine Phosphatase Receptor Type R (PTPRR) Antagonizes the Wnt Signaling Pathway in Ovarian Cancer by Dephosphorylating and Inactivating β-Catenin. J. Biol. Chem. 294, 18306–18323. doi:10.1074/jbc.ra119.010348
Williams, M. M., Vaught, D. B., Joly, M. M., Hicks, D. J., Sanchez, V., Owens, P., et al. (2017). ErbB3 Drives Mammary Epithelial Survival and Differentiation during Pregnancy and Lactation. Breast Cancer Res. 19, 105. doi:10.1186/s13058-017-0893-7
Xia, L., Zhao, Z., Yu, X., Lu, C., Jiang, P., Yu, H., et al. (2021). Integrative Analysis of miRNAs and mRNAs Revealed Regulation of Lipid Metabolism in Dairy Cattle. Funct. Integr. Genomics 21, 393–404. doi:10.1007/s10142-021-00786-9
Xiao, Y., Liu, H., Yu, J., Zhao, Z., Xiao, F., Xia, T., et al. (2016). MAPK1/3 Regulate Hepatic Lipid Metabolism via ATG7-dependent Autophagy. Autophagy 12, 592–593. doi:10.1080/15548627.2015.1135282
Xiong, L., Pei, J., Wu, X., Kalwar, Q., Liang, C., Guo, X., et al. (2020). The Study of the Response of Fat Metabolism to Long-Term Energy Stress Based on Serum, Fatty Acid and Transcriptome Profiles in Yaks. Animals 10, 1150. doi:10.3390/ani10071150
Xu, B., Gerin, I., Miao, H., Vu-Phan, D., Johnson, C. N., Xu, R., et al. (2010). Multiple Roles for the Non-Coding RNA SRA in Regulation of Adipogenesis and Insulin Sensitivity. Plos One 5, e14199. doi:10.1371/journal.pone.0014199
Xu, J., Feng, L., Han, Z., Li, Y., Wu, A., Shao, T., et al. (2016). Extensive ceRNA-ceRNA Interaction Networks Mediated by miRNAs Regulate Development in Multiple Rhesus Tissues. Nucleic Acids Res. 44, 9438–9451. doi:10.1093/nar/gkw587
Yeong-Hwan, L., Duk-Hwa, K., Jaetaek, K., Jin, P. W., Hyun, K., Young-Kook, K., et al. (2018). Identification of Long Noncoding RNAs Involved in Muscle Differentiation. Plos One 13, e193898. doi:10.1371/journal.pone.0193898
Yu, S., Zhao, Y., Lai, F., Chu, M., Hao, Y., Feng, Y., et al. (2017). LncRNA as ceRNAs May Be Involved in Lactation Process. Oncotarget 8, 98014–98028. doi:10.18632/oncotarget.20439
Zambrano, S., Rodriguez, P. Q., Guo, J., Möller-Hackbarth, K., Schwarz, A., and Patrakka, J. (2018). FYVE Domain-Containing Protein ZFYVE28 Regulates EGFR-Signaling in Podocytes but Is Not Critical for the Function of Filtration Barrier in Mice. Sci. Rep. 8, 4712. doi:10.1038/s41598-018-23104-z
Zhang, H., and Lu, W. (2018). LncRNA SNHG12 Regulates Gastric Cancer Progression by Acting as a Molecular Sponge of miR-320. Mol. Med. Rep. 17, 2743–2749. doi:10.3892/mmr.2017.8143
Keywords: Holstein cattle, lncRNAs, gene, conjoint analysis, milk fat percentage
Citation: Mu T, Hu H, Feng X, Ma Y, Wang Y, Liu J, Yu B, Wen W, Zhang J and Gu Y (2022) Screening and Conjoint Analysis of Key lncRNAs for Milk Fat Metabolism in Dairy Cows. Front. Genet. 13:772115. doi: 10.3389/fgene.2022.772115
Received: 07 September 2021; Accepted: 05 January 2022;
Published: 03 February 2022.
Edited by:
Ying Yu, China Agricultural University, ChinaReviewed by:
Juliana Afonso, Embrapa Pecuária Sudeste, BrazilCopyright © 2022 Mu, Hu, Feng, Ma, Wang, Liu, Yu, Wen, Zhang and Gu. This is an open-access article distributed under the terms of the Creative Commons Attribution License (CC BY). The use, distribution or reproduction in other forums is permitted, provided the original author(s) and the copyright owner(s) are credited and that the original publication in this journal is cited, in accordance with accepted academic practice. No use, distribution or reproduction is permitted which does not comply with these terms.
*Correspondence: Yaling Gu, Z3V5bEBueHUuZWR1LmNu
†These authors have contributed equally to this work and share first authorship
Disclaimer: All claims expressed in this article are solely those of the authors and do not necessarily represent those of their affiliated organizations, or those of the publisher, the editors and the reviewers. Any product that may be evaluated in this article or claim that may be made by its manufacturer is not guaranteed or endorsed by the publisher.
Research integrity at Frontiers
Learn more about the work of our research integrity team to safeguard the quality of each article we publish.