 Shiyu Zhang
 Huiying Yang
95% of researchers rate our articles as excellent or good
Learn more about the work of our research integrity team to safeguard the quality of each article we publish.
Find out more
ORIGINAL RESEARCH article
Front. Genet. , 26 January 2022
Sec. Human and Medical Genomics
Volume 13 - 2022 | https://doi.org/10.3389/fgene.2022.765569
This article is part of the Research Topic Biomedical Image or Genomic Data Characterization and Radiogenomic/Image-omics View all 16 articles
Background: Biglycan (BGN) plays a role in the occurrence and progression of several malignant tumors, though its role in gastric cancer (GC) remains unclear. The objective of this study was to investigate BGN expression, its role in GC prognosis, and immune infiltration.
Material and Methods: Gene expression data and corresponding clinical information were downloaded from TCGA and GTEx, respectively. We compared the expression of BGN in GC and normal tissues and verified the differential expression via Real-Time PCR and immunohistochemistry. BGN-related differentially expressed genes (DEGs) were identified. Additionally, the relationships between BGN gene expression and clinicopathological variables and survival in patients with GC were also investigated through univariate and multivariate Cox regression analyses. Finally, we established a predictive model that could well predict the probability of 1-, 3-, and 5-years survival in GC.
Results: We found a significantly higher expression of BGN in GC than that in normal tissues (p < 0.001), which was verified by Real-Time PCR (p < 0.01) and immunohistochemistry (p < 0.001). The 492 identified DEGs were primarily enriched in pathways related to tumor genesis and metastasis, including extracellular matrix (ECM)-receptor interaction, focal adhesion pathway, Wnt signaling, and signaling by VEGF. BGN expression was positively correlated with the enrichment of the NK cells (r = 0.620, p < 0.001) and macrophages (r = 0.550, p < 0.001), but negatively correlated with the enrichment of Th17 cells (r = 0.250, p < 0.001). BGN expression was also significantly correlated with histologic grade (GI&G2 vs. G3, p < 0.001), histologic type (Diffuse type vs. Tubular type, p < 0.001), histologic stage (stage I vs. stage II and stage I vs. stage III, p < 0.001), T stage (T1 vs. T2, T1 vs. T3, and T1 vs. T4, p < 0.001) and Helicobacter pylori (HP) infection (yes vs. no, p < 0.05) in GC. High BGN expression showed significant association with poor overall survival (OS) in GC patients (HR = 1.53 (1.09–2.14), p = 0.013). The constructed nomogram can well predict the 1-, 3-, and 5-years overall survival probability of GC patients (C-index = 0.728).
Conclusion: BGN plays an important role in the occurrence and progression of GC and is a potential biomarker for the diagnosis and treatment of GC.
Gastric cancer (GC) is considered to be the fifth most common malignancy and the third leading cause of cancer-related deaths (Chen et al., 2016; Bray et al., 2018) worldwide. Disappointingly, most patients with stomach cancer are diagnosed with advanced cancer because they lack specific symptoms (Van Cutsem et al., 2016). Because of the poor prognosis of patients with advanced GC, it is imperative to develop new strategies to improve the survival rate of this disease.
Expression of BGN (Biglycan), the gene as proteoglycan-I, was first detected in bone tissue (Gallagher, 1989). BGN is a member of the small leucine-rich proteoglycans (SLPRs) gene family and encodes a protein core that is modified to form a glycoprotein (Chen et al., 2020). BGN is a key component of the ECM; it participates in scaffolding the collagen fibrils and mediates cell signaling (Appunni et al., 2021). Existing studies have demonstrated the role of BGN in tumor proliferation, adhesion and invasion (Cooper and Giancotti, 2019; Hisamatsu et al., 2020; Moreno-Layseca et al., 2019; Yousefi et al., 2021). BGN could induce the epithelial-mesenchymal transition (EMT) of diverse malignancies and is necessary and sufficient to mediate the pro-EMT effect in pancreatic ductal adenocarcinoma (Thakur et al., 2016). BGN is regulated by the transforming growth factor-beta (TGFB) signaling pathway, a key regulator of the EMT process (Yang et al., 2021). Moreover, BGN is believed to enhance the ability of endometrial cancer cells to migrate and invade tissue (Sun et al., 2016) and is also considered a potential EMT biomarker of colorectal cancer (Li et al., 2017). Existing research findings strongly suggest an important role of BGN in the development of tumors. Immunotherapy of tumors has been one of the hot topics in recent years. Several studies have documented significant effects of immunotherapy on tumors (Zhang et al., 2015; Marrelli et al., 2016; Shitara et al., 2019); however, there is no report on immunotherapy of BGN in GC. Moreover, the role of BGN in the prognosis of GC and how BGN affects the immune infiltration of GC remain poorly understood.
In this study, we analyzed the difference in BGN expression between GC and normal patients in the online database by bioinformatics analysis. Thereafter, differentially expressed genes (DEGs) associated with BGN were identified. DEG-related functional enrichment analysis, Gene Set Enrichment Analysis (GSEA) analysis, and immune infiltration analysis were also carried out. We also explored the relationship between BGN gene expression and clinicopathological variables and survival in patients with GC. Finally, a predictive model that could well predict the probability of 1-, 3-, and 5-years survival in GC was established.
Gene expression data and corresponding clinical information for GC, which included 375 tumor tissues and 32 normal tissues, were downloaded from The Cancer Genome Atlas (TCGA) database (https://portal.gdc.cancer.gov/). Table 1, Table 2 shows the characteristics of patients with GC from the TCGA database. The gene expression of 174 normal tissues was downloaded from GTEx through UCSC XENA (http://xena.ucsc.edu). Fragments Per kilobase per Million (FPKM) RNAseq data were converted into transcripts Per Million reads (TPM), and log2 translated for subsequent analysis. All tissue samples with incomplete clinical data were excluded.
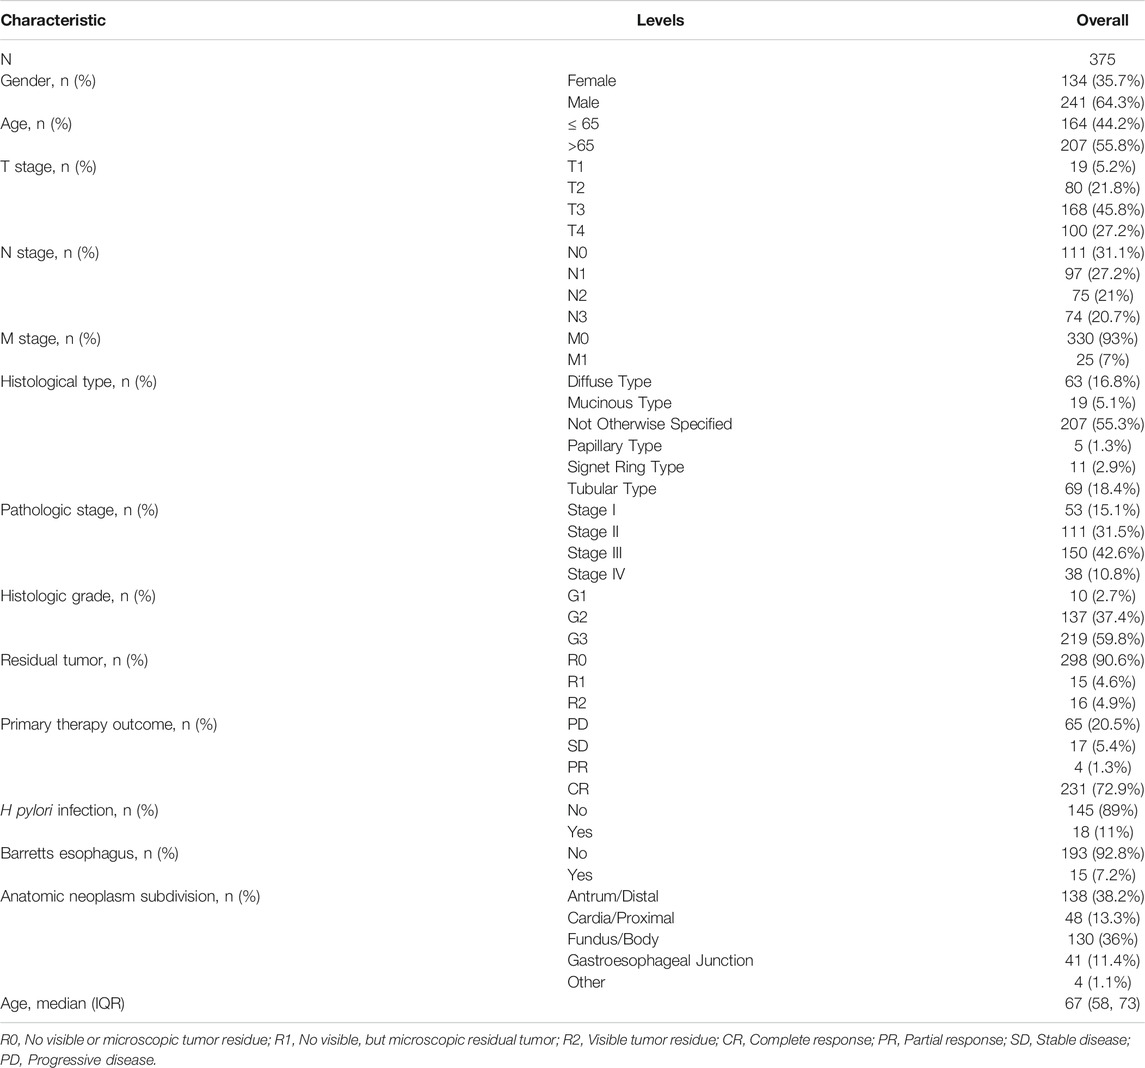
TABLE 1. The clinical characteristic of Gastric Cancer.
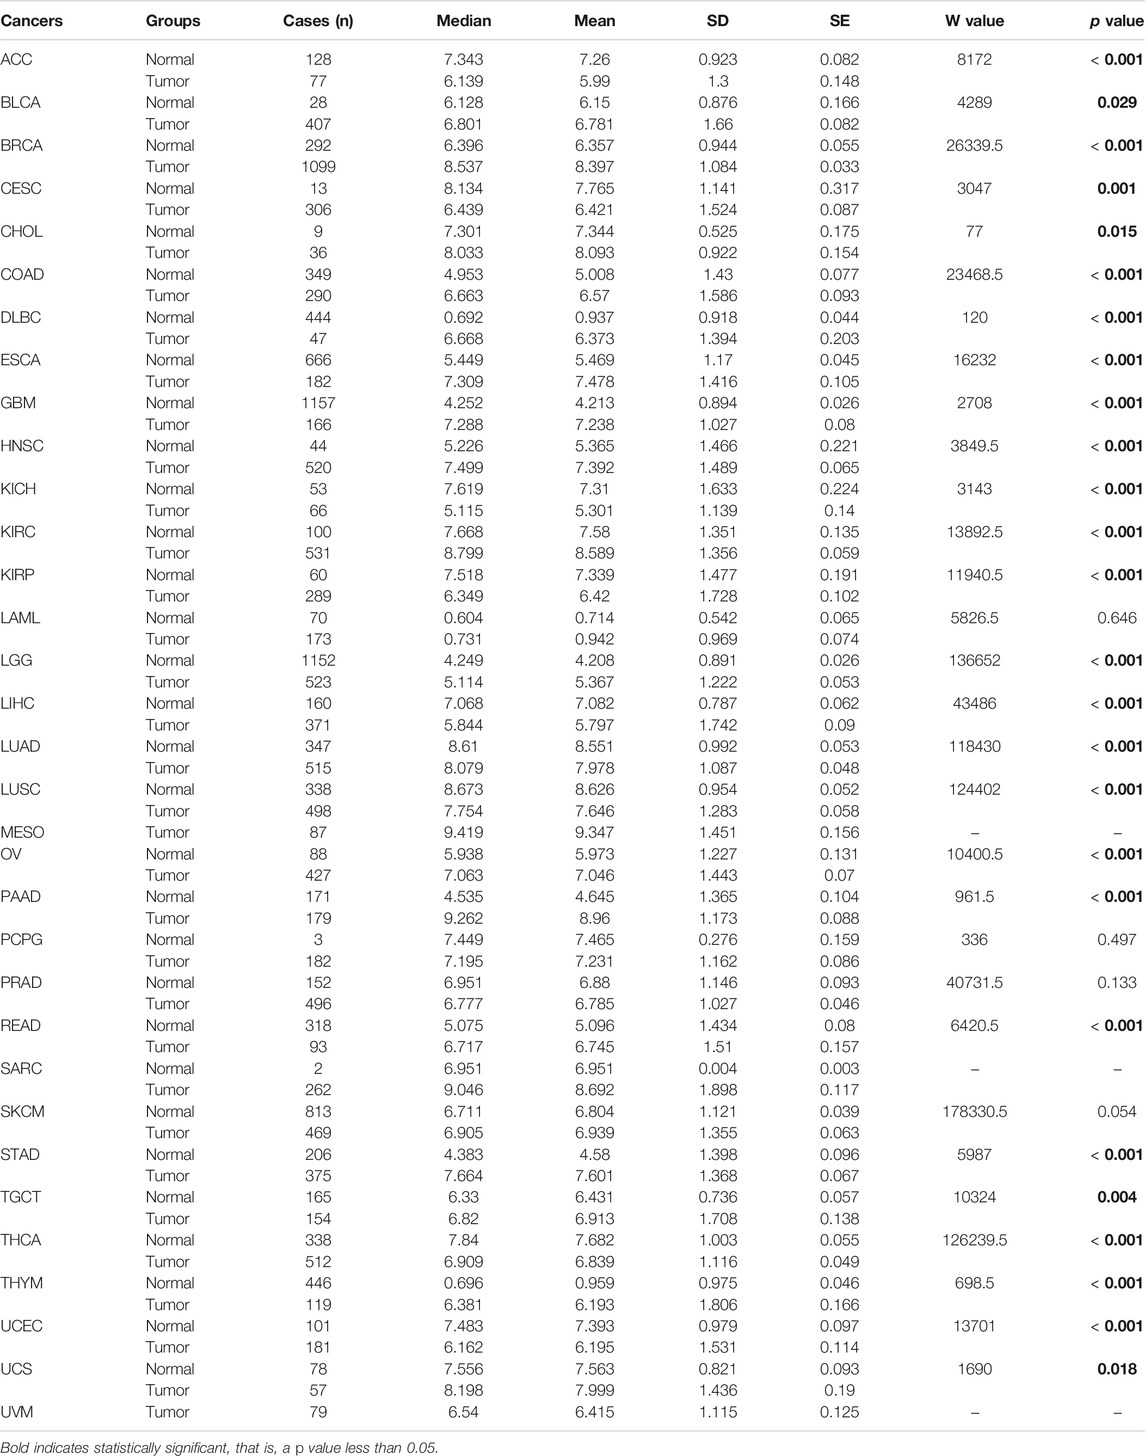
TABLE 2. BGN expression levels in 33 cancers and normal tissues.
We downloaded TPM RNAseq data for tumor tissues (TCGA) and normal tissues (TCGA and GTEx) from the UCSC XENA. The differential expression between tumor and normal tissues was tested by Wilcoxon Rank Sum Test and visualized through boxplots and scatter plots. We also used Receiver Operating Characteristic (ROC) curve to determine the diagnostic value of BGN gene expression for GC.
Tumor and para-cancer biopsy tissues were collected from 12 consecutive patients that were diagnosed with GC for the first time from the Endoscopy Center of the First Affiliated Hospital of Guangxi Medical University. The body tissues were immediately immersed in RNA protection solution and rapidly stored in a refrigerator at −80°C. No patient was diagnosed with any other malignancy, nor had they received any treatment for the tumor.
Total RNA of tissues was extracted using Trizol reagent (R0016, Beyotime Biotechnology Co., Ltd., Shanghai, China, according to the manufacturer’s instructions. Complementary DNAs(cDNAs) were generated from 1 µg RNA PrimeScript™ RT Reagent Kit with gDNA Eraser (RR047A, Takara Bio, Inc.). RT-PCR was conducted via the FastStart Universal SYBR Green Master (ROX) (Roche) in the Applied Biosystems QuantStudio TM Real-PCR System (Q6). Human BGN primers were utilized, and the relative mRNA expression was determined using the comparative Ct method with Glyceraldehyde 3-phosphate dehydrogenase (GAPDH) as the reference gene. The primer sequences were as follows:
BGN-forward: 5′-TGACTGGCATCCCCAAAGAC-3′
BGN-reverse: 5′-GAGTAGCGAAGCAGGTCCTC-3′
GAPDH-forward: 5′-GTCAGCCGCATCTTCTTT-3′
GAPDH-reverse: 5′-CGCCCAATACGACCAAAT-3′
From January 2018 to September 2020, the tumors and adjacent tissues of 80 consecutive patients with GC after surgery in Suqian First People’s Hospital were collected. Patients who had received radiation or chemotherapy prior to surgery and had other malignancies were excluded from the study. After dewaxing, hydration, and thermal repair, the primary antibody against BGN (ab209234, Abcam, 1:2000) was incubated overnight at 4°C followed by incubation with detection polymer for 40 min at room temperature. 3,3′-Diaminobenzidine DAB (P0202, Beyotime Biotechnology co.) was used for signal detection. The images taken under the microscope were analyzed using the IHC profiler plugin of ImageJ software (Varghese et al., 2014). Finally, SPSS version 23.0 software was used to statistic the results.
According to the mean value of BGN expression, the data from the TCGA cohort were divided into high expression group and low expression group, and the DESeq2 package (Love et al., 2014) was used for differential analysis. DEGs were defined as having a p.adj <0.05 and |logFC| >1.5. The details of the DEGs were visualized using the volcano map.
After ID conversion of identified DEGs via or.Hs.eg.db package, further functional enrichment analysis was performed through clusterProfiler package (Yu et al., 2012). Enrichments that satisfied the following conditions were considered significant: p.adj<0.05, and q-value<0.2. DEGs results were employed for gene-set enrichment analyses (GSEA) and building gene-set enrichment plots against the Molecular Signatures Database (MSigDB) hallmark gene sets through the R package, clusterProfiler, and significance was set as an adjusted p < 0.05 and FDR<0.25.
After converting the level 3 HTSe1-FPKM format RNAseq data from the stomach adenocarcinoma (STAD) project of TCGA to TPM format, log2 conversion was performed. After normal tissue samples were removed, data from a total of 375 STAD samples were retained for subsequent analysis. The relative tumor infiltration levels of immune cell types were quantified using ssGSEA of clusterProfilerpackage (Yu et al., 2012) to quantify the relative tumor infiltration levels of immune cell types, and the marker genes of immune cell types for single-sample gene-set enrichment analysis (ssGSEA) were obtained from published signature gene lists (Bindea et al., 2013). Spearman’s Correlation Test was adopted to determine a correlation between BGN and the immune infiltration levels and the association of immune infiltration with the different expression groups of BGN.
For TCGA data, Wilcoxon signed Rank-Sum test and logistic regression analyses were used to evaluate the relationship between BGN expression and clinicopathological variables. Moreover, univariate and multivariate Cox regression analyses were used to compare the effects of BGN expression and other clinicopathological variables on the overall survival of GC patients. Multivariate Cox regression analysis was used to examine the independent factors affecting the prognosis of GC.
Furthermore, we collected clinicopathological data from 80 patients who underwent immunohistochemistry to evaluate the relationship between BGN expression and clinicopathological variables. Chi-square tests were used to evaluate the relationship between gender, pathological type, residual tumor status, and BGN expression. Fisher’s exact tests were used to evaluate the relationship between pathologic stage, T stage, N stage, primary treatment outcome, and BGN expression. Wilcoxon signed Rank-Sum test was used to evaluate the relationship between age and BGN expression.
The identified independent factors associated with GC prognosis were used to construct a nomogram that predicted the probability of 1-, 3-, and 5-years survival in patients with GC. The prognostic data were obtained from a study by Jianfang Liu(Liu et al., 2018). Nomogram was constructed by R package with the survival and rms package. The Harrell’s concordance index (C-index) was used to quantify the predictive accuracy, which ranges from 0.5 (no predictive power) to 1 (perfect prediction). Furthermore, calibration plots were generated to examine the performance characteristics of the predictive nomogram.
Significant differential expression of BGN was documented in most of the 33 cancers, including in STAD (Figure 1A). The expression of BGN in GC (375 cases from TCGA) was significantly higher than in normal tissues (32 para-cancer tissues from TCGA and 174 normal tissues from GTEx) (p < 0.001) (Figure 1B). Similarly, the comparison of 27 tumor tissues in TCGA with the corresponding para-cancer tissues also showed significant expression of BGN in tumor tissues (Figure 1C).
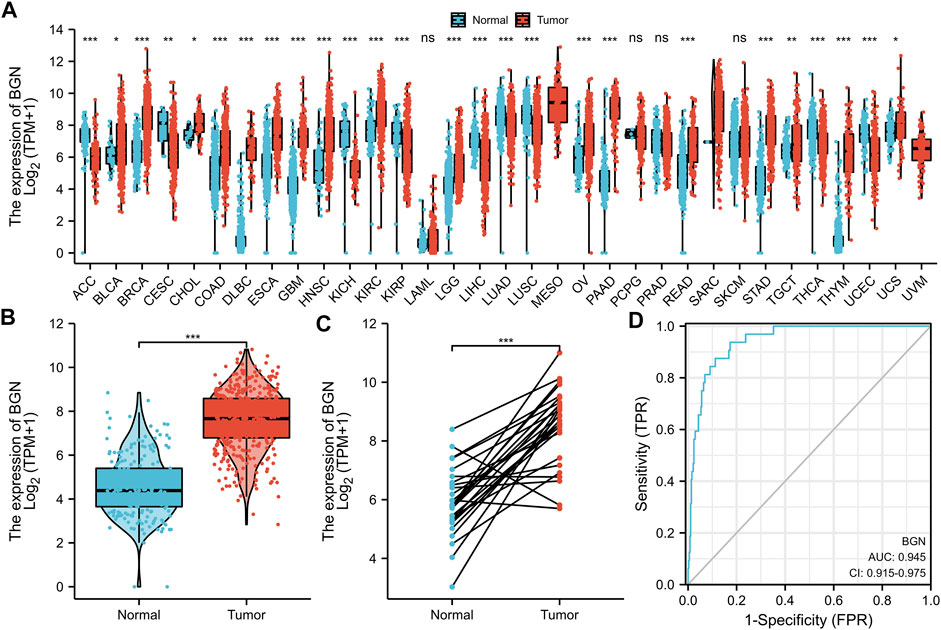
FIGURE 1. Differential expression of BGN in different tumors and BGN-related differentially expressed genes (DEGs). (A) Differential expression of BGN of different cancers compared with normal tissues in the TCGA and GTEx database. (B,C) Differential expression of BGN in STAD. (D) ROC curve was used to calculate the diagnostic predictive value of BGN expression between STAD and normal tissues. Significance marker: ns, p ≥ 0.05; *, p < 0.05; **, p < 0.01; ***, p < 0.001. The abbreviations for 33 cancers are as follows: Adrenocortical carcinoma (ACC); Bladder Urothelial Carcinoma (BLCA); Breast invasive carcinoma (BRCA); Cervical squamous cell carcinoma and endocervical adenocarcinoma (CESC); Cholangiocarcinoma (CHOL); Colon adenocarcinoma (COAD); Lymphoid Neoplasm Diffuse Large B-cell Lymphoma (DLBC); Esophageal carcinoma (ESCA); Glioblastoma multiforme (GBM); Head and Neck squamous cell carcinoma (HNSC); Kidney Chromophobe (KICH); Kidney renal clear cell carcinoma (KIRC); Kidney renal papillary cell carcinoma (KIRP); Acute Myeloid Leukemia (LAML); Brain Lower Grade Glioma (LGG); Liver hepatocellular carcinoma (LIHC); Lung adenocarcinoma (LUAD); Mesothelioma (MESO); Ovarian serous cystadenocarcinoma (OV); Pancreatic adenocarcinoma (PAAD); Pheochromocytoma and Paraganglioma (PCPG); Prostate adenocarcinoma (PRAD); Rectum adenocarcinoma (READ); Sarcoma (SARC); Skin Cutaneous Melanoma (SKCM); Testicular Germ Cell Tumors (TGCT); Thyroid carcinoma (THCA); Thymoma (THYM); Uterine Corpus Endometrial Carcinoma (UCEC); Uterine Carcinosarcoma (UCS); Uveal Melanoma (UVM).
Furthermore, based on the expression profile of TCGA in tumor and normal tissues, a ROC curve of BGN for the diagnosis of GC was plotted. Figure 1D shows that in the prediction of tumor and normal outcomes, the variable BGN showed high accuracy (AUC = 0.945, CI = 0.915–0.975).
We further verified the BGN expression level using RT-PCR (Figure 2E, p = 0.0068) and IHC (Figures 2A–D). The results were consistent with those in the TCGA database, indicating significantly higher levels of BGN expression in GC than that in normal tissues.
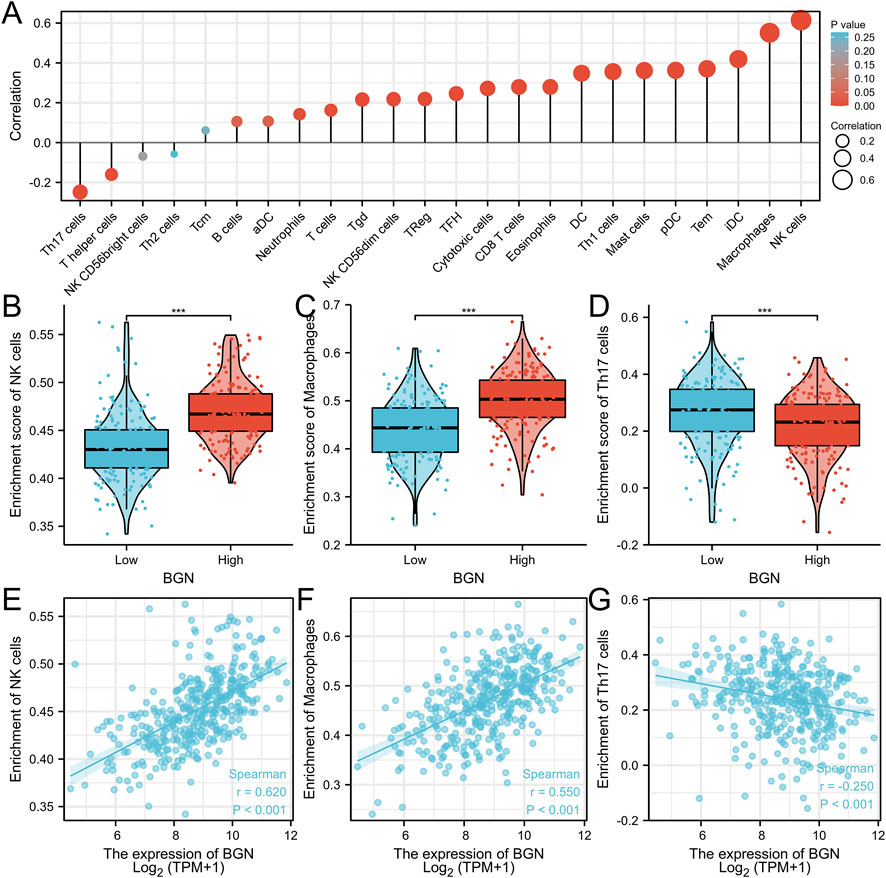
FIGURE 2. The results of Real-Time PCR and Immunohistochemistry. (A) BGN expression in normal tissue (200X). (B) BGN expression in gastric cancer tissue (400X). (C) BGN expression in normal tissue (200X). (D) BGN expression in gastric cancer tissue (400X). (E) Relative BGN mRNA level in normal and GC tissues. GC: Gastric cancer. **, p < 0.01.
The volcano map shows the expression of identified DEGs between groups with high and low BGN expression (Figure 3A). of all the 492 DEGs. Of them, 207 were up-regulated, and 285 were down-regulated genes.
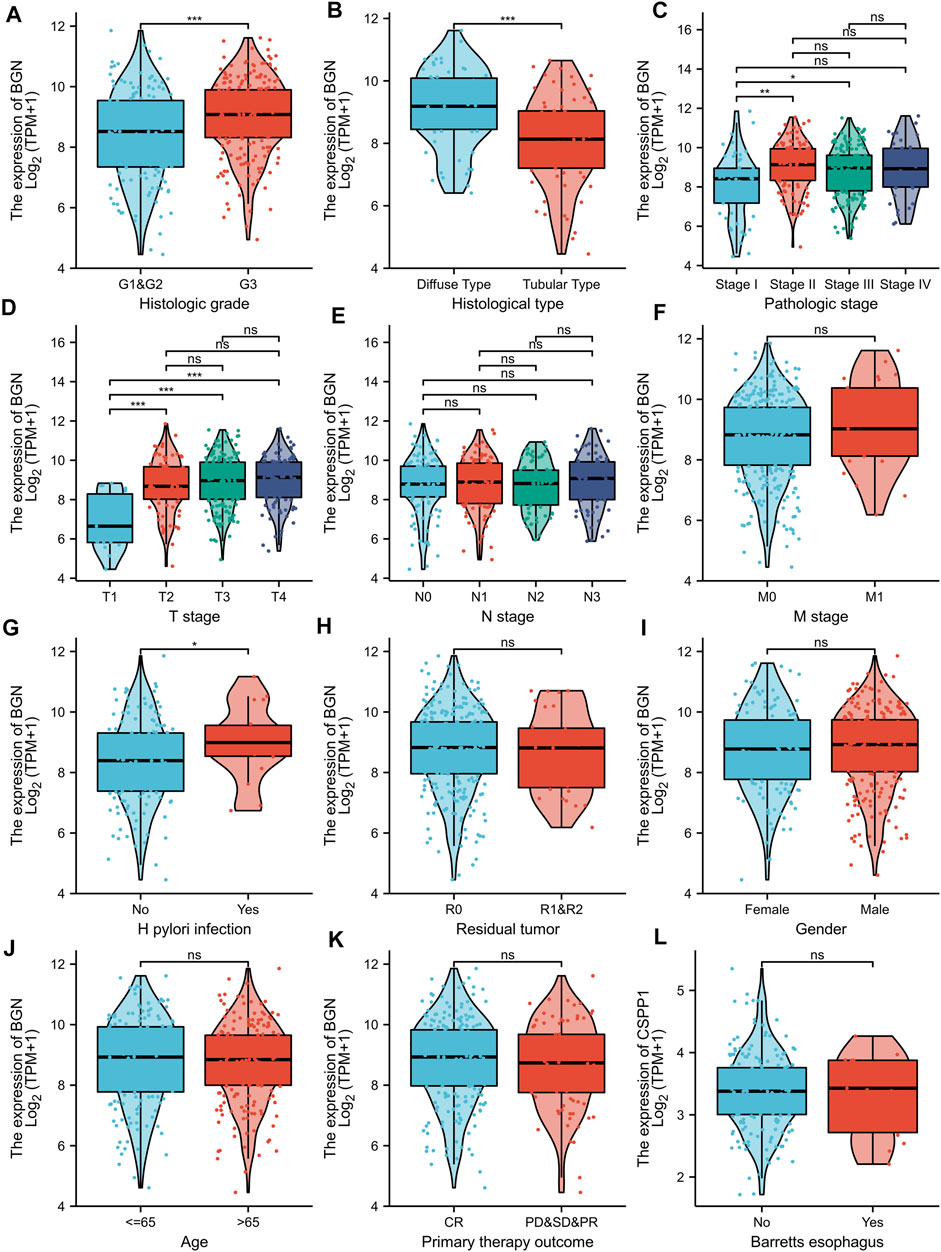
FIGURE 3. Volcano plot of the DEGs, Functional enrichment analysis and GSEA analysis. (A): (E) Volcano plots of the DEGs. Blue represent down-regulated DEGs, red represent up-regulated DEGs. (B): The top three items enriched in biological processes (BP), cellular component (CC), molecular function (MF), and Kyoto Encyclopedia of Genes and Genomes (KEGG) of DEGs. (C–H): Enrichment plots from the gene set enrichment analysis (GSEA). NES, normalized enrichment score; p.adj, adjusted p-value; FDR, false discovery rate.
In terms of Biological Process (BP), most of the DEGs were enriched in extracellular structure organization, extracellular matrix (ECM) organization, and skin development. In terms of cellular components (CC), DEGs were mostly enriched in the collagen-containing ECM, endoplasmic reticulum lumen, and ECM components. In terms of molecular functions (MF), the DEGs also showed significant association with ECM structural constituent, receptor-ligand activity, and glycosaminoglycan binding. Furthermore, they were found mainly enriched in three KEGG pathways, including protein digestion and absorption, ECM-receptor interaction, focal adhesion pathway (Figure 3B; Table 3). GSEA analysis revealed the following BGN-related enrichment pathways: collagen formulation, immunoregulatory interactions between a lymphoid and a non-lymphoid cell, focal adhesion, ECM glycoproteins, Wnt signaling, and signaling by vascular endothelial growth factor (VEGF), as shown in Figures 3C–H.
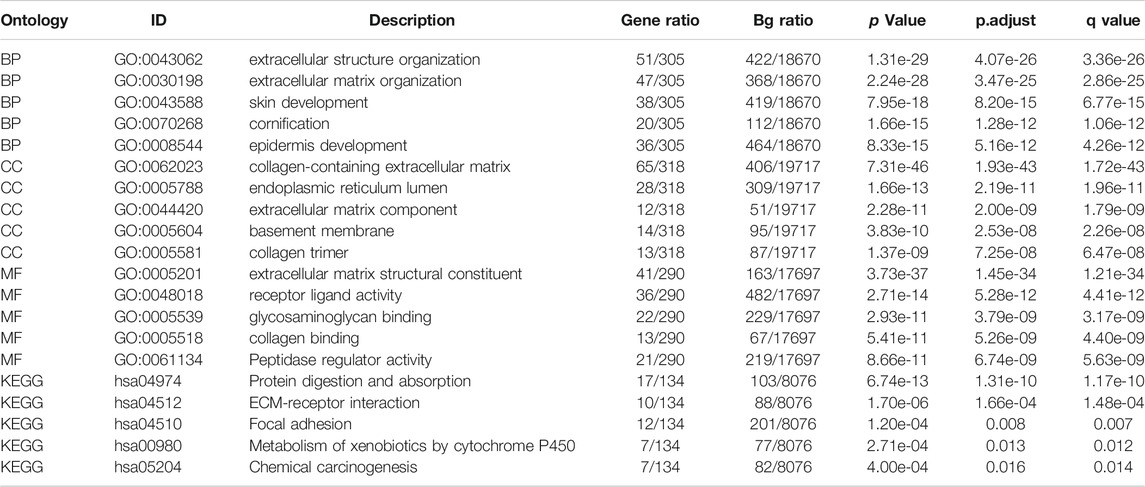
TABLE 3. GO and KEGG enrichment analysis.
The BGN expression showed positive correlation with the enrichment of the NK cells (r = 0.620, p < 0.001) and macrophages (r = 0.550, p < 0.001) but negative correlation with the enrichment of Th17 cells (r = -0.250, p < 0.001) (Figures 4A–G; Table 4). The enrichment score of macrophages (High: 0.501 ± 0.061, Low: 0.44 ± 0.066, p < 0.001) and NK cells (High: 0.47 ± 0.031, Low: 0.433 ± 0.036, p < 0.001) in the group with high BGN expression was significantly higher than that in the group with low BGN expression, while the enrichment score of Th17 cells (High: 0.218 ± 0.111, Low: 0.266 ± 0.12, p < 0.001) in the group with high BGN expression was significantly lower than that in the group with low BGN expression (Table 5). The details of immune cell enrichment score in the BGN high expression group and low expression group are shown in Table 5.
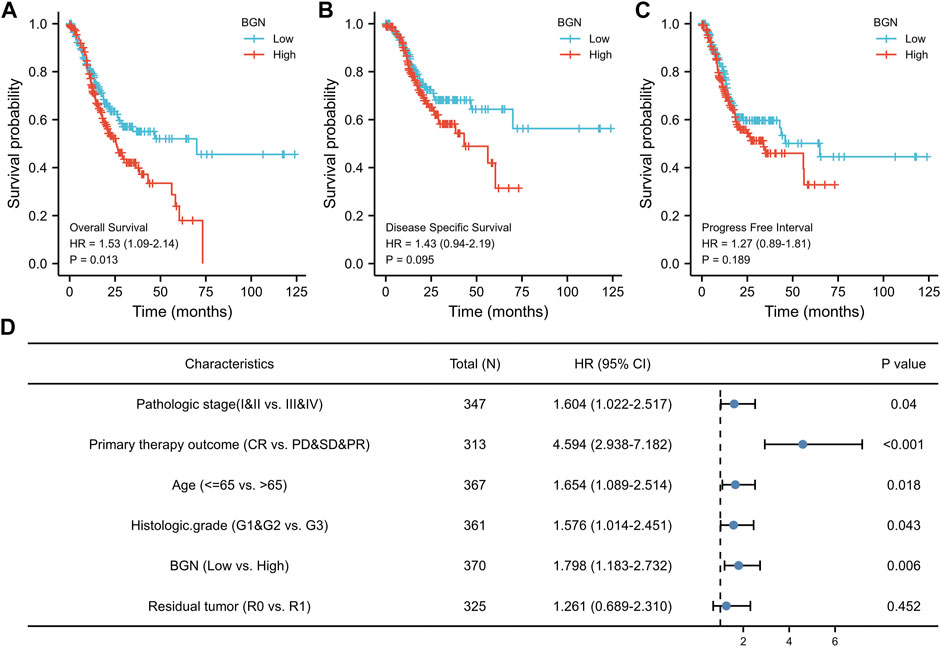
FIGURE 4. The correlation between BGN expression and immune infiltration. (A) Correlation between the relative abundances of immune cells and BGN expression level. The size of dots is positively related to the absolute value of Spearman’s R. (B-D) The difference of immune cells (Macrophages, NK cells, and Th17 cells) between the high and low expression groups based on the median value of BGN expression. (E–G) The correlation of immune cells (Macrophages, NK cells, and Th17 cells) between the high and low expression groups based on median value of BGN expression.
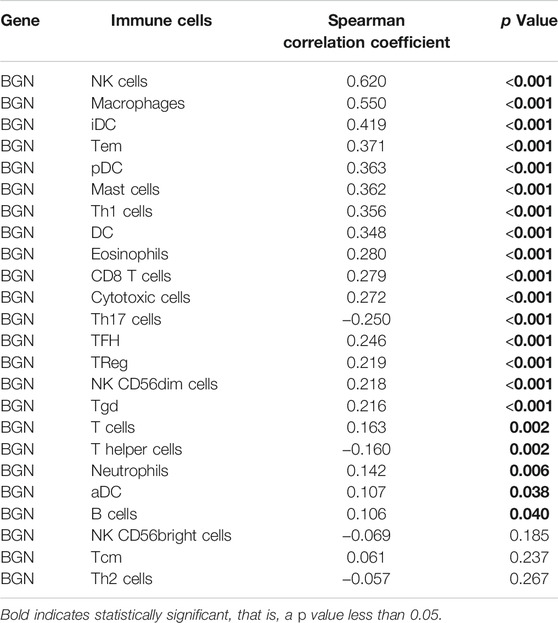
TABLE 4. Correlation analysis between BGN and immune cells.

TABLE 5. Details of immune cell enrichment score in BGN high expression group and low expression group.
BGN expression was remarkably correlated with histologic grade (Figure 5A, GI&G2 vs. G3, p < 0.001), histologic type (Figure 5B, Diffuse type vs. Tubular type, p < 0.001), histologic stage (Figure 5C, stage I vs. stage II and stage I vs. stage III, p < 0.001), T stage (Figure 5D, T1 vs. T2, T1 vs. T3, and T1 vs. T4, p < 0.001) and Helicobacter pylori (HP) infection (Figure 5G, yes vs. no, p < 0.05) in gastric cancer (GC). However, the following clinicopathological features showed no significant association with BGN expression: M stage, N stage, residual tumor, gender, age, primary therapy outcome, and Barrett’s esophagus (Figures 5F,H–L, p > 0.05).
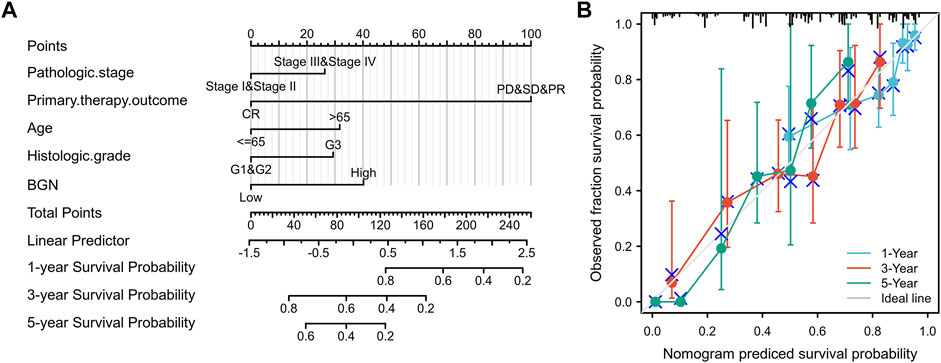
FIGURE 5. Association with BGN expression and clinicopathological characteristics. (A) Histologic grade, (B) Histological type, (C) Pathologic stage, (D) T stage (E) N stage, (F) M stage, (G) H pylori infection, (H) Residual tumor, (I) Gender, (J) Age, (K) Primary therapy outcome, and (L) Barretts esophageal in GC patients in TCGA cohort. TCGA, The Cancer Genome Atlas; GC, gastric cancer.
The results in Table 6 showed that BGN expression was remarkably correlated with pathologic stage (p = 0.008), T stage (p = 0.001), histologic type (p < 0.001), and histological grade (p = 0.025) in 80 GC patients who underwent immunohistochemistry, but was not significantly associated with gender (p = 0.802), N stage (p = 0.232), residual tumor (p = 0.323), primary therapy outcome (p = 0.655), anatomic neoplasm subdivision (p = 0.905), and age (p = 0.600).
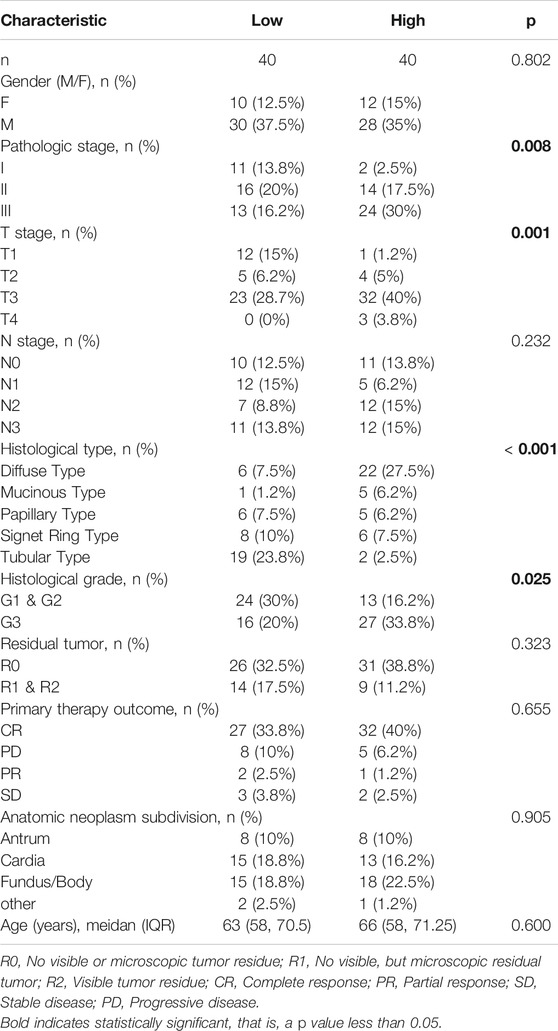
TABLE 6. The relationship between BGN expression and clinicopathological variables in 80 patients underwent immunohistochemistry.
The results of survival analysis revealed significant association of greater BGN expression with poor Overall Survival (OS) in GC patients (Figure 6A, HR = 1.53 (1.09–2.14), p = 0.013), but no significantly association with Disease Specific Survival (DSS) (Figure 6B, HR = 1.43 (0.94–2.19), p = 0.095), and Progress Free Interval (PFI) (Figure 6C, HR = 1.27 (0.89–1.81), p = 0.189).
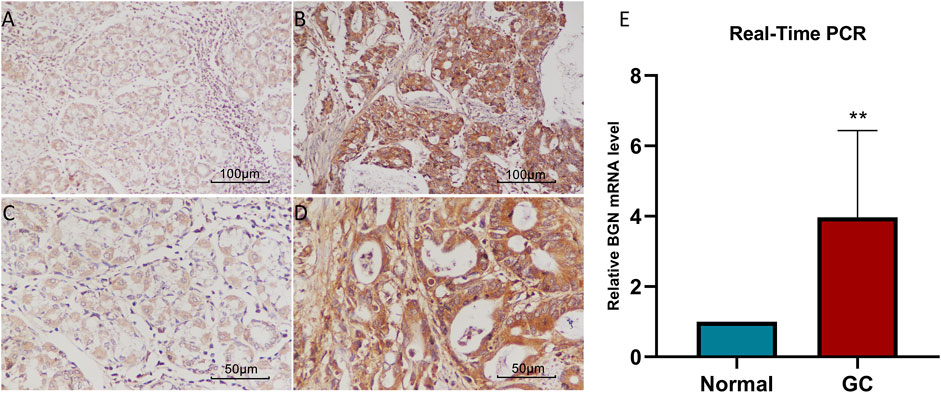
FIGURE 6. The association between BGN expression and prognosis of patients with Gastric Cancer. (A) Overall Survival. (B) Disease Specific Survival. (C) Progress Free Interval. (D) Results of multivariate Cox regression analysis of the relationship between Overall Survival and clinicopathological variables in patients with gastric cancer. HR: Hazard Ratio. CI: Confidence Interval.
In order to eliminate the influence of other clinicopathological variables on OS of GC, multivariate Cox regression analysis was performed to identify independent factors affecting OS of GC. Table 7 and Figure 6D show that pathologic stage (stage I &II vs. stage III &IV, HR (95% CI) = 1.604 (1.022–2.517), p = 0.040), primary therapy outcome (CR vs. PD &SD &PR, HR (95% CI) = 4.594 (2.938–7.182), p < 0.001), age (≤65 vs. >65 years, HR (95% CI) = 1.654 (1.089–2.514), p = 0.018), histologic grade (G1 & G2 vs. G3, HR (95% CI) = 1.576 (1.014–2.451), p = 0.043), and BGN (low vs. high, HR (95% CI) = 1.798 (1.183–2.732), p = 0.006) had significant correlation with OS rates in patients with GC. However, BGN expression showed no association with poor DSS and DSS PFI (Tables 8; Tables 9).
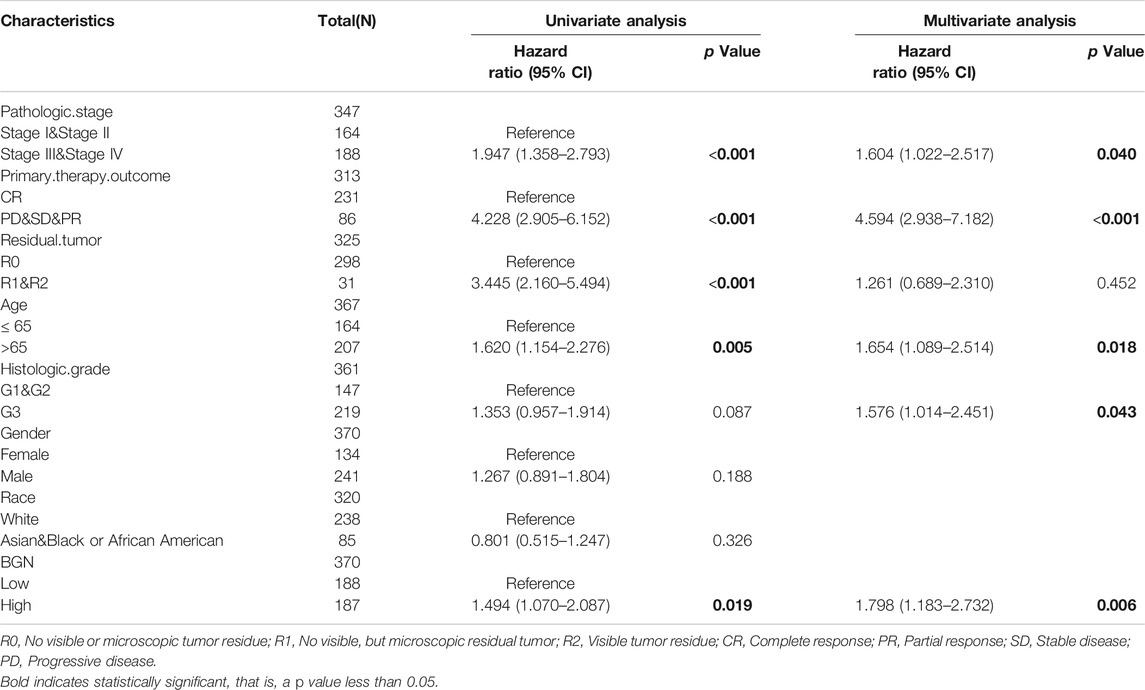
TABLE 7. Univariate regression and multivariate survival method (Overall Survival) of prognostic covariates in patients with Gastric Cancer
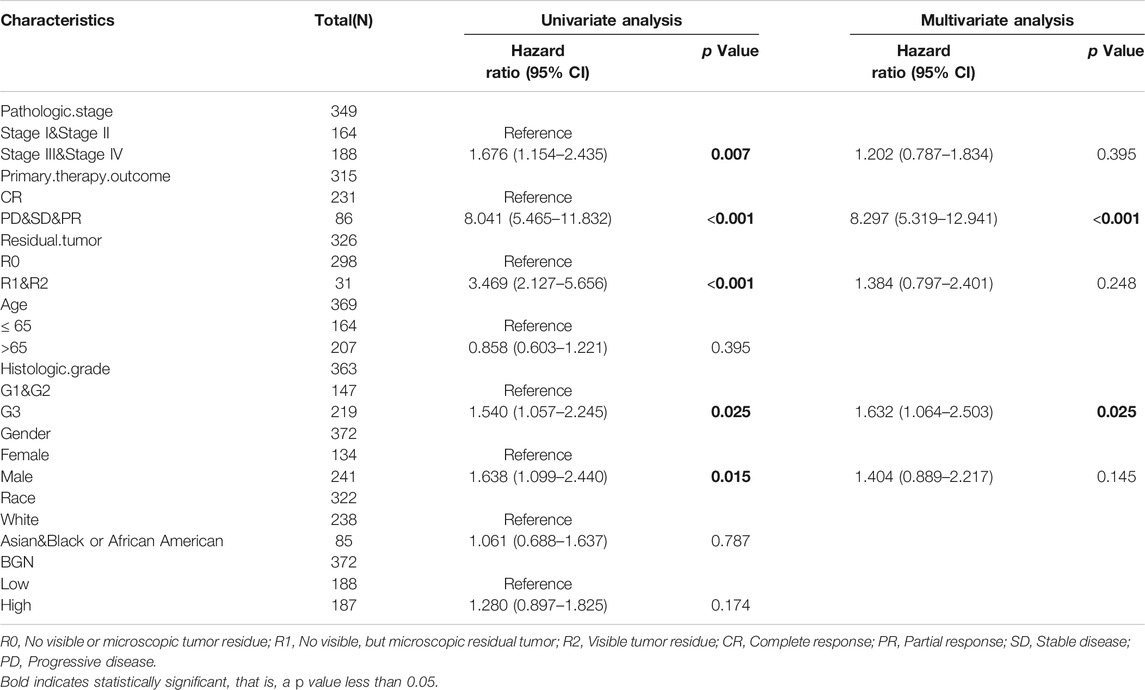
TABLE 8. Univariate regression and multivariate survival method (Progress Free Interval) of prognostic covariates in patients with Gastric Cancer
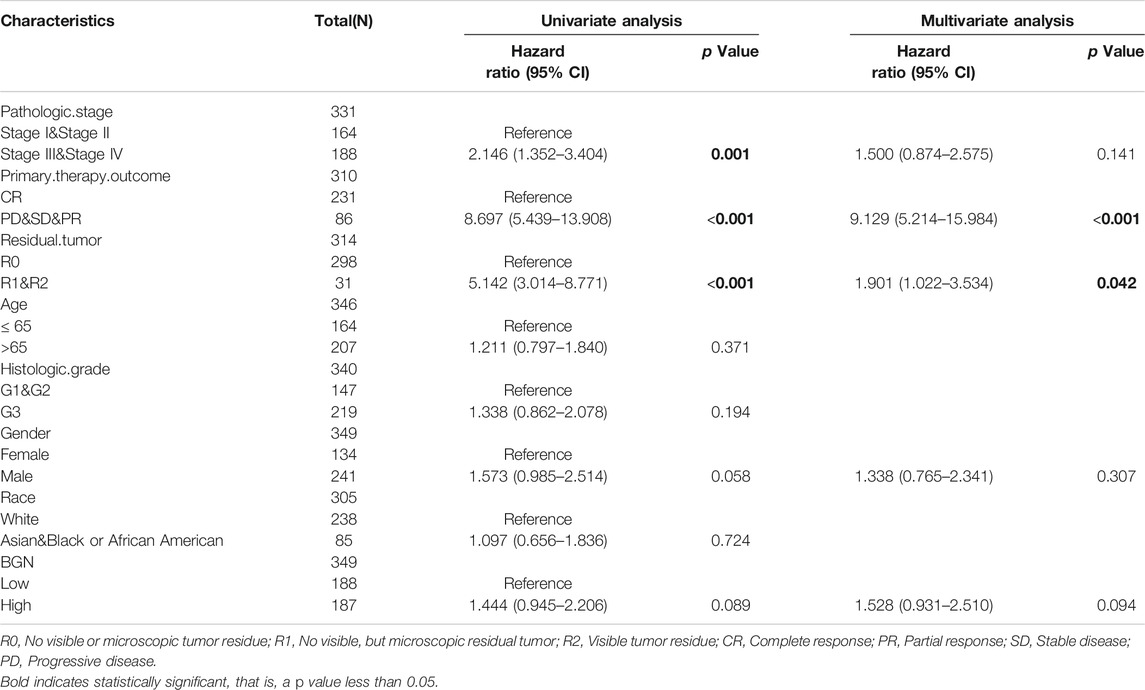
TABLE 9. Univariate regression and multivariate survival method (Disease Specific Survival) of prognostic covariates in patients with Gastric Cancer
A nomogram to predict 1-, 3-, and 5-years’ OS probability was constructed on the basis of multivariate Cox regression analysis. In it, five variables, namely pathologic stage, primary therapy outcome, age, histologic grade, and BGN expression level, were used. Figure 7A depicts 11 rows in the nomogram, with the rows ranging from 2 to 6 representing the above variables. The points of the five variables were added up to the total points, which were displayed in row 7 and corresponded to the linear predictor in the prediction of 1-, 3-, and 5-years survival probability in row 8. The C-index was used to quantify the predictive accuracy, ranging from 0.5 (no predictive power) to 1 (perfect prediction). The C-index of this nomogram was 0.728 (0.705–0.752), indicating that the prediction was in good agreement with the actual survival probability. The nomogram calibration plot (Figure 7B) also suggests that the nomogram was well-calibrated, with the mean predicted probabilities close to observed probabilities.
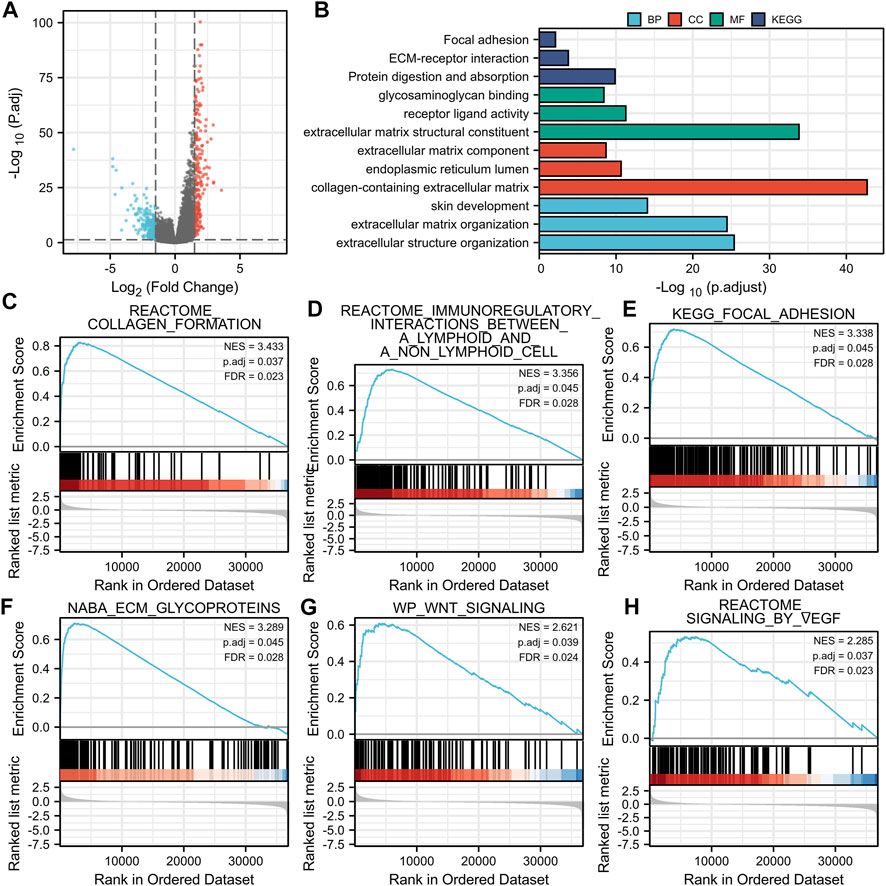
FIGURE 7. A quantitative method to predict GC patients’ probability of 1-, 3-, and 5-years OS. (A) A nomogram for predicting the probability of 1-, 3-, and 5-years OS for GC patients. (B) Calibration plots of the nomogram for predicting the probability of OS at 1, 3, and 5 years. GC, gastric cancer; OS, overall survival.
In the current study, we compared the expression level of BGN in tumor tissues from TCGA and normal tissues from TCGA and GTEx. The results demonstrated differential expression of BGN in most of the 33 tumors and significant expression in GC tissues. Similar results were obtained on comparison of the GC tissues in TCGA with the matched normal tissues. The expression level of BGN in GC tissues was significantly higher as compared with normal tissues (p < 0.001). RT-PCR and IHC also verified this association (p < 0.01). The AUC of the ROC curve to predict the diagnostic value of BGN for GC was 0.945 (0.915–0.975), suggesting greater expression of BGN expression in GC diagnosis. The above results suggest that BGN may be a new biomarker for GC.
In addition, 492 BGN-related DEGs, including 207 up-regulated and 285 down-regulated genes, were identified. GO and KEGG enrichment analyses on DEGs were also done. In terms of BP, DEGs were mostly enriched in extracellular structure organization, ECM organization, and skin development. In terms of CC, DEGs were mostly enriched in collagen-containing ECM, endoplasmic reticulum lumen, and ECM components. Also, the DEGs were significantly associated with ECM structural constituent, receptor-ligand activity, and glycosaminoglycan binding in terms of MF. DEGs showed significant enrichment in three KEGG pathways of protein digestion and absorption, ECM-receptor interaction, focal adhesion. ECM plays a key role in the cell microenvironment and in maintaining normal cell activity (Giussani et al., 2019). Recent studies have shown a close correlation of ECM to tumor progression, including in the avoidance of apoptosis, the regulation of cell growth, the promotion of tumor angiogenesis, and the acquisition of invasion and metastasis ability (Pickup et al., 2014; Poltavets et al., 2018; Eble and Niland, 2019). The disorder of collagen, a key component of ECM, correlates with malignant tumor (Levental et al., 2009). Changes in the levels of metabolites related to protein digestion and absorption also have a key role in the development of cancer (Mo et al., 2020). GSEA enrichment analysis revealed that BGN-related DEGs were significantly enriched in collagen formulation (Nissen et al., 2019), immunoregulatory interactions between a lymphoid and a non-lymphoid cell (Sautès-Fridman et al., 2019), focal adhesion (Eke and Cordes, 2015), ECM glycoproteins (Mohan et al., 2020), Wnt signaling (Bugter et al., 2021), and signaling by VEGF (Apte et al., 2019), which were significantly related to the tumor. Considering the above findings, we speculate that BGN-related genes may be involved in the occurrence and progression of GC, and BGN may be a potential therapeutic target for GC.
Immunotherapy of tumors has been one of the hot topics over recent years. The use of Trastuzumab as immunotherapy has been shown to prolong overall survival in patients with HER2-positive GC (Shitara et al., 2019). In several clinical trials (Zhang et al., 2015), adoptive cell therapy has also demonstrated promising results against GC. A high incidence of somatic mutations in GC patients suggests ideal candidacy of Trastuzumab for immunotherapy (Marrelli et al., 2016). These results give us more confidence in the treatment of stomach cancer. However, due to the high complexity of the immune microenvironment of GC, the identification of biomarkers associated with GC require greater attention in the future (Zhao et al., 2019). The BGN expression was positively correlated with the enrichment of the NK cells (r = 0.620, p < 0.001) and macrophages (r = 0.550, p < 0.001) but was negatively correlated with the enrichment of Th17 cells. This indicates that the improvement of innate immunity is accompanied by the decrease of adaptive immunity. Macrophages, a type of immune cell present in large numbers in most tumor types, play an important regulatory role in promoting the development of malignancy (Noy and Pollard, 2014). Macrophages were recruited by inflammatory signals released by cancer cells in primary and metastatic tumors and differentiated into tumor-associated macrophages (TAMs) that promote tumor progression (Qian et al., 2011; Arwert et al., 2018). A large number of Th17 cell infiltrates were reported in different tumor types, including ovarian cancer (Miyahara et al., 2008), hepatocellular carcinoma (Zhang et al., 2009), colorectal cancer (Tosolini et al., 2011), and multiple myeloma (Prabhala et al., 2010). An abundance of Th17 cells in hepatocellular carcinoma and colorectal cancer showed association with poor prognosis (Kryczek et al., 2009). The results indicate that in the occurrence and development of GC, numerous immune cell infiltration changes occur, which may play a certain regulatory role.
BGN expression showed a significant correlation with histologic grade, histologic type, histologic stage, T stage, and Helicobacter pylori (HP) infection in patients with GC. Thus, GC patients with high BGN expression may have poorer histological types, lower tumor differentiation, more advanced tumor development, and may show greater association with HP infection. Furthermore, survival analysis suggested a significant correlation of high BGN expression with poor OS. Multivariate Cox regression analysis was conducted to exclude the influence of other variables. This analysis also showed that pathologic stage, primary therapy outcome, age, histologic grade, and BGN expression level are independent risk factors for OS in GC. These findings strongly suggest the key role of BGN in the development of GC, leading to a poor prognosis of GC.
A nomogram was established to predict 1-, 3-, and 5-years survival probability of GC patients by including the above five independent survivorship risk factors, namely pathologic stage, primary therapy outcome, age, histologic grade, and BGN expression. Our nomogram can predict the OS probability of GC patients very well (C-index = 0.728). The calibration map shows that the nomogram’s predicted OS probability matches the actual probability. Because of the very uncertain prognosis of tumor patients, understanding the risk stratification of patients with tumors correctly (Gratian et al., 2014) becomes crucial. Our nomogram based on independent factors related to the survival of GC patients can predict the OS probability of GC patients and can be widely used in clinical practice Cs-Szabó et al., 1995, Vuillermoz et al., 2004.
Overall, the findings of the current research are summarized below:
First, we reported and verified the differential expression of BGN in GC and normal tissue and concluded that the occurrence, progression, and prognosis of GC were significantly correlated with BGN. Second, BGN is a good biomarker for the proper diagnosis of GC. Third, BGN-related changes in the tumor microenvironment and immune invasion may play an important role in the occurrence and progression of GC. Finally, as our nomogram could predict the survival probability of GC patients, it may be widely used in clinical practice. Due to the limited conditions, we could not study molecular subtypes. This issue will be addressed in future research.
The datasets presented in this study can be found in online repositories. The names of the repository/repositories and accession number(s) can be found in the article/Supplementary Material.
The studies involving human participants were reviewed and approved by Ethics Committee of the First Affiliated Hospital of Guangxi Medical University. The patients/participants provided their written informed consent to participate in this study.
GT contributed to the conception of the study; SZ performed the experiment and manuscript; HY contributed significantly to analysis and manuscript preparation; XX performed the data analyses and wrote the manuscript; LL and HH helped perform the analysis with constructive discussions.
This research was supported by the National Natural Science Foundation of China (81970558) and Guangxi Natural Science Foundation (2020GXNSFAA259095).
The authors declare that the research was conducted in the absence of any commercial or financial relationships that could be construed as a potential conflict of interest.
All claims expressed in this article are solely those of the authors and do not necessarily represent those of their affiliated organizations, or those of the publisher, the editors and the reviewers. Any product that may be evaluated in this article, or claim that may be made by its manufacturer, is not guaranteed or endorsed by the publisher.
Thanks to Xiaoyang Shi of The First People’s Hospital of Suqian for his guidance of experimental technology.
Appunni, S., Rubens, M., Ramamoorthy, V., Anand, V., Khandelwal, M., and Sharma, A. (2021). Biglycan: an Emerging Small Leucine-Rich Proteoglycan (SLRP) Marker and its Clinicopathological Significance. Mol. Cel Biochem 476 (11), 3935–3950. doi:10.1007/s11010-021-04216-z
Apte, R. S., Chen, D. S., and Ferrara, N. (2019). VEGF in Signaling and Disease: Beyond Discovery and Development. Cell 176 (6), 1248–1264. doi:10.1016/j.cell.2019.01.021
Arwert, E. N., Harney, A. S., Entenberg, D., Wang, Y., Sahai, E., Pollard, J. W., et al. (2018). A Unidirectional Transition from Migratory to Perivascular Macrophage Is Required for Tumor Cell Intravasation. Cel Rep. 23 (5), 1239–1248. doi:10.1016/j.celrep.2018.04.007
Bindea, G., Mlecnik, B., Tosolini, M., Kirilovsky, A., Waldner, M., Obenauf, A. C., et al. (2013). Spatiotemporal Dynamics of Intratumoral Immune Cells Reveal the Immune Landscape in Human Cancer. Immunity 39 (4), 782–795. doi:10.1016/j.immuni.2013.10.003
Bray, F., Ferlay, J., Soerjomataram, I., Siegel, R. L., Torre, L. A., and Jemal, A. (2018). Global Cancer Statistics 2018: GLOBOCAN Estimates of Incidence and Mortality Worldwide for 36 Cancers in 185 Countries. CA: A Cancer J. Clinicians 68 (6), 394–424. doi:10.3322/caac.21492
Bugter, J. M., Fenderico, N., and Maurice, M. M. (2021). Mutations and Mechanisms of WNT Pathway Tumour Suppressors in Cancer. Nat. Rev. Cancer 21 (1), 5–21. doi:10.1038/s41568-020-00307-z
Chen, W., Zheng, R., Baade, P. D., Zhang, S., Zeng, H., Bray, F., et al. (2016). Cancer Statistics in China, 2015. CA: A Cancer J. Clinicians 66 (2), 115–132. doi:10.3322/caac.21338
Chen, D., Qin, Y., Dai, M., Li, L., Liu, H., Zhou, Y., et al. (2020). BGN and COL11A1 Regulatory Network Analysis in Colorectal Cancer (CRC) Reveals that BGN Influences CRC Cell Biological Functions and Interacts with miR-6828-5p. Cancer Manag. Res. 12, 13051–13069. doi:10.2147/CMAR.S277261
Cooper, J., and Giancotti, F. G. (2019). Integrin Signaling in Cancer: Mechanotransduction, Stemness, Epithelial Plasticity, and Therapeutic Resistance. Cancer Cell 35 (3), 347–367. doi:10.1016/j.ccell.2019.01.007
Cs-Szabó, G., Roughley, P. J., Plaas, A. H. K., and Glant, T. T. (1995). Large and Small Proteoglycans of Osteoarthritic and Rheumatoid Articular Cartilage. Arthritis Rheum. 38 (5), 660–668. doi:10.1002/art.1780380514
Eble, J. A., and Niland, S. (2019). The Extracellular Matrix in Tumor Progression and Metastasis. Clin. Exp. Metastasis 36 (3), 171–198. doi:10.1007/s10585-019-09966-1
Eke, I., and Cordes, N. (2015). Focal Adhesion Signaling and Therapy Resistance in Cancer. Semin. Cancer Biol. 31, 65–75. doi:10.1016/j.semcancer.2014.07.009
Gallagher, J. T. (1989). The Extended Family of Proteoglycans: Social Residents of the Pericellular Zone. Curr. Opin. Cel Biol. 1 (6), 1201–1218. doi:10.1016/s0955-0674(89)80072-9
Giussani, M., Triulzi, T., Sozzi, G., and Tagliabue, E. (2019). Tumor Extracellular Matrix Remodeling: New Perspectives as a Circulating Tool in the Diagnosis and Prognosis of Solid Tumors. Cells 8 (2), 81. doi:10.3390/cells8020081
Gratian, L., Pura, J., Dinan, M., Reed, S., Scheri, R., Roman, S., et al. (2014). Treatment Patterns and Outcomes for Patients with Adrenocortical Carcinoma Associated with Hospital Case Volume in the United States. Ann. Surg. Oncol. 21 (11), 3509–3514. doi:10.1245/s10434-014-3931-z
Hisamatsu, E., Nagao, M., Toh, R., Irino, Y., Iino, T., Hara, T., et al. (2020). Fibronectin-containing High-Density Lipoprotein Is Associated with Cancer Cell Adhesion and Proliferation. Kobe J. Med. Sci. 66 (1), E40–e48.
Kryczek, I., Banerjee, M., Cheng, P., Vatan, L., Szeliga, W., Wei, S., et al. (2009). Phenotype, Distribution, Generation, and Functional and Clinical Relevance of Th17 Cells in the Human Tumor Environments. Blood 114 (6), 1141–1149. doi:10.1182/blood-2009-03-208249
Levental, K. R., Yu, H., Kass, L., Lakins, J. N., Egeblad, M., Erler, J. T., et al. (2009). Matrix Crosslinking Forces Tumor Progression by Enhancing Integrin Signaling. Cell 139 (5), 891–906. doi:10.1016/j.cell.2009.10.027
Li, H., Zhong, A., Li, S., Meng, X., Wang, X., Xu, F., et al. (2017). The Integrated Pathway of TGFβ/Snail with TNFα/NFκB May Facilitate the Tumor-Stroma Interaction in the EMT Process and Colorectal Cancer Prognosis. Sci. Rep. 7 (1), 4915. doi:10.1038/s41598-017-05280-6
Liu, J., Lichtenberg, T., Hoadley, K. A., Poisson, L. M., Lazar, A. J., Cherniack, A. D., et al. (2018). An Integrated TCGA Pan-Cancer Clinical Data Resource to Drive High-Quality Survival Outcome Analytics. Cell 173 (2), 400–e11. e411. doi:10.1016/j.cell.2018.02.052
Love, M. I., Huber, W., and Anders, S. (2014). Moderated Estimation of Fold Change and Dispersion for RNA-Seq Data with DESeq2. Genome Biol. 15 (12), 550. doi:10.1186/s13059-014-0550-8
Marrelli, D., Polom, K., Pascale, V., Vindigni, C., Piagnerelli, R., De Franco, L., et al. (2016). Strong Prognostic Value of Microsatellite Instability in Intestinal Type Non-cardia Gastric Cancer. Ann. Surg. Oncol. 23 (3), 943–950. doi:10.1245/s10434-015-4931-3
Miyahara, Y., Odunsi, K., Chen, W., Peng, G., Matsuzaki, J., and Wang, R.-F. (2008). Generation and Regulation of Human CD4+ IL-17-producing T Cells in Ovarian Cancer. Proc. Natl. Acad. Sci. 105 (40), 15505–15510. doi:10.1073/pnas.0710686105
Mo, L., Wei, B., Liang, R., Yang, Z., Xie, S., Wu, S., et al. (2020). Exploring Potential Biomarkers for Lung Adenocarcinoma Using LC-MS/MS Metabolomics. J. Int. Med. Res. 48 (4), 030006051989721. doi:10.1177/0300060519897215
Mohan, V., Das, A., and Sagi, I. (2020). Emerging Roles of ECM Remodeling Processes in Cancer. Semin. Cancer Biol. 62, 192–200. doi:10.1016/j.semcancer.2019.09.004
Moreno-Layseca, P., Icha, J., Hamidi, H., and Ivaska, J. (2019). Integrin Trafficking in Cells and Tissues. Nat. Cel Biol 21 (2), 122–132. doi:10.1038/s41556-018-0223-z
Nissen, N. I., Karsdal, M., and Willumsen, N. (2019). Collagens and Cancer Associated Fibroblasts in the Reactive Stroma and its Relation to Cancer Biology. J. Exp. Clin. Cancer Res. 38 (1), 115. doi:10.1186/s13046-019-1110-6
Noy, R., and Pollard, J. W. (2014). Tumor-associated Macrophages: from Mechanisms to Therapy. Immunity 41 (1), 49–61. doi:10.1016/j.immuni.2014.06.010
Pickup, M. W., Mouw, J. K., and Weaver, V. M. (2014). The Extracellular Matrix Modulates the Hallmarks of Cancer. EMBO Rep. 15 (12), 1243–1253. doi:10.15252/embr.201439246
Poltavets, V., Kochetkova, M., Pitson, S. M., and Samuel, M. S. (2018). The Role of the Extracellular Matrix and its Molecular and Cellular Regulators in Cancer Cell Plasticity. Front. Oncol. 8, 431. doi:10.3389/fonc.2018.00431
Prabhala, R. H., Pelluru, D., Fulciniti, M., Prabhala, H. K., Nanjappa, P., Song, W., et al. (2010). Elevated IL-17 Produced by TH17 Cells Promotes Myeloma Cell Growth and Inhibits Immune Function in Multiple Myeloma. Blood 115 (26), 5385–5392. doi:10.1182/blood-2009-10-246660
Qian, B.-Z., Li, J., Zhang, H., Kitamura, T., Zhang, J., Campion, L. R., et al. (2011). CCL2 Recruits Inflammatory Monocytes to Facilitate Breast-Tumour Metastasis. Nature 475 (7355), 222–225. doi:10.1038/nature10138
Sautès-Fridman, C., Petitprez, F., Calderaro, J., and Fridman, W. H. (2019). Tertiary Lymphoid Structures in the Era of Cancer Immunotherapy. Nat. Rev. Cancer 19 (6), 307–325. doi:10.1038/s41568-019-0144-6
Shitara, K., Iwata, H., Takahashi, S., Tamura, K., Park, H., Modi, S., et al. (2019). Trastuzumab Deruxtecan (DS-8201a) in Patients with Advanced HER2-Positive Gastric Cancer: a Dose-Expansion, Phase 1 Study. Lancet Oncol. 20 (6), 827–836. doi:10.1016/s1470-2045(19)30088-9
Sun, H., Wang, X., Zhang, Y., Che, X., Liu, Z., Zhang, L., et al. (2016). Biglycan Enhances the Ability of Migration and Invasion in Endometrial Cancer. Arch. Gynecol. Obstet. 293 (2), 429–438. doi:10.1007/s00404-015-3844-5
Thakur, A. K., Nigri, J., Lac, S., Leca, J., Bressy, C., Berthezene, P., et al. (2016). TAp73 Loss Favors Smad-independent TGF-β Signaling that Drives EMT in Pancreatic Ductal Adenocarcinoma. Cell Death Differ 23 (8), 1358–1370. doi:10.1038/cdd.2016.18
Tosolini, M., Kirilovsky, A., Mlecnik, B., Fredriksen, T., Mauger, S., Bindea, G., et al. (2011). Clinical Impact of Different Classes of Infiltrating T Cytotoxic and Helper Cells (Th1, Th2, Treg, Th17) in Patients with Colorectal Cancer. Cancer Res. 71 (4), 1263–1271. doi:10.1158/0008-5472.Can-10-2907
Van Cutsem, E., Sagaert, X., Topal, B., Haustermans, K., and Prenen, H. (2016). Gastric Cancer. The Lancet 388 (10060), 2654–2664. doi:10.1016/s0140-6736(16)30354-3
Varghese, F., Bukhari, A. B., Malhotra, R., and De, A. (2014). IHC Profiler: an Open Source Plugin for the Quantitative Evaluation and Automated Scoring of Immunohistochemistry Images of Human Tissue Samples. PLoS One 9 (5), e96801. doi:10.1371/journal.pone.0096801
Vuillermoz, B., Khoruzhenko, A., D'Onofrio, M.-F., Ramont, L., Venteo, L., Perreau, C., et al. (2004). The Small Leucine-Rich Proteoglycan Lumican Inhibits Melanoma Progression. Exp. Cel Res. 296 (2), 294–306. doi:10.1016/j.yexcr.2004.02.005
Yang, Y., Wang, R., Feng, L., Ma, H., and Fang, J. (2021). LINC00460 Promotes Cell Proliferation, Migration, Invasion, and Epithelial-Mesenchymal Transition of Head and Neck Squamous Cell Carcinoma via miR-320a/BGN Axis. OncoTargets Ther. 14, 2279–2291. doi:10.2147/OTT.S282947
Yousefi, H., Vatanmakanian, M., Mahdiannasser, M., Mashouri, L., Alahari, N. V., Monjezi, M. R., et al. (2021). Understanding the Role of Integrins in Breast Cancer Invasion, Metastasis, Angiogenesis, and Drug Resistance. Oncogene 40 (6), 1043–1063. doi:10.1038/s41388-020-01588-2
Yu, G., Wang, L.-G., Han, Y., and He, Q.-Y. (2012). clusterProfiler: an R Package for Comparing Biological Themes Among Gene Clusters. OMICS: A J. Integr. Biol. 16 (5), 284–287. doi:10.1089/omi.2011.0118
Zhang, J.-P., Yan, J., Xu, J., Pang, X.-H., Chen, M.-S., Li, L., et al. (2009). Increased Intratumoral IL-17-producing Cells Correlate with Poor Survival in Hepatocellular Carcinoma Patients. J. Hepatol. 50 (5), 980–989. doi:10.1016/j.jhep.2008.12.033
Zhang, G.-Q., Zhao, H., Wu, J. Y., Li, J. Y., Yan, X., Wang, G., et al. (2015). Prolonged Overall Survival in Gastric Cancer Patients after Adoptive Immunotherapy. World J. Gastroenterol. 21 (9), 2777–2785. doi:10.3748/wjg.v21.i9.2777
Keywords: biomarker, prognostic index, bioinformatics analysis, gastric cancer, immune infiltration
Citation: Zhang S, Yang H, Xiang X, Liu L, Huang H and Tang G (2022) BGN May be a Potential Prognostic Biomarker and Associated With Immune Cell Enrichment of Gastric Cancer. Front. Genet. 13:765569. doi: 10.3389/fgene.2022.765569
Received: 27 August 2021; Accepted: 10 January 2022;
Published: 26 January 2022.
Edited by:
Jiangning Song, Monash University, AustraliaReviewed by:
Poonam Gera, Advanced Centre for Treatment, IndiaCopyright © 2022 Zhang, Yang, Xiang, Liu, Huang and Tang. This is an open-access article distributed under the terms of the Creative Commons Attribution License (CC BY). The use, distribution or reproduction in other forums is permitted, provided the original author(s) and the copyright owner(s) are credited and that the original publication in this journal is cited, in accordance with accepted academic practice. No use, distribution or reproduction is permitted which does not comply with these terms.
*Correspondence: Guodu Tang, dGFuZ2d1b2R1QHN0dS5neG11LmVkdS5jbg==
Disclaimer: All claims expressed in this article are solely those of the authors and do not necessarily represent those of their affiliated organizations, or those of the publisher, the editors and the reviewers. Any product that may be evaluated in this article or claim that may be made by its manufacturer is not guaranteed or endorsed by the publisher.
Research integrity at Frontiers
Learn more about the work of our research integrity team to safeguard the quality of each article we publish.