- Department of General Surgery, The Second Affiliated Hospital of Harbin Medical University, Harbin, China
Immunogenic cell death (ICD) is a form of regulated cell death that elicits immune response. Common inducers of ICD include cancer chemotherapy and radiation therapy. A better understanding of ICD might contribute to modify the current regimens of anti-cancer therapy, especially immunotherapy. This study aimed to identify ICD-related prognostic gene signatures in breast cancer (BC). An ICD-based gene prognostic signature was developed using Lasso-cox regression and Kaplan-Meier survival analysis based on datasets acquired from the Cancer Genome Atlas and Gene Expression Omnibus. A nomogram model was developed to predict the prognosis of BC patients. Gene Set Enrichment Analysis (GESA) and Gene Set Variation Analysis (GSVA) were used to explore the differentially expressed signaling pathways in high and low-risk groups. CIBERSORT and ESTIMATE algorithms were performed to investigate the difference of immune status in tumor microenvironment of different risk groups. Six genes (CALR, CLEC9A, BAX, TLR4, CXCR3, and PIK3CA) were selected for construction and validation of the prognosis model of BC based on public data. GSEA and GSVA analysis found that immune-related gene sets were enriched in low-risk group. Moreover, immune cell infiltration analysis showed that the immune features of the high-risk group were characterized by higher infiltration of tumor-associated macrophages and a lower proportion of CD8+ T cells, suggesting an immune evasive tumor microenvironment. We constructed and validated an ICD-based gene signature for predicting prognosis of breast cancer patients. Our model provides a tool with good discrimination and calibration abilities to predict the prognosis of BC, especially triple-negative breast cancer (TNBC).
Introduction
Breast cancer (BC) is the most prevalent cancer worldwide, causing 685,000 deaths in 2020, approximately 17% of cancer deaths in females (Sung et al., 2021). BC is a heterogeneous disease characterized by molecular and histological evidence. Treatment approaches and outcomes differ between subtypes. Hormone receptor [estrogen receptor (ER), progesterone receptor (PR)] and human epidermal receptor 2 (HER2) categorize BC into molecular subtypes, and also serve as prominent prognostic biomarkers (Pashayan et al., 2020). Other frequently utilized prognosis predictors in clinical practice include tumor size, tumor grade, the presence and number of axillary node metastases and ki-67 index (Donegan, 1997). In recent years, high-throughput sequencing technologies have made identifying novel biomarkers more achievable. The PAM50 assay, developed on the expression levels of selected gene signatures, aids to risk stratification strategies and treatment decisions (Ellis et al., 2011). Oncotype DX, another validated multigene test, contributes to screening patients with high risk of recurrence and can potentially benefit from adjuvant chemotherapy (Mariotto et al., 2020).
Cancer cells constantly interact with their microenvironment, especially immune cells. Immune cell-associated parameters, such as Immunoscore, have shown promising value for predicting clinical outcomes (Pagès et al., 2018; Galon and Bruni, 2020). Immunogenic cell death (ICD) refers to a cell death process that elicits immune response, which has been widely explored in vivo and in vitro, and is reviewed in detail by Kroemer et al. (2022). Cancer cells that undergo ICD generate tumor-specific immunity and long-term immunological memory (Krysko et al., 2012). Anti-cancer treatments, mainly conventional chemotherapeutics and radiation therapy can act as cellular stressors, inducing the emission of damage-associated molecular patterns (DAMPs) by cancer cells and activating downstream danger signaling (Galluzzi et al., 2017). ICD-related DAMPs, including surface-exposed calreticulin (CRT), secreted ATP and high mobility group protein B1 (HMGB1) can be recognized by pattern recognition receptors (PRRs) that are expressed by immune cells, resulting the activation of tumor suppressing immune response [recruitment of antigen presenting cells (APCs) and T cells, etc.] (Galluzzi et al., 2020b). HMGB1 is positively correlated with overall survival in BC patients received neo-adjuvant chemotherapy (Exner et al., 2016). Reciprocally, tumor cells can subvert ICD through loss or downregulation of essential components in danger signaling (Galluzzi et al., 2017). Harnessing ICD or targeting ICD subversion strategies may provide new solutions to cancer treatment.
In this study, we screened ICD-associated biomarkers and developed a risk model that predicts the immune microenvironment, and prognosis in BC patients.
Materials and methods
Datasets
The gene expression profiles and clinicopathological data of TCGA-BRCA (n = 1,218) were accessed through UNSC Xena (https://xena.ucsc.edu/). For external validation, raw gene expression and clinical data (n = 123) were directly accessed through the Gene Expression Omnibus (GEO; accession number: GSE37181; https://www.ncbi.nlm.nih.gov/geo/query/acc.cgi?acc=GSE37181). The immunotherapy dataset were downloaded from GEO (accession number: GSE194040; https://www.ncbi.nlm.nih.gov/geo/query/acc.cgi?acc=GSE194040).
Identification of differentially expressed genes
Differential expression analysis of cancer (n = 1,097) and normal (n = 121) samples was performed using the DESeq2 R package (1.35.0). The screening criteria for mRNAs differential expression were determined as p value < 0.05 and absolute fold-change >1.5.
Consensus clustering
The R package ConcensusClusterPlus (1.59.0) was utilized to conduct consensus clustering to identify molecular subtypes according to a selected list of ICD-related genes based on previous research. We performed the clustering using K-means algorithm, and assessed the ideal cluster numbers between k = 2–10. This process was repeated 1,000 times to ensure the results were stable.
Construction of the immunogenic cell death-related risk score
Among 1,218 breast cancer samples, 399 samples without overall survival (OS) information and 60 samples with an observation time of 0 month were excluded. The remaining 759 samples were included for subsequent analyses. Kaplan-Meier analysis was performed to identify ICD-related DEGs with an impact on OS, using R packages survival (3.3-1) and survminer (0.4.9). The ICD-related DEGs with statistical significance were exposed to a LASSO cox regression analysis, as implemented in the R package glmnet (4.1-4). The risk score was constructed by using the regression coefficients derived from Cox regression analysis:
Statistical analysis
Patients (n = 759) were classified into high-risk group (n = 390) or low-risk group (n = 369) according to the risk score with the cutoff value (risk score = 7.319) generated by the surv_cutpoint function in the R package survminer (0.4.9). The Kaplan–Meier survival curves were constructed by the function “gsurvplot,” and the log-rank test was performed between the two groups. Multivariable Cox regression analysis was used to assess whether the risk score was an independent prognostic indicator, and the features to be included in the prognostic model were selected using two-way stepwise regression. A nomogram was plotted based on the clinical features and the risk score. The nomogram’s discrimination performances were quantitatively assessed by the area under curve (AUC) of the receiver operating characteristic (ROC) curve and calibration curve. The Wilcoxon rank sum test was conducted to examine whether the risk score distribution differs among BC molecular subtypes.
Functional enrichment
Gene Ontology (GO) and Kyoto Encyclopedia of Genes and Genomes (KEGG) analyses were carried out between high-risk and low-risk groups. The R package clusterProfiler (4.3.4) (Yu et al., 2012) was employed to evaluate GO and KEGG pathways, and the threshold of p-value was set as <0.05.
Gene set variation analysis
Gene Set Variation Analysis (GSVA) were conducted to determine the gene-set activity score for each sample, utilizing the R package GSVA (1.43.1). The gene sets were the c2 curated signatures downloaded from the Molecular Signature Database (MSigDB) of Broad Institute. The differential analysis of gene-set activity scores between the high-risk and low-risk groups was carried out by the R package limma (3.51.8). GSVA performed on the I-SPY2 dataset used the five gene signature (CALR, TLR4, CXCR3, PIK3CA, and BAX), because CLEC9A expression was not profiled in the dataset.
Immunophenoscore score and tumor immune exclusion score
The IPS score is calculated based on representative cell-type gene expression z-scores, with higher scores indicating increased immunogenicity. The IPS scores of high-risk and low-risk patients were obtained from the Cancer Immunome Atlas (TCIA) (https://tcia.at/home).
The tumor immune exclusion score was generated using expression signatures from immunosuppressive cells, which correlated negatively with T cell infiltration level. The tumor immune exclusion scores were calculated by TIDE (http://tide.dfci.harvard.edu/) (Jiang et al., 2018).
Immune infiltration analysis
CIBERSORT was applied to estimate the proportions of tumor-infiltrating immune with a deconvolution algorithm by the R package CIBERSORT (0.1.0). Besides, the ESTIMATE R package (1.0.13) was used to calculate ESTIMATE immune score of each sample.
Somatic mutation analysis
Somatic mutation data of the high-risk group (n = 373) and the low-risk group (n = 334) were retrieved from TCGA GDC Data Portal (https://portal.gdc.cancer.gov/) in maf format. The waterfall plots were illustrated by the Maftools R package (2.12.0).
Results
Consensus clustering identified two immunogenic cell death-associated subtypes
We conducted extensive literature research and collected 56 ICD-associated genes from previous studies (Supplementary Table S1). Next, consensus clustering was performed according to the patients’ expression levels of the ICD-associated genes. Unsupervised consensus clustering identified two major sample clusters that were clearly molecularly distinguishable among patients with BC (Figures 1A–C). To investigate the ICD status in different clusters, we illustrated a heatmap, and found that in contrast with cluster 2, cluster 1 had higher expression levels of ICD-related genes (Figure 1E). To screen out the potentially significant genes in BC, differential analysis was performed between all cancer samples and normal samples, and in 3 molecular subtypes, respectively (Supplementary Figure S3). In total, 18 ICD-related genes (AIM2, ANXA1, BAX, CALR, CCL2, CLEC9A, CXCR2, CXCR3, DDX58, IL1B, IL1R1, LRP1, P2RY2, PIK3CA, TLR3, TLR4, YKT6, and ZBP1) were differently expressed in cancer samples in comparison to normal samples (Supplementary Table S2). Among the 18 DEGs, AIM2, and ANXA1 were the most upregulated and downregulated, respectively (Figure 1D).
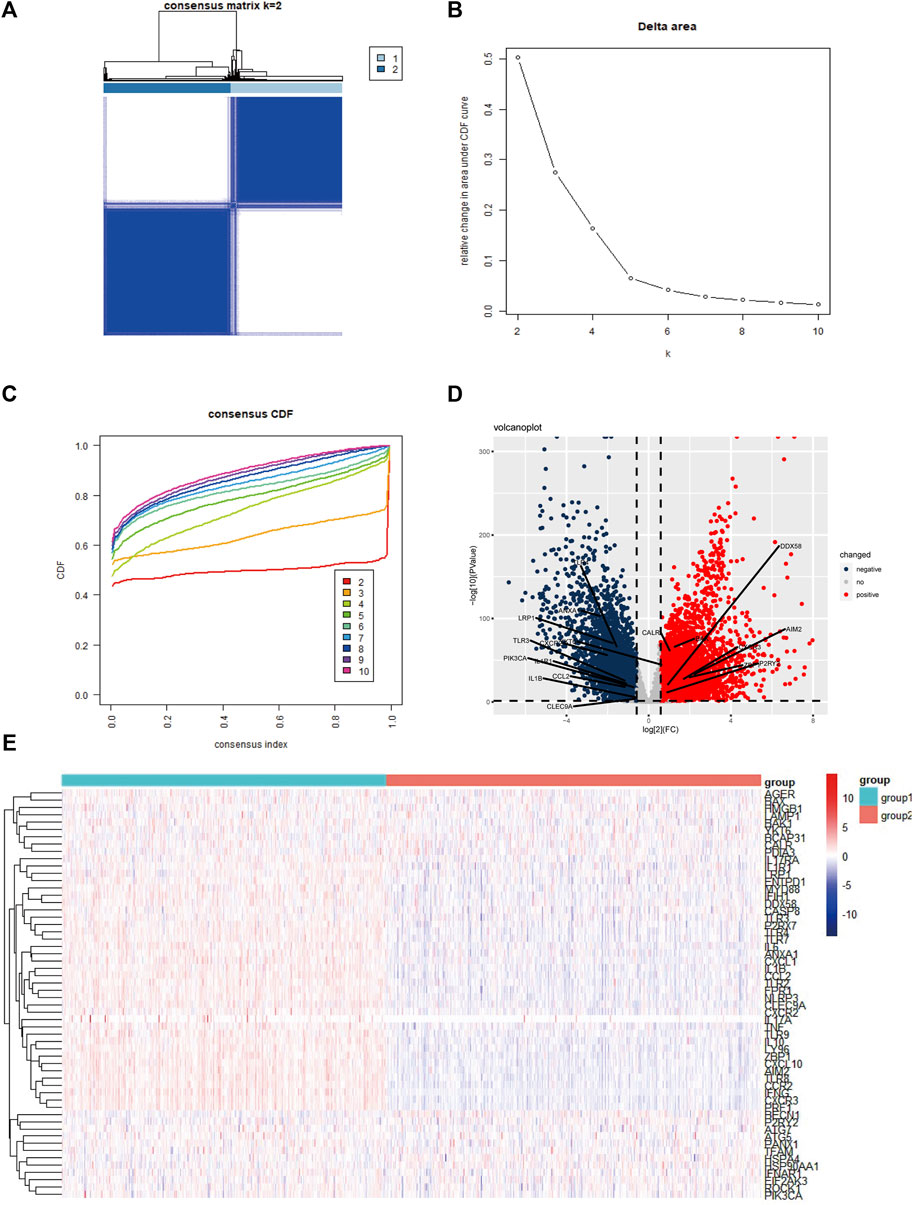
FIGURE 1. Identification of two ICD-based clusters and differential expressed genes (A) Heatmap of consensus clustering when K = 2 for 56 genes in breast cancer samples; (B,C) Delta area curve and the cumulative distribution function (CDF) curves for k = 2–10; (D) Volcano plot shows the differential expressed genes between cancer and normal samples; (E) Heatmap of 56 ICD-related genes’ expression levels in two clusters. Red indicates high expression and blue indicates low expression; abbreviations: ICD, immunogenic cell death.
Construction and validation of the immunogenic cell death-based risk score
To assess the association of ICD- related DEGs with OS, we performed Kaplan-Meier analysis, and found that six DEGs were statistically significant (Figure 2A). All six ICD-related genes were tested and selected for constructing the ICD-based risk score in the LASSO regression analysis (Figures 2B,C). The risk-score model was developed premised on the regression coefficients derived from multivariate cox regression. The formula for the risk score was as below: Risk score = 3.0954369*PIK3CA + 2.8466656*TLR4 + (−0.5698641)*BAX + (−1.8812416)*CALR + (−0.4513673)*CLEC9A + (−0.6615107)*CXCR3. The prognostic significance of this risk score in BC was further examined by Kaplan-Meier analysis (Figure 2D). For external validation, data from GSE37181 were utilized, and the result was in concordant with the TCGA cohort (Figure 2E).
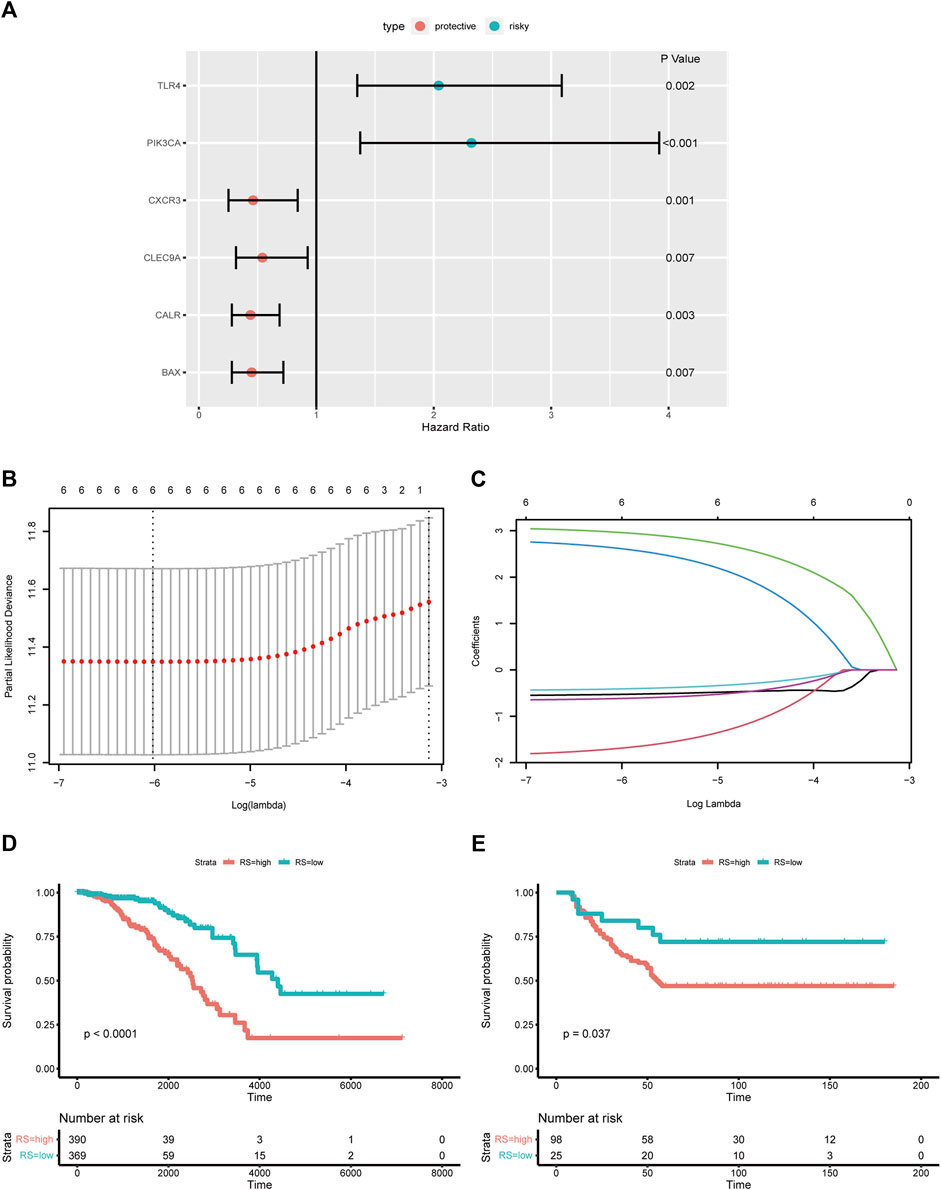
FIGURE 2. Construction and validation of the ICD-based risk score (A) Forest plot shows the HRs of six ICD-related DEGs; (B,C) Lasso regression of six ICD-related DEGs; (D) Kaplan-Meier analysis of the ICD-based risk score in training cohort; (E) Kaplan-Meier analysis of the ICD-based risk score in external validation cohort; abbreviations: HR, hazard ratio; ICD, immunogenic cell death; DEGs, differential expressed genes.
Risk score distribution in breast cancer molecular subtypes
BC is a heterogeneous disease. In the training set we used for model development, 682 patients had records of hormone receptor and HER2 receptor data, in which hormone receptor-positive (HR+ HER2−) patients accounted for 67% (n = 457), triple-negative BC (TNBC) patients and HER2+ (HR+ HER2−/HR− HER2+) patients accounted for 19% (n = 127) and 14% (n = 98), respectively. Since the number of HER2 positive patients is relatively small, we defined the HER2+ group irrespective of the hormone receptor status. Wilcoxon test indicated that the risk score distribution was statistically different between TNBC and HR+ or HER2+ groups (Figure 3A). To confirm the predictive ability of the risk score in different subtypes, we carried out Kaplan-Meier analysis and generated ROC curves in each subtype (Figures 3B–D). The ICD-based risk score was effective in three molecular subtypes, especially in the TNBC group, for the area under the ROC curve (AUC) reached 0.921 for 10-year OS.
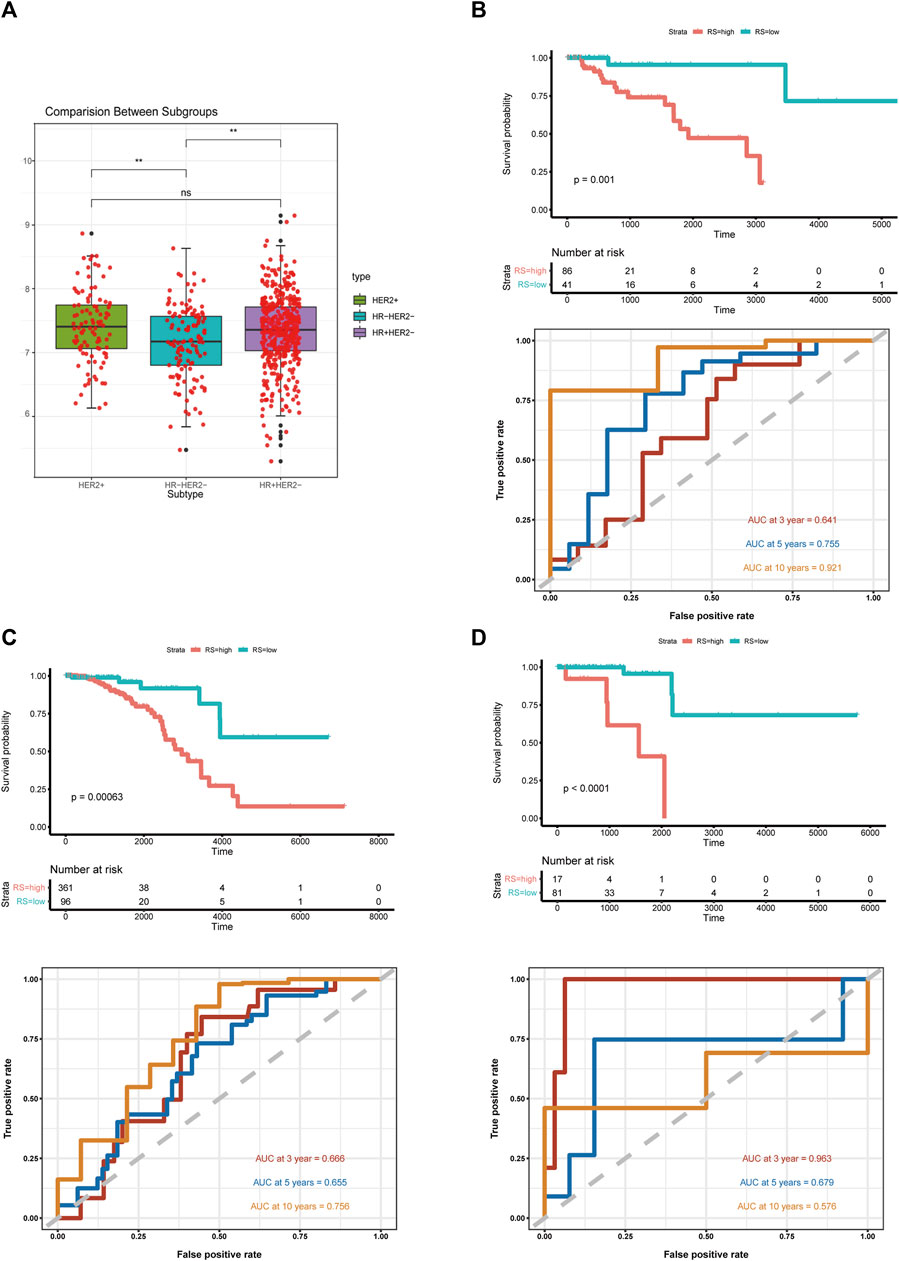
FIGURE 3. Risk score distribution in breast cancer molecular subtypes (A) Box plot of ICD-based risk score distribution among breast cancer molecular subtypes; (B) Kaplan-Meier analysis and ROC curves of TNBC; (C) Kaplan-Meier analysis and ROC curves of HR+ breast cancer samples; (D) Kaplan-Meier analysis and ROC curves of HER2+ breast cancer samples; abbreviations: ICD, immunogenic cell death; TNBC, triple-negative breast cancer; HR, hormone receptor; *p < 0.05, **p < 0.01, ***p < 0.001, and ****p < 0.0001.
Immunogenic cell death-based risk score is an independent prognostic factor in breast cancer
To further validate the prediction power of the risk score, we evaluated the prognostic effect of ICD-based risk score with age, nodule status, ER status, HER2 status and T stage in univariate cox regression analysis and multivariate cox regression analysis (Figures 4A,B). The risk score and age were independent prognostic factors according to the results, and two-way stepwise regression used in multivariate cox regression selected ER status, age and risk score to develop the final prognostic model. A nomogram was constructed based on multivariate cox regression results (Figure 4C), and the ROC curves and calibration curves were generated for 3-, 5- and 10-year survival (Figure 4D). The AUCs of the nomogram were 0.768, 0.737, and 0.729 for 3-, 5- and 10-year survival. We further validated the model in an external validation cohort, and the ROC curves and calibration curves were illustrated in Supplementary Figures S1A–C. In general, higher OS rates were associated with a lower risk score, younger age and ER-positive status.
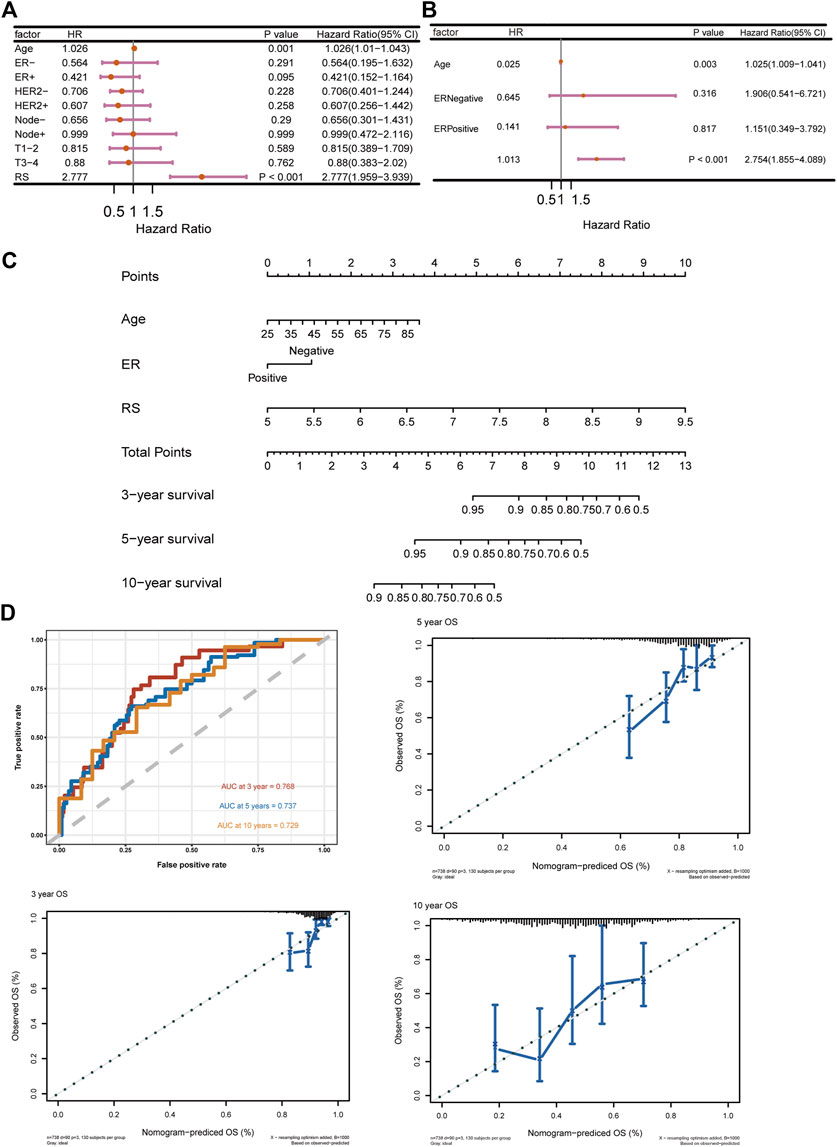
FIGURE 4. ICD-based risk score is an Independent prognostic factor (A) Univariate cox regression of ICD-based risk score and other risk factors in breast cancer; (B) Multivariate cox regression of ICD-based risk score, age, and ER status in breast cancer; (C) Nomogram based on multivariate cox analysis results; (D) ROC curves and calibration curves for 3-, 5- and 10-year survival; abbreviations: ICD, immunogenic cell death; ER, estrogen receptor.
Identification of differentially expressed signaling pathways in different risk groups
For better understanding of the pathogenic molecular mechanism underlying the disparity of prognosis in two risk groups, we performed GO and KEGG analyses. The DEGs in low-risk group were enriched in gene sets associated with immunity, including regulation of immune effector process in GO analysis, and antigen processing and presentation, natural killer cell-mediated cytotoxicity, Th1, Th2 and Th17 cell differentiation, T cell receptor signaling pathways, B cell receptor signaling pathways and PD-L1 expression pathways in KEGG analysis (Figures 5A–C). GSVA was used to compare the expression of immune-related signatures across the training datasets, using REACTOME pathway gene sets (Figure 5D). Compared with the high-risk group, most of the pathways were enriched in the low-risk group. In contrast, interleukin-16-associated pathways expressed higher in the high-risk group, which are pro-tumorigenesis, according to previous studies (Grivennikov and Karin, 2011). Furthermore, the GSVA analysis showed that regulation of innate immune response to cytosolic DNA was the most enriched pathway in low-risk TNBC in comparison to its high-risk counterpart, which is crucial for ICD danger signaling (Figure 5E).
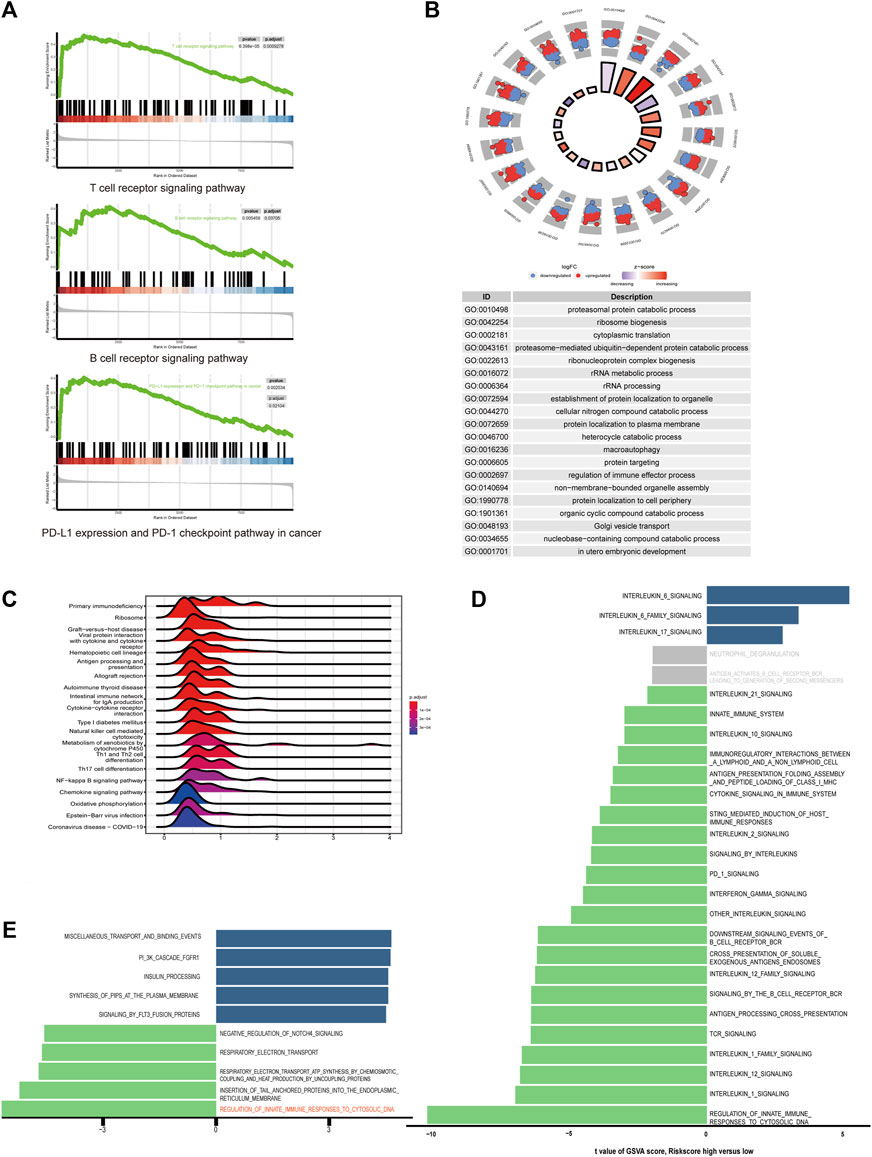
FIGURE 5. Differentially expressed signaling pathways in high and low-risk groups (A) Lymphocyte and immune check point related pathways enriched in low-risk group in GSEA analysis. (B) Ridge plot of KEGG analysis between high-risk and low-risk groups. The color of the ridges represents adjust p-value. (C) Circle plot of GO analysis. The color of the dots indicates log2 fold change. (D) Bar plot of GSVA analysis of immune-related pathways in Reactome database ordered by t score. T scores between −2 and 2 are colored in grey. (E) Bar plot of GSVA analysis in triple-negative breast cancer.
Since high TMB is associated with more neoantigens that could be recognized by the immune system, we analyzed somatic mutation profiles between the two risk groups (Maleki Vareki, 2018). TP53 and PIK3CA were the most frequent mutations in both groups, and the median TMB of the low-risk group was slightly higher than the high-risk group (Supplementary Figures S2A,B).
High risk score is associated with immune suppressive tumor microenvironment
Given that the ICD-based risk score was related to tumor immunity, we next assessed the immune status of tumor microenvironment in different groups. We performed CIBERSORT algorithm to calculate the immune cells in the two risk groups. Low-risk group was associated with considerably more CD8+ T cells and fewer M2 macrophages than the high-risk group (Figure 6A). Immunophenoscore (IPS) was constructed using the expression of immune-related gene signatures, including MHC molecules, immunomodulators, effector cells and suppressor cells. Higher immunophenoscore represents higher tumor immunogenicity (Charoentong et al., 2017). Both IPS and the immune score calculated by the ESTIMATE algorithm in low-risk group were statistically higher than high-risk group, indicating immune hot tumors (Figure 6B). The tumor immune exclusion score, which was generated based on signatures of immune suppressive cells, namely cancer-associated fibroblasts (CAFs), myeloid-derived suppressor cells (MDSCs) and the M2 subtype of tumor-associated macrophages (TAMs), showed a higher median score in high-risk group, indicating an immune suppressive microenvironment (Figure 6B). Furthermore, in the differential analysis, most of the human leukocyte antigen (HLA) genes and immune checkpoints had significantly higher expression levels in the low-risk group (Figure 6D). To further validate the clinical importance of the ICD-related gene signature, GSVA analysis was performed on the I-SPY2 trial dataset. For patients treated with Pembrolizumab and achieved Pathologic Complete Response (PCR), the GSVA scores were significantly higher than the non-PCR group, indicating the gene signature was positively correlated with immunotherapy responses (Figure 6C).
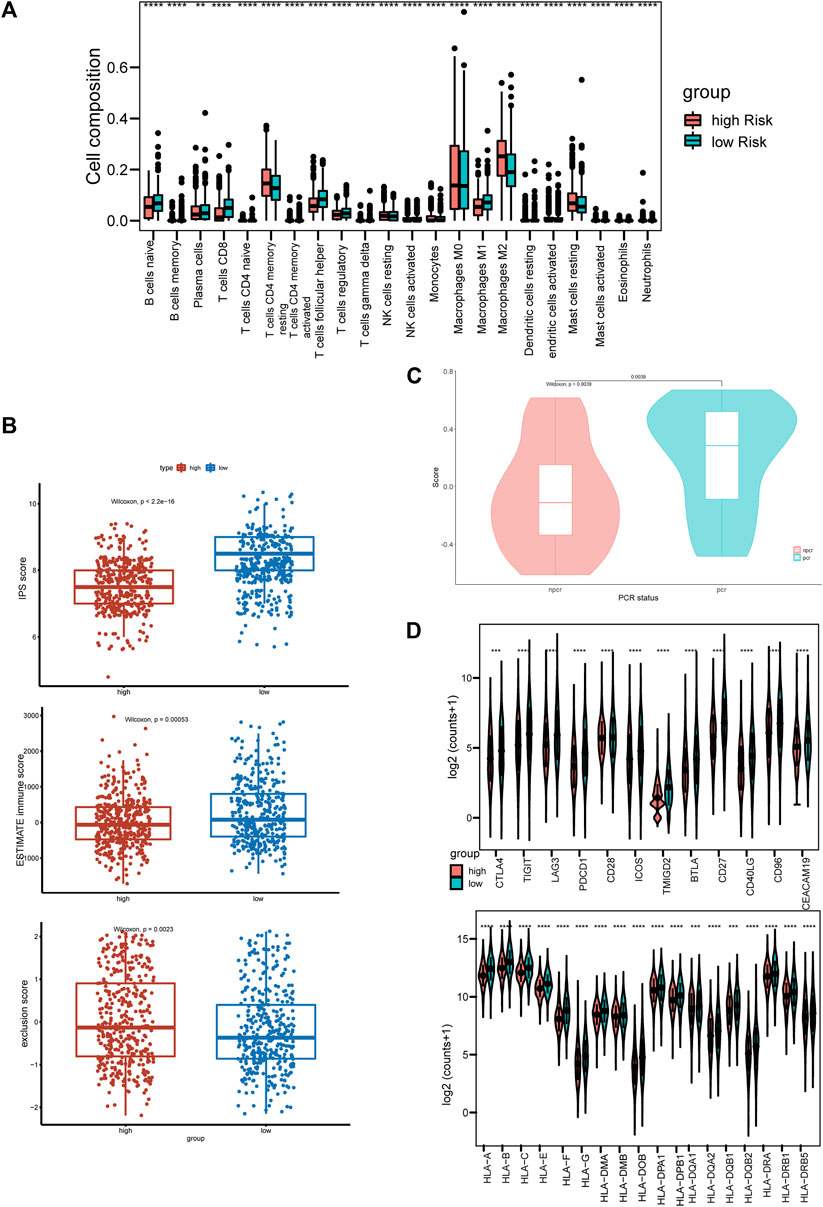
FIGURE 6. High-risk score is associated with immune-suppressive tumor microenvironment (A) Boxplot of immune cell compositions calculated by CIBERSORT algorithm of high-risk and low-risk groups. (B) Boxplots of IPS score (top), ESTIMATE immune score (middle), and TIDE exclusion score (bottom). Red and blue represent the high-risk group, and low-risk group, respectively. (C) Violin plot of the gene signature scores in PCR and non-PCR groups. (D) The expression levels of co-stimulation and HLA molecules. *p < 0.05, **p < 0.01, ***p < 0.001, and ****p < 0.0001.
Discussion
One of the leading causes of ICD is anti-cancer therapy, including chemotherapy (Galluzzi et al., 2017). Multiple chemotherapy drugs commonly used in BC have been demonstrated to have immune- modulatory effect, including Anthracyclines and Taxanes (Ramakrishnan et al., 2010; Mattarollo et al., 2011). Immune checkpoint inhibitors (ICIs), which target PD-1 and PD-L1 improve therapeutic efficacy by enhancing immunogenicity, and the combination of ICIs with conventional chemotherapy drugs performs a synergetic effect (Galluzzi et al., 2020a). A Series of clinical trials have proven the efficacy of combination therapies in BC, and found the clinical benefits correlated with patients’ immune status, such as the presence and abundance of tumor-infiltrating lymphocytes (TILs) (Nanda et al., 2020; Schmid et al., 2020). Therefore, it could be advantageous to identify ICD-related biomarkers that help with the risk stratification of BC patients.
In this study, we demonstrated that the ICD-related genes are closely associated with prognosis and tumor microenvironment of BC. We identified six differentially expressed genes that impacted overall survivals of BC patients and developed a prognosis model with external validation. Moreover, we found that the ICD-based risk score was closely associated with tumor immune microenvironment. Previous studies have confirmed that both immunotherapy and chemotherapy induce anti-tumor immune responses, including the expansion of CD8+ T cells, etc. (Krysko et al., 2012; Philip and Schietinger, 2022). In our study, high-risk score indicates the immune exclude subtype, which can be potentially improved by immunotherapy and chemotherapy. Interestingly, our results showed better long-term prognostic power for HR+ HER2− subtype and TNBC instead of HER2+ subtype. This finding could suggest that immune status, which is closely related to the efficacy of immunotherapy and chemotherapy is more important in HER2− subtypes rather than in HER2+ subtype, for HER2− targeted therapy brings significant benefits to HER2+ patients.
The genes we selected for model construction have been proved to play essential roles in tumor growth, invasion, and metastasis. CALR and BAX, components of ICD-danger signaling pathways, are both independent prognosis predictors in BC (Binder et al., 1996; Lwin et al., 2010). PIK3CA and TLR4 contribute to tumorigenesis through the phosphoinositide 3 (PI3)-kinase/Akt signaling pathway and IPS/TLR4 pathway, respectively (Verret et al., 2019; Afroz et al., 2022). CLEC9A and CXCR3 are associated with intratumoral dendritic cells (DCs), which are necessary for anti-tumor immunity. CLEC9A is a biomarker for DCs, while chemoattractant receptor CXCR3 influences the biological function of DCs (de Mingo Pulido et al., 2018; Hammerl et al., 2021). Furthermore, Xu et al. (2022) classified ICD-associated DAMPs into three subtypes in TNBC patients, among which the inflammatory DAMPs was featured with high expression of CALR, higher anti-tumor immune cell infiltration, and better prognosis. This finding is in concordant with our results, for the low-risk group had considerably higher expression of CALR (Xu et al., 2022).
Conclusion
In conclusion, our study addressed the importance of ICD in the modulation of tumor immune microenvironment in breast cancer. Besides, we constructed and validated an ICD-based prognostic signature, which served significant value in predicting OS of breast cancer patients.
Data availability statement
The original contributions presented in the study are included in the article/Supplementary Material, further inquiries can be directed to the corresponding authors.
Author contributions
YL and ZR wrote the main manuscript. YL, ML, HZ, TW, and WC performed bioinformatic analysis. YD, JF, ZC, AH, TY, YZ, YS, and TW collected datasets and prepared figures. FM and BG designed this study.
Conflict of interest
The authors declare that the research was conducted in the absence of any commercial or financial relationships that could be construed as a potential conflict of interest.
Publisher’s note
All claims expressed in this article are solely those of the authors and do not necessarily represent those of their affiliated organizations, or those of the publisher, the editors and the reviewers. Any product that may be evaluated in this article, or claim that may be made by its manufacturer, is not guaranteed or endorsed by the publisher.
Supplementary material
The Supplementary Material for this article can be found online at: https://www.frontiersin.org/articles/10.3389/fgene.2022.1069921/full#supplementary-material
References
Afroz, R., Tanvir, E. M., Tania, M., Fu, J., Kamal, M. A., and Khan, M. A. (2022). LPS/TLR4 pathways in breast cancer: Insights into cell signalling. Curr. Med. Chem. 29, 2274–2289. doi:10.2174/0929867328666210811145043
Binder, C., Marx, D., Binder, L., Schauer, A., and Hiddemann, W. (1996). Expression of Bax in relation to Bcl-2 and other predictive parameters in breast cancer. Ann. Oncol. 7, 129–133. doi:10.1093/oxfordjournals.annonc.a010538
Charoentong, P., Finotello, F., Angelova, M., Mayer, C., Efremova, M., Rieder, D., et al. (2017). Pan-cancer immunogenomic analyses reveal genotype-immunophenotype relationships and predictors of response to checkpoint blockade. Cell Rep. 18, 248–262. doi:10.1016/j.celrep.2016.12.019
De Mingo Pulido, Á., Gardner, A., Hiebler, S., Soliman, H., Rugo, H. S., Krummel, M. F., et al. (2018). TIM-3 regulates CD103+ dendritic cell function and response to chemotherapy in breast cancer. Cancer Cell 33, 60–74. doi:10.1016/j.ccell.2017.11.019
Donegan, W. L. (1997). Tumor-related prognostic factors for breast cancer. Ca. Cancer J. Clin. 47, 28–51. doi:10.3322/canjclin.47.1.28
Ellis, M. J., Suman, V. J., Hoog, J., Lin, L., Snider, J., Prat, A., et al. (2011). Randomized phase II neoadjuvant comparison between letrozole, anastrozole, and exemestane for postmenopausal women with estrogen receptor-rich stage 2 to 3 breast cancer: Clinical and biomarker outcomes and predictive value of the baseline PAM50-based intrinsic subtype--ACOSOG Z1031. J. Clin. Oncol. 29, 2342–2349. doi:10.1200/JCO.2010.31.6950
Exner, R., Sachet, M., Arnold, T., Zinn-Zinnenburg, M., Michlmayr, A., Dubsky, P., et al. (2016). Prognostic value of HMGB1 in early breast cancer patients under neoadjuvant chemotherapy. Cancer Med. 5, 2350–2358. doi:10.1002/cam4.827
Galluzzi, L., Buqué, A., Kepp, O., Zitvogel, L., and Kroemer, G. (2017). Immunogenic cell death in cancer and infectious disease. Nat. Rev. Immunol. 17, 97–111. doi:10.1038/nri.2016.107
Galluzzi, L., Humeau, J., Buqué, A., Zitvogel, L., and Kroemer, G. (2020a). Immunostimulation with chemotherapy in the era of immune checkpoint inhibitors. Nat. Rev. Clin. Oncol. 17, 725–741. doi:10.1038/s41571-020-0413-z
Galluzzi, L., Vitale, I., Warren, S., Adjemian, S., Agostinis, P., Martinez, A. B., et al. (2020b). Consensus guidelines for the definition, detection and interpretation of immunogenic cell death. J. Immunother. Cancer 8, e000337. doi:10.1136/jitc-2019-000337
Galon, J., and Bruni, D. (2020). Tumor immunology and tumor evolution: Intertwined histories. Immunity 52, 55–81. doi:10.1016/j.immuni.2019.12.018
Grivennikov, S. I., and Karin, M. (2011). Inflammatory cytokines in cancer: Tumour necrosis factor and interleukin 6 take the stage. Ann. Rheum. Dis. 70 (1), i104–i108. doi:10.1136/ard.2010.140145
Hammerl, D., Martens, J. W. M., Timmermans, M., Smid, M., Trapman-Jansen, A. M., Foekens, R., et al. (2021). Spatial immunophenotypes predict response to anti-PD1 treatment and capture distinct paths of T cell evasion in triple negative breast cancer. Nat. Commun. 12, 5668. doi:10.1038/s41467-021-25962-0
Jiang, P., Gu, S., Pan, D., Fu, J., Sahu, A., Hu, X., et al. (2018). Signatures of T cell dysfunction and exclusion predict cancer immunotherapy response. Nat. Med. 24, 1550–1558. doi:10.1038/s41591-018-0136-1
Kroemer, G., Galassi, C., Zitvogel, L., and Galluzzi, L. (2022). Immunogenic cell stress and death. Nat. Immunol. 23, 487–500. doi:10.1038/s41590-022-01132-2
Krysko, D. V., Garg, A. D., Kaczmarek, A., Krysko, O., Agostinis, P., and Vandenabeele, P. (2012). Immunogenic cell death and DAMPs in cancer therapy. Nat. Rev. Cancer 12, 860–875. doi:10.1038/nrc3380
Lwin, Z.-M., Guo, C., Salim, A., Yip, G. W.-C., Chew, F.-T., Nan, J., et al. (2010). Clinicopathological significance of calreticulin in breast invasive ductal carcinoma. Mod. Pathol. 23, 1559–1566. doi:10.1038/modpathol.2010.173
Maleki Vareki, S. (2018). High and low mutational burden tumors versus immunologically hot and cold tumors and response to immune checkpoint inhibitors. J. Immunother. Cancer 6, 157. doi:10.1186/s40425-018-0479-7
Mariotto, A., Jayasekerea, J., Petkov, V., Schechter, C. B., Enewold, L., Helzlsouer, K. J., et al. (2020). Expected monetary impact of oncotype DX score-concordant systemic breast cancer therapy based on the TAILORx trial. J. Natl. Cancer Inst. 112, 154–160. doi:10.1093/jnci/djz068
Mattarollo, S. R., Loi, S., Duret, H., Ma, Y., Zitvogel, L., and Smyth, M. J. (2011). Pivotal role of innate and adaptive immunity in anthracycline chemotherapy of established tumors. Cancer Res. 71, 4809–4820. doi:10.1158/0008-5472.CAN-11-0753
Nanda, R., Liu, M. C., Yau, C., Shatsky, R., Pusztai, L., Wallace, A., et al. (2020). Effect of Pembrolizumab plus neoadjuvant chemotherapy on pathologic Complete response in women with early-stage breast cancer: An analysis of the ongoing phase 2 adaptively randomized I-SPY2 trial. JAMA Oncol. 6, 676–684. doi:10.1001/jamaoncol.2019.6650
PagèS, F., Mlecnik, B., Marliot, F., Bindea, G., Ou, F.-S., Bifulco, C., et al. (2018). International validation of the consensus Immunoscore for the classification of colon cancer: A prognostic and accuracy study. Lancet (London, Engl. 391, 2128–2139. doi:10.1016/S0140-6736(18)30789-X
Pashayan, N., Antoniou, A. C., Ivanus, U., Esserman, L. J., Easton, D. F., French, D., et al. (2020). Personalized early detection and prevention of breast cancer: ENVISION consensus statement. Nat. Rev. Clin. Oncol. 17, 687–705. doi:10.1038/s41571-020-0388-9
Philip, M., and Schietinger, A. (2022). CD8+ T cell differentiation and dysfunction in cancer. Nat. Rev. Immunol. 22, 209–223. doi:10.1038/s41577-021-00574-3
Ramakrishnan, R., Assudani, D., Nagaraj, S., Hunter, T., Cho, H.-I., Antonia, S., et al. (2010). Chemotherapy enhances tumor cell susceptibility to CTL-mediated killing during cancer immunotherapy in mice. J. Clin. Invest. 120, 1111–1124. doi:10.1172/JCI40269
Schmid, P., Salgado, R., Park, Y. H., MuñOZ-Couselo, E., Kim, S. B., Sohn, J., et al. (2020). Pembrolizumab plus chemotherapy as neoadjuvant treatment of high-risk, early-stage triple-negative breast cancer: Results from the phase 1b open-label, multicohort KEYNOTE-173 study. Ann. Oncol. 31, 569–581. doi:10.1016/j.annonc.2020.01.072
Sung, H., Ferlay, J., Siegel, R. L., Laversanne, M., Soerjomataram, I., Jemal, A., et al. (2021). Global cancer statistics 2020: GLOBOCAN estimates of incidence and mortality worldwide for 36 cancers in 185 countries. Ca. Cancer J. Clin. 71, 209–249. doi:10.3322/caac.21660
Verret, B., Cortes, J., Bachelot, T., Andre, F., and Arnedos, M. (2019). Efficacy of PI3K inhibitors in advanced breast cancer. Ann. Oncol. 30, x12–x20. doi:10.1093/annonc/mdz381
Xu, M., Lu, J.-H., Zhong, Y.-Z., Jiang, J., Shen, Y.-Z., Su, J.-Y., et al. (2022). Immunogenic cell death-relevant damage-associated molecular patterns and sensing receptors in triple-negative breast cancer molecular subtypes and implications for immunotherapy. Front. Oncol. 12, 870914. doi:10.3389/fonc.2022.870914
Keywords: immunogenic cell death, immunotherapy, breast cancer, prognosis model, RNA-seq
Citation: Li Y, Feng J, Wang T, Li M, Zhang H, Rong Z, Cheng W, Duan Y, Chen Z, Hu A, Yu T, Zhang J, Shang Y, Zou Y, Ma F and Guo B (2022) Construction of an immunogenic cell death-based risk score prognosis model in breast cancer. Front. Genet. 13:1069921. doi: 10.3389/fgene.2022.1069921
Received: 14 October 2022; Accepted: 28 November 2022;
Published: 13 December 2022.
Edited by:
Yi Yao, Renmin Hospital of Wuhan University, ChinaReviewed by:
Dahmane Oukrif, University College London, United KingdomYanmei Zou, Huazhong University of Science and Technology, China
Copyright © 2022 Li, Feng, Wang, Li, Zhang, Rong, Cheng, Duan, Chen, Hu, Yu, Zhang, Shang, Zou, Ma and Guo. This is an open-access article distributed under the terms of the Creative Commons Attribution License (CC BY). The use, distribution or reproduction in other forums is permitted, provided the original author(s) and the copyright owner(s) are credited and that the original publication in this journal is cited, in accordance with accepted academic practice. No use, distribution or reproduction is permitted which does not comply with these terms.
*Correspondence: Fei Ma, d2Fmc2ZkQHNpbmEuY29t; Baoliang Guo, YmFvbGlhbmdndW8yMDEzQDE2My5jb20=
†These authors have contributed equally to this work
 Yanling Li†
 Weilun Cheng
 Ziang Chen
 Baoliang Guo