 Liangliang Wang
 Li Wang3
94% of researchers rate our articles as excellent or good
Learn more about the work of our research integrity team to safeguard the quality of each article we publish.
Find out more
ORIGINAL RESEARCH article
Front. Genet. , 09 December 2022
Sec. Computational Genomics
Volume 13 - 2022 | https://doi.org/10.3389/fgene.2022.1064432
This article is part of the Research Topic Systematic Identification of Novel Diagnostic and Prognostic Tumor Biomarkers Based on Multi-Omics Data Analysis of Solid Tumors View all 22 articles
Background: Hepatocellular carcinoma (HCC) is a malignancy with a poor prognosis. This study aimed to distinguish patients with HCC having distinct tumour immune microenvironment (TIME) features and construct an immune-related gene signature (IRGs) to assess prognosis and provide a basis for personalised therapies.
Methods: Transcriptomic data of patients with HCC were downloaded from The Cancer Genome Atlas (TCGA) and Gene Expression Omnibus (GEO) databases. We assessed the immune cell infiltration in each HCC specimen using single sample gene set enrichment analysis (ssGSEA) and classified all patients with HCC into high- and low-immune clusters using a hierarchical clustering algorithm. The ESTIMATE and CIBERSORT computational methods were employed to verify the stability and effectiveness of the immune clusters. Subsequently, the differentially expressed genes (DEGs) of the high- and low-immune clusters and the immune-related genes intersected to obtain the immune-related DEGs. The least absolute shrinkage and selection operator (LASSO) was then employed to screen the optimal genes for the construction of a prognostic predictive signature and to divide patients into high- and low-risk subgroups. The predictive efficacy of the IRGs was further confirmed using Kaplan–Meier survival curves, univariate and multifactorial Cox regression and time-dependent ROC curves in the TCGA and GSE14520 validation cohorts. Furthermore, we developed a nomogram to predict the prognosis. Tumour mutation burden (TMB) was also analysed in the risk groups. Additionally, gene ontology and gene set variation analysis were used for biological function and pathway exploration. Lastly, drug sensitivity analyses were employed to investigate prospective therapeutics in the two risk populations.
Results: Immune cluster analysis based on ssGSEA could well distinguish the TIME characteristics of patients with HCC. The stromal score, immune score and ESTIMATE score were all lower in the low-immune cluster. Meanwhile, most of the immune checkpoint-related genes and HLA family genes were overexpressed in the high-immune cluster, suggesting that this cluster could be a beneficial population for immune checkpoint inhibitors therapy. There were 1,617 DEGs between the two immune clusters, of which 414 genes intersected with immune-associated genes. Furthermore, Cox regression analysis revealed 49 DEGs that were associated with survival. Then, 19 DEGs were screened using the LASSO algorithm for IRGs construction and patients were classified into high- and low-risk groups. Both the constructed signature and nomogram had good prognostic predictive efficacy. The signature-based risk score was an independent prognostic predictor in both the TCGA and GSE14520 cohorts. Additionally, there was no significant difference in TMB between the two risk populations. Lastly, the half-maximal inhibitory concentrations of certain chemotherapeutic and targeted therapeutic agents differed between the two risk groups.
Conclusion: Our study provides a personalized tool for predicting the prognosis and TIME landscape of HCC and a basis for developing personalised treatment regimens.
According to the GLOBOCAN 2020 report (Sung et al., 2021), hepatocellular carcinoma (HCC) accounts for 90% of all primary liver cancer and is one of the most common cancers in humans, characterized by insidious onset, poor prognosis and high mortality (Huang et al., 2020; Llovet et al., 2021). Despite advancements in diagnostic and therapeutic approaches for HCC, the prognosis for individuals with HCC remains poor, with an estimated 5-year survival rate of only 18% (Craig et al., 2020). Current systemic treatments, such as tyrosine kinase inhibitors (TKIs) and immune checkpoint inhibitors (ICIs), provide patients with more therapeutic choices; however, the high heterogeneity of HCC limits their efficacy and compromises the precision of prognostic prediction (Liu et al., 2016). Hence, sensitive and reliable indicators are needed to assess individualized differences and prognosis, thereby providing a reliable basis for the development of personalised patient treatment strategies.
With the rapid development of tumour immunology, ICI-based immunological therapies have achieved significant progress in the management of various tumours, providing novel options for the treatment of HCC (Jácome et al., 2021; Mamdani et al., 2022; Teixeira Farinha et al., 2022). The main advantage of immunotherapy is its relatively long-lasting effect; however, ICIs are only 12–20% effective compared to monotherapy (Abd El Aziz et al., 2020). In the CheckMate 459 (Yau et al., 2022) and KEYNOTE-240 (Finn et al., 2020b) clinical trials, ICSs monotherapy failed to meet the pre-defined clinical trial endpoints. In terms of combination therapy, the phase II study of nivolumab plus ipilimumab achieved results. The Investigator-assessed objective response rate (ORR) was 32% (Yau et al., 2020). In the phase III clinical trial (IMbrave150), the median OS was 19.2 months with atezolizumab plus bevacizumab and 13.4 months with sorafenib (Cheng et al., 2022). In addition, the combination of Pembrolizumab with Lenvatinib also showed efficacy in phase I clinical trials. The ORR was 36% and the median OS was 22 months (Finn et al., 2020a). Together, the above studies suggest the potential of immunotherapy in HCC.
The evolution of tumours is closely linked to the tumour immune microenvironment (TIME), which contains a variety of immune cells, stromal cells and cytokines, all of which can interact with tumour cells to form a highly complex system. Increasingly, studies have demonstrated that the regulation of immune system networks in TIME and tumour interactions have a significant impact on tumour prognosis and response to immunotherapy (Pitt et al., 2016; Binnewies et al., 2018; Galon and Bruni, 2019). In addition, TIME is a heterogeneous environment, and the TIME characteristics of individuals are often the result of randomisation across factors. Therefore, the development of novel and effective immune-related predictive biomarkers to analyse the correlation between TIME and HCC can help to determine the prognosis and TIME features of patients with HCC, allowing for the personalised selection of therapeutic strategies for ICIs.
The present study uses single sample gene set enrichment analysis (ssGSEA) and cluster analysis to classify patients with HCC into high- and low-immune clusters, whereas ESTIMATE and CIBERSORT analyses verify the stability and validity of the immune clusters. Furthermore, LASSO regression analysis establishes an immune-related gene signature (IRGs) to further validate the prognostic value of the IRGs in The Cancer Genome Atlas (TCGA) and GSE14520 independent cohorts. Additionally, we construct a nomogram to predict the prognosis of patients with HCC. Furthermore, Tumour mutation burden (TMB) also analyses the high- and low-risk groups. Gene set variation analysis (GSVA) and Gene Ontology (GO) analysis were also used for biological function and pathway exploration in this study. Finally, the IC50 of certain chemotherapeutic and targeted therapeutic agents were also analysed in high- and low-risk populations. Our results will not only help to determine the prognosis of clinical patient with HCC, but also provide a basis for the selection of personalized clinical treatment regimens. However, the conclusions need to be further validated in real-world prospective clinical trials.
The transcriptome expression data, mutation data and relevant clinicopathological parameters of patients with HCC in the TCGA-LIHC cohort were downloaded from the TCGA repository (https://portal.gdc.cancer.gov/). Strawberry Perl was used for transcriptomic and clinical data collation. Transcriptome data and relevant clinicopathological data of the independent validation cohort (GSE14520) were obtained from the Gene Expression Omnibus (GEO) database (https://www.ncbi.nlm.nih.gov/). Additionally, immune-related genes were obtained from the ImmPort database (https://www.immport.org/shared/home).
Gene set enrichment analysis (GSEA) is a computational method that classifies sets of genes with common functions (Subramanian et al., 2005), whereas ssGSEA analyses the absolute enrichment of one gene set per sample within a given data set (Barbie et al., 2009). In the present study, ssGSEA was used to generate the enrichment fraction of 29 immune cells in each sample (Chen et al., 2022). The patients in the TCGA cohort were further classified into low- and high-immune clusters using cluster analysis. In this process R packages ‘GSVA’, ‘limma’, ‘GSEABase’, ‘sparcl’ for cluster analysis, ‘Rtsne’ package for principal component analysis (PCA) and ‘ggplot2’ for the visualisation of the results were used.
ESTIMATE is an expression data-based tumour purity determination algorithm that predicts the level of infiltrating stromal cells and immune cells (Yoshihara et al., 2013). First, the R package ‘ESTIMATE’ was used to calculate the number of stromal and immune cells in the tumour tissue of each HCC case in the TCGA cohort. The total of the immune and stromal scores is the ESTIMATE scores were inversely related to tumour purity. Furthermore, the R package ‘reshape2’ was utilised to reconstruct the data, and the ‘pheatmap’ and ‘ggpubr’ packages were used to draw heat maps and violin maps, respectively, of stromal cells, immune cells and ESTIMATE scores in the high- and low-immune clusters.
CIBERSORT implements a machine-learning algorithm for the high-throughput characterization of different cell types (Newman et al., 2015). The fractions of the 22 tumor-infiltrating immune cells were determined by the R packages “CIBERSORT”, “preprocessCore”, “e1071” and “parallel” and further analyzed for differences in tumour-infiltrating immune cells (TIICs) in the two immune clusters.
Moreover, we further analysed the status of human leukocyte antigen (HLA) and immune checkpoint-related genes in the high- and low-immune typing groups, and the packages ‘ggplot2’ and ‘ggpubr’ were employed to visualize the results.
The ‘limma’ package identified differentially expressed genes (DEGs) between different immunophenotypes of HCC tumours (fold change (FC) > 1.5, false discovery rate (FDR) < 0.05). The ‘ggplot2’ and ‘pheatmap’ packages were used to generate volcano maps and expression heat maps of DEGs, respectively. The ‘venn’ package was used to map Venn diagrams to identify shared genes between DEGs and immune-related genes.
Additionally, gene ontology (GO) analysis of DEGs was performed using the R package ‘clusterProfiler’, ‘org.Hs.eg.db’ and ‘DOSE’. Furthermore, the ‘ggplot2’, ‘circlize’, ‘RColorBrewer’, ‘ggpubr’ and ‘ComplexHeatmap’ packages were employed to map enrichment outcomes and explore the enrichment of DEGs in cellular components, molecular function and biological processes.
The R packages ‘glmnet’, ‘timeROC’, ‘survival’, ‘survminer’ and ‘caret’ were employed to obtain prognosis-related genes and construct IRGs. First, univariate Cox regression analysis screened DEGs associated with survival (p < 0.05) for further analysis. The LASSO algorithm was performed on the univariate prognostic genes to screen the optimal genes to construct the model. Risk scores for all cases were calculated using the following formula:
Survival analysis was performed using the ‘survivor’ and ‘survminer’ packages for the high- and low-risk groups. Moreover, risk curves, risk heat maps, survival curves and survival status plots were created for patients in the TCGA and GEO cohorts. Univariate and multivariate Cox regression analyses were used to determine the prognostic potential of the risk score of the signature. Time-dependent receiver operating characteristics (ROC) analyses were performed using the ‘survminer’, ‘survivor’ and ‘timeROC’ packages, which assessed the prognostic predictive value of the developed signatures. Additionally, Kaplan–Meier (KM) curves were used to analyse survival differences between the high- and low-risk subgroups based on different clinical characteristics (age, gender, tumour stage and tumour grade), thereby determining whether the developed IRGs applied to patients with HCC with different clinicopathological parameters. The ‘ComplexHeatmap’ was employed to draw the status heat map for high- and low-risk groups and clinicopathological parameters. The ‘ggpubr’ package was used to draw box plots of risk scores for different clinical subgroups to identify the correlation of the developed IRGs with different clinicopathological parameters.
The downloaded mutation data were collated using the Strawberry Perl script to generate TMB data for each HCC sample. The package ‘Limma’ was used to analyse the TMB differences between the different risk groups, and the results were plotted using ‘ggpubr’. Additionally, the optimal cut-off values of TMB were obtained using the R software, and patients were further divided into low- and high-TMB groups. Furthermore, the ‘survivor’ and ‘survminer’ were employed to generate the K-M curves of patients in the high- and low-TMB groups combined with the high- and low-risk groups. Finally, the ‘maftools’ package was employed to plot the mutation waterfalls of the 20 genes with the most frequent mutations.
GSVA is a computational method used to detect pathway activity in a sample population (Hänzelmann et al., 2013). The GSVA analysis based on R software provides the enrichment of the Kyoto Encyclopedia of Genes and Genomes (KEGG) pathway in different risk groups and analyses the correlation between the KEGG pathway and signature gene mRNA expression. Accordingly, R packages ‘limma’, ‘reshape2’, ‘ggplot2’, ‘GSVA’, ‘GSEABase’ and ‘pheatmap’ were used.
Tumour stage and risk scores were used to construct nomograms for 1-, three- and 5-year overall survival (OS) based on independent prognostic analysis results. Calibration curves for Hosmer–Lemeshow test were drawn (method = ‘boot’, B = 1,000) to evaluate if the predicted outcomes of the nomogram were in good agreement with the reality. This process utilised the ‘survival’, ‘regplot’ and ‘rms’ packages.
To explore the potential clinical significance of the IRGs in drug therapy, the ‘pRRophetic’ package was employed to obtain the IC50 of different therapeutic agents in the high- and low-risk groups (Chen et al., 2021), and box plots were drawn using the ‘ggpubr’ for drugs with differences in IC50 (p < 0.001).
R software was used to perform all statistical analyses. The significance of differences between K-M survival curves was determined using the log-rank test. Additionally, two-tailed p-values <0.05 were considered significant.
A total of 374 HCC tumour samples were obtained from the TCGA database for transcriptomic data. The level of infiltration of 29 immune cells in each HCC sample was obtained using ssGSEA. Patients were further divided into low- (n = 296) and high-immune clusters (n = 78) using a hierarchical clustering algorithm (Figures 1A,B). The heat map suggested that most immune cells infiltrate at higher levels in the high-immune cluster than in the low-immune cluster (Figure 1C). Furthermore, violin plots showed that all three scores were lower in the low-immune cluster than in the high-immune cluster (p < 0.001) (Figure 1D), which was consistent with the results of ssGSEA. This also reflected the low level of tumour purity in the high-immune cluster. Additionally, CIBERSORT analysis showed that the proportion of CD8+ T Cells, activated memory CD4+ T Cells, T follicular helper cells, resting dendritic cells and regulatory cells (Tregs) were higher in the high-immune cluster than in the low-immune cluster (p < 0.05) (Figure 1E). Box plots revealed that the expression of most immune checkpoint-related genes and HLA family-related genes were also significantly higher in the high-immune cluster than in the low-immune cluster (Figures 1F,G). Thus, the above results highlight the reliability of the ssGSEA-based immune clusters.
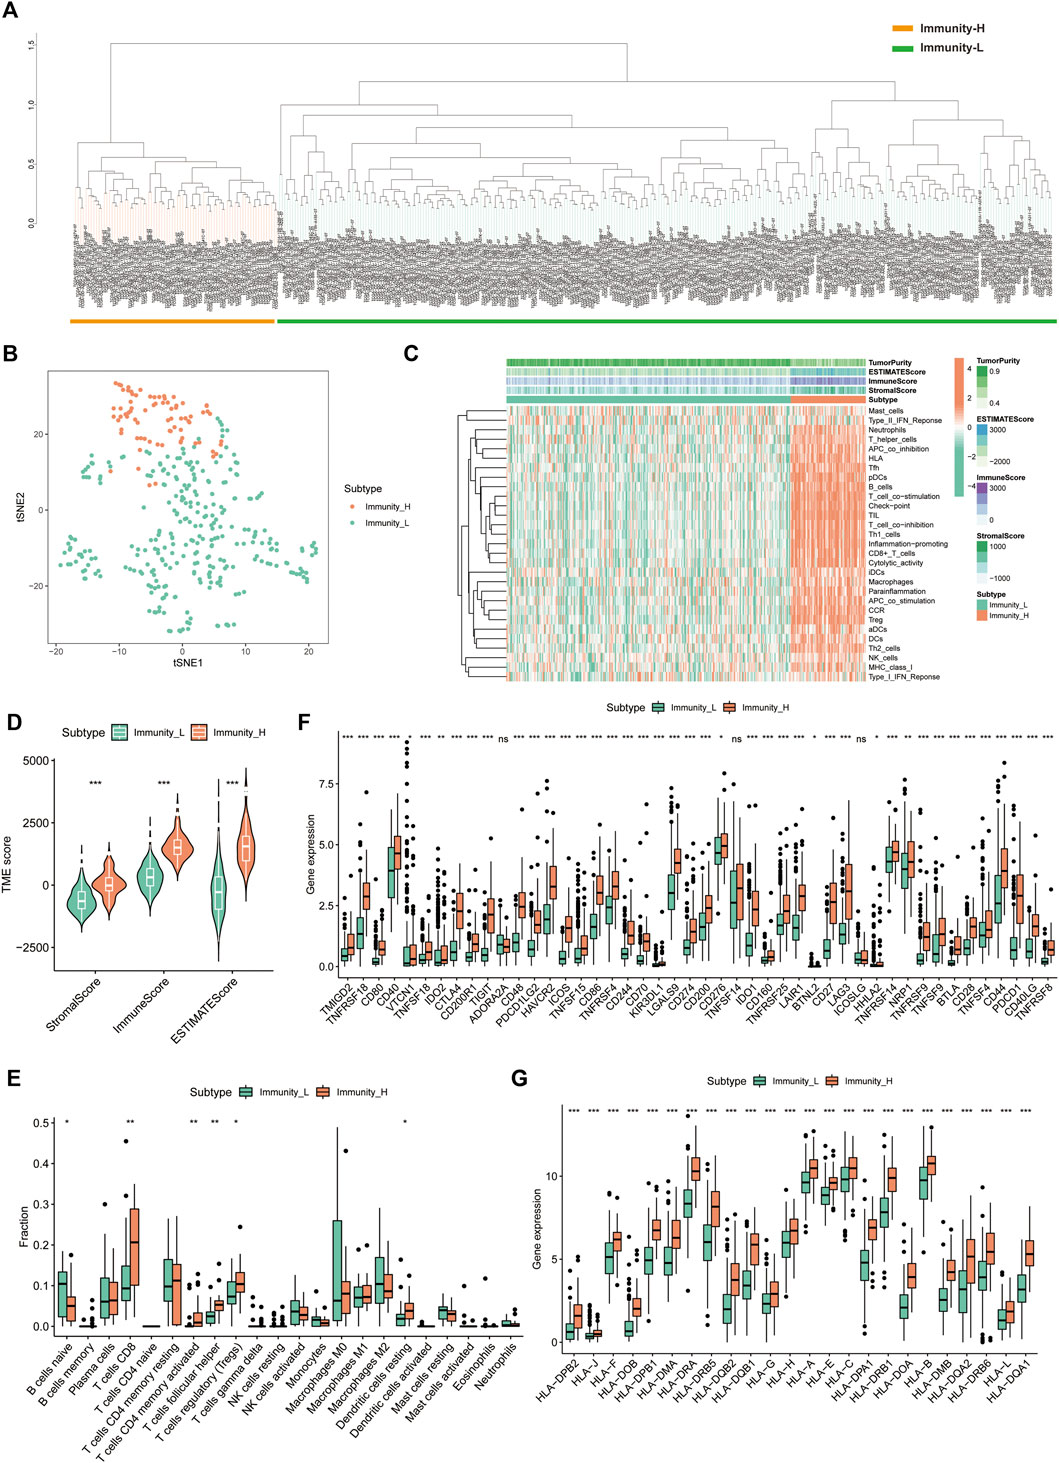
FIGURE 1. Single sample gene set enrichment analysis -based immune cluster analysis. (A) The hepatocellular carcinoma samples from The Cancer Genome Atlas cohort were divided into a high immune cell infiltration cluster (orange) and a low immune cell infiltration cluster (green). (B) The principal component analysis plot of the distribution status of the high- and low-immune clusters. (C) Enrichment levels of different types of immune cells in the high- and low-immune clusters. Tumour purity, ESTIMATE score, immune score and stromal score are displayed for each sample in combination with clustering information. (D) Violin plots of ESTIMATE score, immune score and stromal score in different immune clusters. (E) The box plot shows the difference in immune cell infiltration between the two clusters based on the CIBERSORT algorithm. (F,G) Box plots show the differences in the expression of immune checkpoint-related genes and HLA family genes in the two clusters, respectively. *p < 0.05, **p < 0.01 and ***p < 0.001.,
Using differential analysis, we obtained 1,617 DEGs between the high- and low-immune clusters, of which 246 were down-regulated and the remaining 1,371 were up-regulated in the high-immune cluster (Figure 2A). After intersecting the DEGs with the 1793 immune-related genes derived from the ImmPort database, we obtained 414 immune-related DEGs (Figure 2B). The heat map displays the expression of the immune-related DEGs in the high- and low-immune clusters (Figure 2C).
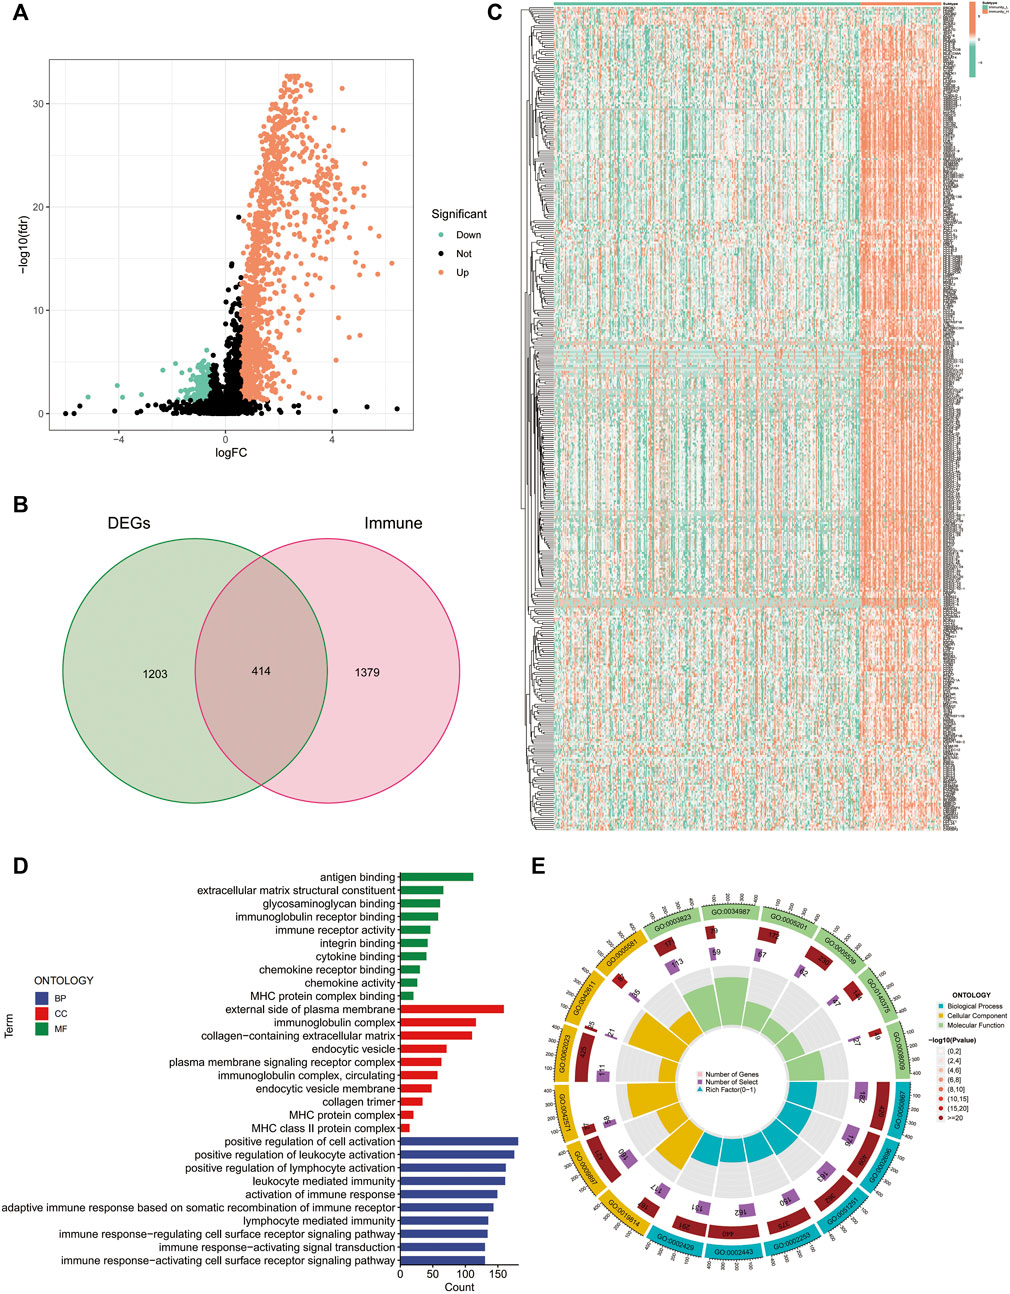
FIGURE 2. Differentially expressed genes between the high and low-immune clusters. (A) Volcano map of differentially expressed genes between the high- and low-immune clusters. (B) The Venn diagram shows the 414 intersecting genes that were obtained after intersecting the differentially expressed genes and immune-related genes. (C) Heat map of the expression of 414 intersecting genes in different immune clusters. (D,E) Enrichment of differentially expressed genes between the high- and low-immune clusters in terms of biological function via GO analysis.
Additionally, we also explored the biological functions of DEGs in the different immune clusters using GO analysis. In terms of biological processes, the DEGs were enriched in antigen binding, extracellular matrix structural constituent, glycosaminoglycan binding, immunoglobulin receptor binding, immune receptor activity and other processes. Regarding cellular components, the DEGs were enriched in the external side of the plasma membrane, immunoglobulin complex, MHC protein complex and MHC class II protein complex. Additionally, DEGs were also enriched in the positive regulation of leukocyte activation, positive regulation of lymphocyte activation, leukocyte-mediated immunity, activation of immune response and other molecular functions (Figures 2D, E).
We extracted 49 genes significantly associated with survival (p < 0.05) using Cox regression analysis of the 414 immune-related DEGs, of which nine were favourable prognosis genes (Figure 3A). The heat map displays the expression of 49 prognosis-related genes in HCC tumour samples and normal samples (Figure 3D). Furthermore, LASSO regression analysis on prognosis-related DEGs revealed 19 genes for signature construction (Figures 3B,C). We calculated risk scores for each patient with HCC based on the risk coefficients and expression of the 19 genes screened (Table 1). All patients were divided into high-risk and low-risk groups based on risk scores.
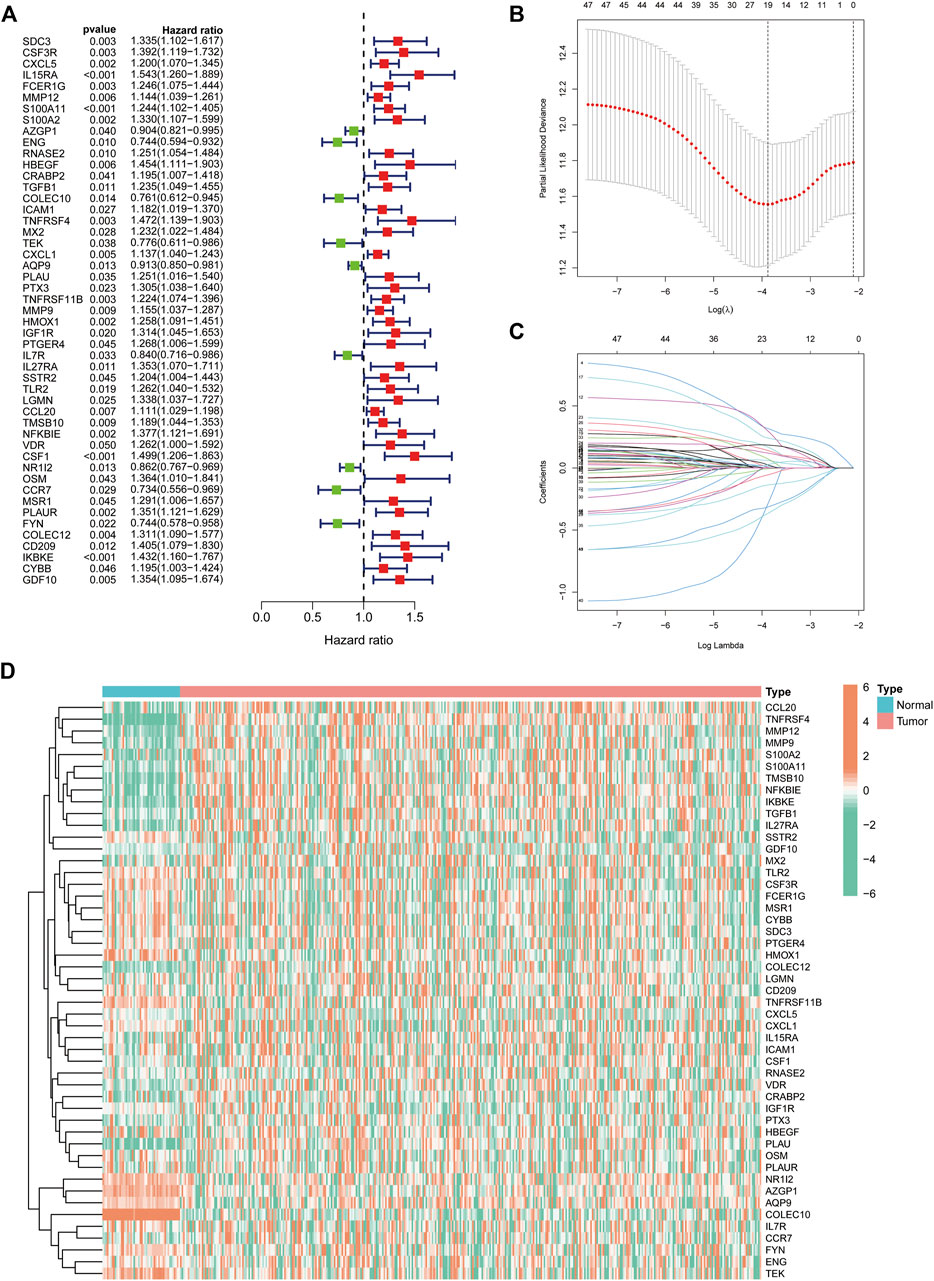
FIGURE 3. Identification of immune-related differentially expressed genes (DEGs) associated with prognosis for signature construction. (A) Forest plot of 49 immune-related DEGs significantly associated with overall survival in patients with hepatocellular carcinoma (HCC). (B,C) LASSO coefficient and partial likelihood deviance of the prognostic signature. (D) Heat map of 49 prognosis-related genes expressed in HCC tumour samples and normal samples.
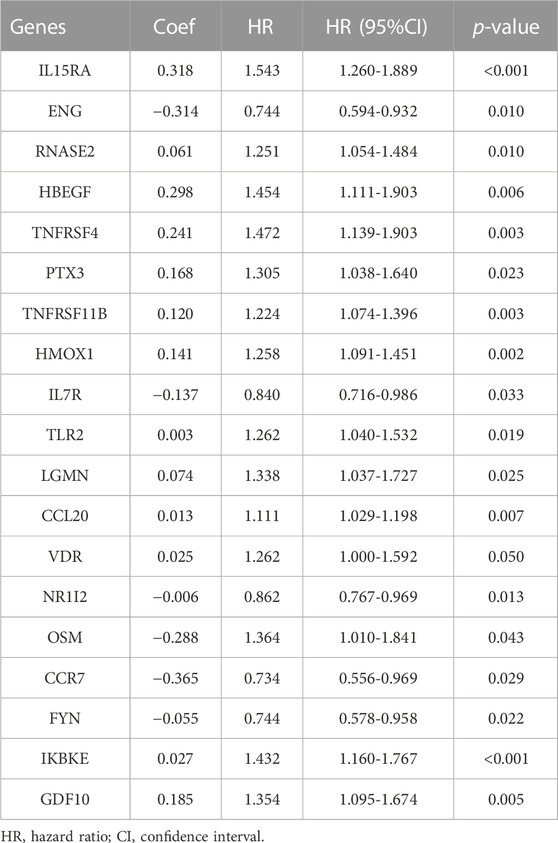
TABLE 1. Immune-associated signature genes.
We first evaluated the prognostic predictive value of the signature in the TCGA training cohort. The heat map shows the expression status of the 19 genes in the risk groups (Figure 4A). K-M survival curves suggested that patients in the low-risk group had significantly better survival than those in the high-risk group (p < 0.001) (Figure 4B). Correlation analysis suggested a negative correlation between risk scores and OS (correlation coefficient = -0.33, p < 0.001) (Figure 4C). Further evaluation of the survival status and risk score distribution of patients revealed that the low-risk group had a better prognosis than the high-risk group (Figures 4D, E).
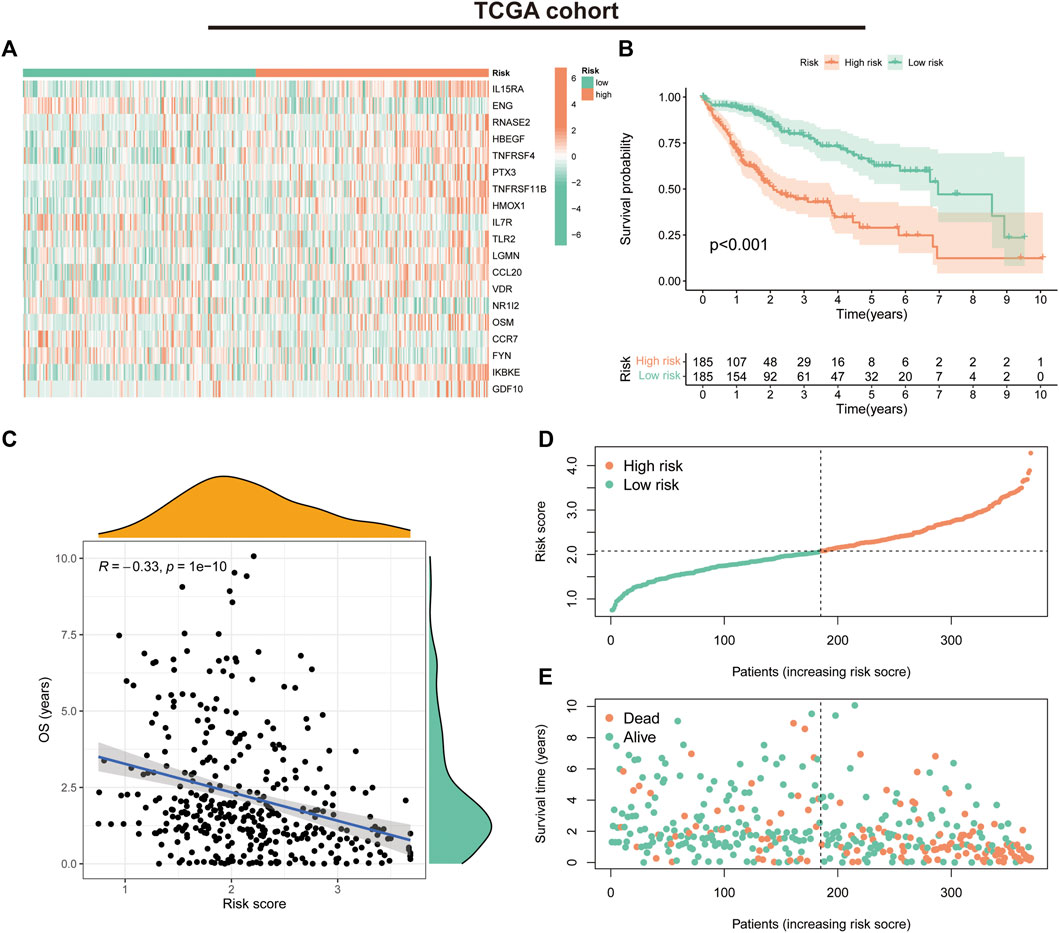
FIGURE 4. Prognostic values of the immune-related gene signature in The Cancer Genome Atlas (TCGA) cohort. (A) Heat map showing expression levels of the 19 immune-related genes in the TCGA cohort. (B) Kaplan–Meier curve for overall survival (OS) in the TCGA cohort. (C) Scatter plot of correlation between risk score and OS in the TCGA cohort. (D) Risk score distribution in the TCGA cohort. (E) Survival time and status in the TCGA cohort.
In the GSE14520 validation cohort, we also observed a trend in the expression of the 19 risk model genes in the risk groups (Figure 5A). K-M survival curves suggested that patients in the low-risk group had significantly better survival than those in the high-risk group (p < 0.001) (Figure 5B). The correlation analysis suggested a negative correlation between risk scores and OS (correlation coefficient = -0.28, p < 0.001) (Figure 5C). Furthermore, the survival status and risk score distribution of patients in the different risk groups in the validation cohort also suggested that the patients with HCC in the low-risk group had a better prognosis than those in the high-risk group (Figures 5D, E). These findings highlight the validity and stability of the IRGs constructed based on the LASSO algorithm.
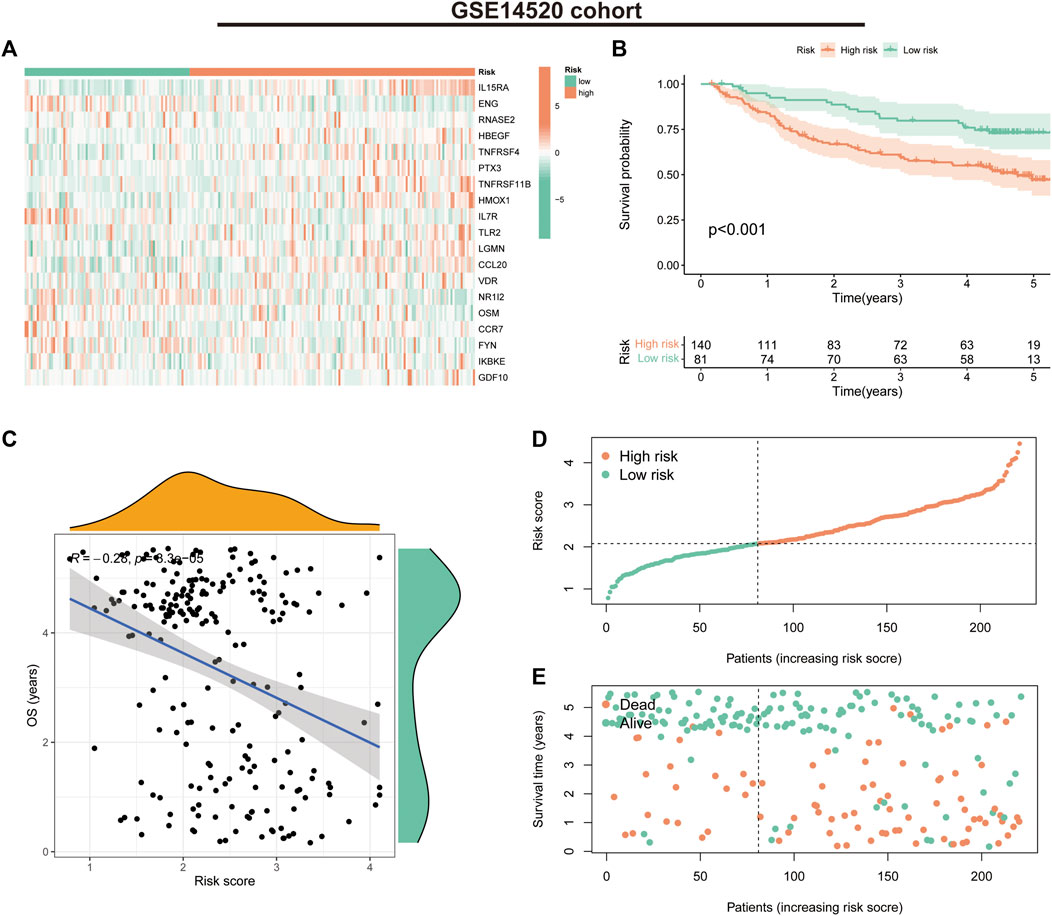
FIGURE 5. Prognostic values of the immune-related gene signature in the GSE14520 validation cohort. (A) Heat map showing expression levels of the 19 immune-related genes in the validation cohort. (B) Kaplan–Meier curve for overall survival (OS) in the validation cohort. (C) Scatter plot of correlation between risk score and OS in the validation cohort. (D) Risk score distribution in the validation cohort. (E) Survival time and status in the validation cohort.
We further assessed the prognostic predictive efficacy of the IRGs using COX regression analyses and ROC curves, which revealed that the risk score was an independent prognostic indicator, with a hazard ratio (HR) of 3.771 and 3.451 in the univariate and multifactorial Cox analyses, respectively (p < 0.001) (Figures 6A,B). Additionally, the tumour stage was considered an independent prognostic factor with an HR of 1.680 (p < 0.001) and 1.419 (p = 0.002). The area under the ROC curve for risk score at 1-, three- and 5-year was 0.813, 0.752 and 0.737, respectively (Figure 6C), and the calibration curves suggested a good agreement between the survival prediction results of risk score and the actual outcome (Figure 6D). In the GSE14520 cohort, risk score and tumour stage were also independent prognostic predictors (Figures 6E, F). The area under the ROC curve at 1-, three- and 5-year was 0.642, 0.645 and 0.665, respectively (Figure 6G). Moreover, the calibration curve suggested good prognostic predictive efficacy of risk score (Figure 6H).
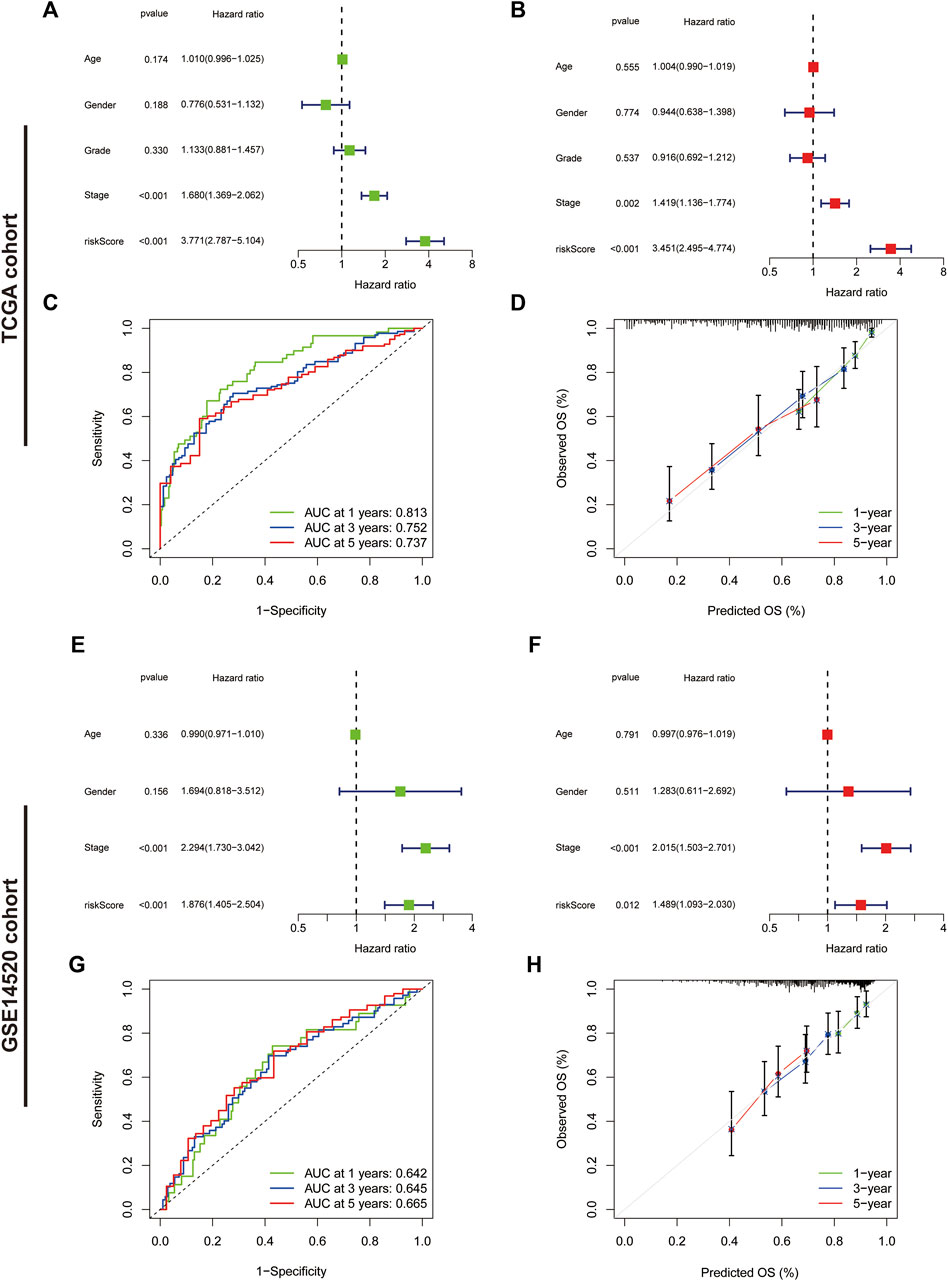
FIGURE 6. Assessment of the immune-related gene signature. (A) Forest plot for univariate Cox and (B) multivariate Cox regression analysis in The Cancer Genome Atlas (TCGA) cohort. (C) Receiver operating characteristic (ROC) curves of 1-, three- and 5-year survival for the predictive signature in the TCGA cohort. (D) The calibration curves for 1-, three- and 5-year OS in the TCGA cohort. (E) Forest plot for univariate Cox and (F) multivariate Cox regression analysis in the validation cohort. (G) ROC curves of 1-, three- and 5-year survival for the predictive signature in the validation cohort. (H) The calibration curves for 1-, three- and 5-year overall survival in the validation cohort.
The heat map illustrates the status of different clinicopathological parameters in the risk groups (Figure 7A). Stratified K-M curves suggested that patients with HCC having different gender, age, tumour stage and grade had worse survival in the high-risk group than in the low-risk group (Figures 7B–I), demonstrating the stability and wide applicability of the IRGs. Moreover, analysis of risk scores in different clinicopathological parameters revealed lower risk scores in tumour Stage I + II and grade G1+2 than in Stage III + IV and grade G3+4, without significant differences in age and gender (Figure 7J–M).
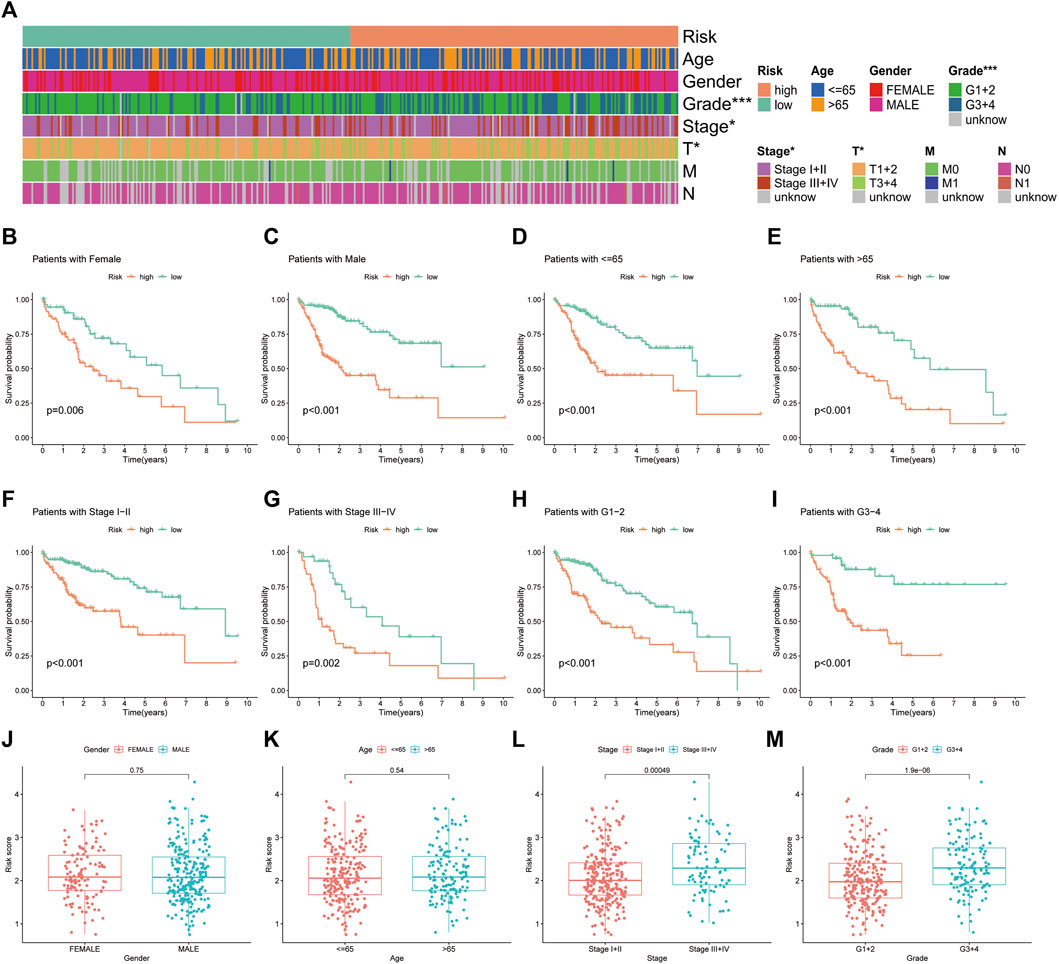
FIGURE 7. Correlation analysis of the immune-related gene signature with clinicopathological parameters in The Cancer Genome Atlas cohort. (A) Heat map of the distribution of clinicopathological parameters in the high- and low-risk groups. (B,C) Kaplan–Meier survival curves of low- and high-risk groups sorted by gender, (D,E) age, (F,G) TNM stage and (H,I) tumour grade. Different levels of risk scores in patients with hepatocellular carcinoma were stratified by (J) gender, (K) age, (L) TNM stage and (M) tumour grade.
Based on the outcomes of Cox regression, risk scores and tumour stage were used to construct a nomogram to predict the prognosis of patients with HCC (Figure 8A). The corresponding scores of tumour stage and risk score in the nomogram were calculated and the sum of the two was used as a predictive tool for prognosis. The area under the ROC curve for the 1-, three- and 5-year OS was 0.805, 0.831 and 0.829, respectively (Figure 8B). The calibration curves indicated the good predictive efficacy of the nomogram (Figure 8C).
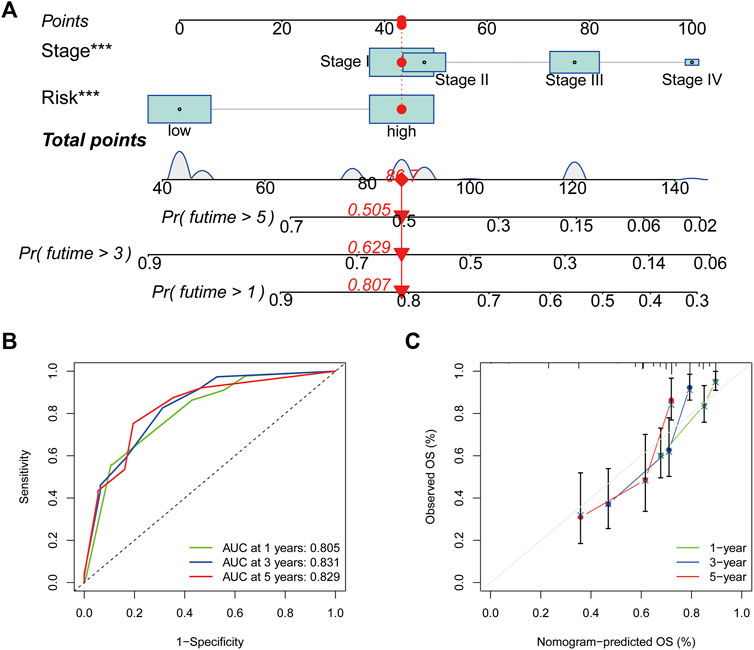
FIGURE 8. Nomogram construction and assessment. (A) Nomogram for predicting the 1-, three- and 5- years survival of patients with hepatocellular carcinoma. (B) Receiver operating characteristic curves of 1-, three- and 5-year survival for the predictive Nomogram. (C) The calibration curves for 1-, three- and 5-year overall survival. *p < 0.05, **p < 0.01 and ***p < 0.001.
TMB is the number of somatic non-synonymous mutations in a given genomic region and can indirectly reflect the capacity and extent of neoantigen generated by tumours and predict the effectiveness of immunotherapy for some tumours (Chan et al., 2019). Box plots revealed no significant difference in TMB levels between the high- and low-risk groups (Figure 9A). KM curves showed that higher TMB in HCC was associated with a poorer OS (Figure 9B). Notably, survival analysis showed significant differences between the four groups of high-risk/high-TMB, low-risk/low-TMB, high-risk/low-TMB and low-risk/high-TMB (p < 0.001), with the worst OS observed in the high-TMB/high-risk group and the best OS observed in the low-TMB/low-risk group (Figure 9C). Additionally, the mutation frequency in the high-risk group was 88.83% compared to 82.97% in the low-risk group (Figures 9D, E). In the high-risk group, the genes with the highest mutation frequencies were TP53 (40%), TTN (25%) and CTNNB1 (24%), whereas CTNNB1 (27%), TTN (23%) and MUC16 (16%) were observed in the low-risk group.
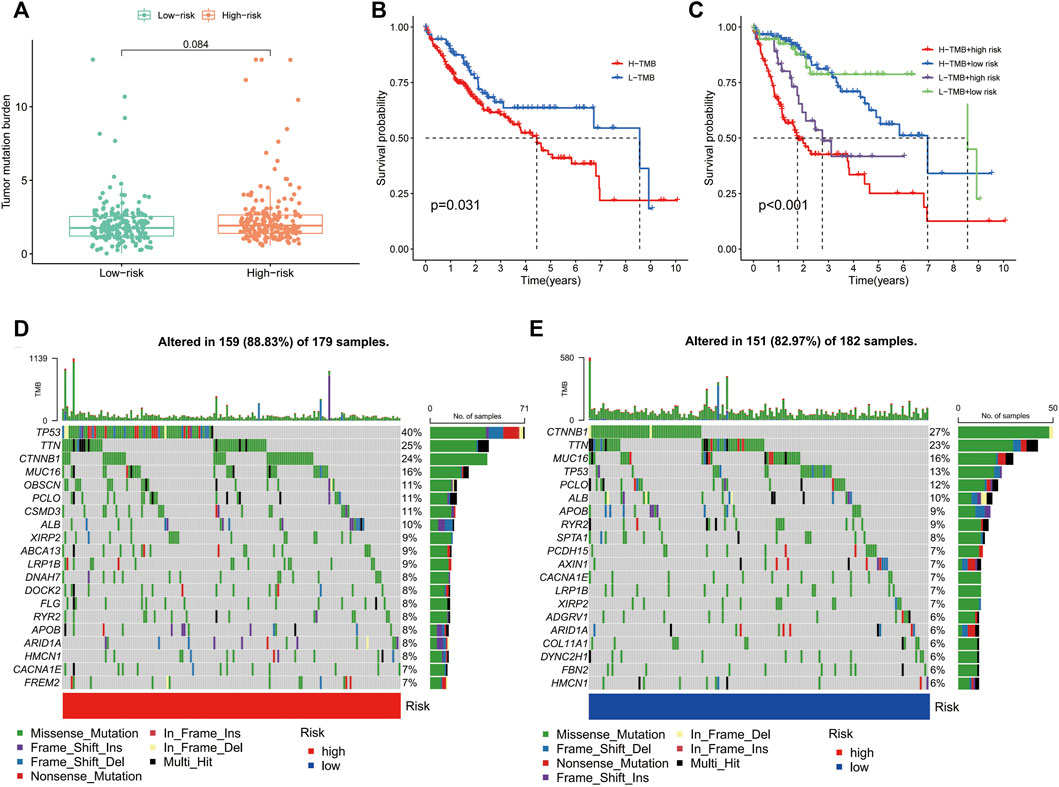
FIGURE 9. Correlation of the immune-related gene signature with tumour mutation burden (TMB) in hepatocellular carcinoma. (A) Violin plot of TMB in the high- and low-risk groups. (B) Kaplan–Meier curve of high-TMB and low-TMB. (C) Kaplan–Meier curve of the patients in the high- and low-TMB groups combined with the high- and low-risk groups. (D) Mutant gene waterfall plot in the high- and (E) low-risk groups.
GSVA was used to explore the differences in biological behaviour between the two risk groups. The high-risk group was enriched in pathways related to ubiquitin-mediated protein hydrolysis, cell cycle, protein export, RNA polymerase, DNA replication, homologous recombination, mismatch repair and nucleotide excision repair, which are associated with tumour biological behaviour. Moreover, functions such as nitrogen metabolism, fatty acid metabolism and multiple amino acid metabolisms were enriched in the low-risk group (Figure 10A). Additionally, we analysed the correlation between the 19 genes in the signature and different signalling pathways. Furthermore, a broad correlation between the expression of the IRGs and tumour-related signalling pathways was observed (Figure 10B).
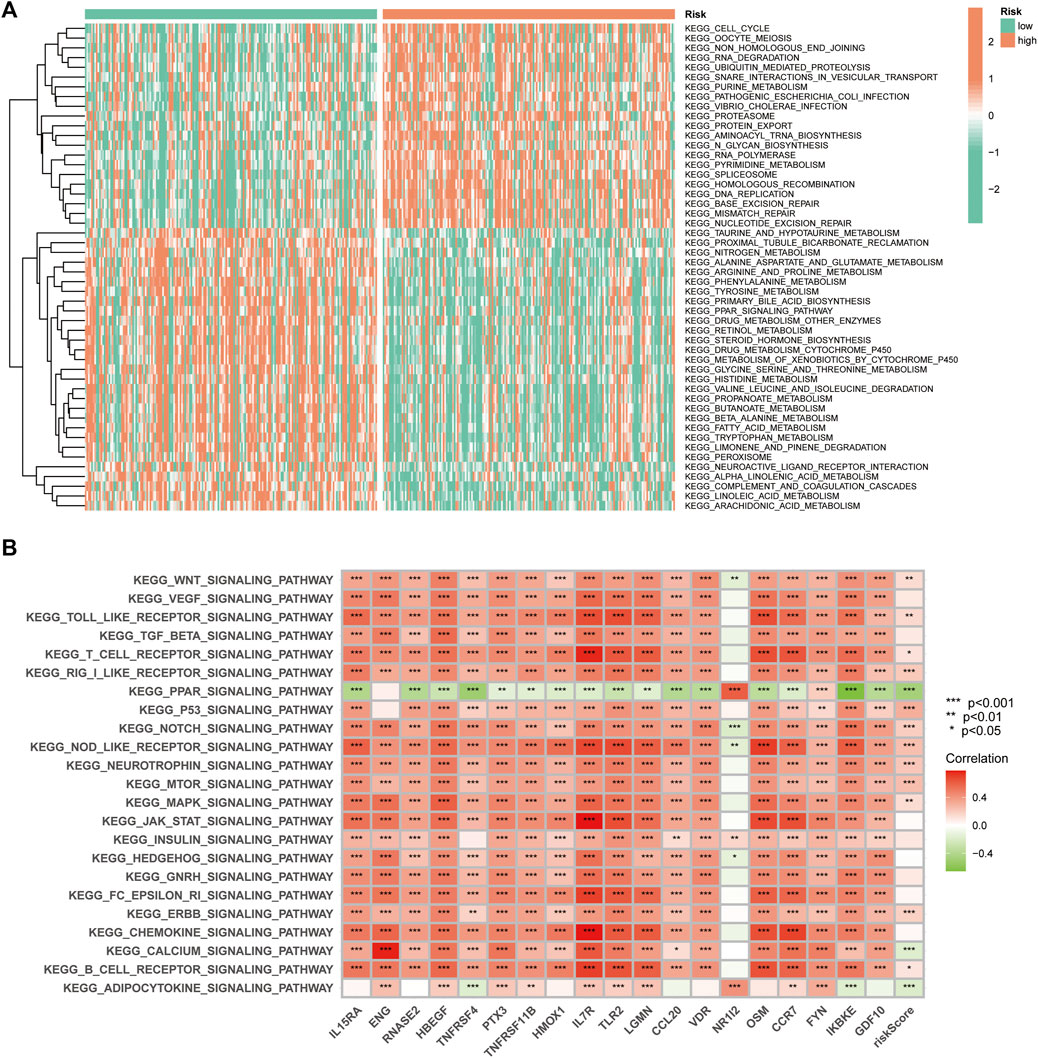
FIGURE 10. The Gene Set Variation Analysis. (A) Heat map highlighting the differences in functional pathways in the high- and low-risk groups. (B) The correlation between the KEGG pathway and signature gene mRNA expression.
Drug sensitivity analysis showed differences in IC50 values between the different chemical and targeted agents in the different risk groups (p < 0.001) (Figure 11A-P). Notably, the IC50 values of the targeted therapeutics axitinib, bosutinib, erlotinib, nilotinib and gefitinib were lower in the low-risk group than in the high-risk group, suggesting that patients with HCC in the low-risk group may be more sensitive to small molecule targeted therapeutics. However, contrary results were observed for most chemotherapeutic agents including doxorubicin, bleomycin, etoposide, gemcitabine and paclitaxel, suggesting that high-risk patients may benefit more from chemotherapy.
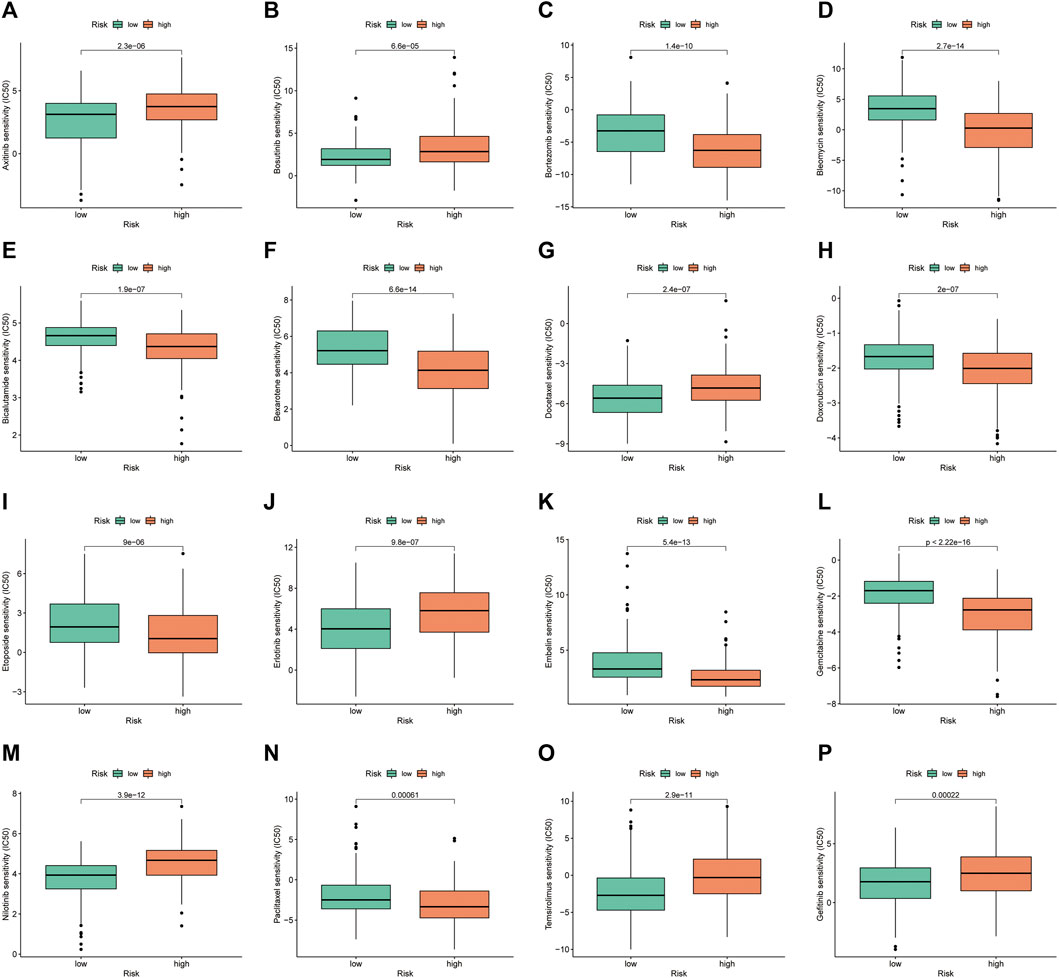
FIGURE 11. Investigation of drug sensitivity in risk groups. (A–P) Comparison of IC50 values for different agents in the high- and low-risk groups.
HCC is one of the most common malignancies and is characterized by high aggressiveness, a tendency to metastasis and frequent recurrence (Llovet et al., 2021; Sung et al., 2021). Although recent improvements and optimizations of comprehensive treatment modalities, including surgery, interventional therapy, radiotherapy, chemotherapy, targeted therapy and immunotherapy, have been reported, the high degree of heterogeneity and poor prognosis of HCC remains an insurmountable problem.
Increasingly studies report that TIME has a significant impact on the occurrence, progression, treatment response and long-term prognosis of patients with HCC (Kurebayashi et al., 2018; Llovet et al., 2022). Additionally, with the rapid development of immunotherapy in the treatment of solid tumours, its use in HCC has garnered increasing attention. However, due to the low overall efficiency and response rate of immunotherapy, the superior population or prediction system for immunotherapy requires further exploration. Although the predictive value of PD-L1 expression, a classical efficacy prediction marker for ICIs, has been extensively evaluated in many tumour types (Reck et al., 2019; Paz-Ares et al., 2020), its predictive value for patients with HCC treated with ICIs remains unexplored (Macek Jilkova et al., 2019). TMB has also been reported as a potential predictor of the efficacy of ICIs in non-small cell lung cancer, melanoma and other malignancies (Chan et al., 2019; Samstein et al., 2019). However, it is unclear whether TMB in HCC can influence the response to ICIs owing to limited data (Shrestha et al., 2018; Rizzo and Ricci, 2022). Microsatellite instability (MSI) degree is another potential predictor of ICIs treatment (Chang et al., 2018). Theoretically, MSI-high degree (MSI-H) increases neoantigens, leads to effector lymphocyte activation and increases tumour sensitivity to ICIs (Svrcek et al., 2019). Non-etheless, data on the value of this predictor in HCC are scarce, with MSI-H being reported in less than 3% of patients (Goumard et al., 2017; Rizzo and Ricci, 2022). As TIME is constructed by tumour cells in conjunction with immune cells in the tumour microenvironment, it may be theoretically difficult for individual indicators to accurately predict patient prognosis and immunotherapy efficacy. Therefore, understanding the characteristics of TIME and immune cell infiltration in HCC is essential for the development of novel and accurate prognostic and therapeutic efficacy predictive biomarkers.
In this study, an unsupervised hierarchical clustering method based on ssGSEA was employed to analyse the immune clusters of patients with HCC and classify them into high- and low-immune clusters, thereby identifying patients with HCC patients having different TIME characteristics and inferring their response to immunotherapy. The ESTIMATE and CIBERSORT algorithms further validated these findings, suggesting that stromal cells, immune cells and ESTIMATE scores were significantly higher in the high-immune cluster than in the low-immune cluster. Studies have shown that tumours characterised by high infiltration of effector immune cells such as CD8+ T Cells and activation of immune checkpoints are considered to be ‘hot immune tumours’, which benefit highly from ICI treatments (Galon and Bruni, 2019; Liu and Sun, 2021). Notably, most of the immune checkpoint-related genes, including PD-L1, PD-1, CTLA-4 and LAG3, are more highly expressed in the high-immune clusters than in the low-immune clusters, suggesting that patients with HCC in the high-immune cluster fit the basic profile of an ‘immune hot tumour’ and are potential beneficiaries of treatment with ICIs. Additionally, polymorphisms in the HLA genes are speculated to be involved in biological behaviours such as the immune escape of tumours (Sabbatino et al., 2020). HLA class I has been reported to be highly expressed in cancer cells, which may contribute to the antitumour effects of cytotoxic T lymphocyte-based cancer immunotherapy (Akazawa et al., 2019). In this study, most of the HLA genes were also highly expressed in the high-immune cluster, supporting the conclusion that the high-immune cluster is more likely to benefit from treatment with ICIs than those in the low-immune cluster.
To further explore the predictive value of immune-related genes in the prognosis of HCC, we extracted 19 of these DEGs for the construction of IRGs based on the LASSO algorithm and classified all patients into high- and low-risk groups. We further validated this signature in the TCGA and GSE14520 cohorts via K-M survival curves, univariate and multivariate Cox regression analysis and ROC curves. The results indicated that the signature had a reliable and good prognostic predictive power and could be applied to patients with HCC having different clinicopathological parameters.
Currently, advanced HCC is treated systemically with chemotherapy, targeted therapies and immunotherapy; however, the survival benefit remains poor. Precise individualized treatment and a combination of different systemic therapies are the future trends in the management of advanced HCC. The IRGs constructed in this study provide the basis for the selection of some chemotherapeutic agents and targeted drugs. In a recent study, ICI avelumab in combination with the TKI axitinib showed antitumour activity with controlled toxicity in patients with advanced HCC (Kudo et al., 2021). Our results suggested that the low-risk group was more sensitive to axitinib than the high-risk group. Moreover, bevacizumab in combination with erlotinib was found to be effective in patients with sorafenib-resistant HCC (He et al., 2019). Similarly, in this study, the low-risk group benefited more from erlotinib-targeted therapy. Notably, consistent results were observed with small-molecule targeted therapeutics such as bosutinib, nilotinib and gefitinib. However, most chemotherapeutic agents, including doxorubicin, bleomycin, etoposide, gemcitabine and paclitaxel, had lower IC50 values in the high-risk group, suggesting that high-risk patients could be more sensitive to chemotherapeutic agents.
Although the IRGs was validated by different methods, there remain some limitations. First, in retrospective studies, there may be some bias in the included cases. Second, we only used GSE14520 cohort for external validation, whereas we still need data from our own clinical cohort of patients with HCC for prospective analysis to test the applicability of the predictive signature.
The immune cluster analysis based on the ssGSEA algorithm could effectively predict the immune microenvironment characteristics of patients with HCC and distinguish between ‘hot immune tumours’ and ‘cold immune tumours’, which could provide a basis for the selection of treatment for ICIs. Additionally, the IRGs constructed based on the LASSO algorithm was a good predictor of prognosis for patients with HCC, which could guide the selection of personalised treatment regimens. In the future, we will conduct prospective studies to further validate our results in clinical patients with HCC.
The original contributions presented in the study are included in the article/Supplementary Material further inquiries can be directed to the corresponding author.
LLW designed the study. LLW and LW analysed the data. LLW and PH drafted the manuscript. PH modified the manuscript. All authors contributed to the article and approved the submitted version.
We thank Bullet Edits Limited for the linguistic editing and proofreading of the manuscript.
The authors declare that the research was conducted in the absence of any commercial or financial relationships that could be construed as a potential conflict of interest.
All claims expressed in this article are solely those of the authors and do not necessarily represent those of their affiliated organizations, or those of the publisher, the editors and the reviewers. Any product that may be evaluated in this article, or claim that may be made by its manufacturer, is not guaranteed or endorsed by the publisher.
The Supplementary Material for this article can be found online at: https://www.frontiersin.org/articles/10.3389/fgene.2022.1064432/full#supplementary-material
Abd El Aziz, M. A., Facciorusso, A., Nayfeh, T., Saadi, S., Elnaggar, M., Cotsoglou, C., et al. (2020). Immune checkpoint inhibitors for unresectable hepatocellular carcinoma. Vaccines (Basel) 8 (4), 616. doi:10.3390/vaccines8040616
Akazawa, Y., Nobuoka, D., Takahashi, M., Yoshikawa, T., Shimomura, M., Mizuno, S., et al. (2019). Higher human lymphocyte antigen class I expression in early-stage cancer cells leads to high sensitivity for cytotoxic T lymphocytes. Cancer Sci. 110 (6), 1842–1852. doi:10.1111/cas.14022
Barbie, D. A., Tamayo, P., Boehm, J. S., Kim, S. Y., Moody, S. E., Dunn, I. F., et al. (2009). Systematic RNA interference reveals that oncogenic KRAS-driven cancers require TBK1. Nature 462 (7269), 108–112. doi:10.1038/nature08460
Binnewies, M., Roberts, E. W., Kersten, K., Chan, V., Fearon, D. F., Merad, M., et al. (2018). Understanding the tumor immune microenvironment (TIME) for effective therapy. Nat. Med. 24 (5), 541–550. doi:10.1038/s41591-018-0014-x
Chan, T. A., Yarchoan, M., Jaffee, E., Swanton, C., Quezada, S. A., Stenzinger, A., et al. (2019). Development of tumor mutation burden as an immunotherapy biomarker: Utility for the oncology clinic. Ann. Oncol. 30 (1), 44–56. doi:10.1093/annonc/mdy495
Chang, L., Chang, M., Chang, H. M., and Chang, F. (2018). Microsatellite instability: A predictive biomarker for cancer immunotherapy. Appl. Immunohistochem. Mol. Morphol. 26 (2), e15–e21. doi:10.1097/pai.0000000000000575
Chen, Y., Feng, Y., Yan, F., Zhao, Y., Zhao, H., and Guo, Y. (2022). A novel immune-related gene signature to identify the tumor microenvironment and prognose disease among patients with oral squamous cell carcinoma patients using ssGSEA: A bioinformatics and biological validation study. Front. Immunol. 13, 922195. doi:10.3389/fimmu.2022.922195
Chen, Y., Wang, X., Deng, X., Zhang, Y., Liao, R., Li, Y., et al. (2021). DNA damage repair status predicts opposite clinical prognosis immunotherapy and non-immunotherapy in hepatocellular carcinoma. Front. Immunol. 12, 676922. doi:10.3389/fimmu.2021.676922
Cheng, A. L., Qin, S., Ikeda, M., Galle, P. R., Ducreux, M., Kim, T. Y., et al. (2022). Updated efficacy and safety data from IMbrave150: Atezolizumab plus bevacizumab vs. sorafenib for unresectable hepatocellular carcinoma. J. Hepatol. 76 (4), 862–873. doi:10.1016/j.jhep.2021.11.030
Craig, A. J., von Felden, J., Garcia-Lezana, T., Sarcognato, S., and Villanueva, A. (2020). Tumour evolution in hepatocellular carcinoma. Nat. Rev. Gastroenterol. Hepatol. 17 (3), 139–152. doi:10.1038/s41575-019-0229-4
Finn, R. S., Ikeda, M., Zhu, A. X., Sung, M. W., Baron, A. D., Kudo, M., et al. (2020a). Phase ib study of Lenvatinib plus Pembrolizumab in patients with unresectable hepatocellular carcinoma. J. Clin. Oncol. 38 (26), 2960–2970. doi:10.1200/jco.20.00808
Finn, R. S., Ryoo, B. Y., Merle, P., Kudo, M., Bouattour, M., Lim, H. Y., et al. (2020b). Pembrolizumab as second-line therapy in patients with advanced hepatocellular carcinoma in KEYNOTE-240: A randomized, double-blind, phase III trial. J. Clin. Oncol. 38 (3), 193–202. doi:10.1200/jco.19.01307
Galon, J., and Bruni, D. (2019). Approaches to treat immune hot, altered and cold tumours with combination immunotherapies. Nat. Rev. Drug Discov. 18 (3), 197–218. doi:10.1038/s41573-018-0007-y
Goumard, C., Desbois-Mouthon, C., Wendum, D., Calmel, C., Merabtene, F., Scatton, O., et al. (2017). Low levels of microsatellite instability at simple repeated sequences commonly occur in human hepatocellular carcinoma. Cancer Genomics Proteomics 14 (5), 329–339. doi:10.21873/cgp.20043
Hänzelmann, S., Castelo, R., and Guinney, J. (2013). Gsva: Gene set variation analysis for microarray and RNA-seq data. BMC Bioinforma. 14, 7. doi:10.1186/1471-2105-14-7
He, L., Deng, H., Lei, J., Yi, F., Li, J., Fan, X., et al. (2019). Efficacy of bevacizumab combined with erlotinib for advanced hepatocellular carcinoma: A single-arm meta-analysis based on prospective studies. BMC Cancer 19 (1), 276. doi:10.1186/s12885-019-5487-6
Huang, A., Yang, X. R., Chung, W. Y., Dennison, A. R., and Zhou, J. (2020). Targeted therapy for hepatocellular carcinoma. Signal Transduct. Target. Ther. 5 (1), 146. doi:10.1038/s41392-020-00264-x
Jácome, A. A., Castro, A. C. G., Vasconcelos, J. P. S., Silva, M., Lessa, M. A. O., Moraes, E. D., et al. (2021). Efficacy and safety associated with immune checkpoint inhibitors in unresectable hepatocellular carcinoma: A meta-analysis. JAMA Netw. Open 4 (12), e2136128. doi:10.1001/jamanetworkopen.2021.36128
Kudo, M., Motomura, K., Wada, Y., Inaba, Y., Sakamoto, Y., Kurosaki, M., et al. (2021). Avelumab in combination with axitinib as first-line treatment in patients with advanced hepatocellular carcinoma: Results from the phase 1b VEGF liver 100 trial. Liver Cancer 10 (3), 249–259. doi:10.1159/000514420
Kurebayashi, Y., Ojima, H., Tsujikawa, H., Kubota, N., Maehara, J., Abe, Y., et al. (2018). Landscape of immune microenvironment in hepatocellular carcinoma and its additional impact on histological and molecular classification. Hepatology 68 (3), 1025–1041. doi:10.1002/hep.29904
Liu, P. H., Hsu, C. Y., Hsia, C. Y., Lee, Y. H., Su, C. W., Huang, Y. H., et al. (2016). Prognosis of hepatocellular carcinoma: Assessment of eleven staging systems. J. Hepatol. 64 (3), 601–608. doi:10.1016/j.jhep.2015.10.029
Liu, Y. T., and Sun, Z. J. (2021). Turning cold tumors into hot tumors by improving T-cell infiltration. Theranostics 11 (11), 5365–5386. doi:10.7150/thno.58390
Llovet, J. M., Castet, F., Heikenwalder, M., Maini, M. K., Mazzaferro, V., Pinato, D. J., et al. (2022). Immunotherapies for hepatocellular carcinoma. Nat. Rev. Clin. Oncol. 19 (3), 151–172. doi:10.1038/s41571-021-00573-2
Llovet, J. M., Kelley, R. K., Villanueva, A., Singal, A. G., Pikarsky, E., Roayaie, S., et al. (2021). Hepatocellular carcinoma. Nat. Rev. Dis. Prim. 7 (1), 6. doi:10.1038/s41572-020-00240-3
Macek Jilkova, Z., Aspord, C., and Decaens, T. (2019). Predictive factors for response to PD-1/PD-L1 checkpoint inhibition in the field of hepatocellular carcinoma: Current status and challenges. Cancers (Basel) 11 (10), 1554. doi:10.3390/cancers11101554
Mamdani, H., Matosevic, S., Khalid, A. B., Durm, G., and Jalal, S. I. (2022). Immunotherapy in lung cancer: Current landscape and future directions. Front. Immunol. 13, 823618. doi:10.3389/fimmu.2022.823618
Newman, A. M., Liu, C. L., Green, M. R., Gentles, A. J., Feng, W., Xu, Y., et al. (2015). Robust enumeration of cell subsets from tissue expression profiles. Nat. Methods 12 (5), 453–457. doi:10.1038/nmeth.3337
Paz-Ares, L., Spira, A., Raben, D., Planchard, D., Cho, B. C., Özgüroğlu, M., et al. (2020). Outcomes with durvalumab by tumour PD-L1 expression in unresectable, stage III non-small-cell lung cancer in the PACIFIC trial. Ann. Oncol. 31 (6), 798–806. doi:10.1016/j.annonc.2020.03.287
Pitt, J. M., Marabelle, A., Eggermont, A., Soria, J. C., Kroemer, G., and Zitvogel, L. (2016). Targeting the tumor microenvironment: Removing obstruction to anticancer immune responses and immunotherapy. Ann. Oncol. 27 (8), 1482–1492. doi:10.1093/annonc/mdw168
Reck, M., Rodríguez-Abreu, D., Robinson, A. G., Hui, R., Csőszi, T., Fülöp, A., et al. (2019). Updated analysis of KEYNOTE-024: Pembrolizumab versus platinum-based chemotherapy for advanced non-small-cell lung cancer with PD-L1 tumor proportion score of 50% or greater. J. Clin. Oncol. 37 (7), 537–546. doi:10.1200/jco.18.00149
Rizzo, A., and Ricci, A. D. (2022). PD-L1, TMB, and other potential predictors of response to immunotherapy for hepatocellular carcinoma: How can they assist drug clinical trials? Expert Opin. Investig. Drugs 31 (4), 415–423. doi:10.1080/13543784.2021.1972969
Sabbatino, F., Liguori, L., Polcaro, G., Salvato, I., Caramori, G., Salzano, F. A., et al. (2020). Role of human leukocyte antigen system as A predictive biomarker for checkpoint-based immunotherapy in cancer patients. Int. J. Mol. Sci. 21 (19), 7295. doi:10.3390/ijms21197295
Samstein, R. M., Lee, C. H., Shoushtari, A. N., Hellmann, M. D., Shen, R., Janjigian, Y. Y., et al. (2019). Tumor mutational load predicts survival after immunotherapy across multiple cancer types. Nat. Genet. 51 (2), 202–206. doi:10.1038/s41588-018-0312-8
Shrestha, R., Prithviraj, P., Anaka, M., Bridle, K. R., Crawford, D. H. G., Dhungel, B., et al. (2018). Monitoring immune checkpoint regulators as predictive biomarkers in hepatocellular carcinoma. Front. Oncol. 8, 269. doi:10.3389/fonc.2018.00269
Subramanian, A., Tamayo, P., Mootha, V. K., Mukherjee, S., Ebert, B. L., Gillette, M. A., et al. (2005). Gene set enrichment analysis: A knowledge-based approach for interpreting genome-wide expression profiles. Proc. Natl. Acad. Sci. U. S. A. 102 (43), 15545–15550. doi:10.1073/pnas.0506580102
Sung, H., Ferlay, J., Siegel, R. L., Laversanne, M., Soerjomataram, I., Jemal, A., et al. (2021). Global cancer statistics 2020: GLOBOCAN estimates of incidence and mortality worldwide for 36 cancers in 185 countries. Ca. Cancer J. Clin. 71 (3), 209–249. doi:10.3322/caac.21660
Svrcek, M., Lascols, O., Cohen, R., Collura, A., Jonchère, V., Fléjou, J. F., et al. (2019). MSI/MMR-deficient tumor diagnosis: Which standard for screening and for diagnosis? Diagnostic modalities for the colon and other sites: Differences between tumors. Bull. Cancer 106 (2), 119–128. doi:10.1016/j.bulcan.2018.12.008
Teixeira Farinha, H., Digklia, A., Schizas, D., Demartines, N., Schäfer, M., and Mantziari, S. (2022). Immunotherapy for esophageal cancer: State-of-the art in 2021. Cancers (Basel) 14 (3), 554. doi:10.3390/cancers14030554
Yau, T., Kang, Y. K., Kim, T. Y., El-Khoueiry, A. B., Santoro, A., Sangro, B., et al. (2020). Efficacy and safety of nivolumab plus ipilimumab in patients with advanced hepatocellular carcinoma previously treated with sorafenib: The CheckMate 040 randomized clinical trial. JAMA Oncol. 6 (11), e204564. doi:10.1001/jamaoncol.2020.4564
Yau, T., Park, J. W., Finn, R. S., Cheng, A. L., Mathurin, P., Edeline, J., et al. (2022). Nivolumab versus sorafenib in advanced hepatocellular carcinoma (CheckMate 459): A randomised, multicentre, open-label, phase 3 trial. Lancet. Oncol. 23 (1), 77–90. doi:10.1016/s1470-2045(21)00604-5
Keywords: immune-related gene, hepatocellular carcinoma, single sample gene set enrichment analysis, prognosis, immune infiltration
Citation: Wang L, Wang L and He P (2022) Comprehensive analysis of immune-related gene signature based on ssGSEA algorithms in the prognosis and immune landscape of hepatocellular carcinoma. Front. Genet. 13:1064432. doi: 10.3389/fgene.2022.1064432
Received: 08 October 2022; Accepted: 29 November 2022;
Published: 09 December 2022.
Edited by:
Mingming Deng, Chinese Academy of Medical Sciences and Peking Union Medical College, ChinaReviewed by:
Yajie Xiao, The Chinese University of Hong Kong SAR, ChinaCopyright © 2022 Wang, Wang and He. This is an open-access article distributed under the terms of the Creative Commons Attribution License (CC BY). The use, distribution or reproduction in other forums is permitted, provided the original author(s) and the copyright owner(s) are credited and that the original publication in this journal is cited, in accordance with accepted academic practice. No use, distribution or reproduction is permitted which does not comply with these terms.
*Correspondence: Liangliang Wang, V3cxMzIxNDY3NjA2QDE2My5jb20=
Disclaimer: All claims expressed in this article are solely those of the authors and do not necessarily represent those of their affiliated organizations, or those of the publisher, the editors and the reviewers. Any product that may be evaluated in this article or claim that may be made by its manufacturer is not guaranteed or endorsed by the publisher.
Research integrity at Frontiers
Learn more about the work of our research integrity team to safeguard the quality of each article we publish.