 Xin Yuan1,2
 Shuangge Ma2,3
 Botao Fa4
 Ting Wei1,2
 Yanran Ma1,2
 Yifan Wang1Wenwen Lv5
 Yue Zhang1,2
 Junke Zheng6
 Guoqiang Chen7
 Jing Sun8*
 Zhangsheng Yu1,2,5,9*
- 1Department of Bioinformatics and Biostatistics, School of Life Sciences and Biotechnology, Shanghai Jiao Tong University, Shanghai, China
- 2SJTU-Yale Joint Center for Biostatistics and Data Science Organization, Shanghai Jiao Tong University, Shanghai, China
- 3Department of Biostatistics, Yale University, New Haven, CT, United States
- 4Department of Biochemistry and Molecular Biology, School of Basic Medical Sciences, Xi’an Jiaotong University, Xi’an, China
- 5Clinical Research Institute, Shanghai Jiao Tong University School of Medicine, Shanghai, China
- 6Key Laboratory of Cell Differentiation and Apoptosis of Chinese Ministry of Education, Faculty of Basic Medicine, Shanghai Jiao Tong University School of Medicine, Shanghai, China
- 7State Key Laboratory of Oncogene and Related Gene, Shanghai Jiao Tong University School of Medicine, Shanghai, China
- 8Shanghai Minimally Invasive Surgery Center, Department of General Surgery, Ruijin Hospital, Shanghai Jiao Tong University School of Medicine, Shanghai, China
- 9Center for Biomedical Data Science, Translational Science Institute, Shanghai Jiao Tong University School of Medicine, Shanghai, China
Colorectal cancer is a highly heterogeneous disease. Tumor heterogeneity limits the efficacy of cancer treatment. Single-cell RNA-sequencing technology (scRNA-seq) is a powerful tool for studying cancer heterogeneity at cellular resolution. The sparsity, heterogeneous diversity, and fast-growing scale of scRNA-seq data pose challenges to the flexibility, accuracy, and computing efficiency of the differential expression (DE) methods. We proposed HEART (high-efficiency and robust test), a statistical combination test that can detect DE genes with various sources of differences beyond mean expression changes. To validate the performance of HEART, we compared HEART and the other six popular DE methods on various simulation datasets with different settings by two simulation data generation mechanisms. HEART had high accuracy (
1 Introduction
Colorectal cancer (CRC) was the world’s third most common cause of cancer mortality, with more than 850000 deaths annually (Biller and Schrag, 2021). The Colorectal cancer mortality rate was high in the setting of metastatic disease or recurrence. Predicting tumor response and selecting personalized cancer therapies based on validated biomarkers is important. Tumor heterogeneity is the major obstacle to cancer treatment (Linnekamp et al., 2015; Eide et al., 2021). Identifying differential expression genes (DE genes) associated with tumors is critical in investigating cancer heterogeneity (Soneson and Robinson, 2018; Wang et al., 2019; Kharchenko, 2021). Many differential expression analysis methods for bulk-RNA sequencing data focus on the comparison at the mean level and ignore some multi-source heterogeneities. Sequencing technologies develop rapidly, and single-cell RNA-sequencing (scRNA-seq) has become widespread in more experiments. Technological improvements in single-cell RNA sequencing drive novel biological insights and new problems in data analysis. Developments of single-cell RNA-sequencing enable researches on cancer heterogeneity at a high resolution. In contrast with bulk RNA sequencing data, the scRNA-seq data have extensive data sizes, significant fractions of observed zeros, and various gene expression patterns (Soneson and Robinson, 2018; Wang et al., 2019; Kharchenko, 2021). They are large-scale, highly sparse, variable, and complex. Emerging data features unique to scRNA-seq data require novel differential expression analysis methods to detect DE genes (Zheng et al., 2017; Ding et al., 2020).
Several DE methods for single-cell data have been proposed to fit the data characteristics in scRNA-seq data. They are two classes of methods in principle: model-based and test-based methods. Model-based DE methods model parametrically with strong assumptions of theoretical distribution of gene expression. Such as, SCDE (Kharchenko et al., 2014) assumed a mixture of Poisson (dropout) and negative binomial (amplification) distributions for the distribution of genes. DESeq2 (Love et al., 2014) tests differential expression using negative binomial generalized linear models. MAST (Finak et al., 2015) fits two-part, generalized linear models for characterizing heterogeneity in scRNA-seq data. Monocle3 (Trapnell et al., 2014; Qiu et al., 2017) uses the quasi-Poisson, or negative binomial distribution, to model gene expression counts across cells. NBID (Chen et al., 2018) calculates each gene’s independent dispersion in each group based on the negative binomial distribution. SC2P (Wu et al., 2018) supposes the gene expression with two phases and employs a zero-inflated Poisson (ZIP) distribution and a lognormal-Poisson (LNP) model to describe gene expression. Thus, the deviation between assumptive and actual distribution incurs algorithm accuracy issues. Moreover, the growth of experimental techniques requires single-cell algorithms to be scalable to handle sheer volumes of data. Large-scale, sparse single-cell data with a prevalence of zero values is challenging to model parameter convergence. Model-based DE methods have limited scalability and an evident diminution of computing performance on large-scale datasets. Statistical tests are widespread substitutions for model-based DE methods, because they have fewer assumptions and lower computing complexity than model-based methods. For example, Seurat, a popular scRNA tool, sets Wilcoxon rank-sum test as the default test to find differentially expressed genes between two groups of cells. However, tests applied for scRNA-seq data are still classical statistical tests and not grounded in biology. Classical parametric statistical tests, such as t-test, z-test, and F-test, have poor results due to the extreme skewness caused by the sparsity of the scRNA-seq datasets. Non-parametric tests, such as the Wilcoxon rank-sum test, adapt for the sparsity of scRNA-seq data. But, they have awful accuracy because of the high heterogeneity and complexity of scRNA-seq data. The probabilities of Type 1 errors of the non-parametric tests vary systematically with the increasing heterogeneous variances and remain relatively constant even if the sample size increases (Zimmerman, 2000). Furthermore, non-parametric tests focus more on locations than the distribution shape, so they cannot sensitively capture various biological differences in scRNA-seq data. Each of these two types of methods has its advantages and limitations. Existing DE methods, whether model-based or test-based, have difficulty balancing accuracy and computational efficiency simultaneously in large-scale single-cell data.
In this study, we present HEART, a scalable combination test for DE analysis of single-cell data. Underlying this test framework, HEART can sensitively detect biological differences in gene expression beyond mean expression shift. We illustrate the benefits of HEART via comparing the performances of HEART and the other six DE methods (DESeq2 (Love et al., 2014), MAST (Finak et al., 2015), Monocle3 (Trapnell et al., 2014; Qiu et al., 2017), NBID (Chen et al., 2018), SC2P (Wu et al., 2018), Seurat) on vast simulation experiments based on two simulation generation mechanisms. HEART performs well in accuracy, scalability, statistical robustness and computational efficiency. We demonstrated that HEART performs robustly on two real single-cell datasets underlying different quantification schemes. Furthermore, we applied HEART to a single-cell dataset of a colorectal cancer patient and identified several potentially metastasis-related biomarkers, CTTN, S100A4, S100A6, etc.
2 Results
2.1 HEART overview
Droplet-based single-cell RNA-sequencing methods measure gene expression on tens or hundreds of thousands of cells at the single-cell level. Gene expression measurements in droplet technology are often in the form of low counts with a large fraction of zero values, and difficult to estimate the exact statistical distribution. We decomposed the gene expression distribution into two parts (Figure 1B): the status of genes (“on/off”) and the distribution shape of gene “on” parts (non-zero part). These two parts were closely associated with cell type, cell condition, or other biologic-driven factors. For the first part, the gene expression state ratio was defined as the times of the gene with the positive count in a group of cells. For the gene “On” part, we described the distribution shape by location parameter (
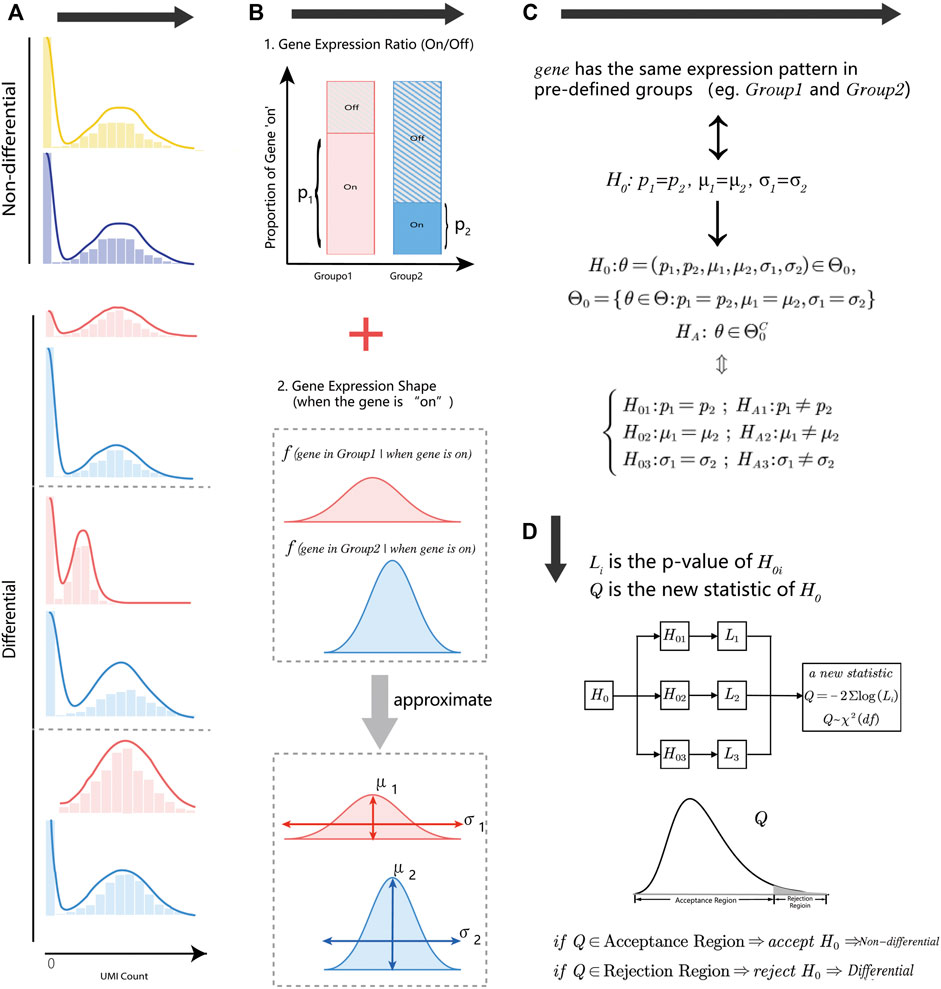
FIGURE 1. An overview of the HEART. (A) Diagram of non-differential and differential gene expression patterns. The non-differential genes have the same statistical distribution in different groups. Differential gene expression patterns have several modes with different characteristics. (B) The gene expression distribution decomposes into two parts: the gene expression state (“On/Off”) and the gene expression shape when the gene is “On.” Two parameters could approximate the distribution shape of the gene “On” part: the location parameter
We split the complex null hypothesis
2.2 HEART validation
HEART proposed a combination test to catch various sources of differences in gene expression patterns between two pre-defined groups. To validate the performance of HEART, we used two simulation data generation mechanisms to compare HEART and other six popular DE methods, including five model-based DE methods (DESeq2, MAST, Monocle3, NBID, and SC2P) and a default test in Seurat (Seurat-W). Simulation details were provided in the “Methods”. Briefly, the artificial simulation tool, Splatter package (Zappia et al., 2017), generated datasets in simulation1. Simulation2 datasets used a semi-simulation mechanism based on actual scRNA-seq data (PBMC68K)to create simulation datasets. In both simulations, we varied the number of samples and DE strength for DE genes. We evaluated the ability to identify DE genes, FDR control under the null hypothesis, and computational efficiency under various alternatives by a series of indexes:
In simulation 1, we evaluated the performances of each method on simulation datasets with the same simulation settings. HEART, Monocle3, and NBID perform better than other methods (Figure 2A; Supplementary Figure S2). They had higher
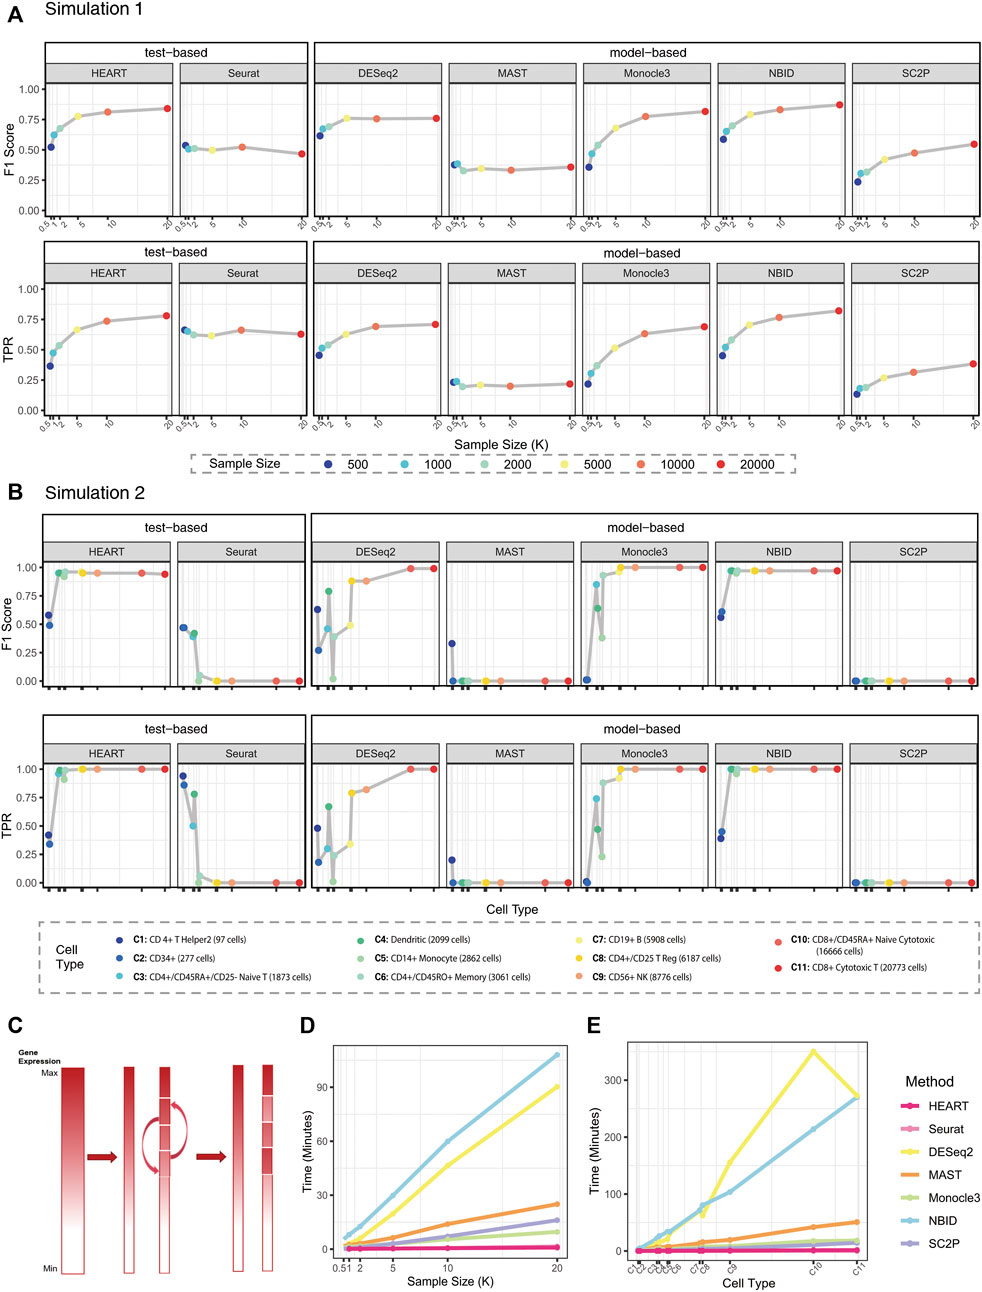
FIGURE 2. Simulation results. (A)
In Simulation2, we generated semi-simulation data from real scRNA-seq datasets instead of simulation datasets from artificial protocols (Figure 2B; Supplementary Figure S3) (Chen et al., 2018). We chose each cell subtype with various sample sizes from PBMC68K (Zheng et al., 2017) as source data to test the stability and scalability of each DE method. HEART, NBID, and Monocle3 have higher
Generally, HEART was an accurate, practical and scalable method for DE gene detection. In all semi-simulation scenarios, HEART and NBID performed better than other methods and had relatively stable performances on datasets with various characteristics. Other methods had poor performances on some semi-simulation datasets. As the sample size increases, the performances of HEART, NBID, and Monocle3 become better. However, HEART identified DE genes in the simulation scenarios with weak DE strength of differences, which means HEART was more sensitive than other competing DE methods (Supplementary Figure S3; Figure 3). The performance of NBID was slightly better than HEART in some scenarios, but it took a lot of time to run. (Simulation1 of 20000 cells: NBID:
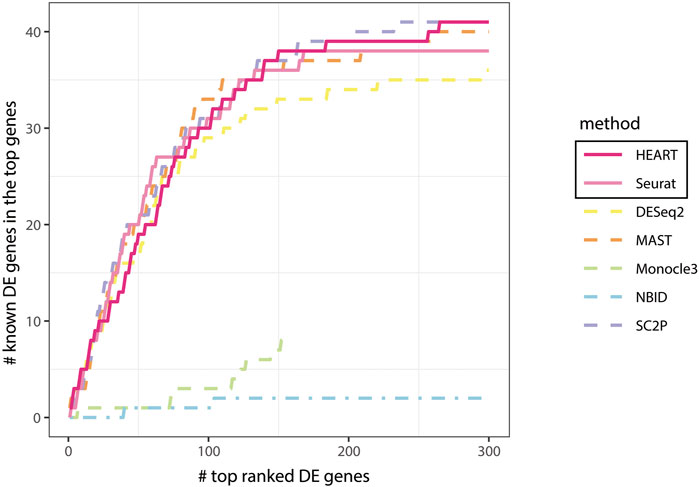
FIGURE 3. Comparing all methods: known DE genes among the top ranked DE genes in human brain cells for astrocytes and oligodendrocytes cells.
2.3 HEART is accurate and robust on read and unique molecular identifier counts data
Read count and unique molecular identifier (UMI) count are two main quantification schemes in single-cell RNA-sequencing technologies and have different statistical characterizations. Some literature (Zilionis et al., 2017; Chen et al., 2018; Kashima et al., 2020; Sarkar and Stephens, 2021) suggested that read count data have higher count levels, more sparsity and more variability than UMI counts data. To assess the accuracy and robustness of HEART on different quantification mechanisms, we applied HEART and other six DE methods (Seurat, DESeq2, MAST, Monocle3, NBID, and SC2P) on two real single-cell datasets from quantification schemes. A human brain dataset (Darmanis et al., 2015) (GSE67835) based on read count quantification schemes and a dataset of peripheral blood mononuclear cells (PBMC68K (Zheng et al., 2017)) quantified by UMI counts.
2.3.1 Performances on human brain data
Human brain data (GSE67835) (Darmanis et al., 2015) was a single-cell dataset quantified by read count. It sequenced 466 cells from human cortical tissue containing six sub-cell types. In this human brain data, we used all seven DE methods to identify DE genes on two groups of cells (astrocytes: 62 cells, oligodendrocytes: 38 cells) with 10483 genes. The number of DE genes of different DE methods varied greatly (Table 1). At an FDR of 5%, HEART identifies 973 DE genes. For Standard 1, we obtained a list of 41 DE genes (Standard 1) between these two sub-celltypes by comparing purified cell types via bulk RNA-seq (Zhang et al., 2014; Darmanis et al., 2015). DE genes identified by HEART cover all 41 DE genes in Standard 1. NBID and SC2P also identified 41 DE genes in Standard 1. Still, they identified too many genes as DE genes (NBID: 6116 DE genes, SC2P: 2220 DE genes) and had low specificities (NBID: specificity = 0.42, SC2P: specificity = 0.79), suggesting potentially false signals. Underlying Standard 2 (top 500 genes) and Standard 3 (top 1,000 genes), HEART had the highest
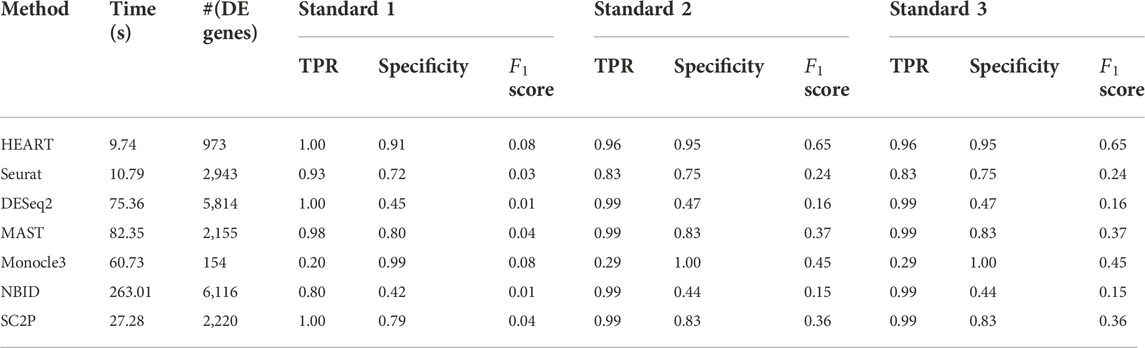
TABLE 1. The time consumption, number of DE genes, TPR, specificity, and
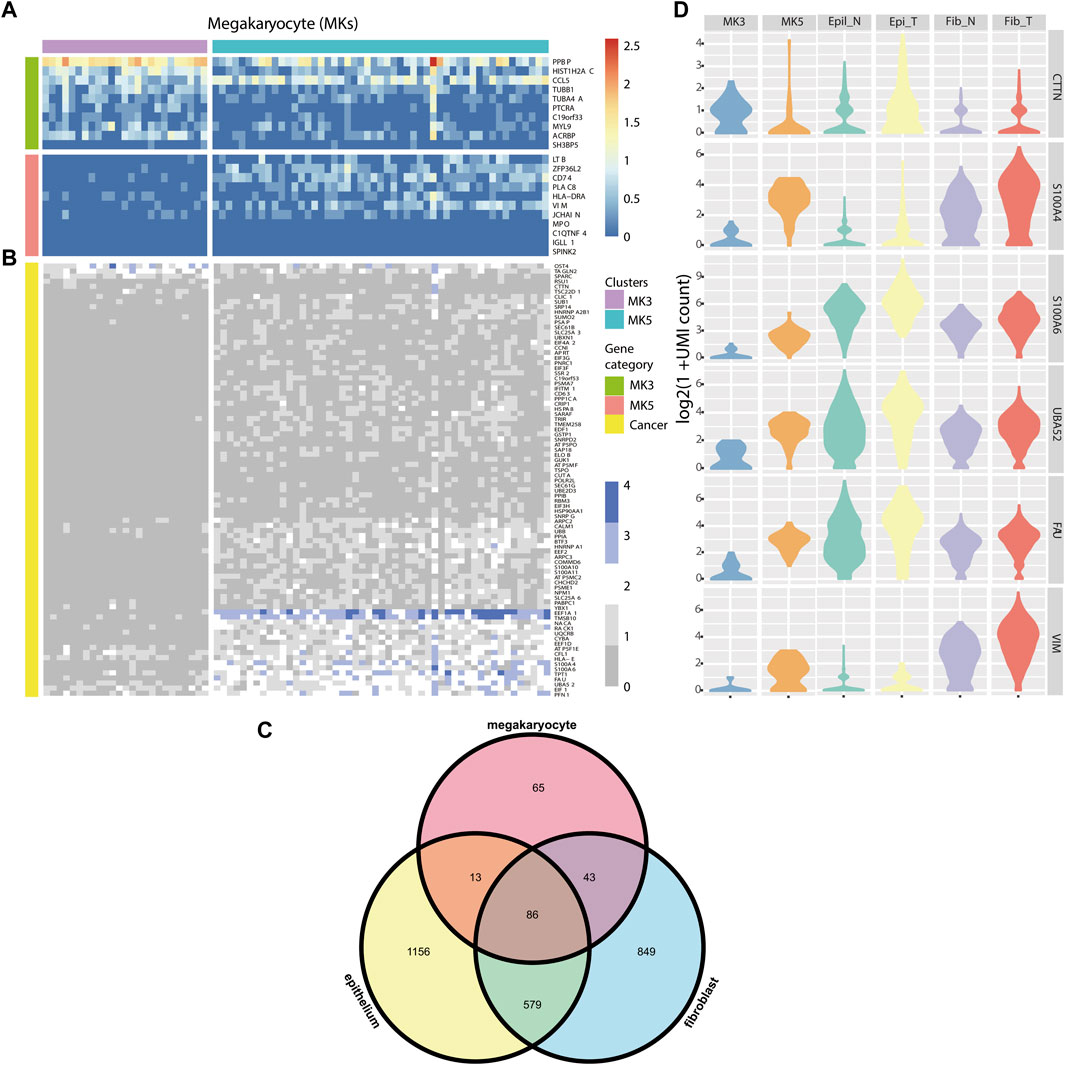
FIGURE 4. (A) Heatmap of marker genes for MK3 and MK5 clusters. (B) Heatmap of some DE genes detected by HEART. (C) Venn diagram of DE genes from 3 cell types of tumor and normal cells. (D) Violin plots showing some DE genes’ expression patterns in MK3, MK5 cluster, Epithelial cluster, and fibroblast cluster in tumor and normal tissues, respectively.
In this human brain single-cell dataset quantified by read counts, HEART performs best among seven DE methods. Underlying different standards, HEART always had excellent accuracy for DE gene detection. DESeq2 and NBID had high TPRs, but they maybe detect false DE genes because they identified overabundant genes as DE genes.
2.3.2 Performances on PBMC68K
PBMC68K (Wang et al., 2019) was a single-cell UMI count dataset of peripheral blood mononuclear cells (PBMCs) generated by 10X Genomics. T cells were the most abundant cell type in PBMCs and play an essential role in the immune response and immune regulation. Naïve T cells and memory T cells had significant differences in functions and features, but they had a large degree of similarity in their overall gene expression (Supplementary Material S1; Supplementary Figure S1). The researches on gene expression patterns of the two types of T cells were still inadequate (Liu et al., 2001; Weng et al., 2012). We used all seven DE methods (HEART, Seurat, DESeq2, MAST, Monocle3, NBID, and SC2P) to detect DE genes between CD4+ Naive T cells (1873 cells) and CD4+ memory T cells (3,061 cells) from the PBMC68K (Zheng et al., 2017) dataset with 12406 genes. The number of DE genes identified by each method is very different. HEART, Seurat, DESeq2, MAST, Monocle3, NBID and SC2P selected 692, 676, 459, 36, 431, 1,214, 121 genes, respectively (Table.2). For Standard 1, 37 known DE genes from the literature were obtained from various microarray experiments of T cells from both humans and mice (Liu et al., 2001; Weng et al., 2012). None of the DE methods in our research fully identified these 37 true DE genes. HEART, Seurat, DESeq2, Monocle3, MAST, NBID, and SC2P captured 12, 16, 0, 28, 9, 4, 20 DE genes (Table.2), respectively. NBID detected most DE genes of the standart1, but it identified the most gene (1,214 genes) as DE gene. HEART and Monocle had relatively higher TPR, specificity, and
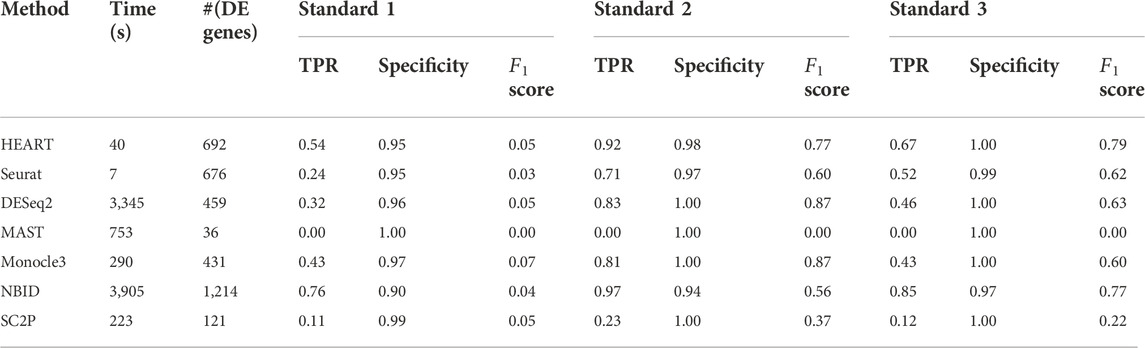
TABLE 2. The time consumption, number of DE genes, sensitivity, specificity, and
2.4 HEART identifies metastatic colorectal cancer biomarkers
Colorectal cancer (CRC) is the most commonly diagnosed cancers in the world.20% of individuals with newly diagnosed colorectal cancer have metastatic disease upon presentation, and another 25% of those who initially have localized illness will eventually acquire metastases (Biller and Schrag, 2021). Distant metastasis was the main cause of death in patients with colorectal cancer, but the exact metastasis mechanism was still unknown. (Zhang et al., 2014). ScRNA-seq technology provided a new opportunity to investigate the association between genes and the mechanism of tumor initiation, progression, and metastasis (Lawson et al., 2018). Therefore, we applied HEART in a single-cell dataset (containing three sub-datasets: PBMC, normal tissue, and tumor tissue) of a stage III colorectal cancer patient. We used HEART to identify DE genes between tumor and normal fibroblasts and between tumor and normal epitheliums. Furthermore, we found two subpopulations of megakaryocytes (MKs) (Wang et al., 2021) in the PBMCs and utilized HEART to detect 207 DE genes on the2 MK subtype clusters to characterize functional differences and underlying molecular mechanisms. Highly expressed genes in the cluster MK3 (Satija et al., 2015; Stuart et al., 2019; Fa et al., 2021; Wang et al., 2021), such as CCL5, TUBB1, MYL9, HIST1H2AC, etc. (Figure 4A), were associated with early platelet production. Another subpopulation, MK5, with high CD74 and PLAC8 might be a less mature MK population. Moreover, we observed that many DE genes between MK3 and MK5 cells overlap with DE genes between tumor and normal epitheliums and DE genes between tumor and normal fibroblasts (Figure 4B, Figure 4C). They had similar expression patterns in the MK5 cells, tumor epitheliums, and fibroblasts (Figure 4D) and were related to colorectal cancer progression or metastasis. The Violin plot showed similar distribution shapes of CTTN in MK5 cells and epithelial tumor cells. The gene CTTN has been reported overexpressed in various cancers, including colorectal cancer, and had the function of promoting tumor cell migration (Luo et al., 2006; Jing et al., 2016; Zhang et al., 2017). Furthermore, S100A4 (Helfman et al., 2005; Nader et al., 2020), S100A6 (Komatsu et al., 2000), UBA52 (Zhou et al., 2019), FAU (Pickard et al., 2011), and VIM (Luque-Garcia et al., 2010; Xu et al., 2017), etc. Also had similar expression patterns between MK5 cells and tumor epitheliums and fibroblasts. S100A4 and S100A6 play an important role in tumor metastases, including colorectal tumor metastasis (Komatsu et al., 2000). Recent studies have proved that the bloodstream plays a crucial role in tumor metastasis and tumor immune escape (Lawson et al., 2018). The cooperation of hematopoiesis, megakaryocytes, and platelet production aided CTCs in escaping the immune system and disseminating within the bloodstream to establish distant organ metastasis. We also validated the expression pattern of these genes in the spatial transcriptome data of two other stage IV colorectal cancer patients (Supplementary Figure S4), which showed spatial patterns of high expression in cancer cells.
Consequently, we supposed that a series of genes, CTTN, S100A4, S100A6, etc., were potential colorectal cancer metastasis biomarkers. The MK5 subpopulation with highly-expressed above potential biomarkers might be a cluster related to colorectal cancer metastasis and have a circulating tumor cell (CTC). The exact mechanism between MK5 and colorectal tumor metastasis warranted further investigation.
3 Discussion
Differential expression analysis was a crucial topic in cancer heterogeneity analysis. The new characteristics of scRNA-seq data put forward new challenges for the DE method. Model-based methods methods’ performances are unstable due to strong assumptions and lacked scalability facing the explosive growing scale of single-cell data. Test-based methods were more scalable than model-based methods. However, the accuracy existing in these test-based methods was relatively too low in identifying DE genes due to the sparsity, variability, and complexity of scRNA-seq data. HEART proposed a bio-driven combination test framework that captures comprehensive differences by integrating differential information about gene expression ratio, gene expression level, and variability. Unlike most competitors assuming theoretical statistical distribution (some are complex mixture distributions) for gene expression, HEART used a combination framework of simple statistical tests to test the two parts of the gene expression. We compared HEART and the other six DE methods on various simulation datasets with different sample sizes and DE strength of DE genes. HEART achieved an excellent trade-off between accuracy and computational efficiency. It had higher
In summary, HEART is a competitive DE method for scRNA-seq data, which maintains high accuracy, unrivaled computational efficiency, and strong robustness across diverse scRNA-seq datasets.
4 Materials and methods
4.1 Datasets
We used three actual scRNA-seq datasets in applications. The PBMC68K is available from https://support.10xgenomics.com/single-cellgene-expression/datasets. The human brain dataset can be obtained by R package SC2P or the GEO database repository under accession code GSE67835. The scRNA-seq data of one stage III colorectal cancer patient have been deposited in the OMIX, China National Center for Bioinformation / Beijing Institute of Genomics, Chinese Academy of Sciences (https://ngdc.cncb.ac.cn/omix: accession no. OMIX002120). The spatial transcriptomic data of two colorectal cancer patients are available from (http://www.cancerdiversity.asia/scCRLM).
4.2 Simulation settings
We used two simulation data generation mechanisms to generate scenarios with different settings. Each design had 20 replications. The popular artificial protocol, Splatter (Zappia et al., 2017), generated simulation datasets in simulation 1. Each scenario contained 10000 genes (1000 DE genes and 10000 non-DE genes) and two underlying subpopulations. We varied the number of samples (1,000, 2000, 5,000, 10000, 20000) and DE strength for DE genes (de.factor = 0.3, 0.5). De.factor is the differential expression factor produced from a log-normal distribution. A high de.factor can result in the strong DE strength of DE genes between groups (More details of parameters in Supplementary Material S1).
Simulation 2 adopted a semi-simulation mechanism based on actual scRNA datasets to recover the multimodality and biological characteristic complexity of actual scRNA-seq data (Figure 2C, Supplementary Material S1) (Chen et al., 2018). First, we randomly divided the real scRNA-seq dataset into two parts regarded as two groups of cells. The second step was to create differentially expressed genes. We ranked the mean counts of all genes of the second group of cells and chose 200 genes, starting with the one having a mean count just above
4.3 DE genes list
All DE gene lists in simulation datasets were artificially set. We calculated all method performance indices according to known DE gene lists. Due to the unattainability of the whole accurate DE genes list of different cell groups in real single-cell data, we used different standards to set three potential DE gene lists and calculated all method performance indices.
Standard 1. Known DE genes from the literature.
Standard 2. The top 500 genes are ranked by the chosen number of times by all methods.
Standard 3. The top 1,000 genes are ranked by the chosen number of times by all methods.
For Standard 1, we collected dozens of known DE genes from various experiments based on bulk RNA-seq in the literature (Liu et al., 2001; Weng et al., 2012; Zhang et al., 2014; Darmanis et al., 2015). They were partial genes of the whole true DE genes between different cell clusters. For Standard 2 and 3, we ranked all genes’ chosen number of times by all methods and set the top 500 and 1,000 genes as potential DE genes between different cell clusters.
4.4 Index
On the basis of the DE gene list in 2.3, we calculated a series of indices:
4.5 Method details
For this
In terms of hypotheses
For this
Where,
Data availability statement
The datasets presented in this study can be found in online repositories. The names of the repository/repositories and accession number(s) can be found in the article/Supplementary Material.
Ethics statement
The studies involving human participants were reviewed and approved by Ethics Committee of Ruijin Hospital affiliated to Shanghai Jiao Tong University School of Medicine. The patients/participants provided their written informed consent to participate in this study.
Author contributions
XY, SM, and ZY designed the HEART. ZY, JS, GC, JZ, and YZ obtained funding and provided the essential materials. XY, BF, TW, YM, and WL preprocessed the datasets. XY implemented the methods, the simulation framework, and the method comparison. All authors read and approved the final paper.
Funding
This study was supported by National Natural Science Foundation of China (ID: 12171318), Shanghai Science and Technology Commission (ID: 20JC1410100), Shanghai Science and Technology Commission (ID: 21ZR1436300), Three-year plan of Shanghai public health system construction (ID: GWV-10.1-XK05), Shanghai Jiao Tong University STAR Grant (ID: 20190102), Medical Engineering Cross Fund of Shanghai Jiao Tong University (ID: YG2021QN50).
Acknowledgments
We gratefully thank PhD student Shuya Cui, Kaiqi Zhang, and Congwen Xiao for their helpful discussion.
Conflict of interest
The authors declare that the research was conducted in the absence of any commercial or financial relationships that could be construed as a potential conflict of interest.
Publisher’s note
All claims expressed in this article are solely those of the authors and do not necessarily represent those of their affiliated organizations, or those of the publisher, the editors and the reviewers. Any product that may be evaluated in this article, or claim that may be made by its manufacturer, is not guaranteed or endorsed by the publisher.
Supplementary material
The Supplementary Material for this article can be found online at: https://www.frontiersin.org/articles/10.3389/fgene.2022.1063130/full#supplementary-material
References
Biller, L. H., and Schrag, D. (2021). Diagnosis and treatment of metastatic colorectal cancer: A review. JAMA 325, 669–685. doi:10.1001/jama.2021.0106
Chen, W., Li, Y., Easton, J., Finkelstein, D., Wu, G., and Chen, X. (2018). UMI-count modeling and differential expression analysis for single-cell RNA sequencing. Genome Biol. 19, 70. doi:10.1186/s13059-018-1438-9
Cho, M. S., Bottsford-Miller, J., Vasquez, H. G., Stone, R., Zand, B., Kroll, M. H., et al. (2012). Platelets increase the proliferation of ovarian cancer cells. Blood 120, 4869–4872. doi:10.1182/blood-2012-06-438598
Darmanis, S., Sloan, S. A., Zhang, Y., Enge, M., Caneda, C., Shuer, L. M., et al. (2015). A survey of human brain transcriptome diversity at the single cell level. Proc. Natl. Acad. Sci. U. S. A. 112, 7285–7290. doi:10.1073/pnas.1507125112
Ding, J., Adiconis, X., Simmons, S. K., Kowalczyk, M. S., Hession, C. C., Marjanovic, N. D., et al. (2020). Systematic comparison of single-cell and single-nucleus RNA-sequencing methods. Nat. Biotechnol. 38, 737–746. doi:10.1038/s41587-020-0465-8
Eide, P. W., Moosavi, S. H., Eilertsen, I. A., Brunsell, T. H., Langerud, J., Berg, K. C. G., et al. (2021). Metastatic heterogeneity of the consensus molecular subtypes of colorectal cancer. NPJ Genom. Med. 6, 59. doi:10.1038/s41525-021-00223-7
Fa, B., Wei, T., Zhou, Y., Johnston, L., Yuan, X., Ma, Y., et al. (2021). GapClust is a light-weight approach distinguishing rare cells from voluminous single cell expression profiles. Nat. Commun. 12, 4197. doi:10.1038/s41467-021-24489-8
Finak, G., McDavid, A., Yajima, M., Deng, J., Gersuk, V., Shalek, A. K., et al. (2015). Mast: A flexible statistical framework for assessing transcriptional changes and characterizing heterogeneity in single-cell RNA sequencing data. Genome Biol. 16, 278. doi:10.1186/s13059-015-0844-5
Helfman, D. M., Kim, E. J., Lukanidin, E., and Grigorian, M. (2005). The metastasis associated protein S100A4: Role in tumour progression and metastasis. Br. J. Cancer 92, 1955–1958. doi:10.1038/sj.bjc.6602613
Huang, W., Zhao, S., Xu, W., Zhang, Z., Ding, X., He, J., et al. (2019). Presence of intra-tumoral CD61+ megakaryocytes predicts poor prognosis in non-small cell lung cancer. Transl. Lung Cancer Res. 8, 323–331. doi:10.21037/tlcr.2019.08.23
Jing, X., Wu, H., Ji, X., Wu, H., Shi, M., and Zhao, R. (2016). Cortactin promotes cell migration and invasion through upregulation of the dedicator of cytokinesis 1 expression in human colorectal cancer. Oncol. Rep. 36, 1946–1952. doi:10.3892/or.2016.5058
Kashima, Y., Sakamoto, Y., Kaneko, K., Seki, M., Suzuki, Y., and Suzuki, A. (2020). Single-cell sequencing techniques from individual to multiomics analyses. Exp. Mol. Med. 52, 1419–1427. doi:10.1038/s12276-020-00499-2
Kharchenko, P. V., Silberstein, L., and Scadden, D. T. (2014). Bayesian approach to single-cell differential expression analysis. Nat. Methods 11, 740–742. doi:10.1038/nmeth.2967
Kharchenko, P. V. (2021). The triumphs and limitations of computational methods for scRNA-seq. Nat. Methods 18, 723–732. doi:10.1038/s41592-021-01171-x
Komatsu, K., Kobune-Fujiwara, Y., Andoh, A., Ishiguro, S., Hunai, H., Suzuki, N., et al. (2000). Increased expression of S100A6 at the invading fronts of the primary lesion and liver metastasis in patients with colorectal adenocarcinoma. Br. J. Cancer 83, 769–774. doi:10.1054/bjoc.2000.1356
Lawson, D. A., Kessenbrock, K., Davis, R. T., Pervolarakis, N., and Werb, Z. (2018). Tumour heterogeneity and metastasis at single-cell resolution. Nat. Cell Biol. 20, 1349–1360. doi:10.1038/s41556-018-0236-7
Linnekamp, J. F., Wang, X., Medema, J. P., and Vermeulen, L. (2015). Colorectal cancer heterogeneity and targeted therapy: A case for molecular disease subtypes. Cancer Res. 75, 245–249. doi:10.1158/0008-5472.CAN-14-2240
Liu, C., Huang, B., Wang, H., and Zhou, J. (2021). The heterogeneity of megakaryocytes and platelets and implications for ex vivo platelet generation. Stem Cells Transl. Med. 10, 1614–1620. doi:10.1002/sctm.21-0264
Liu, K., Li, Y., Prabhu, V., Young, L., Becker, K. G., Munson, P. J., et al. (2001). Augmentation in expression of activation-induced genes differentiates memory from naive CD4+ T cells and is a molecular mechanism for enhanced cellular response of memory CD4+ T cells. J. Immunol. 166, 7335–7344. doi:10.4049/jimmunol.166.12.7335
Love, M. I., Huber, W., and Anders, S. (2014). Moderated estimation of fold change and dispersion for RNA-seq data with DESeq2. Genome Biol. 15, 550. doi:10.1186/s13059-014-0550-8
Lucotti, S., and Muschel, R. J. (2020). Platelets and metastasis: New implications of an old interplay. Front. Oncol. 10, 1350. doi:10.3389/fonc.2020.01350
Luo, M. L., Shen, X. M., Zhang, Y., Wei, F., Xu, X., Cai, Y., et al. (2006). Amplification and overexpression of CTTN (EMS1) contribute to the metastasis of esophageal squamous cell carcinoma by promoting cell migration and anoikis resistance. Cancer Res. 66, 11690–11699. doi:10.1158/0008-5472.CAN-06-1484
Luque-Garcia, J. L., Martinez-Torrecuadrada, J. L., Epifano, C., Canamero, M., Babel, I., and Casal, J. I. (2010). Differential protein expression on the cell surface of colorectal cancer cells associated to tumor metastasis. Proteomics 10, 940–952. doi:10.1002/pmic.200900441
Nader, J. S., Guillon, J., Petit, C., Boissard, A., Franconi, F., Blandin, S., et al. (2020). S100A4 is a biomarker of tumorigenesis, EMT, invasion, and colonization of host organs in experimental malignant mesothelioma. Cancers (Basel) 12, E939. doi:10.3390/cancers12040939
Pickard, M. R., Mourtada-Maarabouni, M., and Williams, G. T. (2011). Candidate tumour suppressor fau regulates apoptosis in human cells: An essential role for bcl-G. Biochim. Biophys. Acta 1812, 1146–1153. doi:10.1016/j.bbadis.2011.04.009
Qiu, X., Hill, A., Packer, J., Lin, D., Ma, Y. A., and Trapnell, C. (2017). Single-cell mRNA quantification and differential analysis with Census. Nat. Methods 14, 309–315. doi:10.1038/nmeth.4150
Sarkar, A., and Stephens, M. (2021). Separating measurement and expression models clarifies confusion in single-cell RNA sequencing analysis. Nat. Genet. 53, 770–777. doi:10.1038/s41588-021-00873-4
Satija, R., Farrell, J. A., Gennert, D., Schier, A. F., and Regev, A. (2015). Spatial reconstruction of single-cell gene expression data. Nat. Biotechnol. 33, 495–502. doi:10.1038/nbt.3192
Soneson, C., and Robinson, M. D. (2018). Bias, robustness and scalability in single-cell differential expression analysis. Nat. Methods 15, 255–261. doi:10.1038/nmeth.4612
Stuart, T., Butler, A., Hoffman, P., Hafemeister, C., Papalexi, E., Mauck, W. M., et al. (2019). Comprehensive integration of single-cell data. Cell 177, 1888–1902. doi:10.1016/j.cell.2019.05.031
Trapnell, C., Cacchiarelli, D., Grimsby, J., Pokharel, P., Li, S., Morse, M., et al. (2014). The dynamics and regulators of cell fate decisions are revealed by pseudotemporal ordering of single cells. Nat. Biotechnol. 32, 381–386. doi:10.1038/nbt.2859
Wang, H., He, J., Xu, C., Chen, X., Yang, H., Shi, S., et al. (2021). Decoding human megakaryocyte development. Cell Stem Cell 28, 535–549. doi:10.1016/j.stem.2020.11.006
Wang, T., Li, B., Nelson, C. E., and Nabavi, S. (2019). Comparative analysis of differential gene expression analysis tools for single-cell RNA sequencing data. BMC Bioinforma. 20, 40. doi:10.1186/s12859-019-2599-6
Weng, N. P., Araki, Y., and Subedi, K. (2012). The molecular basis of the memory T cell response: Differential gene expression and its epigenetic regulation. Nat. Rev. Immunol. 12, 306–315. doi:10.1038/nri3173
Wu, Z., Zhang, Y., Stitzel, M. L., and Wu, H. (2018). Two-phase differential expression analysis for single cell RNA-seq. Bioinformatics 34, 3340–3348. doi:10.1093/bioinformatics/bty329
Xu, L., Mao, X., Guo, T., Chan, P. Y., Shaw, G., Hines, J., et al. (2017). The novel association of circulating tumor cells and circulating megakaryocytes with prostate cancer prognosis. Clin. Cancer Res. 23, 5112–5122. doi:10.1158/1078-0432.CCR-16-3081
Zappia, L., Phipson, B., and Oshlack, A. (2017). Splatter: Simulation of single-cell RNA sequencing data. Genome Biol. 18, 174. doi:10.1186/s13059-017-1305-0
Zhang, X., Liu, K., Zhang, T., Wang, Z., Qin, X., Jing, X., et al. (2017). Cortactin promotes colorectal cancer cell proliferation by activating the EGFR-MAPK pathway. Oncotarget 8, 1541–1554. doi:10.18632/oncotarget.13652
Zhang, Y., Chen, K., Sloan, S. A., Bennett, M. L., Scholze, A. R., O'Keeffe, S., et al. (2014). An RNA-sequencing transcriptome and splicing database of glia, neurons, and vascular cells of the cerebral cortex. J. Neurosci. 34, 11929–11947. doi:10.1523/JNEUROSCI.1860-14.2014
Zheng, G. X. Y., Terry, J. M., Belgrader, P., Ryvkin, P., Bent, Z. W., Wilson, R., et al. (2017). Massively parallel digital transcriptional profiling of single cells. Nat. Commun. 8, 14049. doi:10.1038/ncomms14049
Zhou, Q., Hou, Z., Zuo, S., Zhou, X., Feng, Y., Sun, Y., et al. (2019). LUCAT1 promotes colorectal cancer tumorigenesis by targeting the ribosomal protein L40-MDM2-p53 pathway through binding with UBA52. Cancer Sci. 110, 1194–1207. doi:10.1111/cas.13951
Zilionis, R., Nainys, J., Veres, A., Savova, V., Zemmour, D., Klein, A. M., et al. (2017). Single-cell barcoding and sequencing using droplet microfluidics. Nat. Protoc. 12, 44–73. doi:10.1038/nprot.2016.154
Keywords: combination test, differential analysis, colorectal cancer, PBMC68K, DE gene
Citation: Yuan X, Ma S, Fa B, Wei T, Ma Y, Wang Y, Lv W, Zhang Y, Zheng J, Chen G, Sun J and Yu Z (2022) A high-efficiency differential expression method for cancer heterogeneity using large-scale single-cell RNA-sequencing data. Front. Genet. 13:1063130. doi: 10.3389/fgene.2022.1063130
Received: 06 October 2022; Accepted: 14 November 2022;
Published: 29 November 2022.
Edited by:
Hongmei Jiang, Northwestern University, United StatesReviewed by:
Keren Li, University of Alabama at Birmingham, United StatesLingfei Wang, Broad Institute, United States
Copyright © 2022 Yuan, Ma, Fa, Wei, Ma, Wang, Lv, Zhang, Zheng, Chen, Sun and Yu. This is an open-access article distributed under the terms of the Creative Commons Attribution License (CC BY). The use, distribution or reproduction in other forums is permitted, provided the original author(s) and the copyright owner(s) are credited and that the original publication in this journal is cited, in accordance with accepted academic practice. No use, distribution or reproduction is permitted which does not comply with these terms.
*Correspondence: Jing Sun, c2oxMTc4OEByamguY29tLmNu; Zhangsheng Yu, eXV6aGFuZ3NoZW5nQHNqdHUuZWR1LmNu