
94% of researchers rate our articles as excellent or good
Learn more about the work of our research integrity team to safeguard the quality of each article we publish.
Find out more
ORIGINAL RESEARCH article
Front. Genet., 18 November 2022
Sec. Genomics of Plants and the Phytoecosystem
Volume 13 - 2022 | https://doi.org/10.3389/fgene.2022.1048578
This article is part of the Research TopicBreaking the Myth: Breeding for Stress Tolerance, Grain Yield, and Quality Traits Simultaneously by Diversifying the Narrow Genetic BaseView all 42 articles
 Jagmohan Singh1,2
 Rashmi Aggarwal1*
 Bishnu Maya Bashyal1K. Darshan1,3
 Bharat Raj Meena4
 Jagdish Yadav1
 M. S. Saharan1
 Zakir Hussain5
C. globosum is an endophytic fungus, which is recorded effective against several fungal and bacterial diseases in plants. The exclusively induce defense as mechanism of biocontrol for C. globosum against phyto-pathogens is reported. Our pervious study states the effectiveness of induced defense by C. globosum (Cg), in tomato against Alternaria solani. In this study the temporal transcriptome analysis of tomato plants after treatment with C. globosum was performed for time points at 0 hpCi, 12 hpCi, 24 hpCi and 96 phCi. The temporal expression analysis of genes belonging to defense signaling pathways indicates the maximum expression of genes at 12 h post Cg inoculation. The sequential progression in JA signaling pathway is marked by upregulation of downstream genes (Solyc10g011660, Solyc01g005440) of JA signaling at 24 hpCi and continued to express at same level upto 96 hpCi. However, the NPR1 (Solyc07g040690), the key regulator of SA signaling is activated at 12 h and repressed in later stages. The sequential expression of phenylpropanoid pathway genes (Solyc09g007920, Solyc12g011330, Solyc05g047530) marks the activation of pathway with course of time after Cg treatment that results in lignin formation. The plant defense signaling progresses in sequential manner with time course after Cg treatment. The results revealed the involvement of signaling pathways of ISR and SAR in systemic resistance induced by Cg in tomato, but with temporal variation.
Tomato (Solanum lycopersicum) is highly nutritive vegetable crop plant of immense economic importance which shares 15% of total vegetables produced worldwide. India is the second largest producer in the world with 19.7 million metric tons production from 809 (‘000) hectares land (Gupta et al., 2022). The tomato crop is infested by several pathogens that lead to severe losses in production. The fungal diseases such as late blight, early blight, Fusarium wilt, Verticillium wilt, White mold, Anthracnose and Septoria leaf spot cause major damage followed by bacterial diseases such as bacterial wilt and bacterial leaf spot (Panno et al., 2021). The viral diseases such as tomato mosaic disease and tomato leaf curl disease also cause severe losses (Nagendran et al., 2019).
C. globosum is a biocontrol fungus which is reported to be effective against various pathogens such as A. solani in tomato (early blight) (Singh et al., 2021), Alternaria alertnata in tomato (leaf spot) (Fayyadh and Yousif, 2019), Fusarium oxysporum f.sp. lycopersici in tomato (F. wilt) (Madbouly et al., 2017), Bipolaris sorokiniana in wheat (spot blotch) (Aggarwal et al., 2004; Aggarwal et al., 2011), Phytophthora infestans in potato (late blight) (Shanthiyaa et al., 2013) and Fusarium graminearum in potato (dry rot) (Jiang et al., 2017). C. globosum belongs to a saprophytic genus Chaetomium and family Chaetomiaceae of Ascomycota. Of the more than 300 species of Chaetomium described to date, C. globosum is the most frequently isolated and inhabits the widest range of environments (Domsch et al., 2007). The fungus has been reported to be a potential antagonist of various soil borne and seed borne plant pathogens. C. globosum mycoparasitizes the pathogen and produces antifungal metabolites which suppress the growth of pathogenic fungi (Aggarwal et al., 2013). The mechanism of antifungal action of the biocontrol fungi has been reported mainly through antibiosis (Pan et al., 2016; Li et al., 2016) and mycoparasitism (Moya et al., 2016; Aggarwal et al., 2015). Although a number of reports are available on mycoparastism and antibiosis mechanism of C. globosum against a number of plant pathogenic fungi, but very few studies to date report the role of the induced resistance component of C. globosum for disease management. It is also reported that C. globosum and its metabolites has ability to induce host defense against tan spot in wheat caused by Pyrenophora tritici-repentis (Istifadah et al., 2006). The recent studies state that C. globosum induces defense mechanism in tomato plant which reduces the disease establishment by A. solani (Singh et al., 2021). To gain insights into the potential induced defense mechanism of C. globosum in tomato, temporal transcriptome of plants treated with C. globosum Cg-2 (virulent isolate) is performed in this study. Temporal transcriptome profile was validated by expression analysis of differentially expressed genes of defense induced hormone signaling pathways by using real time reverse transcriptase PCR (qRT-PCR).
The seeds of Pusa Rohini variety of tomato were obtained from vegetable seed production unit of ICAR-Indian Agricultural Research Institute, New Delhi. The C. globosum (Cg-2) previously isolated from wheat fields of ICAR-Indian Agricultural Research Institute, New Delhi (Aggarwal et al., 2013) was maintained on Potato Dextrose Agar (PDA) in our laboratory in 16-h light and 8 h dark.
The tomato seed weighing 5 g were surface sterilized by dipping in 1% (v/v) sodium hypochloride solution for 1 min and subsequent double washing with distilled water. The air-dried seeds were sown in 14-inch sterilized sand soil (3:1) as nursery and 3 weeks old seedlings were transplanted in 6-inch pots in a polyhouse.
The C. globosum (Cg-2) inoculum was prepared by mass multiplication on sorghum grains (Niranjana et al., 2009). The overnight soaked sorghum grains were dried and autoclaved in volumetric flasks for 15 min at 121°C to sterilize the material. The volumetric flask filled with grains was inoculated with a mycelial disc of 7-day-old culture of Cg-2 and placed at 25 ± 2°C (Supplementary Figures S1A,B). The sorghum grains turned black due to Cg-2 spores’ mass and were grounded to prepare spore suspension (Supplementary Figure S1C). The plants were drenched with 100 ml ascospore suspension (1 × 10⁶ spores/ml) of C. globosum at 3–4 leaf stage and control plants were mocked with distilled water (Supplementary Figure S1D). The leaf samples were taken from control plants and from biocontrol treated plants at five different time points after drenching with C. globosum at 6 h post Cg inoculation (hpCi), 12hpCi, 24 hpCi, 48hpCi and 96 hpCi with three replicates for each. The leaf samples were wrapped in silver foil and immediately dipped into liquid nitrogen. The samples were stored at −80°C for storage for long time.
The total RNA was isolated from the six plant samples with two replications (control plants; biocontrol treated plants with five-time intervals) using trizol (TRI reagent, Molecular Research Centre, OH, United States) following the manufacturer’s guidelines. Leaf sample was grounded in pestle-mortar using liquid nitrogen, transferred to 1.5 ml eppendorf tube, homogenized with 1 ml trizol and kept at RT (room temp) for 5 min. Later, 200 µl of chloroform was added to each tube, after a quick vortex kept at RT for 10 min. The samples were phase separated by centrifuge at 12,000 rpm for 15 min (Eppendorf AG, Heidelberg, Germany) and the transparent aqueous phase at the top was transferred to new tube. A 500 µl isopropanol was added to each tube and incubated for 5 min at RT. The samples were centrifuged at 12,000 rpm for 10 min to obtain RNA pellet, followed by subsequent three washings with 75% ethanol (v/v) at 7500 rpm for 5 min. The tube containing RNA pellet was kept open for 30 min to evaporate residual ethanol. Then, pellet was dissolved in 40 µl of nuclease free water and incubated at 55°C in water bath. The RNA samples were quantified using NanoDrop (Thermo Fisher Scientific, Wilmington, NC, United States).
The RNA-sequencing (RNA Seq) was performed for control plants (mock treated with water) and three time points (12 hpi, 24 hpi and 96 hpi) post inoculation with Cg-2, taking two replicates for each sample and in total eight samples. The RNA seq paired end sequencing libraries were prepared from the isolated total RNA using Illumina TrueSeq stranded mRNA sample preparation kit (Illumina, San Diego, CA, United States). For this, mRNA was enriched from the total RNA using poly-T attached magnetic beads, followed by enzymatic fragmentation. The double standard cDNA samples were then purified using Ampure XP beads (New England Biolabs, Ipswich, MA, United States) followed by A-tailing, adapter ligation and then enriched by limited number of PCR cycles (Darshan et al., 2021). The effective concentration of the library was then precisely quantified using a qRT-PCR to ensure the library quality. The size of the purified library was measured on the Bioanalyzer 2100 using DNA 1000 Lab Chip. A library with an average size of more than 300 bp was taken for sequencing in an Illumina sequencing platform (HiSeqTM 2500) by Guangzhou Saizhe Biotechnology Co., Ltd. using Illumina HiSeq 151 × 2 paired end (PE) read technology (Meyer and Kircher, 2010; Singh et al., 2021).
The quality of raw reads was checked by FastQC (version 0.11.8). The high-quality reads were mapped using Minimap (version 2.17) at default parameters against the reference genome of S. lycopersicum (Accession: PRJNA892457; ID: 892457).
The assembled reads were used to estimate gene expression, and the transcripts were quantified using the Cufflinks program module. The expression level of each of the genes was quantified by RNA-seq by expectation maximization (RSEM) tool (Li and Dewey, 2011) available at https://deweylab.biostat.wisc.edu/rsem/ in the form of fragments per kilobase of exon per million mapped reads (FPKM). The number of reads mapped to unigenes was calculated using SAMtools (version 0.1.19) for each sample. Differential analysis of 5 combinations (0 hpCi vs. 12 hpCi, 0 hpCi vs. 24 hpCi, 0 hpCi vs. 96 hpCi, 12 hpCi vs. 24 hpCi, 24 hpCi vs. 96 hpCi ) was carried out by using DESeq 2V 1.6.3 (https://support.bioconductor.org/packages/release/) with selected filters like p-values of 0.05 and log2FC. R package such as Cummerbund was performed to prepare heat maps (Goff et al., 2012), and hierarchical clustering was done using Euclidean correlation matrix. After DESeq analysis, ggplot2 was used to draw volcano plots (Wickham, 2016) with default parameters (Darshan et al., 2020).
Functional annotations of individual and combined unigenes of samples were performed by aligning those unigenes to the non-redundant (NR) protein database (version 36) of NCBI employing BLASTX v2.2.31+ (Suzuki et al., 2015) using a threshold E-value of 1 × e−3. The assembled contigs were then functionally annotated by a Blast2GO software V 3.0 (https://www.blast2go.com) (Conesa et al., 2005). Further, the predicted proteins were subjected to pathway analysis using the Kyoto Encyclopedia of Genes and Genomes (KEGG) (Ogata et al., 1999) database to map the proteins involved in biochemical pathways (Wang et al., 2019; Singh et al., 2021).
The transcriptomics data was validated by analyzing the expression of 10 candidate genes related to plant induced defense pathways by qRT-PCR. The expression analysis was performed for three time points (12 hpCi, 24 hpCi and 96 hpCi) after C. globosum treatment with 0 hpCi as control and each sample with six replicates (three biological replicates and two technical replicates). The RNA was isolated from leaf samples by trizol method as mentioned above. Then, cDNA was synthesized using Thermofisher Scientific Verso cDNA synthesis kit by taking a 2 μg of total RNA for each sample and following the manufacturer’s protocol. Each reaction of 20 µl was prepared with: 4 µl of a 5x cDNA synthesis buffer, 2 µl of a 20 mM dNTP mix, 1 µl of an anchored oligo dT (500 ng/μl), 1 µl of an RT enhancer, 1 µl of a verso enzyme mix, 2 μg of RNA template and volume make up to 20 μl with nuclease free water. After quick spin, PCR tubes were kept in thermocycler at 42°C for 45 min and reverse transcriptase enzyme was inactivated at 95°C for 2 min.
The qRT-PCR reaction mix were prepared for expression analysis of selected genes by using specific the primer pairs (Table 1), and SlEF (elongation factor gene) was used as reference gene (Rotenberg et al., 2006). The reaction consists of cDNA (1 µl), SYBR Green PCR master mix (12 µl), a forward primer-1pM (0.5 µl), a reverse primer-1 pM (0.5 µl) and distilled water to make up final volume of 20 µl. The PCR was performed with the following conditions: 94°C for 4 min and later 40 cycles of 94°C for 15 s, 57°C for 30 s, and at 70°C for 30 s. Relative gene expressions were calculated in terms of fold changes using the 2−ΔΔCt method.
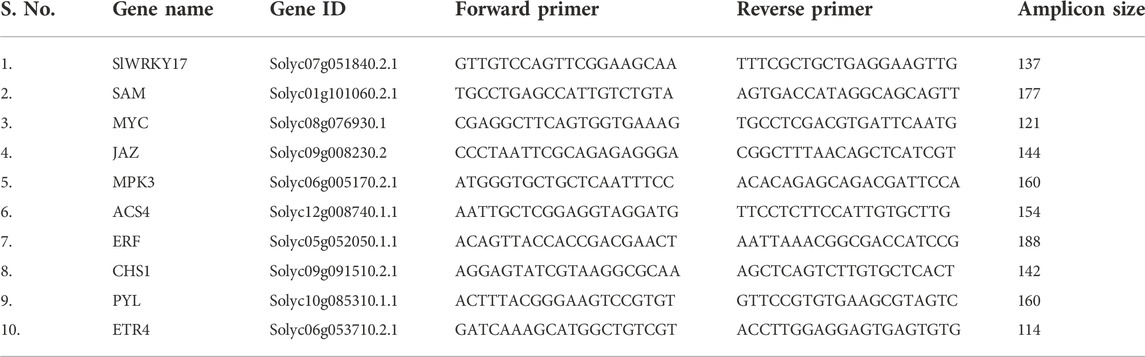
TABLE 1. The primer sequences for genes selected for qRT-PCR.
The plant growth parameters showed statistically significant difference when treated with biocontrol agent Cg-2 on analysis with SPSS version 27.0. The biocontrol treated plants had better plant growth which was evident from 20.15% increase in plant height and 31.2% increase in plant root length as compared to control plants (Supplementary Table S1).
The RNA sequencing was performed for eight tomato samples which included four time points after Cg-2 inoculation (control plant, 12hpCi, 24hpCi and 96 hpCi) and two replicates for each sample. RNA-seq data yielded an average of 19–20 million reads by using Illumina HiSeq 2000 mRNA sequencing platform with an average read length of 2000 bp. The mapping percentage with reference genome of S. lycopersicum ranged from 84%–90% (Table 2).
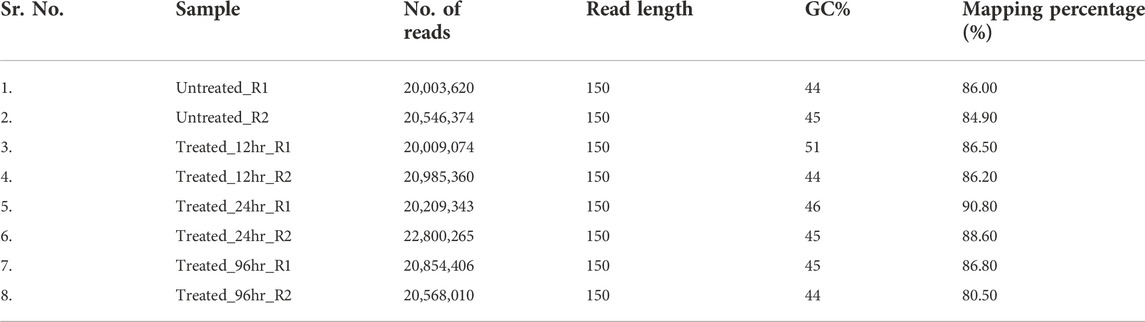
TABLE 2. Statistics of RNA sequencing data for untreated plant, Cg-2 treated plant at 12 hpCi, 24 hpCi and 96 hpCi.
In total, 22,473 specific differentially expressed genes (DEGs) were expressed in tomato at 12 h after Cg-2 inoculation as compared to control plants without Cg-2 treatment and among these 922 DEGs had fold change −2 to +2 and p < 0.05 (Figure 1A). Out of 922 DEGs, 61 DEGs were expressed exclusively in control plant (0 h), 80 DEGs at 12 hpCi and 781 DEGs were commonly expressed at 0 h and 12 hpCi (Figure 2A; Supplementary Table S2). The KEGG pathway analysis reveals that most of the DEGs belong to 10 KEGG pathways with maximum DEGs (i.e., 1370 DEGs) related to metabolic pathways, biosynthesis of secondary metabolites, ribosome, carbon metabolism, plant hormone signal transduction, biosynthesis of amino acids, plant-pathogen interaction, protein processing in endoplasmic reticulum, phenylpropanoid biosynthesis and MAPK signaling pathway in plant (Figure 3A; Supplementary Table S3). Gene Ontology (GO) classification indicated 1647 DEGs with 15 GO terms belong to cellular component category, 756 DEGs with 10 GO terms belong to molecular function category and 1113 DEGs with 20 terms belong to biological processes. The maximum DEGs belong to catalytic activity (324 DEGs), binding (338 DEGs), metabolic process (287 DEGs), cellular process (292 DEGs), response to stimulus (103 DEGs), biological regulation (100 DEGs) and transcription regulator activity (41 DEGs) (Figure 4A; Supplementary Table S4). The heat map depicts the important genes of metabolic processes, secondary metabolites biosynthesis and signaling pathways upregulated or downregulated at 24 hpCi (Figure 5A; Supplementary Table S5).
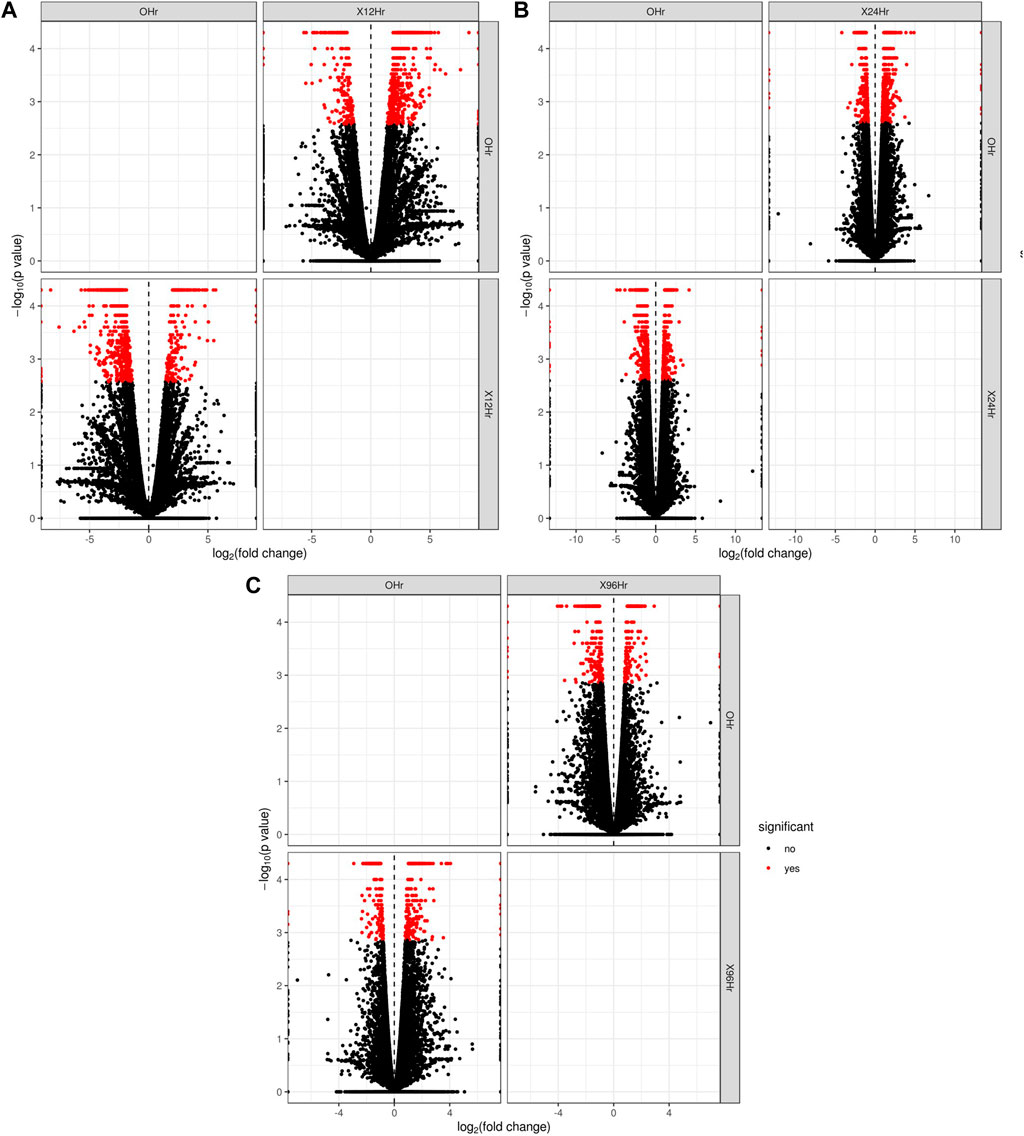
FIGURE 1. The volcano plot represents the significant genes above the threshold FDR and log (FC) in Cg-2 treated at (A) 0 h vs. 12 h (B) 0 h vs. 24 h (C) 0 h vs. 96 h.

FIGURE 2. Venn diagram showing the DEG expressed (A) exclusively in control plant, Cg2 treated plant at 12hpCi and mutually expressed in both conditions (B) exclusively in control plant, Cg2 treated plant at 24hpCi and mutually expressed in both conditions (C) exclusively in control plant, Cg2 treated plant at 96hpCi and mutually expressed in both conditions (fold change < −2 or > 2 and p < 0.05)
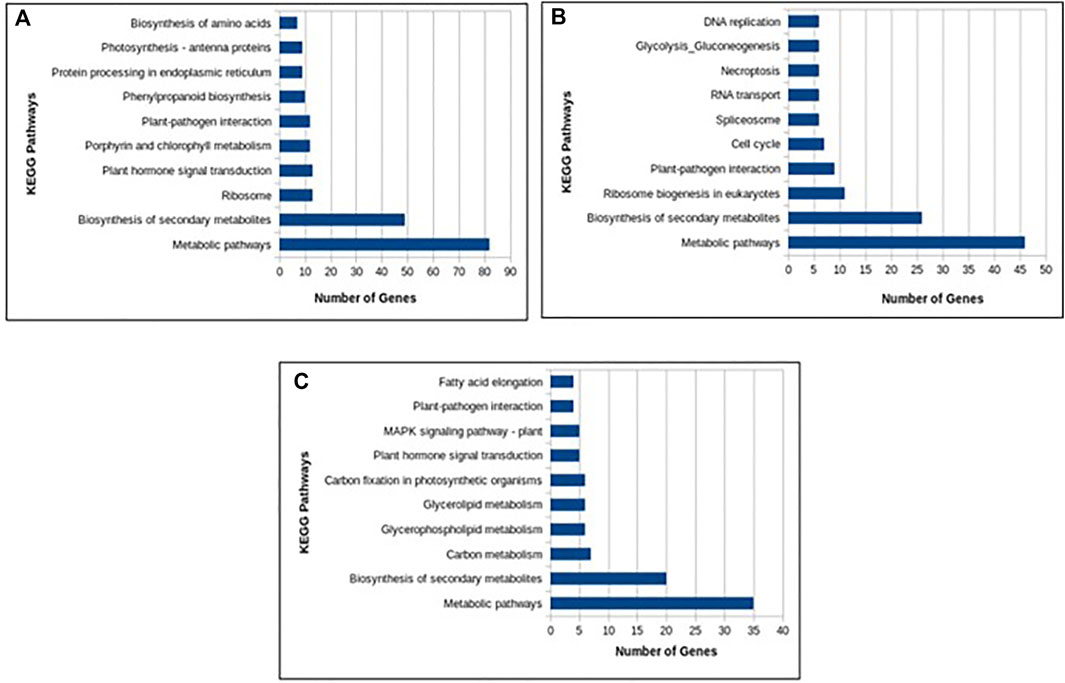
FIGURE 3. Column graph representing the enriched Kyoto Encyclopedia of Genes and Genomes (KEGG) pathways at (A) 12 hpCi (B) 24 hpCi and (C) 96 hpCi in comparison to control (0hpCi) plants.
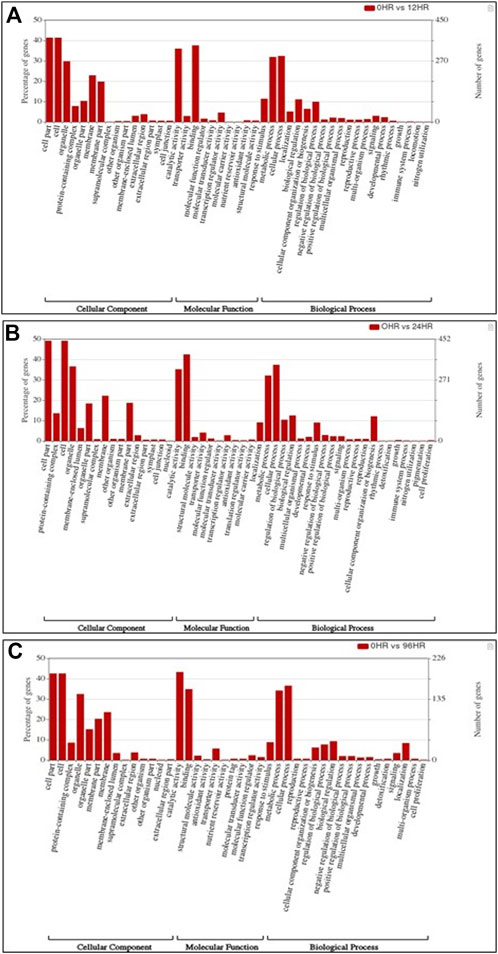
FIGURE 4. Bar graph depicting the number of upregulated DEGs belonging to different gene ontology (GO) categories at (A) 12 hpCi (B) 24 hpCi and (C) 96 hpCi in comparison to control (0hpCi) plants.

FIGURE 5. Heatmap displaying the change in expression pattern of genes in tomato plant at (A) 12 hpCi (B) 24 hpCi and (C) 96 hpCi in comparison to control (0hpCi) plants (green to red to black marks the increase in the expression of genes).
DEGs expressed in tomato at 24 hpCi in comparison to control plants were 22,914 and significantly expressed 893 DEGs with fold change −2 to +2 and p < 0.05 (Figure 1B). Out of 893 DEGs, 26 DEGs were expressed exclusively in control plant (0 h), 7 DEGs at 24 hpCi and 860 DEGs were commonly expressed at 0 h and 12 hpCi (Figure 2B; Supplementary Table S6). The DEGs were categorized depending on their biological function by using KEGG pathways enrichment analysis. The results revealed that most of DEGs belong to metabolic pathways (46 DEGs), biosynthesis of secondary metabolites (26 DEGs), signaling system (13 DEGs), ribosomes biosynthesis (11 DEGs) and plant pathogen interaction (9 DEGs) (Figure 3B; Supplementary Table S7). GO analysis of significantly expressed DEGs classified genes into three categories: cellular function, molecular function, and biological processes with 16, 10 and 22 GO terms, respectively (Figure 4B; Supplementary Table S8). DEGs corresponding to metabolic processes, secondary metabolites biosynthesis and signaling pathways upregulated or downregulated at 24 hpCi are depicted in heat map (Figure 5B; Supplementary Table S9).
Analysis of RNA-seq data reveals the 22,258 DEGs at 96hpCi in contrast to control plants and 476 significantly differentially expressed genes filtered with fold change −2 to +2 and p < 0.05 (Figures 1C, 2C; Supplementary Table S10). GO classification and KEGG pathway enrichment analysis reveal the DEGs corresponding to various GO terms and three GO categories: cellular function, molecular function, and biological processes (Figure 3C; Supplementary Table S11). The most of DEGs are related to catalytic activity, binding activity, and response to stimulus in molecular function category; metabolic processes and cellular processes in biological processes category; cell part , cell, organelle and membrane related in cellular component category (Figure 4C; Supplementary Table S12). The DEGs related to metabolic processes, secondary metabolites biosynthesis and signaling pathways upregulated or downregulated at 96 hpCi are presented in heatmap (Figure 5C; Supplementary Table S13).
The enrichment of phytohormone signaling transduction pathways is visualized in Figure 6A. The red box indicates the upregulation of genes and green box marks downregulation of genes, which allows to depict the involvement of hormone signal transduction pathway. In Cg-2 treated plants after 12 h of Cg-2 inoculation the genes JAR1 (Solyc10g011660) and JAZ (Solyc01g005440) participating in JA signal transduction and NPR1 (Solyc07g040690) a key regulator of SA signaling are upregulated in comparison to 0 hpCi. The ETR (Solyc12g011330) & BKI1 (Solyc04g011520) are upregulated and CYCD3 (Solyc01g080190) is downregulated at 12 hpCi in comparison to 0 hpCi.
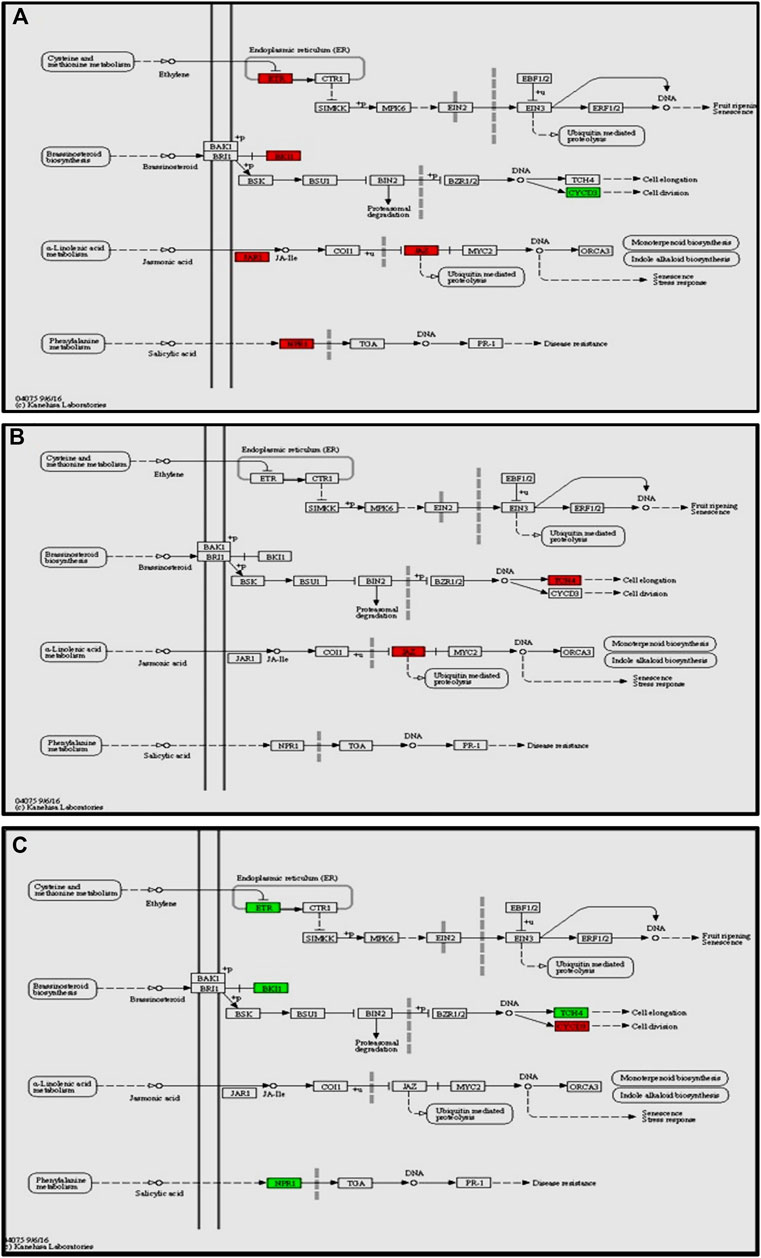
FIGURE 6. Modulation of gene expression in plant hormone signaling pathways (salicylic acid, jasmonic acid, ethylene and brassinosteroid pathways) in tomato plant due to Cg-2 treatment (A) at 12 hpCi vs. 0 hpCi (B) at 24 hpCi vs. 12 hpCi (C) at 96 hpCi vs. 24 hpCi. (Red color represent upregulated genes and green color represents downregulated genes).
Later at 24 hpCi, in jasmonic acid pathway the JAR1 (Solyc10g011660) gene retained the same expression as at 12 hpCi and JAZ (Solyc01g005440) is upregulated. The BKI1 (Solyc04g011520) of brassiniosteroid pathways retained same level as at 12 hpCi whereas TCH4 is upregulated at 24 hpCi (Figure 6B). The NPR1 (Solyc07g040690), ETR (Solyc12g011330) and BKI1 (Solyc04g011520) are downregulated at 96 hpCi in comparison to 24 hpCi (Figure 6C).
The transcriptome analysis reveals that phenylalanine ammonia-lyase (PAL) (Solyc09g007920), cinnamic acid 4-hydroxylase (C4H) (Solyc12g011330) and 4-coumarate-CoA ligase (4CL) (Solyc05g047530) genes of phenylpropanoid biosynthesis pathway were significantly up-regulated at 12 hpCi (Figure 7A). The key genes of lignin formation such as p-coumarate 3-hydroxylase (C3H) (Solyc01g096670), cinnamoyl-CoA reductase (CCR) (Solyc08g076790) and (POX) (Solyc02g079500) were also significantly elevated in tomato plants at 12 hpCi.
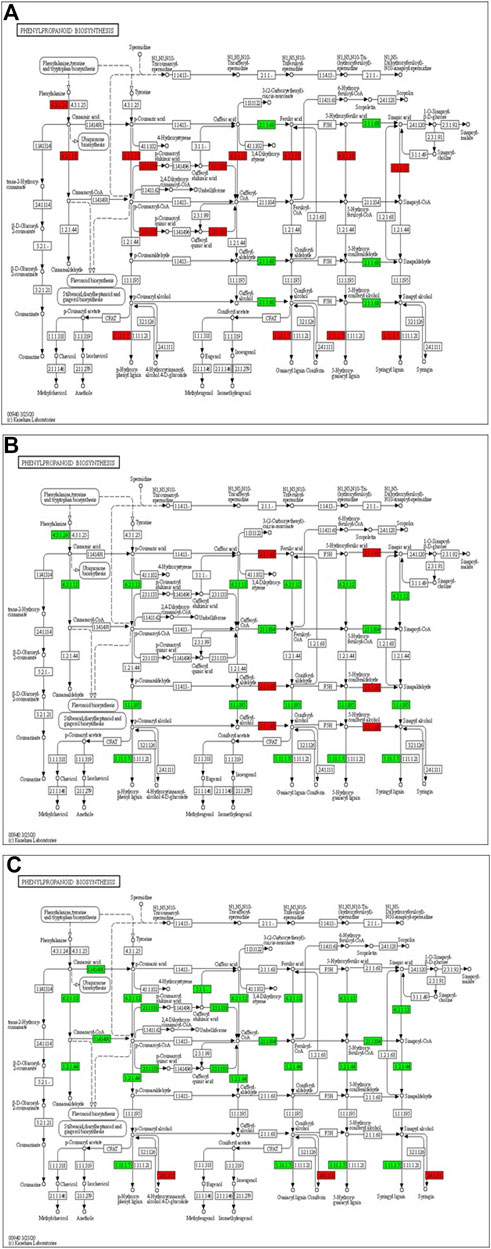
FIGURE 7. Modulation of gene expression in phenylpropanoid biosynthesis in tomato plants due to Cg-2 treatment (A) at 12 hpCi vs. 0 hpCi (B) at 24 hpCi vs. 12 hpCi (C) at 96 hpCi vs. 24 hpCi. (Red color represent upregulated genes and green color represents downregulated genes).
Later, the phenylalanine ammonia-lyase (PAL) (Solyc09g007920), cinnamic acid 4-hydroxylase (C4H) (Solyc12g011330), 4-coumarate-CoA ligase (4CL) (Solyc05g047530), p-coumarate 3-hydroxylase (C3H) (Solyc01g096670) and cinnamoyl-CoA reductase (CCR) (Solyc08g076790) genes of phenylpropanoid biosynthesis pathway were significantly down-regulated at 24 hpCi in comparison to 12 hpCi (Figure 7B). The downstream enzyme in lignin formation pathway coniferyl-alcohol glucosyltransferase is the only gene which is upregulated at 96 hpCi in comparison to 24 hpCi, otherwise most of the genes are down regulated at late hours (Figure 7C).
The expression level of genes related to plant defence pathways was calculated by qRT-PCR using 2−ΔΔCt method to validate transcriptomics data. The genes related to various defense pathways such as WRKY17, JAZ and ERF were upregulated maximum at 12 h and 24 h, whereas SAM showed increasing trend from 12 h (6 folds) to 21 folds at 96 h. The MYC, ASC4 and CHS1 showed maximum expression at 12 h post Cg treatment. The gene MPK3 depicted decreasing trends from 12 h (15 folds) to 96 h (6 folds). The ETR4 expressed maximum (6 folds) at 12 h and decreased to 4 folds at 24 h and only 2 folds at 96 h. The PYL gene related to abscisic acid pathway expressed at late time points, i.e., 96 h (15 folds) (Figure 8). The expression pattern of these genes by qRT-PCR was in correlation with that observed in transcriptomic data.
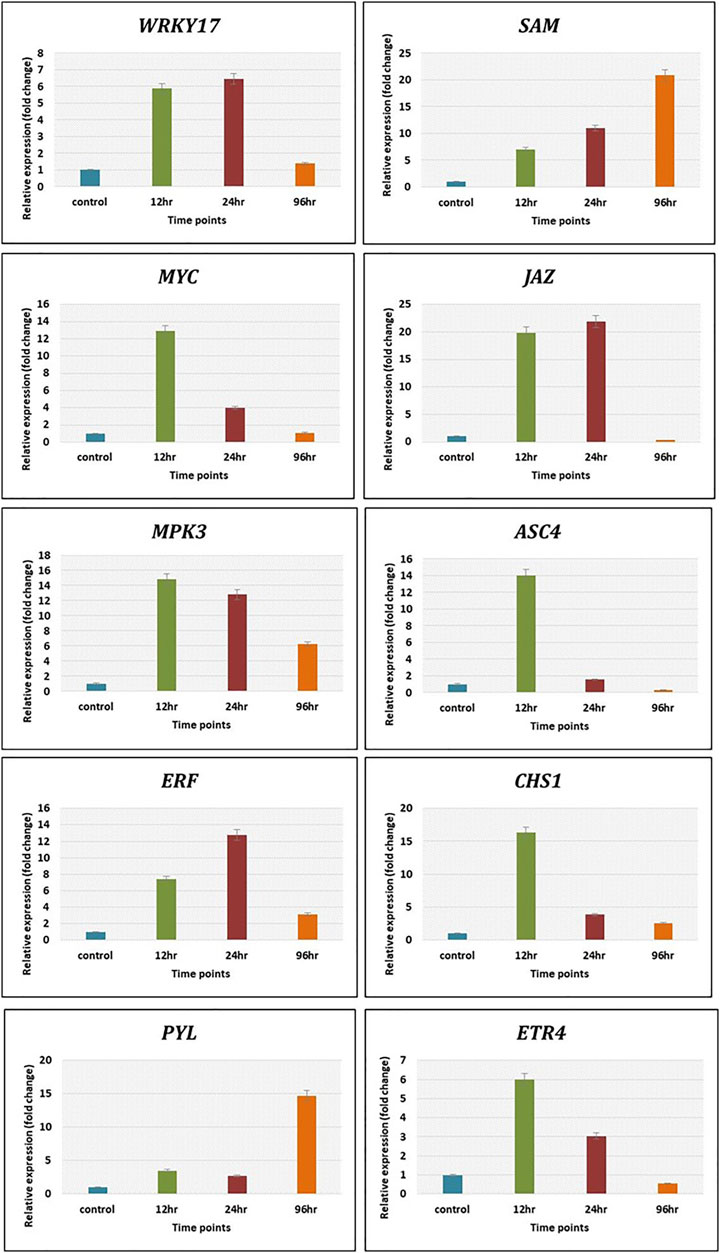
FIGURE 8. The validation of expression of selected genes by qRT-PCR showed significant difference in their expression at different time intervals. Error bars shows ±SD among the biological replicates.
The hormone signaling pathways specifically related to activation of defense in plants such as jasmonic acid, salicylic acid and ethylene pathway are very crucial for systemic resistance induced in plants either through SAR or ISR. SAR is triggered in plants by plant pathogen infection through salicylic acidmediated signaling which enhances the resistance of plant towards secondary infections, whereas ISR is activated by PGPRs or beneficial fungus such as Trichoderma spp. through jasmonic acid and ethylene signaling which primes the plant to increase its resistance against pathogen infection (Alfiky and Weisskopf, 2021; Singh et al., 2021). The microarray study in Arabidopsis by priming plant through Trichoderma hamatum T382 against Botrytis cinerea B05-10 observed the similarity between ISR-prime and systemic acquired resistance SAR (Mathys et al., 2012). Another study, on induced defense cucumber by Trichoderma asperellum treatment revealed the involvement of jasmonic acid and ethylene signaling pathway (Shoresh et al., 2005).
In this study, we focused on the pathways to draw holistic picture of the induced defense mechanism of C. globosum. The ETR (Solyc12g011330) gene of ET signal transduction which negatively regulates ET signaling is upregulated at 12 hpCi in comparison to 0 hpCi. It states the absence of role of ET signaling pathway at early stage of Cg-2 treatment in tomato plant. The absence of participation of brassinosteroid pathway is marked by downregulation of CYCD3 (Solyc01g080190) and upregulation of BKI1 (Solyc04g011520), negative regulator of brassinosteriod signaling at 12 hpCi. At 24 hpCi, initial genes of hormone signaling pathways retain the same expression as at 12 hpCi. Thegenes downstream in the jasmonic acid signaling pathway such as JAZ (Solyc01g005440) and TCH4 of brassiniosteroid pathways are upregulated at 24 hpCi. It demonstrates the active role of jasmonic acid signaling in defense signal progression for induction of defense mechanism in the plant. Moreover, it marks the sequential expression and activation of hormone signaling pathways on a temporal basis in biocontrol treated plants. At the same time at 24 hpCi, the salicylic acid pathway and ethylene pathway gene does not mark any change in expression as compared to 12 hpCi. It reveals no advancement in ET and SA signaling at 24 hpCi as campred to 12 hpCi. The comparative gene expression analysis at late time points, i.e., 96 hpCi over 24 hpCi statesthe downregulation of NPR1 (Solyc07g040690), a key regulator of SA signaling, ETR (Solyc12g011330) gene of ET signal transduction, BKI1 (Solyc04g011520) of brassiniosteroid pathway. It depicts that signalling is conveyed by salicylic acid, brassiniosteroid and ethylene hormone signaling pathways at initial time points and those signals get low at late hours, i.e., 96 hpCi. However, no change in expression is observed in the jasmonic acid pathway at 96 hpCi, it marks theactivate involvement of JA signaling pathway for defense signaling in Cg-2 treated plants (Segarra et al., 2007). Overall, all the three major defense phytohormone (JA, ET and SA) are involved in defense signaling in Cg-2 induce systemic defense. The JA is activated at initial stage and remain active throughout, whereas ET and SA activation follows JA pathway and both are down regulated in late stage. Similarly, the transcriptomic and proteomic study of T. longibrachiatum H9 treated cucumber plant demonstrated that the activation of defense by signaling pathways associated with the phytohormones JA/ET and SA, which contradicts the standard definitions of ISR and SAR (Yuan et al., 2019). The phenylpropanoid pathway is important for reduction of antimicrobial substances which provide protection to plant from pathogens (Yadav et al., 2020). The temporal expression of genes belonging to these pathways is important to know the sequential activation of the pathways. The key genes of lignin formation such as p-coumarate 3-hydroxylase (C3H) (Solyc01g096670) and cinnamoyl-CoA reductase (CCR) (Solyc08g076790) were also significantly elevated in tomato plants at 12 hpCi. The peroxidase (POX) (Solyc02g079500) which is responsible for lignin polymerization is significantly upregulated by biocontrol treated plants at 12 hpCi (Singh et al., 2021). The lignin formation is important to restrict the subsequent infection by A. solani in biocontrol treated plant. The caffeate methyl transferase or S-adenosyl -L-methionone (Solyc03g080180) gene playing role in lignin formation both for structural development and defense response is up regulated at 24 hpCi as compared to 12 hpCi (Khan et al., 2022).
The temporal transcriptomic data of tomato plants treated with C. globosum elucidated that there is activation of JA hormone signaling pathways in sequential manner from 0 h to 24 h after treatment with Cg-2 and continue to express. The NPR1, the key regulator of SAR is activated at 12 h and decrease in expression in later stages. The absence of participation of brassinosteroid pathway due to upregulation of BAKI, negative regulator of brassinosteriod signaling at 12 hpCi. The sequential expression and activation of hormone signaling pathways of ISR and SAR on a temporal basis marks interaction between the defence signalling pathways.
The datasets presented in this study can be found in online repositories. The names of the repository/repositories and accession number(s) can be found in the article/Supplementary Material.
JS, RA, BB, MS, and ZH were involved in the conceptualization of the project, study design, critical inputs, and finalization of the manuscript. JS was involved in the wet lab experiments. JS, KD, JY, and BM were involved in the bio-informatics analyses and data compilation. JS, BB, and RA have drafted the manuscript. BB, MS, and RA edited the manuscript. All authors have read and approved the final manuscript.
JS is grateful to the PG School and Director, ICAR-Indian Agricultural Research Institute, New Delhi, India for providing the fellowship and the financial assistance to conduct the experiment. All authors acknowledge the support from the Head of the Division of Plant Pathology, ICAR-IARI, New Delhi, for providing the necessary facilities. JS and RA are also grateful to NAHEP-CAAST on “Genomics assisted crop improvement and management” for financial assistance (project code: 71-01).
The authors declare that the research was conducted in the absence of any commercial or financial relationships that could be construed as a potential conflict of interest.
The reviewer DKS declared a past co-authorship with the authors JS and RA to the handling editor.
All claims expressed in this article are solely those of the authors and do not necessarily represent those of their affiliated organizations, or those of the publisher, the editors and the reviewers. Any product that may be evaluated in this article, or claim that may be made by its manufacturer, is not guaranteed or endorsed by the publisher.
The Supplementary Material for this article can be found online at: https://www.frontiersin.org/articles/10.3389/fgene.2022.1048578/full#supplementary-material
SUPPLEMENTARY FIGURE S1 | (A) Chaetomium globosum culture on PDA media (B) Mass multiplication of Cg on sorghum grains (C) spore suspension of Cg (D) Drenching of spore suspension at 3–4 leaf stage of tomato plants.
SUPPLEMENTARY FIGURE S2 | Density plot showing the distribution of RNA seq read counts (FPKM) of Cg-2 treated plant at 12 hpCi (green area) and untreated (red area) plants.
SUPPLEMENTARY FIGURE S3 | DESeq2 dispersion plot generated for Cg-2 treated plants at 12 hpCi (orange) and untreated plants (green).
SUPPLEMENTARY FIGURE S4 | Density plot showing the distribution of RNA seq read counts (FPKM) of Cg-2 treated plant at 24 hpCi (green area) and untreated (red area) plants.
SUPPLEMENTARY FIGURE S5 | DESeq2 dispersion plot generated for Cg-2 treated plants at 24 hpCi (orange) and untreated plants (green).
SUPPLEMENTARY FIGURE S6 | Density plot showing the distribution of RNA seq read counts (FPKM) of Cg-2 treated plant at 96 hpCi (green area) and untreated (red area) plants.
SUPPLEMENTARY FIGURE S7 | DESeq2 dispersion plot generated for Cg-2 treated plants at 96 hpCi (orange) and untreated plants (green).
SUPPLEMENTARY TABLE S2 | The DEGs upregulated and downregulated in plants in response to Cg-2 treatment at 12 hpCi.
SUPPLEMENTARY TABLE S3 | The enriched KEGG pathways activated in plants by Cg-2 treatment at 12 hpCi.
SUPPLEMENTARY TABLE S4 | Distribution of DEGs into different categories of Gene Ontology (GO) in plants in response to Cg-2 treatment at 12 hpCi.
SUPPLEMENTARY TABLE S5 | The top 40 DEGs upregulated in tomato plant in response to Cg-2 treatment at 12 hpCi.
SUPPLEMENTARY TABLE S6 | The DEGs upregulated and downregulated in plants in response to Cg-2 treatment at 24 hpCi.
SUPPLEMENTARY TABLE S7 | The enriched KEGG pathways in activated in plants by Cg-2 treatment at 24 hpCi.
SUPPLEMENTARY TABLE S8 | Distribution of DEGs into different categories of Gene Ontology (GO) in plants in response to Cg-2 treatment at 24 hpCi.
SUPPLEMENTARY TABLE S9 | The top 40 DEGs upregulated in tomato plant in response to Cg-2 treatment at 24 hpCi.
SUPPLEMENTARY TABLE S10 | The DEGs upregulated and downregulated in plants in response to Cg-2 Cg-2 treatment at 96 hpCi.
SUPPLEMENTARY TABLE S11 | The enriched KEGG pathways activated in plants by Cg-2 treatment at 96 hpCi.
SUPPLEMENTARY TABLE S12 | Distribution of DEGs into different categories of Gene Ontology (GO) in plants in response to Cg-2 treatment at 96 hpCi.
SUPPLEMENTARY TABLE S13 | The top 40 DEGs upregulated in tomato plant in response to Cg-2 treatment at 96 hpCi.
Aggarwal, R. (2015). Chaetomium globosum: A potential biocontrol agent and its mechanism of action. Indian Phytopathol. 68 (1), 8–24.
Aggarwal, R., Gupta, S., Singh, V. B., and Sharma, S. (2011). Microbial detoxification of pathotoxin produced by spot blotch pathogen Bipolaris sorokiniana infecting wheat. J. Plant Biochem. Biotechnol. 20, 66–73. doi:10.1007/s13562-010-0027-0
Aggarwal, R., Kharbikar, L. L., Sharma, S., Gupta, S., and Yadav, A. (2013). Phylogenetic relationships of Chaetomium isolates based on the internal transcribed spacer region of the rRNA gene cluster. Afr. J. Biotechnol. 12 (9), 914–20. doi:10.5897/ajb12.2633
Aggarwal, R., Tewari, A. K., Srivastava, K. D., and Singh, D. V. (2004). Role of antibiosis in the biological control of spot blotch (Cochliobolus sativus) of wheat by Chaetomium globosum. Mycopathologia 157 (4), 369–377. PMid: 15281398. doi:10.1023/b:myco.0000030446.86370.14
Alfiky, A., and Weisskopf, L. (2021). Deciphering Trichoderma–plant–pathogen interactions for better development of biocontrol applications. J. Fungi 7 (1), 61. doi:10.3390/jof7010061
Conesa, A., Götz, S., García-Gómez, J. M., Terol, J., Talón, M., and Robles, M. (2005). Blast2GO: A universal tool for annotation, visualization, and analysis in functional genomics research. Bioinformatics 21, 3674–3676. doi:10.1093/bioinformatics/bti610
Darshan, K., Aggarwal, R., Bashyal, B. M., and Mohan, M. H. (2021). Deciphering the network of interconnected pathways of Chaetomium globosum antagonistic related genes against Bipolaris sorokiniana using RNA seq approach. J. Biol. Control 34 (4), 258–269. doi:10.18311/jbc/2020/26736
Darshan, K., Aggarwal, R., Bashyal, B. M., Singh, J., Shanmugam, V., and Gurjar, M. S., (2020). Transcriptome profiling provides insights into potential antagonistic mechanisms involved in Chaetomium globosum against Bipolaris sorokiniana. Front. Microbiol. 11, 578115. doi:10.3389/fmicb.2020.578115
Domsch, K. H., Gams, W., and Anderson, T. H. (2007). Compendium of soil fungi. 2nd ed. London, UK: Academic Press.
Fayyadh, M. A., and Yousif, E. Q. (November, 2019). Biological control of tomato leaf spot disease caused by Alternaria alternata using Chaetomium globosum and some other saprophytic fungi. In IOP Conf. Ser, Earth Environ. Sci (Vol. 388, No.1, p. 012017). Kerbala City, Iraq, IOP Publishing.doi:10.1088/1755-1315/388/1/012017
Goff, L., Trapnell, C., and Kelley, D. (2012). CummeRbund: Analysis, exploration, manipulation, and visualization of Cufflinks high-throughput sequencing data. R. package version, 2. 6.1. doi:10.18129/B9.bioc.cummeRbund
Gupta, S. K., Sharma, M., and Mukherjee, S. (2022). Buckeye rot of tomato in India: Present status, challenges, and future research perspectives. Plant Dis. 106 (4), 1085–1095. doi:10.1094/PDIS-04-21-0861-FE
Istifadah, N., and McGee, P. A. (2006). Endophytic Chaetomium globosum reduces development of tan spot in wheat caused by Pyrenophora tritici-repentis. Austral. Plant Pathol. 35, 411. doi:10.1071/AP06038
Jiang, C., Song, J., Zhang, J., and Yang, Q. (2017). Identification and characterization of the major antifungal substance against Fusarium Sporotrichioides from Chaetomium globosum. World J. Microbiol. Biotechnol. 33, 108. doi:10.1007/s11274-017-2274-x
Khan, P., Tong, L., Khan, S., Zhang, C., and Wang, W. (2022). Lignin: A defensive shield halting the environmental stresses – a review. Appl. Ecol. Environ. Res. 20, 1991–2015. doi:10.15666/aeer/2003_19912015
Li, B., and Dewey, C. N. (2011). Rsem: Accurate transcript quantification from RNA-seq data with or without a reference genome. BMC Bioinformatics 12, 323. doi:10.1186/1471-2105-12-323
Li, W., Yang, X., Yang, Y., Duang, R., Chen, G., Li, X., et al. (2016). Anti-phytopathogen, multi-target acetylcholinesterase inhibitory and antioxidant activities of metabolites from endophytic Chaetomium globosum. Natur. Prod. Res. 30 (22), 2616–2619.
Madbouly, A. K., Abdel-Aziz, M. S., and Abdel-Wahhab, M. A. (2017). Biosynthesis of nanosilver using Chaetomium globosum and its application to control Fusarium wilt of tomato in the greenhouse. IET nanobiotechnol. 11 (6), 702–708. doi:10.1049/iet-nbt.2016.0213
Mathys, J., De Cremer, K., Timmermans, P., Van Kerckhove, S., Lievens, B., Vanhaecke, M., et al. (2012). Genome-wide characterization of ISR induced in Arabidopsis thaliana by Trichoderma hamatum T382 against Botrytis cinerea infection. Front. Plant Sci. 3, 108. PMID: 22661981; PMCID: PMC3362084. doi:10.3389/fpls.2012.00108
Meyer, M., and Kircher, M. (2010). Illumina sequencing library preparation for highly multiplexed target capture and sequencing. Cold Spring Harb. Protoc. 2010 (6), pdb.prot5448. doi:10.1101/pdb.prot5448
Moya, P., Pedemonte, D., Amengual, S., Franco, M. E., and Sisterna, M. N. (2016). Antagonism and modes of action of Chaetomium globosum species group, potential biocontrol agent of barley foliar diseases. Bol. Soc. Argent. Bot. 51, 569–578. doi:10.31055/1851.2372.v51.n4.16334
Nagendran, K., Venkataravanappa, V., Chauhan, N. S., Kodandaram, M. H., Rai, A. B., and Singh, B., (2019). Viral diseases: A threat for tomato cultivation in indo-gangetic eastern plains of India. J. Plant Pathol. 101, 15–22. doi:10.1007/s42161-018-0124-9
Niranjana, S. R., Lalitha, S., and Hariprasad, P. (2009). Mass multiplication and formulations of biocontrol agents against Fusarium wilt of pigeonpea through seed treatment. Inter. J. Pest Manag. 55, 317–324. doi:10.1080/0967087090291914
Ogata, H., Goto, S., Sato, K., Fujibuchi, W., Bono, H., and Kanehisa, M. (1999). Kegg: Kyoto encyclopedia of genes and genomes. Nucleic Acids Res. 27, 29–34. doi:10.1093/nar/27.1.29
Pan, F., Liu, Z. Q., Chen, Q., Xu, Y. W., Hou, K., and Wu, W. (2016). Endophytic fungus strain 28 isolated from Houttuynia cordata possesses wide-spectrum antifungal activity. Brazilian J. Microbiol. 47, 480–488.
Panno, S., Davino, S., Caruso, A. G., Bertacca, S., Crnogorac, A., and Mandić, A., (2021). A review of the most common and economically important diseases that undermine the cultivation of tomato crop in the mediterranean basin. Agronomy (Basel). 11 (11), 2188. doi:10.3390/agronomy11112188
Rotenberg, D., Thompson, T. S., German, T. L., and Willis, D. K. (2006). Methods for effective real-time RT-PCR analysis of virus-induced gene silencing. J. Virol. Methods 138, 49–59. doi:10.1016/j.jviromet.2006.07.017
Segarra, G., Casanova, E., Bellido, D., Odena, M. A., Oliveira, E., and Trillas, I. (2007). Proteome, salicylic acid, and jasmonic acid changes in cucumber plants inoculated with Trichoderma asperellum strain T34. Proteomics 21, 3943–3952. doi:10.1002/pmic.200700173
Shanthiyaa, V., Saravanakumar, D., Rajendran, L., Karthikeyan, G., Prabakar, K., and Raguchander, T. (2013). Use of Chaetomium globosum for biocontrol of potato late blight disease. Crop Prot. 52, 33–38. doi:10.1016/j.cropro.2013.05.006
Shoresh, M., Yedidia, I., Chet, I., Suzuki, S., Kakuta, M., and Ishida, T. (2005). Involvement of jasmonic acid/ethylene signaling pathway in the systemic resistance induced in cucumber by Trichoderma asperellum T203. Phytopath. Bioinformatics 9531 (1), 761183–841190. doi:10.1093/bioinformatics/btu780
Suzuki, S., Kakuta, M., Ishida, T., and Akiyama, Y. 2015. Faster sequence homology searches by clustering subsequences. Bioinformatics. 31: 1183–1190. doi:10.1093/bioinformatics/btu780
Singh, J., Aggarwal, R., Bashyal, B. M., Darshan, K., Parmar, P., and Saharan, M. S., (2021). Transcriptome Reprogramming of Tomato Orchestrate the Hormone Signaling Network of Systemic Resistance Induced by Chaetomium globosum. Front. Plant Sci. 12, 721193. doi:10.3389/fpls.2021.721193
Wang, X., Zenda, T., Liu, S., Liu, G., Jin, H., Dai, L., et al. (2019). Comparative proteomics and physiological analyses reveal important maize filling-kernel drought-responsive genes and metabolic pathways. Inter. J. Mol. Sci. 20 (15), 3743.
Yadav, V., Wang, Z., Wei, C., Amo, A., Ahmed, B., and Yang, X., (2020). Phenylpropanoid pathway engineering: An emerging approach towards plant defense. Pathogens 9 (4), 312. doi:10.3390/pathogens9040312
Yuan, M., Huang, Y., Ge, W., Jia, Z., Song, S., and Zhang, L., (2019). Involvement of jasmonic acid, ethylene and salicylic acid signaling pathways behind the systemic resistance induced by Trichoderma longibrachiatum H9 in cucumber. BMC Genomics 20 (1), 144. doi:10.1186/s12864-019-5513-8
Cg-2 Virulent isolate Chaetomium globosum
hpCi hours post Chaetomium globosum inoculation
JA Jasmonic acid
NPR1 Nonexpresser of PR genes1
ISR Induced Systemic Resistance
SAR Systemic Acquired Resistance
qRT-PCR Quantitative Real Time PCR
PDA Potato Dextrose Agar
RT Room temperature
rpm Revolution per minute
RSEM RNA-seq by expectation maximization
FPKM Fragments per kilobase of exon per million mapped reads
DEGs Differentially expressed genes
KEGG Kyoto Encyclopedia of Genes and Genomes
SlEF Solanum lycopersicum Elongation factor
PGPRs Plant growth promoting rhizobacterias
ET Ethylene
SA Salicylic acid
BKI1 BRI1 kinase inhibitor 1
MAPK Mitogen-activated protein kinase
PAL Phenylalanine Ammonia-lyase
C4H Cinnamic acid 4-hydroxylase
SAM S-Adenosyl methionine
MYC MYC core transcription factors of Jasmonate signaling
JAZ JAsmonate-ZIM domain
MPK3 Mitogen-activated protein kinase 3
ACS4 Aminocyclopropane Carboxylic acid Synthase 4
ERF Ethylene-Responsive Factors
CHS1 CHalcone synthase 1
PYL PYrobactin Resistance-Like (regulatory component of ABA receptors)
ETR4 EThylene Receptor 4
4CL 4-coumarate-CoA ligase
C3H p-coumarate 3-hydroxylase
CCR Cinnamoyl-CoA reductase
WRKY17 WRKY transcription factor
POX Peroxidase
BAKI BRI1 Associated receptor Kinase 1
ds cDNA Double stranded cDNA
Keywords: tomato, Chaetomium globosum, biocontrol agent, Alternaria solani, defense
Citation: Singh J, Aggarwal R, Bashyal BM, Darshan K, Meena BR, Yadav J, Saharan MS and Hussain Z (2022) Temporal transcriptome of tomato elucidates the signaling pathways of induced systemic resistance and systemic acquired resistance activated by Chaetomium globosum. Front. Genet. 13:1048578. doi: 10.3389/fgene.2022.1048578
Received: 19 September 2022; Accepted: 31 October 2022;
Published: 18 November 2022.
Edited by:
Sunil S. Gangurde, University of Georgia, United StatesReviewed by:
Dinesh Kumar Saini, South Dakota State University, United StatesCopyright © 2022 Singh, Aggarwal, Bashyal, Darshan, Meena, Yadav, Saharan and Hussain. This is an open-access article distributed under the terms of the Creative Commons Attribution License (CC BY). The use, distribution or reproduction in other forums is permitted, provided the original author(s) and the copyright owner(s) are credited and that the original publication in this journal is cited, in accordance with accepted academic practice. No use, distribution or reproduction is permitted which does not comply with these terms.
*Correspondence: Rashmi Aggarwal, YWdnYXJ3YWw4Nzg5QGdtYWlsLmNvbQ==
Disclaimer: All claims expressed in this article are solely those of the authors and do not necessarily represent those of their affiliated organizations, or those of the publisher, the editors and the reviewers. Any product that may be evaluated in this article or claim that may be made by its manufacturer is not guaranteed or endorsed by the publisher.
Research integrity at Frontiers
Learn more about the work of our research integrity team to safeguard the quality of each article we publish.