 Iftah Peretz
 Martin Kupiec1*
 Roded Sharan
- 1 The Shmunis School of Biomedicine and Cancer Research, Tel Aviv University, Tel Aviv, Israel
- 2 Blavatnik School of Computer Science, Tel Aviv University, Tel Aviv, Israel
The natural ends of the linear eukaryotic chromosomes are protected by telomeres, which also play an important role in aging and cancer development. Telomere length varies between species, but it is strictly controlled in all organisms. The process of Telomere Length Maintenance (TLM) involves many pathways, protein complexes and interactions that were first discovered in budding and fission yeast model organisms (Saccharomyces cerevisiae, Schizosaccharomyces pombe). In particular, large-scale systematic genetic screens in budding yeast uncovered a network of
1 Introduction
In most eukaryotes, the chromosomal ends are protected by telomeres, composed of short G-rich repeats and a special set of proteins (Blackburn, 1991). Telomeres play a pivotal role in chromosomal duplication, stability, and dynamics (Zakian, 1995).
Telomeres shrink with replicative age due to the inability of DNA polymerases to synthesize lagging-strand DNA after the removal of RNA primers at the extreme ends of the chromosome (Hayflick, 1965; Harley et al., 1994). This condition, referred to as the “end replication problem”, is solved by the ribonucleoprotein telomerase, which uses its RNA subunit to reverse transcribe telomeric DNA (Greider and Blackburn, 1989). Telomerase is expressed in stem cells, but is barely detected in somatic cells. Continuously growing microorganisms, such as yeasts, constitutively express telomerase and are excellent models to investigate the mechanisms that regulate telomere biology and have uncovered a complex network of factors required to maintain telomere length homeostasis (Wellinger and Zakian, 2012; Harari and Kupiec, 2014; Kupiec, 2014). In budding yeast (S. cerevisiae), telomerase recruitment and activity is mediated by several factors that are required for the elongation of the shortest telomeres in some of the cell cycles (Teixeira et al., 2004).
Large-scale systematic genetic screens in S. cerevisiae, which scored collections of gene-knockouts and hypomorphic alleles, discovered a network of genes that participate in controlling telomere length (Askree et al., 2004; Gatbonton et al., 2006; Ungar et al., 2009; Puddu et al., 2019). These Telomere Length Maintenance (TLM) gene products have a variety of biochemical roles, some of which were not previously identified to be connected with the regulation of telomere size. Whereas mutations in some of these genes lead to shorter telomeres, others cause telomeres to elongate. Thus, each and every one of the
So far, to the extent that we know, no attention has been paid to computationally modeling the TLM network in S. pombe. Thus, the aim of this study is to close this gap and to create a machine learning framework for examining telomere maintenance in fission and budding yeast. Our proposed framework is first validated in S. cerevisiae for detecting telomeric length phenotype. Next, we test it on curated S. pombe TLM data, and pinpoint the most important pathways and protein complexes that make up TLM homeostasis. We follow by investigating the TLM phenotype within the yeast orthologs and suggest the most likely S. pombe genes that are currently unknown to be members of the TLM network in this organism. Last, we perform gene ontology (GO) enrichment analysis for these candidates and reveal that they are significantly enriched for biological processes known to be highly linked with telomere maintenance functions.
2 Materials and methods
2.1 Telomere length data
The data for the S. cerevisiae TLM genes along with their corresponding telomere length category was obtained from Van Leeuwen et al. (2016) and Puddu et al. (2019). For the binary classification of telomere length, the categories were reduced to the following phenotypes: ‘short’ and ‘long’. YIR016W was observed as both normal and ‘very long’, hence we assigned it as ‘long’. The data also included the Decreased Abundance by mRNA Perturbation (DAmP) collection and we treated the two telomere length labels of ‘DAmP Short’ and ‘DAmP Long’ as ‘short’ and ‘long’, respectively.
The S. pombe TLM genes were curated from the Fission Yeast Phenotype Ontology (FYPO) v2011-01-18 (Harris et al., 2013). The following FYPO terms were labeled as having ‘short’ ('FYPO:0002239′, 'FYPO:0006511′, 'FYPO:0003106′, 'FYPO:0003107′) and ‘long’ ('FYPO:0002019′) telomere length phenotypes. Finally, we merged these genes with a list of genes that were found to regulate the homeostasis of telomeres (Liu et al., 2010).
Overall, we obtained 483 and 224 unique TLM genes with corresponding binary telomere length phenotypes for S. cerevisiae and S. pombe, respectively (Supplementary Table S1).
2.2 Genetic interaction data
For each S. cerevisiae TLM gene, raw Genetic Interaction (GI) scores were taken from the pairwise interaction format of the TheCellMap.org repository (Usaj et al., 2017). They were produced by systematic Synthetic Genetic Array (SGA) experiments and scored by comparing the fitness of the double mutant to the corresponding single mutants (Costanzo et al., 2016). We only considered the authors’ lenient threshold, i.e., GIs with p − value < 0.05. In the case of multiple measurements per interaction, the GI score with the lowest p − value was used. The outcome was a score matrix of the TLM genes and 5850 genes sharing at least one GI with one of the TLM genes.
The S. pombe GI data was downloaded from BioGRID v4.4.207 (Oughtred et al., 2021). Unlike the S. cerevisiae data, the interactions only contain a verbal description and not a numerical score, which we mapped into a score of 1 when there was an interaction and 0 otherwise. We used all the data that are marked ‘genetic’ in their ‘Experimental System Type’ field.
2.3 Pathway data
To construct the pathway features, the Kyoto Encyclopedia of Genes and Genomes (KEGG) pathway database release 99.0 (Ogata et al., 1999) was parsed via the BioServices v1.10.1 (Cokelaer et al., 2013) API. Only non-global and non-overview maps were considered (i.e., utilizing pathways that only contain genes and not ones that contain other pathways).
2.4 Protein complex data
For S. cerevisiae, the CYC2008 catalog was used. It contains 408 manually curated heteromeric protein complexes that were confirmed by small-scale experiments from the literature (Pu et al., 2009).
S. pombe complex information was downloaded from PomBase (Harris et al., 2022). It is based on the GO database, for terms that are classified under “macromolecular complex” (GO:0032991) and have fission yeast genes annotated, such that the most specific complex is retained.
2.5 Orthology data
A manually curated ortholog list of fission to budding yeast was retrieved from PomBase (Wood et al., 2012). For cases where there was more than one ortholog per gene, the gene with the maximum score from the Smith-Waterman alignment algorithm (Smith and Waterman, 1981) was selected. This was achieved using the Biopython v1.79 (Cock et al., 2009) pairwise2.align.localds function with the same parameters as in the web BLAST NCBI interface (http://blast.ncbi.nlm.nih.gov), i.e., BLOSUM62 scoring matrix, a gap cost of 11 and an extension cost of 1. The final set contained 3953 orthologous pairs (Supplementary Table S2).
2.6 GO data
In order to process the GO consortium database (Ashburner et al., 2000; Consortium, 2021) the Python package GOATOOLS v1.2.3 (Klopfenstein et al., 2018) was used. For the feature engineering, GO terms from Biological Process (BP) and Cellular Component (CC) categories were filtered to include only genes for which we have prior data (i.e., genes that appear in the S. cerevisiae GI dataset). Broad terms that contain more than 30 genes were excluded from further analysis, as well as terms with less than 3 genes.
2.7 GO enrichment analysis
For the GO enrichment analysis, we used the PANTHER web API (http://pantherdb.org/services/openAPISpec.jsp) with annotation files from March 2022 (GO Ontology database DOI:10.5281/zenodo.6399963 released on 2022-03-22). We employed the ‘Enrichment (Overrepresentation)’ test which computes a p − value using Fisher’s exact test, and the False Discovery Rate (FDR) method was used for multiple hypothesis correction. We limit the enrichment testing to only include biological process terms. In order to avoid broad terms, we restricted the analysis to terms that contain at most 250 genes. The test cutoff was set to an FDR q − value < 0.05.
2.8 Feature generation
We designed four sets of features that span a variety of molecular functions including genetic interactions, pathway maps, biological processes, and protein complexes. We refer to a feature based on the main dataset it was derived from, namely, KEGG, GO BP, CYC2008, and GO CC. A summary of all the feature sets we evaluated for telomere length classification is presented in Table 1.
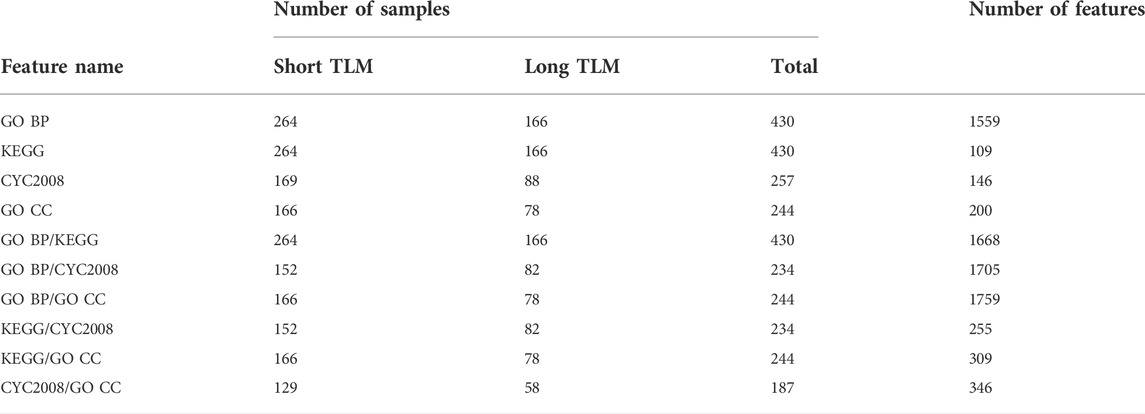
TABLE 1. Overview of the feature sets used to evaluate S. cerevisiae telomere length classification pipelines.
In order to extract the KEGG and GO BP features, we considered for each gene its proportion from the group that has a non-zero GI score with it. For KEGG and GO BP, respectively, this group consists of the genes that make up a pathway and GO term direct gene members, more details are provided in the Supplementary Material. The CYC2008 and GO CC features indicate for each protein complex a gene’s membership in it. When combining a pair of feature sets, it was done by merging on the intersection of genes that are in both sets.
For classifying TLM genes and predicting S. pombe candidates, we defined another feature, namely, propagation to anchor genes. These are genes that act as an endpoint for TLM-related processes as described for S. cerevisiae (Shachar et al., 2008) and that we adapted for S. pombe (Supplementary Table S3). Producing this feature employs a random walk with a restart propagation process as described in (Cowen et al., 2017). Specifically, the following steps were taken:
1) We used the whole genome with Protein-Protein Interaction (PPI) binary scores from BioGRID v4.4.207 as the adjacency matrix (interactions labeled ‘physical’ in their ‘Experimental System Type’ field). We normalized this matrix by W = AD −1, where A is the adjacency matrix and D is the diagonal degree matrix.
2) The starting vector p
0 was set to
3) The resulting feature vector was produced by a computation until convergence of the vector p k = 0.2p 0 + 0.8Wp k−1
2.9 Machine learning models
To evaluate classification performance, we used five standard machine learning models from the Python package SciKit-Learn (version 1.0.2), that have been proposed for obtaining good prediction accuracy in the bioinformatics domain (Olson et al., 2018). We retained the recommended hyperparameters that were set prior to all experimentations as summarized in Table 2.
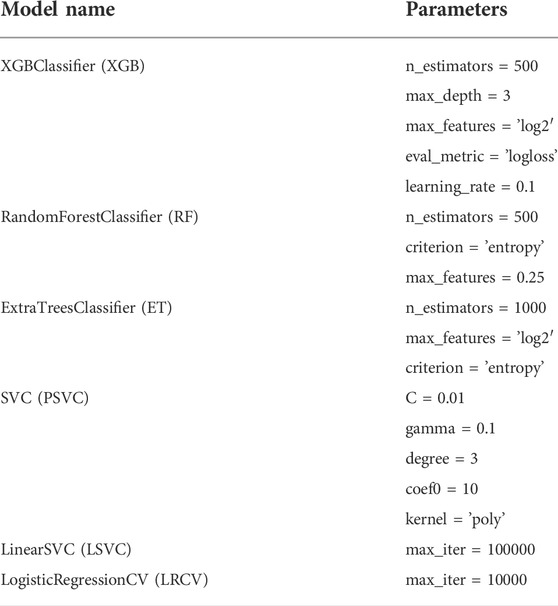
TABLE 2. Machine learning models used, and their parameters. Parameters that are not in the table were set to the default values of the SciKit-Learn (version 1.0.2) package.
This list of models was tweaked to include the Extreme Gradient Boosting Classifier (XGB) from the XGBoost package (v0.9) instead of the Gradient Boosting Classifier and the Logistic Regression was replaced by the Logistic Regression Cross Validation (LRCV) model. In addition, the Linear Support Vector Classifier (LSVC) model was added to have more than one linear model assessed, resulting in six models overall.
2.10 Evaluation setting
Our dataset is imbalanced among the telomere length classes. This leads to models that are overly conservative when predicting the minority classes. To address this issue we performed 5 repeated stratified 10-fold Cross-Validation (CV) experiments. This procedure is followed for each held-out test in a 10-fold CV and the whole process is repeated 5 times, producing different splits and held-out test sets in each repetition, but maintaining the percentage of samples for each class. For all the setups, the models were assessed in each run for the relevant evaluation metrics on the held-out test dataset and the median score (unless stated otherwise) across all experiments is reported.
The evaluation metrics included Matthew’s Correlation Coefficient (MCC) and Area Under the receiver-operating characteristic Curve (AUC) as they are more robust to imbalanced label distribution (He and Garcia, 2009; Chicco and Jurman, 2020). The MCC is calculated as follows:
where TP represents the True Positive; TN, the True Negative; FP, the False Positive; FN, the False Negative. It is the Pearson correlation coefficient between the predicted and true labels. The Receiver-Operating Characteristic curve depicts the true positive rate as a function of the false positive rate. The AUC is a metric for assessing a classifier’s overall performance. The better the classifier is, the closer to one the AUC is.
In order to keep the number of features not greater than the number of samples (Ressom et al., 2008), feature sets that exceeded this threshold were reduced to match the size of the samples in all of the experiments. To this end, a Bernoulli Naive Bayes Classifier was applied during the training phase to determine the importance of each feature based on the observed log probability of features given a class. The top ranking features, up to the number of samples, were selected to be used for testing via SciKit-Learn’s SelectFromModel.
3 Results
3.1 Prediction of telomere length changes following gene knockout
We compiled a comprehensive collection of feature sets for telomere length prediction following gene knockout. First, we focused on the task of predicting shorter-than-normal vs. longer-than-normal length. We assessed each one of the feature sets individually after applying standardization scaling using the StandardScaler functionality from SciKit-Learn.
A heatmap of the metrics’ median results across all test runs for each Machine Learning (ML) model and feature sets is presented (Figure 1A). The results are ordered by the overall median score of a model, across all features. The Random Forest Classifier (RF) achieved the greatest performance across all features in the MCC metric with an overall median score of 0.3 and LRCV had the highest overall median AUC score of 0.69.
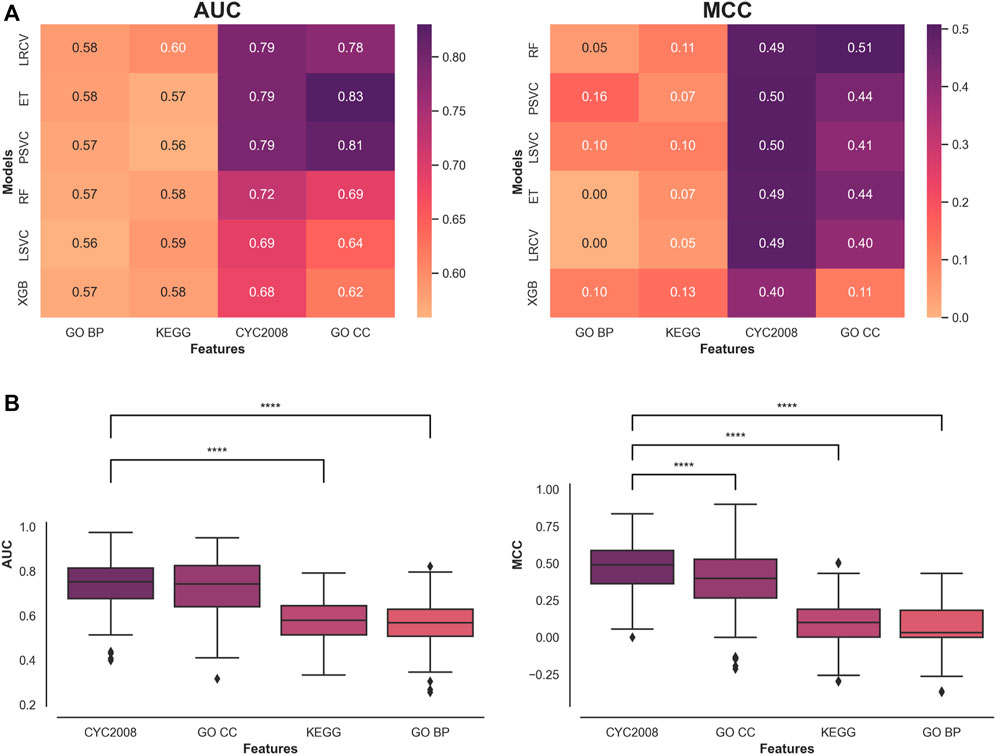
FIGURE 1. Comparative assessment of feature set performance in classifying short and long phenotypes. (A) Median model performance for each feature set. (B) Performance distribution of the features with a Mann-Whitney U test with continuity correction comparing the top feature set with all the rest with the significant comparisons indicated. **** indicates p < 0.0001.
A comparison of the type of features used reveals that protein complex-based features (CYC2008 and GO CC) significantly outperform other features across all classification metrics and ML models in this context (Figure 1B). Comparing the two in each metric shows that CYC2008 has a significantly higher MCC score (0.49 vs. 0.39, p < 0.0001), but achieves similar AUC scores (0.75 vs. 0.74). Therefore, ML models using a single set of protein complex-based features, and in particular, CYC2008, will lead to a better classification of telomere length samples than pathway features.
Next, we moved to examine a mixture of feature sets. We limited the search to pairwise feature space combinations, selecting the top features in the same manner as described above. The results are ordered by the median score per feature combination, across all models (Figure 2A). In both AUC and MCC measures, the highest-performing features across all models are made of the combination of protein complex features (CYC2008) and pathway features (KEGG). The highest overall performing model and feature set were the LRCV with CYC2008 and KEGG features, with a median AUC score of 0.834 and median MCC score of 0.513 across all experiments (Figure 2B). In addition, the top two performing models in both metrics used the CYC2008 and KEGG feature combination, both exceeding the median AUC
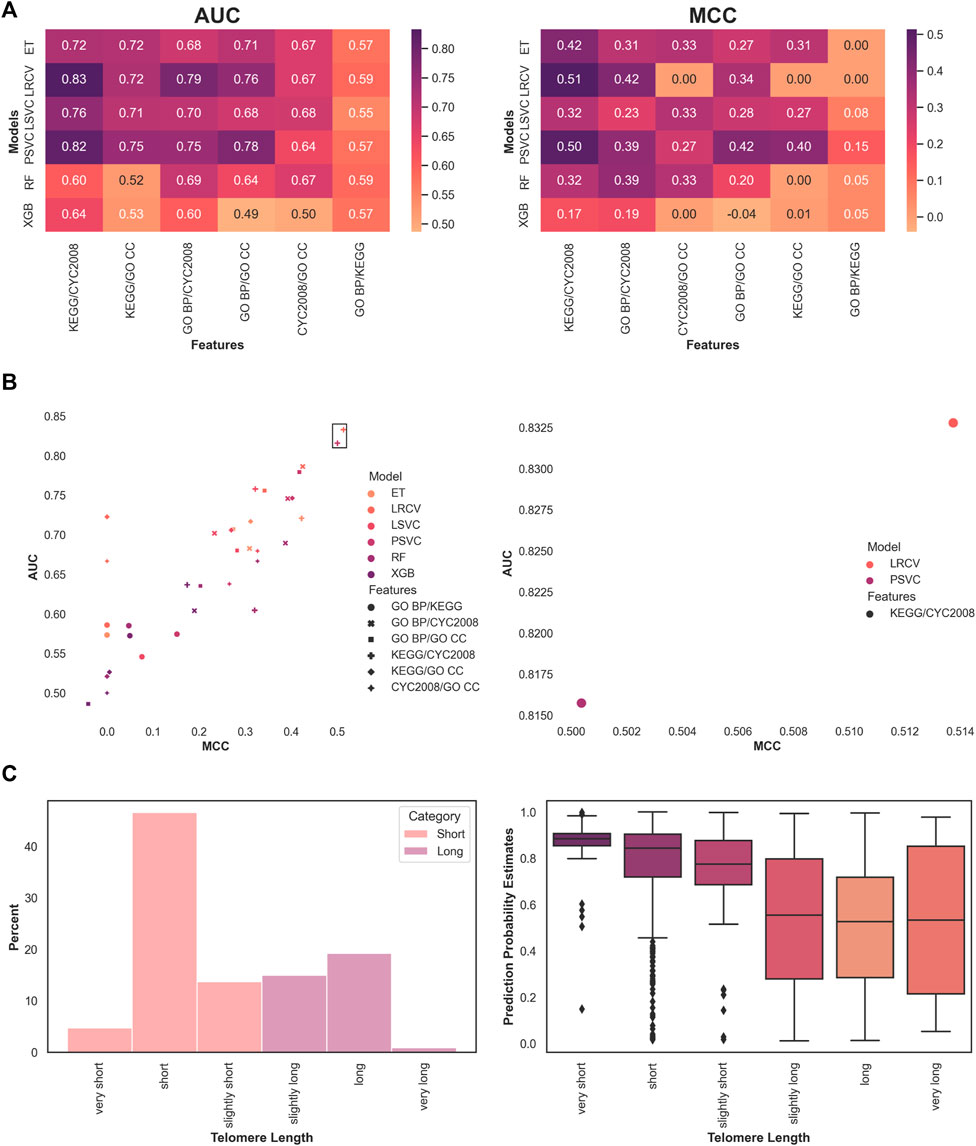
FIGURE 2. Optimal classification of short and long telomere lengths is obtained with pathway and complex-based features using a linear model. (A) Median model performance for each pairwise feature set. (B) Overall best performing model across features. The top two are marked by a frame and enlarged. (C) Showing the phenotype distribution of the 1170 samples analyzed for various lengths in S. cerevisiae using our system, and the probability estimates for each label across all experiments.
Finally, we performed a meta-analysis of the predictions. Instead of the binary categorization to ‘short’ and ‘long’ phenotypes, we checked to see if the classifier’s estimated probabilities for those predictions were higher in more extreme phenotypes. To this end, we looked at the original phenotypes, namely, ‘very short’, ‘short’, ‘slightly short’, ‘slightly long’, ‘long’, and ‘very long’. They were originally (Askree et al., 2004) deemed as such by comparing them to a baseline of wild-type telomere length, measuring in bulk Southern blot. For example, strains of 385–420 telomeric nucleotides were considered ‘long’ when compared to the 350±35 nucleotides of the wild-type, whereas those with longer telomeres were designated ‘very long’. We compared the estimated probabilities that were produced by the model for each such subtype (Figure 2C). When focusing on the larger fraction (about 67%) of phenotypes that were reduced to ‘short’, we observed that severe phenotypes were assigned with higher confidence (median probability of 'very short’ 0.88 vs. 'short’ 0.84, p < 0.0005, and 'short’ vs. 'slightly short’ 0.77, p < 0.0005). This was not the case for the ‘long’ phenotypic length (no significant differences were found between ‘slightly long’, ‘long’, and ‘very long’). One plausible explanation is the relatively small number of samples that were available during training and testing (for example, less than 1% is labeled ‘very long’).
3.2 Application to Schizosaccharomyces pombe
After establishing our classifier’s performance, we wished to generalize it to data from S. pombe, a fungal species whose ancestors separated from S. cerevisiae
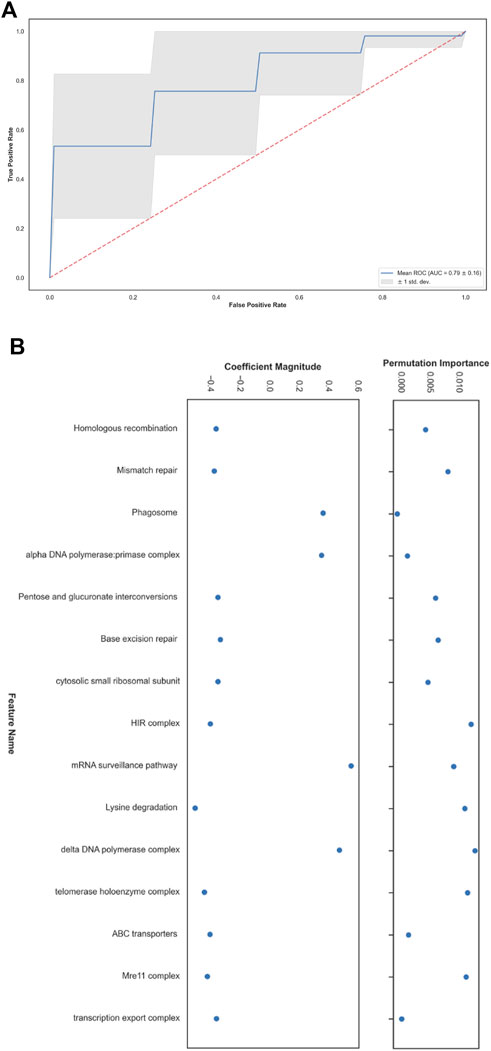
FIGURE 3. Short and long telomere length prediction in Schizosaccharomyces pombe. (A) Receiver operating characteristic (ROC) plot. (B) The top fifteen features with the greatest contribution to the classification according to coefficients learned by the linear model and their permutation importance.
Next, we turned to analyze the feature importance that led to these results (Figure 3B). To accomplish this, we took the fifteen coefficients with the highest mean absolute value that the LRCV model learned across all runs. Using the held-out set in each run, allowed us to detect which characteristics contribute the most to the examined model’s generalization capability by applying the SciKit-Learn’s permutation_importance with n_repeats = 5. The difference between the baseline scoring metric that is used by LRCV (the default accuracy measure, in our case) and the one from permuting the feature column is defined as the permutation importance. To summarize, after running all the experiments, we were left with the top-15 highest mean absolute coefficients that participated in all the runs and their respective mean permutation importance. Having our data scaled in the preprocessing step, allowed us to then look at the odds ratio for each feature in conjunction with its permutation importance score with regards to rest. This way, we could assess the highest influencing features in our system as-is, disregarding interacting terms. Among the features with a relative high permutation score, we find the telomerase, Mre11-Rad50-Xrs2 (MRX) and the HIstone Regulator (HIR) complexes and DNA damage response pathways, aligning with the findings of the S. cerevisiae TLM mechanisms (Askree et al., 2004; Rubinstein et al., 2014). Despite the difference between the data sets of the two organisms where in cerevisiae the majority group is the ‘short’ one, while in pombe the opposite is true, the performance generalized well to the pombe setting.
3.3 Prediction of S. pombe TLM genes from orthologs
Orthologs are the result of speciation events and are likely to be functionally related. In our context, previous research has demonstrated that gene dispensability is conserved for the majority of ortholog genes in budding and fission yeast (Kim et al., 2010). Based on this result, we set to assess if the same holds for TLM genes. According to data we have, out of 3953 orthologs, only 51 genes (1.29%) are TLM genes in both species. However, when focusing on the subset of TLM genes in either species, 9.94% of the genes (51/513) are TLM genes in both yeasts. A closer look into the telomere length phenotype within this subset of shared TLM orthologs demonstrates more robust conservation than the one that has been detailed so far. 60.78% (31/51) of shared TLM genes preserve the phenotype (p < 0.1). Overall, 29.4% (15/51) and 31.37% (16/51) of these orthologous pairs retain the TLM ‘short’ and ‘long’ phenotypes, respectively.
We postulate that there could be more S. pombe TLM genes within the orthologous pairs that are currently unknown to have this role. In order to predict TLM candidates, our prediction system was evaluated against the task of classifying between TLM and non-TLM genes. To this end, the LRCV model remained the same, apart from the additional setting of its class_weight parameter to 'balanced’. The KEGG and CYC2008 feature sets were built in the same manner, but this time with respect to the entire ortholog gene set. In total, we explored five methods for TLM prediction (as also summarized in Table 3):
• Method (1): Predicting a role (TLM/non-TLM) for an S. pombe gene based on its S. cerevisiae ortholog.
• Method (2): Training a predictor on S. cerevisiae data and applying it to S. pombe data.
• Method (3): Training and testing on S. pombe data.
• Method (4): Similar to (3), but utilizing also the S. cerevisiae features of the gene’s ortholog.
• Method (5): Similar to (3), but with the addition of a feature quantifying the proximity of the gene to anchor TLM genes.
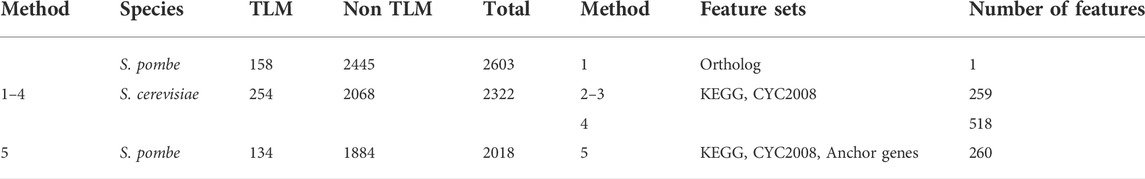
TABLE 3. Overview of datasets used in different methods for classifying TLM and non TLM genes.
The performance of the five predictors is summarized in Table 4. Method (5) performed best; out of the other four methods, method (3) – applying our framework as-is to this new task – dominated the rest in terms of AUC.
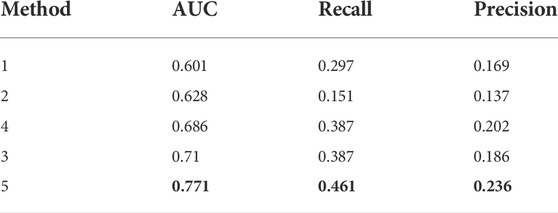
TABLE 4. Evaluation of methods used in classifying TLM and non TLM genes. Rows are sorted in ascending order by AUC performance. The highest scores in each metric are marked in bold.
Next, we aimed to predict new TLM candidates in S. pombe using method (5). To this end, we executed the model in a leave-one-out setting so that we could use the entire dataset for training and make a prediction with respect to each gene in turn. The resulting top-30 predictions that are not known to be TLM genes, along with their S. cerevisiae orthologs, were subjected to GO enrichment analysis (Supplementary Tables S4–S6). The top-10 is presented in their ranked order (Table 5). Homing in on some of the genes shows that they are associated with the Target of Rapamycin (TOR) signaling network (Ungar et al., 2011; Rallis et al., 2017; Lie et al., 2018) a known participant in the regulation of subtelomeric and telomeric regions (Schonbrun et al., 2009; Cohen et al., 2018). Further inspection reveals that 10% of the S. pombe predicted genes are orthologous to known TLM genes in S. cerevisiae. This is reassuring as it is consistent with the prior experimental knowledge that was discussed above. Overall, our candidate TLM genes were significantly enriched (p < 0.001) for core DNA maintenance processes (DNA damage response, DNA repair, and DNA replication), DNA assembly or remodeling functions (chromatin organization, chromosome segregation), and mitotic and meiotic cell cycles (regulation of cell cycle process, regulation of mitotic cell cycle and meiotic cell cycle). Taken together, these enriched terms suggest that there is an association between our candidate genes and telomere maintenance homeostasis.
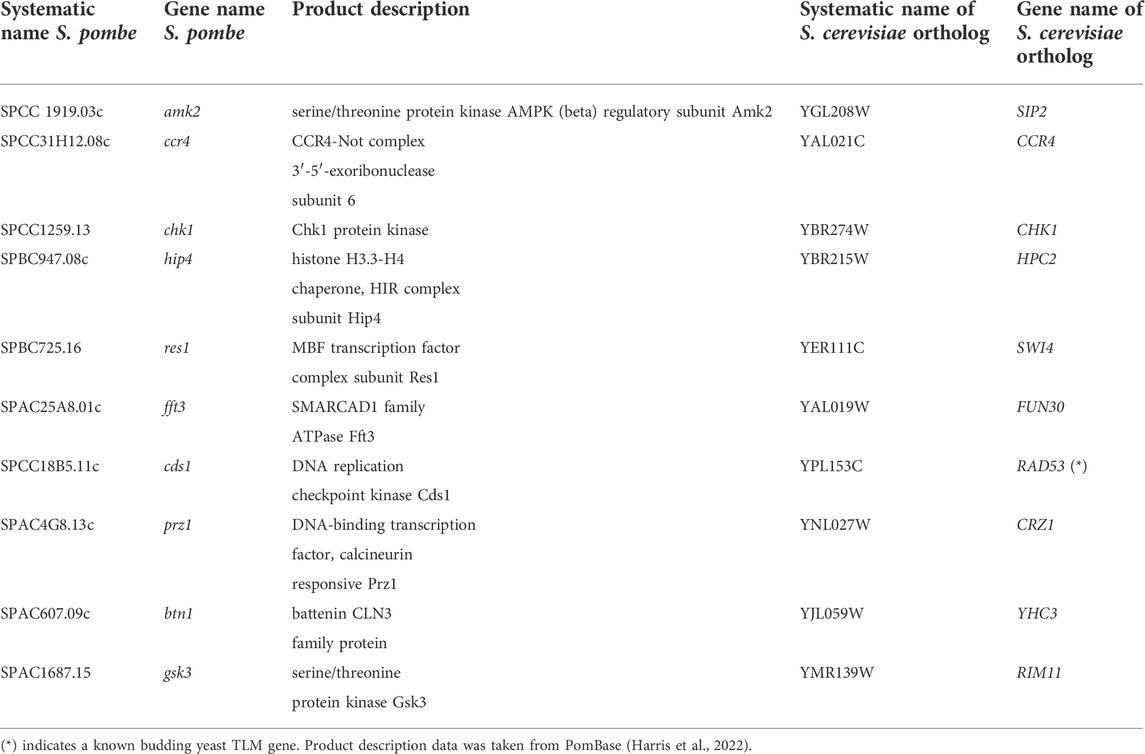
TABLE 5. The top-10 S. pombe TLM predicted genes and their S. cerevisiae orthologs. The rows are sorted in descending order by the model’s estimated probability of the prediction.
4 Conclusion
This study set out to create a general machine learning pipeline for telomere length maintenance analysis in fission and budding yeast. We have identified a set of features along with a simple linear model that can predict the telomere length phenotype under various settings. The framework can also pinpoint explanatory variables leading to its output while utilizing a broad range of data sources, including genetic interaction data, that is being used for the first time in this context, to the best of our knowledge.
The generalizability of these results is subject to certain limitations. For instance, the datasets used to derive the features are incomplete and so is our interpretation of the predictions. Furthermore, the small and imbalanced data, in some of the tasks we investigated, makes it hard to learn the underlying structure of the data.
Although this study focuses on yeast datasets, the suggested system may well have a bearing on human data, such as the UK Biobank (Bycroft et al., 2018) as telomere length is a promising biomarker for age-associated diseases and cancer. Considerably more work will need to be done in order to have high quality data of the S. pombe TLM network, and our predictions are a promising starting point for this investigation.
Data availability statement
The genetic interaction data used for S. cerevisiae contains no version control and was downloaded from https://thecellmap.org/costanzo2016/ on March 2022. For the rest of this work, publicly accessible datasets were examined, and the publication makes note of the relevant versions. All of the data and code used for this study are available at: https://github.com/Iftahp/yeastTLM.
Author contributions
IP wrote the software, curated and processed the data, executed the experiments, and drafted the initial manuscript. All authors contributed to the conception, designed the study, analyzed the results, revised the manuscript, read, and approved the submitted version.
Funding
This study was supported in part by a fellowship from the Edmond J. Safra Center for Bioinformatics at Tel Aviv University. RS was supported by the Israel Science Foundation (grants no. 715/18 and 2417/20). Research in the Kupiec lab is supported by the Israel Science Foundation, the Minerva Center for in-lab evolution and the Israel Cancer Research Fund.
Conflict of interest
The authors declare that the research was conducted in the absence of any commercial or financial relationships that could be construed as a potential conflict of interest.
Publisher’s note
All claims expressed in this article are solely those of the authors and do not necessarily represent those of their affiliated organizations, or those of the publisher, the editors and the reviewers. Any product that may be evaluated in this article, or claim that may be made by its manufacturer, is not guaranteed or endorsed by the publisher.
Supplementary material
The Supplementary Material for this article can be found online at: https://www.frontiersin.org/articles/10.3389/fgene.2022.1033113/full#supplementary-material
References
Ashburner, M., Ball, C. A., Blake, J. A., Botstein, D., Butler, H., Cherry, J. M., et al. (2000). Gene ontology: Tool for the unification of biology. The gene ontology consortium. Nat. Genet. 25, 25–29. doi:10.1038/75556
Askree, S. H., Yehuda, T., Smolikov, S., Gurevich, R., Hawk, J., Coker, C., et al. (2004). A genome-wide screen for saccharomyces cerevisiae deletion mutants that affect telomere length. Proc. Natl. Acad. Sci. U. S. A. 101, 8658–8663. doi:10.1073/pnas.0401263101
Blackburn, E. H. (1991). Structure and function of telomeres. Nature 350, 569–573. doi:10.1038/350569a0
Bycroft, C., Freeman, C., Petkova, D., Band, G., Elliott, L. T., Sharp, K., et al. (2018). The UK biobank resource with deep phenotyping and genomic data. Nature 562, 203–209. doi:10.1038/s41586-018-0579-z
Chicco, D., and Jurman, G. (2020). The advantages of the Matthews correlation coefficient (MCC) over F1 score and accuracy in binary classification evaluation. BMC Genomics 21, 6. doi:10.1186/s12864-019-6413-7
Cock, P. J., Antao, T., Chang, J. T., Chapman, B. A., Cox, C. J., Dalke, A., et al. (2009). Biopython: Freely available python tools for computational molecular biology and bioinformatics. Bioinformatics 25, 1422–1423. doi:10.1093/bioinformatics/btp163
Cohen, A., Habib, A., Laor, D., Yadav, S., Kupiec, M., and Weisman, R. (2018). Tor complex 2 in fission yeast is required for chromatin-mediated gene silencing and assembly of heterochromatic domains at subtelomeres. J. Biol. Chem. 293, 8138–8150. doi:10.1074/jbc.RA118.002270
Cokelaer, T., Pultz, D., Harder, L. M., Serra-Musach, J., and Saez-Rodriguez, J. (2013). Bioservices: A common python package to access biological web services programmatically. Bioinformatics 29, 3241–3242. doi:10.1093/bioinformatics/btt547
Consortium (2021). The gene ontology resource: Enriching a gold mine. Nucleic Acids Res. 49, D325–D334. doi:10.1093/nar/gkaa1113
Costanzo, M., VanderSluis, B., Koch, E. N., Baryshnikova, A., Pons, C., Tan, G., et al. (2016). A global genetic interaction network maps a wiring diagram of cellular function. Science 353, aaf1420. doi:10.1126/science.aaf1420
Cowen, L., Ideker, T., Raphael, B. J., and Sharan, R. (2017). Network propagation: A universal amplifier of genetic associations. Nat. Rev. Genet. 18, 551–562. doi:10.1038/nrg.2017.38
Gatbonton, T., Imbesi, M., Nelson, M., Akey, J. M., Ruderfer, D. M., Kruglyak, L., et al. (2006). Telomere length as a quantitative trait: Genome-wide survey and genetic mapping of telomere length-control genes in yeast. PLoS Genet. 2, e35. doi:10.1371/journal.pgen.0020035
Greider, C. W., and Blackburn, E. H. (1989). A telomeric sequence in the rna of tetrahymena telomerase required for telomere repeat synthesis. Nature 337, 331–337. doi:10.1038/337331a0
Harari, Y., and Kupiec, M. (2014). Genome-wide studies of telomere biology in budding yeast. Microb. Cell 1, 70–80. doi:10.15698/mic2014.01.132
Harley, C. B., Kim, N., Prowse, K., Weinrich, S., Hirsch, K., West, M., et al. (1994). “Telomerase, cell immortality, and cancer,” in Cold Spring Harbor symposia on quantitative biology (New York, United States: Cold Spring Harbor Laboratory Press), 59, 307–315.
Harris, M. A., Lock, A., Bähler, J., Oliver, S. G., and Wood, V. (2013). Fypo: The fission yeast phenotype ontology. Bioinformatics 29, 1671–1678. doi:10.1093/bioinformatics/btt266
Harris, M. A., Rutherford, K. M., Hayles, J., Lock, A., Bähler, J., Oliver, S. G., et al. (2022). Fission stories: Using pombase to understand schizosaccharomyces pombe biology. Genetics 220, iyab222. doi:10.1093/genetics/iyab222
Hayflick, L. (1965). The limited in vitro lifetime of human diploid cell strains. Exp. Cell Res. 37, 614–636. doi:10.1016/0014-4827(65)90211-9
He, H., and Garcia, E. A. (2009). Learning from imbalanced data. IEEE Trans. Knowl. Data Eng. 21, 1263–1284. doi:10.1109/tkde.2008.239
Kim, D.-U., Hayles, J., Kim, D., Wood, V., Park, H.-O., Won, M., et al. (2010). Analysis of a genome-wide set of gene deletions in the fission yeast schizosaccharomyces pombe. Nat. Biotechnol. 28, 617–623. doi:10.1038/nbt.1628
Klopfenstein, D., Zhang, L., Pedersen, B. S., Ramírez, F., Warwick Vesztrocy, A., Naldi, A., et al. (2018). Goatools: A python library for gene ontology analyses. Sci. Rep. 8, 10872–10917. doi:10.1038/s41598-018-28948-z
Kupiec, M. (2014). Biology of telomeres: Lessons from budding yeast. FEMS Microbiol. Rev. 38, 144–171. doi:10.1111/1574-6976.12054
Lie, S., Banks, P., Lawless, C., Lydall, D., and Petersen, J. (2018). The contribution of non-essential schizosaccharomyces pombe genes to fitness in response to altered nutrient supply and target of rapamycin activity. Open Biol. 8, 180015. doi:10.1098/rsob.180015
Liu, N.-N., Han, T. X., Du, L.-L., and Zhou, J.-Q. (2010). A genome-wide screen for schizosaccharomyces pombe deletion mutants that affect telomere length. Cell Res. 20, 963–965. doi:10.1038/cr.2010.107
Ogata, H., Goto, S., Sato, K., Fujibuchi, W., Bono, H., and Kanehisa, M. (1999). Kegg: Kyoto encyclopedia of genes and genomes. Nucleic Acids Res. 27, 29–34. doi:10.1093/nar/27.1.29
Olson, R. S., Cava, W. L., Mustahsan, Z., Varik, A., and Moore, J. H. (2018). “Data-driven advice for applying machine learning to bioinformatics problems,” in Pacific symposium on biocomputing 2018: Proceedings of the pacific symposium (Singapore: World Scientific), 192–203.
Oughtred, R., Rust, J., Chang, C., Breitkreutz, B.-J., Stark, C., Willems, A., et al. (2021). The biogrid database: A comprehensive biomedical resource of curated protein, genetic, and chemical interactions. Protein Sci. 30, 187–200. doi:10.1002/pro.3978
Pu, S., Wong, J., Turner, B., Cho, E., and Wodak, S. J. (2009). Up-to-date catalogues of yeast protein complexes. Nucleic Acids Res. 37, 825–831. doi:10.1093/nar/gkn1005
Puddu, F., Herzog, M., Selivanova, A., Wang, S., Zhu, J., Klein-Lavi, S., et al. (2019). Genome architecture and stability in the saccharomyces cerevisiae knockout collection. Nature 573, 416–420. doi:10.1038/s41586-019-1549-9
Rallis, C., Townsend, S., and Bähler, J. (2017). Genetic interactions and functional analyses of the fission yeast gsk3 and amk2 single and double mutants defective in torc1-dependent processes. Sci. Rep. 7, 44257–44311. doi:10.1038/srep44257
Ressom, H. W., Varghese, R. S., Zhang, Z., Xuan, J., and Clarke, R. (2008). Classification algorithms for phenotype prediction in genomics and proteomics. Front. Biosci. 13, 691–708. doi:10.2741/2712
Rubinstein, L., Ungar, L., Harari, Y., Babin, V., Ben-Aroya, S., Merenyi, G., et al. (2014). Telomere length kinetics assay (telka) sorts the telomere length maintenance (tlm) mutants into functional groups. Nucleic Acids Res. 42, 6314–6325. doi:10.1093/nar/gku267
Schonbrun, M., Laor, D., López-Maury, L., Bähler, J., Kupiec, M., and Weisman, R. (2009). Tor complex 2 controls gene silencing, telomere length maintenance, and survival under dna-damaging conditions. Mol. Cell. Biol. 29, 4584–4594. doi:10.1128/MCB.01879-08
Shachar, R., Ungar, L., Kupiec, M., Ruppin, E., and Sharan, R. (2008). A systems-level approach to mapping the telomere length maintenance gene circuitry. Mol. Syst. Biol. 4, 172. doi:10.1038/msb.2008.13
Smith, T. F., and Waterman, M. S. (1981). Identification of common molecular subsequences. J. Mol. Biol. 147, 195–197. doi:10.1016/0022-2836(81)90087-5
Teixeira, M. T., Arneric, M., Sperisen, P., and Lingner, J. (2004). Telomere length homeostasis is achieved via a switch between telomerase-extendible and-nonextendible states. Cell 117, 323–335. doi:10.1016/s0092-8674(04)00334-4
Ungar, L., Harari, Y., Toren, A., and Kupiec, M. (2011). Tor complex 1 controls telomere length by affecting the level of ku. Curr. Biol. 21, 2115–2120. doi:10.1016/j.cub.2011.11.024
Ungar, L., Yosef, N., Sela, Y., Sharan, R., Ruppin, E., and Kupiec, M. (2009). A genome-wide screen for essential yeast genes that affect telomere length maintenance. Nucleic Acids Res. 37, 3840–3849. doi:10.1093/nar/gkp259
Usaj, M., Tan, Y., Wang, W., VanderSluis, B., Zou, A., Myers, C. L., et al. (2017). Thecellmap. Org: A web-accessible database for visualizing and mining the global yeast genetic interaction network. Genes Genomes Genet. 7, 1539–1549. doi:10.1534/g3.117.040220
Van Leeuwen, J., Pons, C., Mellor, J. C., Yamaguchi, T. N., Friesen, H., Koschwanez, J., et al. (2016). Exploring genetic suppression interactions on a global scale. Science 354, aag0839. doi:10.1126/science.aag0839
Wellinger, R. J., and Zakian, V. A. (2012). Everything you ever wanted to know about saccharomyces cerevisiae telomeres: Beginning to end. Genetics 191, 1073–1105. doi:10.1534/genetics.111.137851
Wood, V., Harris, M. A., McDowall, M. D., Rutherford, K., Vaughan, B. W., Staines, D. M., et al. (2012). Pombase: A comprehensive online resource for fission yeast. Nucleic Acids Res. 40, D695–D699. doi:10.1093/nar/gkr853
Keywords: machine learning model (ML model), pathways, protein complexes, telomere length maintenance (TLM), genetic interactions, Saccharomyces cerevisiae (Baker’s yeast), Schizosaccharomyces pombe (fission yeast)
Citation: Peretz I, Kupiec M and Sharan R (2022) A comparative analysis of telomere length maintenance circuits in fission and budding yeast. Front. Genet. 13:1033113. doi: 10.3389/fgene.2022.1033113
Received: 31 August 2022; Accepted: 17 October 2022;
Published: 04 November 2022.
Edited by:
Gregory Fonseca, McGill University, CanadaReviewed by:
Katherine L. Friedman, Vanderbilt University, United StatesWeihao Ge, University of Illinois at Urbana–Champaign, United States
Copyright © 2022 Peretz, Kupiec and Sharan. This is an open-access article distributed under the terms of the Creative Commons Attribution License (CC BY). The use, distribution or reproduction in other forums is permitted, provided the original author(s) and the copyright owner(s) are credited and that the original publication in this journal is cited, in accordance with accepted academic practice. No use, distribution or reproduction is permitted which does not comply with these terms.
*Correspondence: Martin Kupiec, bWFydGluQHRhdWV4LnRhdS5hYy5pbA==; Roded Sharan, cm9kZWRAdGF1ZXgudGF1LmFjLmls