 Da Zhao
 Lizhuang Wang3†
 Zheng Chen
 Lijun Zhang
 Lei Xu
95% of researchers rate our articles as excellent or good
Learn more about the work of our research integrity team to safeguard the quality of each article we publish.
Find out more
ORIGINAL RESEARCH article
Front. Genet. , 18 October 2022
Sec. Computational Genomics
Volume 13 - 2022 | https://doi.org/10.3389/fgene.2022.1024920
This article is part of the Research Topic Machine Learning For Biological Sequence Analysis View all 13 articles
KRAS encodes K-Ras proteins, which take part in the MAPK pathway. The expression level of KRAS is high in tumor patients. Our study compared KRAS expression levels between 33 kinds of tumor tissues. Additionally, we studied the association of KRAS expression levels with diagnostic and prognostic values, clinicopathological features, and tumor immunity. We established 22 immune-infiltrating cell expression datasets to calculate immune and stromal scores to evaluate the tumor microenvironment. KRAS genes, immune check-point genes and interacting genes were selected to construct the PPI network. We selected 79 immune checkpoint genes and interacting related genes to calculate the correlation. Based on the 33 tumor expression datasets, we conducted GSEA (genome set enrichment analysis) to show the KRAS and other co-expressed genes associated with cancers. KRAS may be a reliable prognostic biomarker in the diagnosis of cancer patients and has the potential to be included in cancer-targeted drugs.
Cancer is a severe life-threatening disease that affects a large number of patients worldwide (Cao et al., 2021). Breast cancer has become the most common cancer in new possibilities, followed by prostate cancer, lung cancer, etc. (Wang et al., 2021). KRAS was first recognized in the Kirsten rat sarcoma virus, which encodes the p21 protein to induce virus transformation (Scolnick et al., 1979). The proteins of KRAS are located in the cell membranes, and on its C-terminus, there is an isoprene group (Welman et al., 2000). KRAS protein encodes the GTPase enzyme, which is a part of the MAPK pathway and acts as a switch on/off of transformation between GTP (guanosine triphosphate) and GDP molecules (Tsuchida et al., 1982). In mammalian cells, KRAS has two kinds of protein products, K-Ras4A and K-Ras4B, which are encoded by alternative exon4 (Welman et al., 2000). Many studies have observed that KRAS effectors affect the interactions of cells and their extracellular environment, which could also regulate cell growth, cell motility and cell metabolism (Tang et al., 2018; Gu et al., 2021; Hu et al., 1990; Hu et al., 2020; Yu et al., 2018).
KRAS is a signal transducer protein that binds to GTP in the MAPK pathway; the mutation of KRAS has been discovered in a quarter of human cancers (Pantsar, 2020). Based on the data in COSMIC, missense mutations of KRAS frequently occur in pancreatic, colorectal and lung cancers (Forbes et al., 2011; Ao et al., 2021; Li et al., 2021; Luo et al., 2021; Yu et al., 2021). Homozygous deletions of KRAS are the most frequent genetic alteration in pancreatic epithelial adenocarcinoma (PDAC), which results in cell metastasis and the transformation of cancer tumors (Chang et al., 2014). The proto-oncogenes are closely related to multiple cancers, such as cardio-facio-cutaneous syndrome (Niihori et al., 2006), ductal carcinoma of the pancreas (Hartman et al., 2012), leukemias (Singh et al., 2021), mucinous adenoma (Hartman et al., 2012), and noonan syndrome (Ando et al., 2021). The sequences of mutations in KRAS affect the function of genes, oncogenes, tumor-suppressor genes and stability genes and are the critical element for tumorigenesis (Vogelstein and Kinzler, 2004). KRAS mutations have been well characterized in 30%–50% of colorectal cancers (Andreyev et al., 2001). KRAS proteins are activated when transmembrane receptors are present, which include serine/threonine kinase, GTP enzyme activating protein (GAP), phosphatidylinositol 3-kinase (PI3K) and GEF (Shields et al., 2000). The abnormal activation of GTP binding of mutated KRAS protein leads to the unregulated growth of downstream cells (Arrington et al., 2012). Mutations at codon 12 and position 2 (GGT-GAT) of KRAS appear to be most common in colorectal cancer (Capella et al., 1991). The wild-type allele of KRAS is a suppressor in mouse lung cancer (Westcott et al., 2015).
Mutation sites of the KRAS gene have to be considered to be an effective way to develop new cancer treatment schemes (Hu et al., 2022a). Efforts to utilize KRAS and related genes as targets to explore drugs for cancer have been undertaken for years, and inhibitor drugs to block KARSG12C have been developed (Xu et al., 2022). RAF1 could be an essential target to block KRAS mutant cancers (Drosten and Barbacid, 2020). EFGR-inhibiting drugs suppress the KRAS expression level in A549 lung cancer cells to inhibit cell proliferation (Zarredar et al., 2019).
Possibility, KRAS may be considered a genetic diagnosis potential biomarker of multiple malignant neoplastic diseases. First, we compared the survival data of patients with 33 kinds of tumors. Second, we analyzed the KRAS expression level with the characteristics of tumor patients, tumor stage, tumor microenvironment, and immune cell infiltration of 33 kinds of tumors; finally, we investigated the molecular mechanisms by GO and KEGG analysis. This study explores the molecular relationships between KRAS genes and cancer, which is crucial for developing new biomarkers and effective prevention and treatment of tumors.
We obtained 33 kinds of tumors sequencing datasets(10,327 tumor samples and 730 normal samples) somatic mutation and survival data from the UCSC Xena database (http://xena.ucsc.edu/). Subsequently, we used R language to convert the gene ID, extract the transcription data and analyze the differential expression of genes, analyze and draw, and the packages involved were R (version 4.2.1), BiomaRt (version 2.52.0, Functional Annotation Retrieval), dplyr (version 2.52.0, Data manipulation) and ggpubr (version 0.4.0, Data visualization).
In this experiment, we used existing data to investigate the survival status information from the UCSC Xena database, which contained 10,327 tumor samples and 730 normal samples. We gathered the survival status, which included disease-specific survival (DSS), disease-free interval (DFI) and progression-free interval (PFI) status data and time information for prognostic analysis. We divided the differentially expressed KRAS data into high-value and low-value groups. Furthermore, the prognostic value in 33 tumors was calculated by the Kaplan–Meier survival estimate method. The R packages utilized for this analysis were limma (version 3.9, Analyzing microarray and RNA-seq data), survival (version 3.3-1, Survival analysis), survminer (version 0.4.9, Drawing survival curves) and forestplot (version 2.0.1, Advanced Forest plot using ‘grid’ graphics).
Stage information containing the diagnostic and prognostic value of cancers was downloaded from the UCSC Xena database(http://xena.ucsc.edu/); approximately 8,099 tumor samples were divided into 3-4 stages. The limma and ggpubr packages of R were introduced to calculate the KRAS expression quantity and show the relevance between KRAS genes and tumor stage. Approximately 11,057 samples combined with KRAS expression data were used for TMB analysis by the Spearman correlation test. The fmsb(version 0.7.3, Medical and Health Data Analysis) package was used to create a correlation radar plot. We calculated the microsatellite instability (MSI) scores combined with the KRAS expression data by the Spearman correlation test, and a rader plot between tumors and KRAS genes was created. The fmsb package was used to create a correlation radar plot.
The tumor microenvironment (TME) is considered to be the cells, tissues and matrix around a tumor; immune cells and stromal cells are considered diagnostic indicators of cancer development. We utilized ESTIMATE for predicting tumor purity by calculating stromal and immune cell infiltration (Yoshihara et al., 2013). Approximately 11,057 samples from 33 tumors were used to construct expression matrix data of KRAS genes. We calculated correlation between TME, MSI and expression data, tested by Spearman test methods.
We conducted CIBERSORT (https://cibersortstanfordedu/) to estimate the infiltration percentage of 22 immune cell types in tumors (Newman et al., 2015). According to the tumor expression data matrix file, we estimated the immune scores of all the tumor samples. Filtering through data from tumors, we approximate the correlation between cell infiltration levels and gene expression levels by Spearman’s correlation test.
The KRAS genes interacted with other tumor-associated genes may help us understand tumorigenesis molecular mechanisms. We selected 33 KRAS coexpressed genes to construct protein–protein interaction (PPI) networks on the STRING database (https://www.string-db.org/) (Szklarczyk et al., 2019; Yu et al., 2020). We selected 79 immune checkpoint genes and interacting related genes to calculate the correlation. Based on the 33 tumor expression datasets, we conducted GSEA (genome set enrichment analysis) to show the KRAS and other coexpressed genes associated with cancers. This research utilized the KEGG database (https://www.kegg.jp/) and the GO database to enrich the genes (FDR <0.5).
We obtained the transcription datasets, somatic mutations of 33 cancer tumors from TCGA, and the survival data from the UCSC Xena database. The transcription data contained 11,057 samples which included tumor samples and normal samples. When we compared the differences between normal and tumor tissues, in most tumor tissues the expression levels of KRAS were higher than normal tissues. A total of 12 kinds of tumor tissues has significant difference in KRAS expression levels, of which 9 tumor tissues BRCA (Breast invasive carcinoma), CHOL (Cholangiocarcinoma), COAD (Colon adenocarcinoma), KIRC (Kidney renal clear cell carcinoma), LUAD (Lung adenocarcinoma), LUSC (Lung squamous cell carcinoma), READ (Rectum adenocarcinoma), STAD (Stomach adenocarcinoma), and UCEC (Uterine Corpus Endometrial Carcinoma) had an extremely significant difference; meanwhile, 3 tumor tissues (GBM (Glioblastoma multiforme), LIHC(Liver hepatocellular carcinoma), and THCA(Thyroid carcinoma) had a significant difference (Figure 1). These results indicated that cancer could lead to the abnormal expression of KRAS.
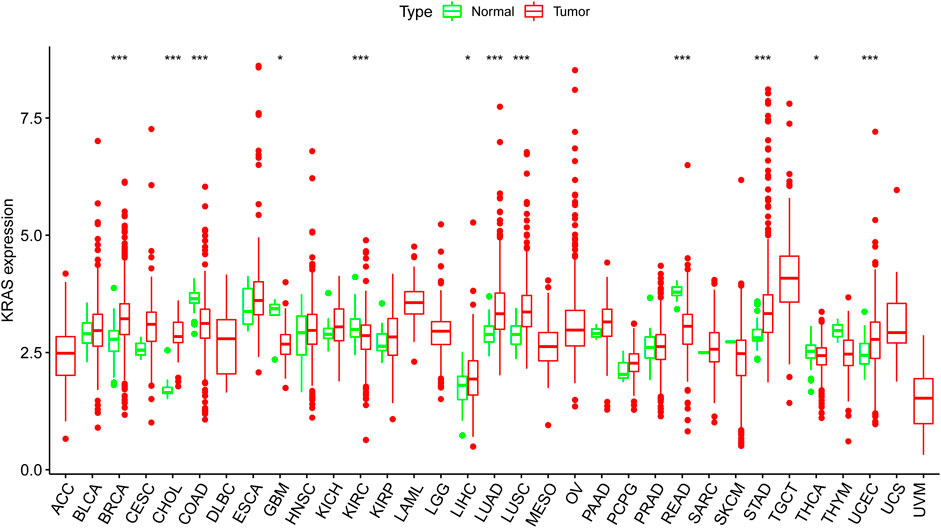
FIGURE 1. The KRAS expression level in cancer patients. Thirty-three kinds of tumor cancers. Expression of KRAS in tumors were performed by ggpubr (version 4.0.4) package of R (***p < 0.001, **p < 0.01, *p < 0.05).
We analyzed the prognostic value of each tumor sample according to the KRAS expression levels with different tumors. High KRAS expression levels were associated with overall survival (OS) in ACC, LUAD, PAAD and UCEC (Figure 2A); poor disease-specific survival (DSS) in ACC, LUAD and PAAD (Figure 2B); poor disease-free interval (DFI) in ACC, LUAD, PAAD and STAD (Figure 2C); and poor progression-free interval (PFI) in adrenocortical carcinoma (ACC), LUAD, PAAD, STAD and uveal melanoma (UVM) (Figure 2D).
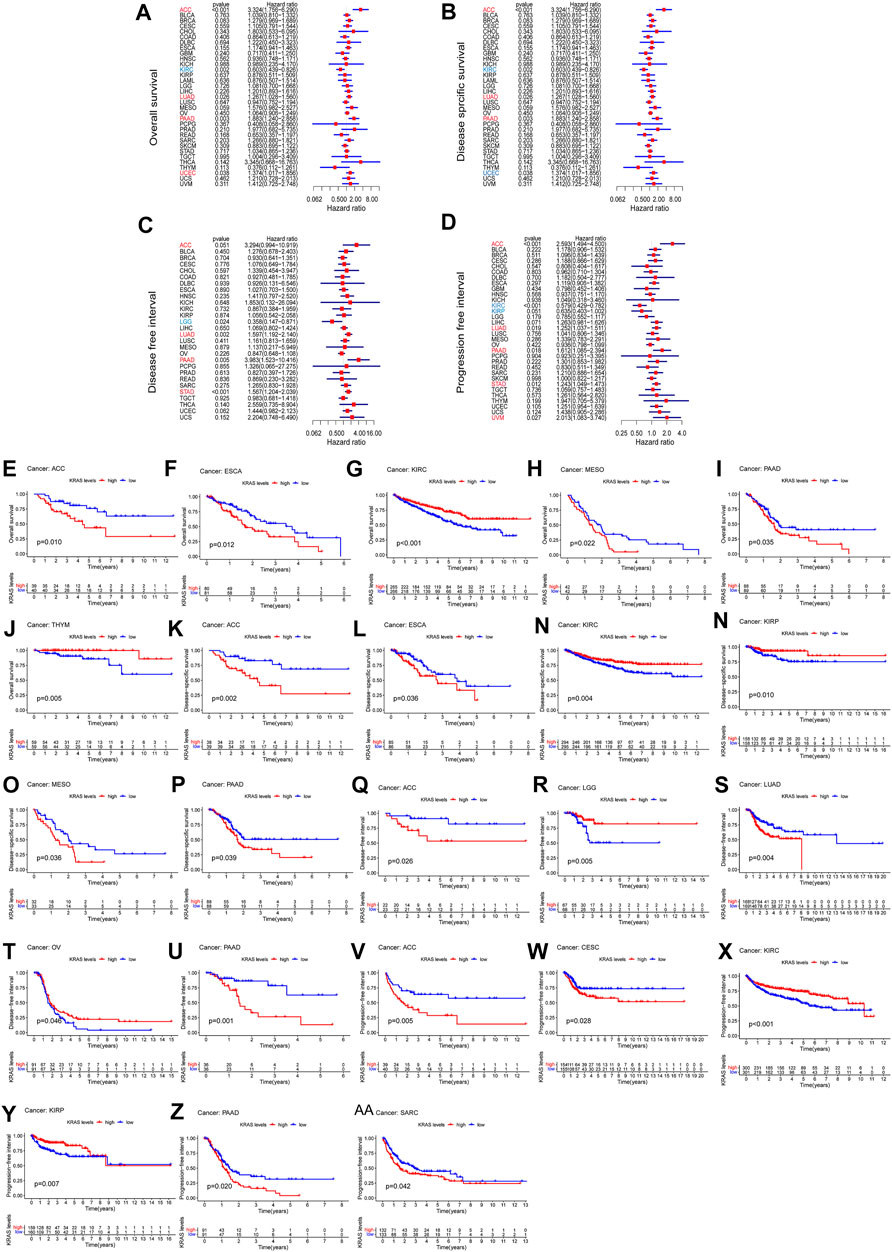
FIGURE 2. The relationship between the expression of KRAS and the prognosis of patients with 33 kinds of cancers in the TCGA database. (A,E–J) OS (overall survival) (B,K–P) DSS (disease-specific survival) (C,Q–U) DFI (disease-free interval) (D,V–AA) PFI (progression-free interval).
To evaluate how effective KRAS is in single cancer, we calculated p values to analyze the association of clinical data with single cancers. High KRAS expression levels correlated with OS in ACC, ESCA, KIRC, PAAD and THYM of 0.01, 0.01, 0.001, 0.022, 0.035 and 0.005, respectively (Figures 3E–J); correlated with poor DSS in ACC, ESCA, KIRC, KIPP, MESO and PAAD by 0.002, 0.036, 0.004, 0.010, 0.038 and 0.039, respectively (Figures 2K–P); correlated with poor DFI in ACC, LGG, LUAD, OV and PAAD by 0.026, 0.005, 0.004 m 0.046 and 0.001, respectively (Figures 2Q–U); and correlated with poor PFI in ACC, CESC, KIRC, KIPP, PAAD and SARC by 0.005, 0.028, 0.001, 0.007, 0.020 and 0.042, respectively (Figure 2 V-AA).
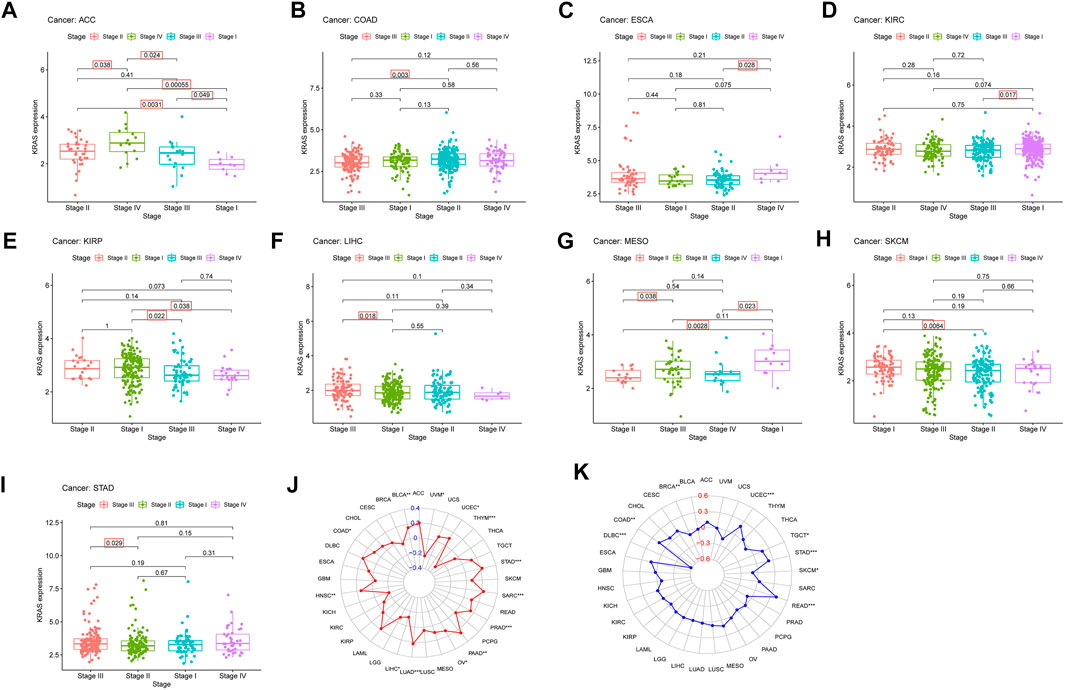
FIGURE 3. The relationship between KRAS expression level and pathological characteristics of tumor patients. (tumor mutation burden, microsatellite instabilitiy). (A–I) Relationship of KRAS expression level and stage grade. (J) Tumor mutation burden (TMB). (K) Microsatellite instability (MSI). *p < 0.05. **p < 0.01, ***p < 0.001.
We explored the connection between the clinicopathological characteristics and various tumor stages according to KRAS expression levels in different pathology grades. These data suggest that high KRAS expression levels had effects at severe stages; correlation analysis showed in ACC, COAD, ESCA, KIRC, KIRP, LIHC, MESO, SKCM and STAD (Figures 3A–I). In addition, high KRAS expression levels showed a correlation with TMB in 14 tumors: BLCA, COAD, HNSC, LIHC, LUAD, LUSC, LUSC, PAAD, OV, PRAD, SARC, STAD, THYM, UCEC and UVM (Figure 3J); high KRAS expression levels showed a correlation with MSI in 8 tumors: BRCA, COAD, DLBC, READ, SKCM, STAD, TGCT and UCEC (Figure 3K).
A total of 22 immune-infiltrating cells were introduced to analyze the tumor microenvironment by 33 tumor expression data. Looking at Figure 4A, it is apparent that the immune scores of ACC, CESC, GBM, HNSC, KIRC, KIRP, LGG, LUAD, LUSC, TGCT and UCEC were negatively associated with KRAS expression; from Figure 4B above we can see that the stromal scores in THCA showed a causal negative relationship with KRAS expression levels, and GBM, LGG, LUSC, TGCT and UECE showed a causal negative relationship with KRAS expression levels.
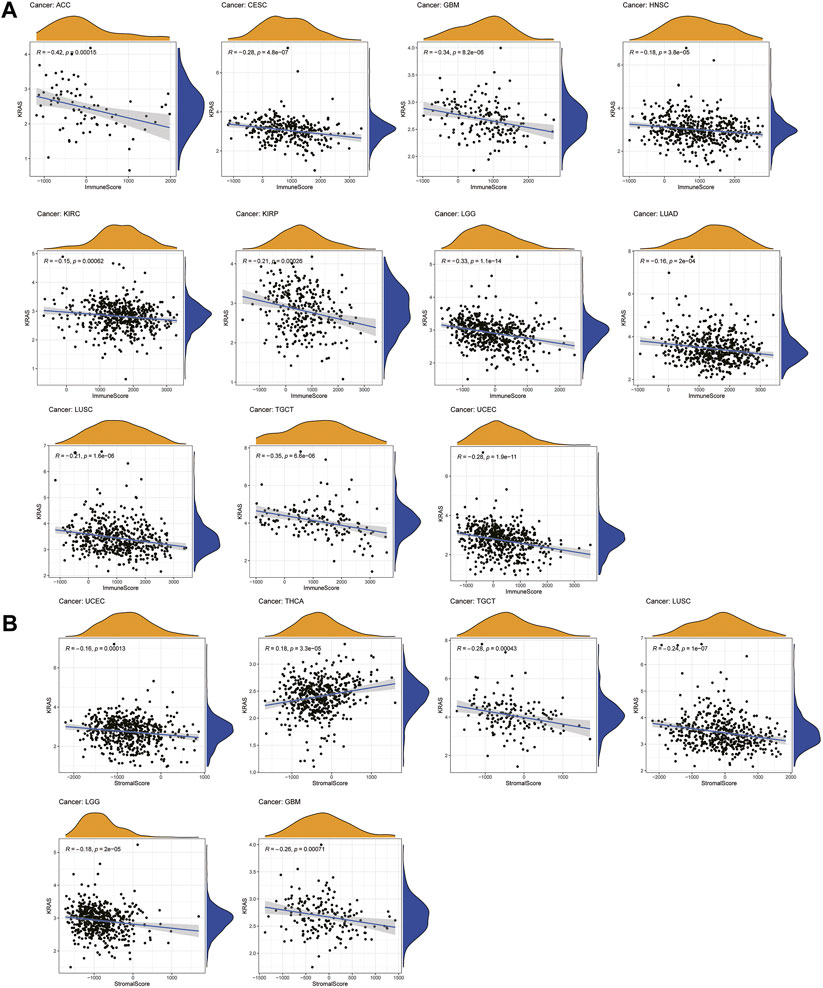
FIGURE 4. Relationships between KRAS expression and tumor microenvironment. (A) Immune score, (B) Stromal score.
We established 22 cell expression datasets based on the immune-infiltrating levels to explore the potential effect of KRAS expression levels on the tumor immune cell infiltration. The results of the correlational analysis are shown in Figure 5; we could demonstrate that higher expression levels of KRAS were positively correlated with the infiltration levels of follicular helper T cells, activated memory CD4 T cells, activated dendritic cells, activated NK cells, naïve B cells, resting plasma cells, resting mast cells, resting CD4 T cells and follicular helper T cells, which were negatively correlated with the infiltration levels of activated NK cells, plasma cells, CD8 T cells, regulatory T cells (Tregs), M2 macrophages, M0 macrophages, memory B cells, activated memory T cells, memory CD4 T cells, activated NK cells, CD8 T cells, neutrophils, and monocytes in tumor cancers. High KRAS expression levels were positively correlated with the infiltration level of follicular helper T cells in BLCA. High KRAS expression levels were positively correlated with the infiltration level of resting CD4 T cells in BRCA. High KRAS expression levels were negatively correlated with the infiltration levels of activated NK cells, plasma cells, CD8 T cells and regulatory T cells (Tregs) in BRCA. High KRAS expression levels were positively correlated with the infiltration level of resting CD4 T cells in CESC. High KRAS expression levels were negatively correlated with the infiltration levels of M2 macrophages in CESC. High KRAS expression levels were positively correlated with the infiltration level of activated dendritic cells and resting CD4 T cells in COAD. High KRAS expression levels were negatively correlated with the infiltration levels of M0 macrophages in COAD. High KRAS expression levels were positively correlated with the infiltration level of activated memory CD4 T cells in DLBC. High KRAS expression levels were negatively correlated with the infiltration levels of memory B cells in ESCA. High KRAS expression levels were negatively correlated with the infiltration levels of activated memory CD4 T cells in GBM. High KRAS expression levels were positively correlated with the infiltration level of naïve B cells, plasma cells and memory CD4 T cells resting in HNSC. High KRAS expression levels were negatively correlated with the infiltration levels of activated NK cells and CD8 T cells in HNSC. High KRAS expression levels were positively correlated with the infiltration level of M2 macrophages, resting memory CD4 T cells, resting MAST cells and neutrophils in KIRC. High KRAS expression levels were negatively correlated with the infiltration levels of regulatory T cells (Tregs), CD8 T cells and plasma cells in KIRC. High KRAS expression levels were positively correlated with the infiltration level of resting mast cells and resting memory CD4 T cells in KIRP. High KRAS expression levels were negatively correlated with the infiltration levels of regulatory T cells (Tregs) in KIRP. High KRAS expression levels were positively correlated with the infiltration level of memory resting memory CD4 T cells in LAML. High KRAS expression levels were positively correlated with the infiltration levels of memory-activated CD4 T cells in LUAD. High KRAS expression levels were positively clinically relevant to the infiltration levels of memory B cells in LUSC. High KRAS expression levels were negatively clinically relevant to the infiltration levels of neutrophils in LUSC. High KRAS expression levels were negatively correlated with the infiltration levels of activated NK cells in OV. High KRAS expression levels were positively correlated with the infiltration levels of memory CD4 T cells resting in PAAD. High KRAS expression levels were negatively correlated with the infiltration levels of plasma cells in PAAD. High KRAS expression levels were positively correlated with the infiltration levels of naïve B cells, M1 macrophages and resting memory CD4 T cells in PRAD. High KRAS expression levels were negatively correlated with the infiltration levels of memory B cells, activated NK cells and CD8 T cells in PRAD. High KRAS expression levels were negatively correlated with the infiltration levels of dendritic cells resting in READ. High KRAS expression levels were negatively correlated with the infiltration levels of resting mast cells in SARC. High KRAS expression levels were positively correlated with the infiltration levels of activated memory CD4 T cells and resting CD4 T cells in SKCM. High KRAS expression levels were negatively correlated with the infiltration levels of regulatory T cells (Tregs) in SKCM. High KRAS expression levels were negatively correlated with the infiltration levels of Mococytes in STAD. High KRAS expression levels were positively correlated with the infiltration levels of naïve B cells and memory CD4 T cells activated in THCA. High KRAS expression levels were negatively correlated with the infiltration levels of M2 macrophages and NK cells activated in THCA. High KRAS expression levels were negatively correlated with the infiltration levels of resting mast cells and CD8 T cells in THYM. High KRAS expression levels were positively correlated with the infiltration levels of activated dendritic cells, resting memory CD4 T cells, and follicular helper T cells in UCEC. High KRAS expression levels were negatively correlated with the infiltration levels of activated NK cells, plasma cells, CD8 T cells and regulatory T cells (Tregs).
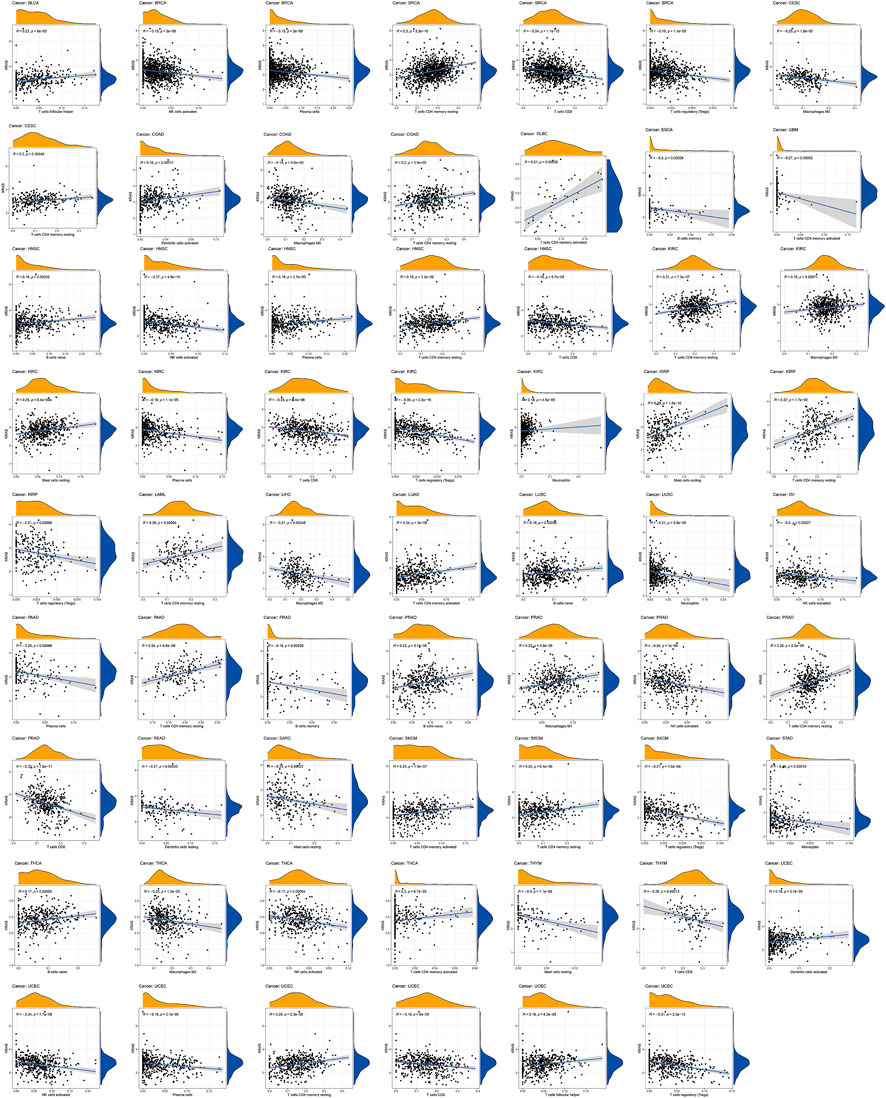
FIGURE 5. Relationships between KRAS expression and different types of immune cells infiltration level in tumors.
KRAS is a signal transducer protein that binds to GTP in the MAPK pathway, and mutations have been found in a quarter of cancers. We fabricated the PPI network using the STRING database based on KRAS and KRAS-related genes (Figure 6A). Furthermore, we utilized the genes from the PPI network to analyze the association with KRAS expression. The results indicate that the great mass of immune checkpoint genes and KRAS-related genes were correlated with 33 kinds of tumor cancers (Figure 6B).
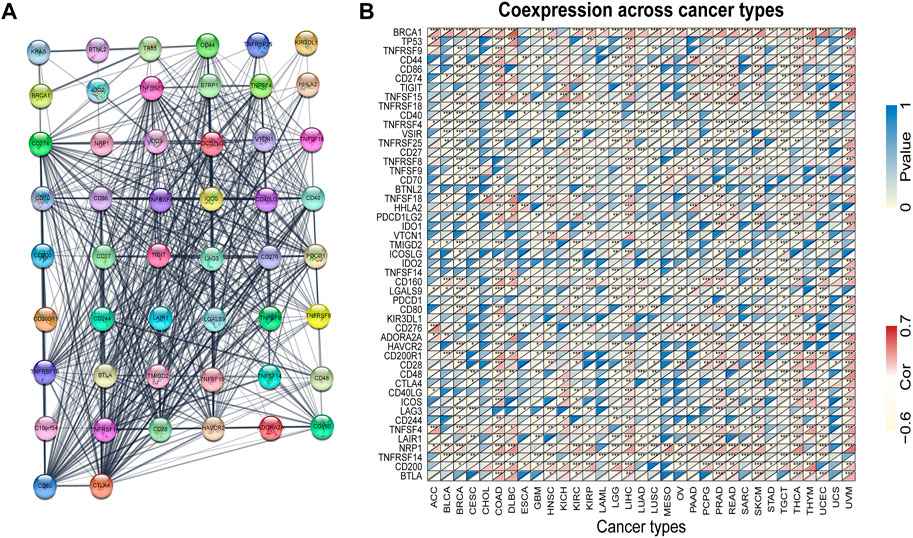
FIGURE 6. KRAS protein-protein network and expression relationships between KRAS and related genes. (A) PPI network for KRAS-interaction genes. (B) Correlation between KRAS expression and related genes (immune checkpoint genes and interacted related genes) expression.
We utilized GSEA to discuss the molecular circadian mechanism in multiple cancers. KRAS expression was involved in more than 96 kinds of GO (Gene Ontology) pathways in 33 tumor cancers (Figure 7A). In ACC, high expression levels of KRAS proteins were involved in epidermal development, neural signal response and sensory perception of a smell. In BLAC, high KRAS expression levels affect the cellular amide metabolic process, mRNA binding sites, cell migration and cell keratinization. Furthermore, high KRAS gene expression levels were related to the detection of chemical stimuli in COAD, DLBC, ESCA, LIHC, LUAD, LUSC, PCPG, READ, SKCM, STAD and THYM. KRAS proteins could be involved in mRNA binding in LUAD, UCEC, DLBC, ESCA, LIHC, LUSC, PRAD and SKCM. High KRAS expression levels were involved in recognizing and characterizing the olfactory stimulus signal in BRCA, COAD, DLBC, ESCA, LUAD, LUSC, READ, SKCM, STAD and THYM. On the other hand, KRAS is an essential member of keratinocyte differentiation in LIHC, OV and PAAD. The production of the immunoglobulin complex was due to the high KRAS expression in CHOL, PRAD, UVM, HNSC and UVM. Intermediate filament formation was related to high KRAS expression in CESC, LIHC, PAAD and OV. The result demonstrated that KRAS genes were involved in the formation of amyloid fibrils in LAML and MESO.
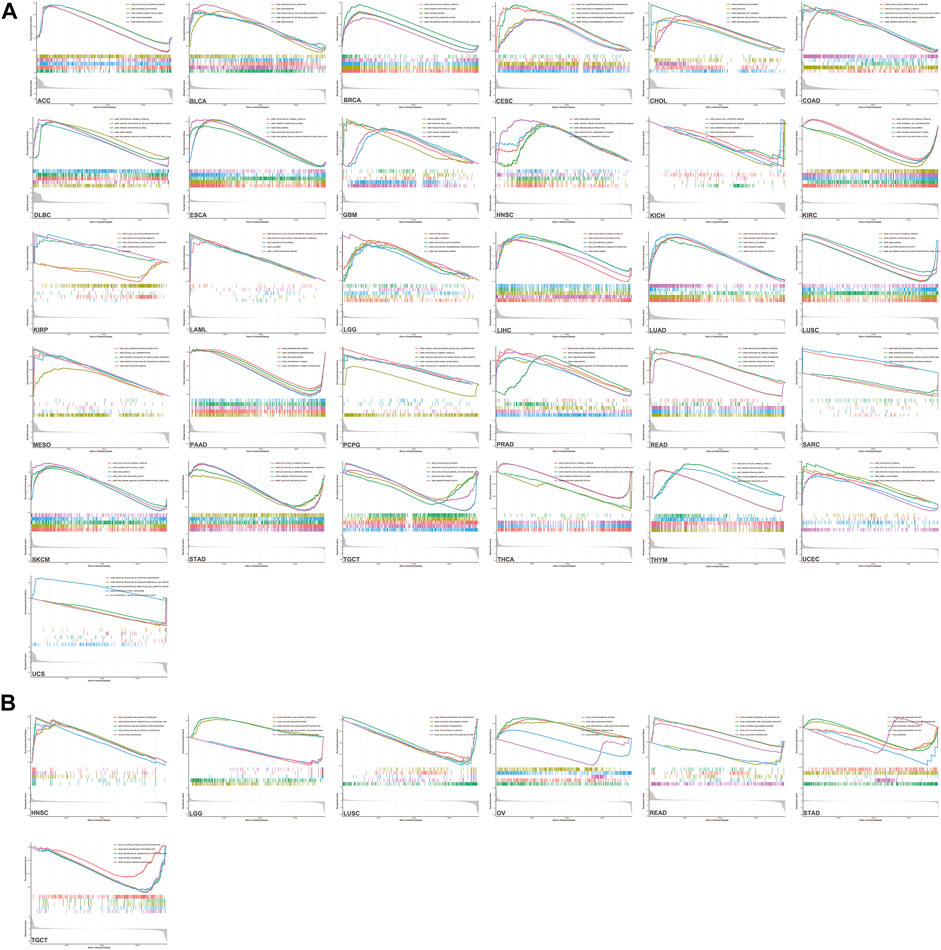
FIGURE 7. GSEA enrichment analysis of KRAS (A) Go enrichment analysis in various tumors. (B) KEGG enrichment analysis in various tumors.
Interestingly, KEGG analysis promoted revealed the expression levels of KRAS genes involved in more than 20 kinds of pathways in 7 tumors. Increased KRAS expression is involved in the calcium signaling pathway in LUSC, OV, READ and STAD. In LUSC and READ, antigen processing and presentation seemed to have a correlation with high KRAS expression levels. Neuroactive ligand–receptor interactions are also effected in LGG, OV and STAD. High KRAS expression levels promoted ascorbate and alternate metabolism in HNSC and LGG (Figure 7B). There are many other GO ontology and KEGG pathways related to KRAS expression.
The RAS gene family is one of the most widely studied families of cancer-related genes. Previous studies have shown that KRAS is the most common mutation of the three altered genes (Wennerberg et al., 2005). KRAS-related carcinogenic mutations are prevalent in human cancer, occurring in 17%–25% of all cancers. The results indicated that cancer could lead to the abnormal expression of KRAS in tumor tissues. In addition, we analyzed the KRAS expression levels on different pathology grades; high expression levels of KRAS genes affected the degree of tumor deterioration at serious stages, and correlation analysis showed in ACC, COAD, ESCA, KIRC, KIRP, LIHC, MESO, SKCM and STAD. Many studies have shown that KRAS has an essential relationship with the occurrence of cancer (Roberts and Stinchcombe, 2013). Therefore, KRAS has the potential to be introduced as a prognostic factor in many tumors.
TMB was calculated by the number of noninherited mutations, which are considered to be an important genetic feature to evaluate tumor tissue (Merino et al., 2020). As a genomic biomarker that predicts a good response to an immune checkpoint inhibitor (Kim et al., 2019). MSI is generated from impaired DNA mismatch repair, which occurs during gene duplication (Buecher et al., 2013). MSI p roduction is not random, and different target genes will lead to different phenotypes and pathologies and affect the pathogenesis of many kinds of cancer (Imai and Yamamoto, 2008). In addition, high KRAS expression levels showed a correlation with TMB in 14 tumors: BLCA, COAD, HNSC, LIHC, LUAD, LUSC, LUSC, PAAD, OV, PRAD, SARC, STAD, THYM, UCEC and UVM; with MSI in BRCA, COAD, DLBC, READ, SKCM, STAD, TGCT and UCEC. TMB and MSI are relatively new biomarkers, and there is still a need to perform more studies.
RAS mutations participating in the production of human cancer cells have been studied in many types of research. Nevertheless, its potential mechanism and molecular regulatory mechanism need to be further clarified (Hu et al., 2022b). KRAS mutation is considered to be one of the most common genome variation in non-small cell lung cancer and is associated with a clinical background and pathological features (Suda et al., 2010). The pro-tumor inflammation caused by KRAS is associated with immune regulation, which leads to immune escape in the TME (Hamarsheh et al., 2020). The immune and stromal scores reflected the proportion of cancer cells in tumor tissue; we established 22 kinds of expression datasets by immune-infiltrating cells. Our research suggested that KRAS was associated with immunotherapeutic effects and cell viability in multiple tumors and had excellent potential as a cancer-targeted drug.
KRAS has been reported as a biomarker in multiple cancers (Petrelli et al., 2013; Siddiqui and Piperdi, 2010; Yang et al., 2013). In our study, the KRAS expression levels in various tumor cells were associated with prognosis and immune cell infiltration. From the GO ontology and KEGG pathways, the expression of KRAS plays an essential role in different stages of cancers with multiple functions. We found that KRAS interacts with several cancer-related genes from the PPI network, but their mechanism needs further study. Based on our study, KRAS may be a reliable prognostic biomarker for cancer patients in the course of diagnosis and treatment.
We studied the novel cancer-related gene KRAS, which belongs to the RAS gene family, in 33 kinds of tumors. This study has shown that KRAS were significantly different in 12 tumor tissues compared to normal tissues. Furthermore, the second significant finding was that the prognostic value of OS, DSS and DFI and DSS correlated with KRAS expression levels in 4, 3, 4 and 6 kinds of tumors, separately. In addition, KRAS expression levels were associated with tumor mutation burden (TMB) and microsatellite instability (MSI) in 14 and 8 tumors. As for 22 immune infiltrating cells, immune and stromal scores showed 11 and 6 kinds of tumors correlated with KRAS expression levels based on the tumor purity. The PPI network and functional enrichment participate in different biological metabolic pathways. Go and KEGG enrichment analysis revealed that KRAS was connected with more than 96 GO pathways in 33 tumor cancer cells and more than 20 kinds of KEGG pathways in 7 tumors, indicated that KRAS expression was involved in epidermal development, neural signal response, sensory perception of a smell, metabolic process, mRNA binding sites, cell migration and cell keratinization in multiple tumors. Our study suggested that KRAS may be a promising prognostic biomarker for cancer diagnosis and treatment.
The original contributions presented in the study are included in the article/Supplementary Material, further inquiries can be directed to the corresponding author.
LX and LZ designed the research; DZ and LW pergormed the reseatch, ZC modified figures; DZ wrote the manuscript. All authors read and approved the manuscript.
This work was supported by the National Natural Science Foundation of China (No. 61902259, No. 62001311), China Postdoctoral Science Foundation (No. 2022T150095), the National Science Foundation and Research Funding of Shenzhen Polytechnic (No. 6022310029K, No. 6020330001K).
The authors declare that the research was conducted in the absence of any commercial or financial relationships that could be construed as a potential conflict of interest.
All claims expressed in this article are solely those of the authors and do not necessarily represent those of their affiliated organizations, or those of the publisher, the editors and the reviewers. Any product that may be evaluated in this article, or claim that may be made by its manufacturer, is not guaranteed or endorsed by the publisher.
Ando, Y., Sawada, M., Kawakami, T., Morita, M., and Aoki, Y. (2021). A patient with noonan syndrome with a KRAS mutation who presented severe nerve root hypertrophy. Case Rep. Neurol. 13 (1), 108–118. doi:10.1159/000512265
Andreyev, H. J., Norman, A. R., Cunningham, D., Oates, J., Dix, B. R., Iacopetta, B. J., et al. (2001). Kirsten ras mutations in patients with colorectal cancer: The 'RASCAL II' study. Br. J. Cancer 85 (5), 692–696. doi:10.1054/bjoc.2001.1964
Ao, C., Yu, L., and Zou, Q. (2021). Prediction of bio-sequence modifications and the associations with diseases. Brief. Funct. Genomics 20 (1), 1–18. doi:10.1093/bfgp/elaa023
Arrington, A. K., Heinrich, E. L., Lee, W., Duldulao, M., Patel, S., Sanchez, J., et al. (2012). Prognostic and predictive roles of KRAS mutation in colorectal cancer. Int. J. Mol. Sci. 13 (10), 12153–12168. doi:10.3390/ijms131012153
Buecher, B., Cacheux, W., Rouleau, E., Dieumegard, B., Mitry, E., and Lievre, A. (2013). Role of microsatellite instability in the management of colorectal cancers. Dig. Liver Dis. 45 (6), 441–449. doi:10.1016/j.dld.2012.10.006
Cao, C., Wang, J., Kwok, D., Cui, F., Zhang, Z., Zhao, D., et al. (2021). webTWAS: a resource for disease candidate susceptibility genes identified by transcriptome-wide association study. Nucleic Acids Res. 50 (D1), D1123–D1130. doi:10.1093/nar/gkab957
Capella, G., Cronauer-Mitra, S., Pienado, M. A., and PeruchoM., (1991). Frequency and spectrum of mutations at codons 12 and 13 of the c-K-ras gene in human tumors. Environ. Health Perspect. 93, 125–131. doi:10.1289/ehp.9193125
Chang, Z., Ju, H., Ling, J., Zhuang, Z., Li, Z., Wang, H., et al. (2014). Cooperativity of oncogenic K-ras and downregulated p16/INK4A in human pancreatic tumorigenesis. PLoS One 9 (7), e101452. doi:10.1371/journal.pone.0101452
Drosten, M., and Barbacid, M. (2020). Targeting the MAPK pathway in KRAS-driven tumors. Cancer Cell. 37 (4), 543–550. doi:10.1016/j.ccell.2020.03.013
Forbes, S. A., Bindal, N., Bamford, S., Cole, C., Kok, C. Y., Beare, D., et al. (2011). Cosmic: Mining complete cancer genomes in the catalogue of somatic mutations in cancer. Nucleic Acids Res. 39, D945–D950. (Database issue). doi:10.1093/nar/gkq929
Gu, Y., Gao, Y., Tang, X., Xia, H., and Shi, K. (2021). Bioinformatics analysis identifies CPZ as a tumor immunology biomarker for gastric cancer. Curr. Bioinform. 16 (1), 98–105. doi:10.2174/1574893615999200707145643
Hamarsheh, S., GroB, O., Brummer, T., and Zeiser, R. (2020). Immune modulatory effects of oncogenic KRAS in cancer. Nat. Commun. 11 (1), 5439. doi:10.1038/s41467-020-19288-6
Hartman, D. J., Davison, J. M., Foxwell, T. J., Nikiforova, M. N., and Chiosea, S. I. (2012). Mutant allele-specific imbalance modulates prognostic impact of KRAS mutations in colorectal adenocarcinoma and is associated with worse overall survival. Int. J. Cancer 131 (8), 1810–1817. doi:10.1002/ijc.27461
Hu, Y., Zhang, Y., Zhang, H., Gao, S., Wang, L., Wang, T., et al. (2022). Mendelian randomization highlights causal association between genetically increased C-reactive protein levels and reduced Alzheimer’s disease risk. Alzheimer’s & Dementia : The Journal of the Alzheimer’s Association. doi:10.1002/alz.12687
Hu, Y., Sun, J. Y., Zhang, Y., Zhang, H., Gao, S., Wang, T., et al. (1990). rs1990622 variant associates with Alzheimer's disease and regulates TMEM106B expression in human brain tissues. BMC Med. 19 (1), 11. doi:10.1186/s12916-020-01883-5
Hu, Y., Zhang, H., Liu, B., Gao, S., Wang, T., Han, Z., et al. (2020). rs34331204 regulates TSPAN13 expression and contributes to Alzheimer's disease with sex differences. Brain 143 (11), e95. doi:10.1093/brain/awaa302
Hu, Y., Zhang, Y., Zhang, H., Gao, S., Wang, L., Wang, T., et al. (2022). Cognitive performance protects against Alzheimer's disease independently of educational attainment and intelligence. Mol. Psychiatry. doi:10.1038/s41380-022-01695-4
Imai, K., and Yamamoto, H. (2008). Carcinogenesis and microsatellite instability: The interrelationship between genetics and epigenetics. Carcinogenesis 29 (4), 673–680. doi:10.1093/carcin/bgm228
Kim, J. Y., Kronbichler, A., Eisenhut, M., Hong, S. H., van der Vliet, H. J., Kang, J., et al. (2019). Tumor mutational burden and efficacy of immune checkpoint inhibitors: A systematic review and meta-analysis. Cancers (Basel) 11 (11), E1798. doi:10.3390/cancers11111798
Li, J., Tao, H., Shan, J., Liu, F., Deng, X., et al. (2021). Differential hippocampal protein expression between normal mice and mice with the perioperative neurocognitive disorder: A proteomic analysis. Eur. J. Med. Res. 16 (1), 130–138. doi:10.1186/s40001-021-00599-3
Luo, Y., Wang, X., Li, L., Wang, Q., Hu, Y., He, C., et al. (2021). Bioinformatics analysis reveals centromere protein K can serve as potential prognostic biomarker and therapeutic target for non-small cell lung cancer. Curr. Bioinform. 16 (1), 106–119. doi:10.2174/1574893615999200728100730
Merino, D. M., McShane, L. M., Fabrizio, D., Funari, V., Chen, S. J., White, J. R., et al. (2020). Establishing guidelines to harmonize tumor mutational burden (TMB): In silico assessment of variation in TMB quantification across diagnostic platforms: phase I of the friends of cancer research TMB harmonization project. J. Immunother. Cancer 8 (1), e000147. doi:10.1136/jitc-2019-000147
Newman, A. M., Liu, C. L., Green, M. R., Gentles, A. J., Feng, W., Xu, Y., et al. (2015). Robust enumeration of cell subsets from tissue expression profiles. Nat. Methods 12 (5), 453–457. doi:10.1038/nmeth.3337
Niihori, T., Aoki, Y., Narumi, Y., Neri, G., Cave, H., Verloes, A., et al. (2006). Germline KRAS and BRAF mutations in cardio-facio-cutaneous syndrome. Nat. Genet. 38 (3), 294–296. doi:10.1038/ng1749
Pantsar, T. (2020). The current understanding of KRAS protein structure and dynamics. Comput. Struct. Biotechnol. J. 18, 189–198. doi:10.1016/j.csbj.2019.12.004
Petrelli, F., Coinu, A., Cabiddu, M., Ghilardi, M., and Barni, S. (2013). KRAS as prognostic biomarker in metastatic colorectal cancer patients treated with bevacizumab: A pooled analysis of 12 published trials. Med. Oncol. 30 (3), 650. doi:10.1007/s12032-013-0650-4
Roberts, P. J., and Stinchcombe, T. E. (2013). KRAS mutation: Should we test for it, and does it matter? J. Clin. Oncol. 31 (8), 1112–1121. doi:10.1200/JCO.2012.43.0454
Scolnick, E. M., Papageorge, A. G., and Shih, T. Y. (1979). Guanine nucleotide-binding activity as an assay for src protein of rat-derived murine sarcoma viruses. Proc. Natl. Acad. Sci. U. S. A. 76 (10), 5355–5359. doi:10.1073/pnas.76.10.5355
Shields, J. M., Pruitt, K., McFAll, A., ShAub, A., and Der, C. J. (2000). Understanding ras: ‘it ain’t over ’til it’s over’. Trends Cell. Biol. 10 (4), 147–154. doi:10.1016/s0962-8924(00)01740-2
Siddiqui, A. D., and Piperdi, B. (2010). KRAS mutation in colon cancer: A marker of resistance to egfr-I therapy. Ann. Surg. Oncol. 17 (4), 1168–1176. doi:10.1245/s10434-009-0811-z
Singh, K., Gollapudi, S., Mittal, S., Small, C., Kumar, J., and Ohgami, R. S. (2021). Point mutation specific antibodies in B-cell and T-cell lymphomas and leukemias: Targeting IDH2, KRAS, BRAF and other biomarkers RHOA, IRF8, MYD88, ID3, NRAS, SF3B1 and EZH2. Diagn. (Basel) 11 (4), 600. doi:10.3390/diagnostics11040600
Suda, K., Tomizawa, K., and Mitsudomi, T. (2010). Biological and clinical significance of KRAS mutations in lung cancer: An oncogenic driver that contrasts with EGFR mutation. Cancer Metastasis Rev. 29 (1), 49–60. doi:10.1007/s10555-010-9209-4
Szklarczyk, D., Gable, A. L., Lyon, D., Junge, A., Wyder, S., Huerta-Cepas, J., et al. (2019). STRING v11: Protein-protein association networks with increased coverage, supporting functional discovery in genome-wide experimental datasets. Nucleic Acids Res. 47 (D1), D607-D613–D613. doi:10.1093/nar/gky1131
Tang, W., Wan, S., Yang, Z., Teschendorff, A. E., and Zou, Q. (2018). Tumor origin detection with tissue-specific miRNA and DNA methylation markers. Bioinformatics 34 (3), 398–406. doi:10.1093/bioinformatics/btx622
Tsuchida, N., Ryder, T., and Ohtsubo, E. (1982). Nucleotide sequence of the oncogene encoding the p21 transforming protein of Kirsten murine sarcoma virus. Science 217 (4563), 937–939. doi:10.1126/science.6287573
Vogelstein, B., and Kinzler, K. W. (2004). Cancer genes and the pathways they control. Nat. Med. 10 (8), 789–799. doi:10.1038/nm1087
Wang, S., Zhang, Y., Mu, H., and Pang, S. (2021). Identification of cancer trait genes and association analysis under pan-cancer. Curr. Bioinform. 16 (8), 1101–1114. doi:10.2174/1574893616666210601151306
Welman, A., Burger, M. M., and Hagmann, J. (2000). Structure and function of the C-terminal hypervariable region of K-Ras4B in plasma membrane targetting and transformation. Oncogene 19 (40), 4582–4591. doi:10.1038/sj.onc.1203818
Wennerberg, K., Rossman, K. L., and Der, C. J. (2005). The Ras superfamily at a glance. J. Cell. Sci. 118 (5), 843–846. doi:10.1242/jcs.01660
Westcott, P. M., Halliwill, K. D., To, M. D., Rashid, M., Rust, A. G., Keane, T. M., et al. (2015). The mutational landscapes of genetic and chemical models of Kras-driven lung cancer. Nature 517 (7535), 489–492. doi:10.1038/nature13898
Xu, Q., Zhang, G., Liu, Q., Li, S., and Zhang, Y. (2022). Inhibitors of the GTPase KRASG12C in cancer: A patent review (2019–2021). Expert Opin. Ther. Pat. 32 (5), 475–505. doi:10.1080/13543776.2022.2032648
Yang, Z.-Y., Wu, X. Y., Huang, Y. F., Di, M. Y., Zheng, D. Y., Chen, J. Z., et al. (2013). Promising biomarkers for predicting the outcomes of patients with KRAS wild-type metastatic colorectal cancer treated with anti-epidermal growth factor receptor monoclonal antibodies: A systematic review with meta-analysis. Int. J. Cancer 133 (8), 1914–1925. doi:10.1002/ijc.28153
Yoshihara, K., Shahmoradgoli, M., Martinez, E., Vegesna, R., Kim, H., Torres-Garcia, W., et al. (2013). Inferring tumour purity and stromal and immune cell admixture from expression data. Nat. Commun. 4, 2612. doi:10.1038/ncomms3612
Yu, L., et al. (2020). Prediction of drug response in multilayer networks based on fusion of multiomics data. Methods 192, 85. doi:10.1016/j.ymeth.2020.08.006
Yu, L., Wang, M., Yang, Y., Xu, F., Zhang, X., Xie, F., et al. (2021). Predicting therapeutic drugs for hepatocellular carcinoma based on tissue-specific pathways. PLoS Comput. Biol. 17 (2), e1008696. doi:10.1371/journal.pcbi.1008696
Yu, L., Zhao, J., and Gao, L. (2018). Predicting potential drugs for breast cancer based on miRNA and tissue specificity. Int. J. Biol. Sci. 14 (8), 971–982. doi:10.7150/ijbs.23350
Keywords: KRAS, tumor stage, cell infiltration, functional enrichment analysis, tumor microenvironment, prognostic biomarker
Citation: Zhao D, Wang L, Chen Z, Zhang L and Xu L (2022) KRAS is a prognostic biomarker associated with diagnosis and treatment in multiple cancers. Front. Genet. 13:1024920. doi: 10.3389/fgene.2022.1024920
Received: 22 August 2022; Accepted: 20 September 2022;
Published: 18 October 2022.
Edited by:
Zhibin Lv, Sichuan university, ChinaReviewed by:
Chen P. L, Huazhong Agricultural University, ChinaCopyright © 2022 Zhao, Wang, Chen, Zhang and Xu. This is an open-access article distributed under the terms of the Creative Commons Attribution License (CC BY). The use, distribution or reproduction in other forums is permitted, provided the original author(s) and the copyright owner(s) are credited and that the original publication in this journal is cited, in accordance with accepted academic practice. No use, distribution or reproduction is permitted which does not comply with these terms.
*Correspondence: Lei Xu, Y3NsZWl4dUBzenB0LmVkdS5jbg==
†These authors have contributed equally to this work
Disclaimer: All claims expressed in this article are solely those of the authors and do not necessarily represent those of their affiliated organizations, or those of the publisher, the editors and the reviewers. Any product that may be evaluated in this article or claim that may be made by its manufacturer is not guaranteed or endorsed by the publisher.
Research integrity at Frontiers
Learn more about the work of our research integrity team to safeguard the quality of each article we publish.