 Youlian Pan
 Yifeng Li
 Ziying Liu
 Jitao Zou
 Qiang Li
- 1Digital Technologies, National Research Council Canada, Ottawa, ON, Canada
- 2Department of Computer Science, Department of Biological Science, Brock University, St. Catharines, ON, Canada
- 3Aquatic and Crop Research and Development, National Research Council Canada, Saskatoon, SK, Canada
- 4National Key Laboratory of Crop Genetic Improvement, Huazhong Agricultural University, Wuhan, Hubei, China
Development of cold acclimation in crops involves transcriptomic reprograming, metabolic shift, and physiological changes. Cold responses in transcriptome and lipid metabolism has been examined in separate studies for various crops. In this study, integrated computational approaches was employed to investigate the transcriptomics and lipidomics data associated with cold acclimation and vernalization in four wheat genotypes of distinct cold tolerance. Differential expression was investigated between cold treated and control samples and between the winter-habit and spring-habit wheat genotypes. Collectively, 12,676 differentially expressed genes (DEGs) were identified. Principal component analysis of these DEGs indicated that the first, second, and third principal components (PC1, PC2, and PC3) explained the variance in cold treatment, vernalization and cold hardiness, respectively. Differential expression feature extraction (DEFE) analysis revealed that the winter-habit wheat genotype Norstar had high number of unique DEGs (1884 up and 672 down) and 63 winter-habit genes, which were clearly distinctive from the 64 spring-habit genes based on PC1, PC2 and PC3. Correlation analysis revealed 64 cold hardy genes and 39 anti-hardy genes. Cold acclimation encompasses a wide spectrum of biological processes and the involved genes work cohesively as revealed through network propagation and collective association strength of local subnetworks. Integration of transcriptomics and lipidomics data revealed that the winter-habit genes, such as COR413-TM1, CIPKs and MYB20, together with the phosphatidylglycerol lipids, PG(34:3) and PG(36:6), played a pivotal role in cold acclimation and coordinated cohesively associated subnetworks to confer cold tolerance.
Introduction
Wheat is the second most-produced cereal crop in the world; its yield and quality are severely affected by abiotic stress such as cold. During exposure to low but non-freezing temperature, plants increase their freezing tolerance in a process termed cold acclimation. Cold acclimation is a multi-genic processes, involves reprogramming of the transcriptome, proteome, lipidome, and metabolome, affects signaling between subcellular organelles, and induces significant changes in physiological processes and morphology (Li et al., 2018; Fürtauer et al., 2019; Li et al., 2021).
In response to cold stress, genetic and molecular analyses have identified dehydration-responsive element-binding protein 1/C-repeat binding factors (DREB1s/CBFs) as master transcription factors that regulate expression of cold regulated genes (CORs) during cold acclimation (Maruyama et al., 2009; Shi et al., 2018; Kidokoro et al., 2022). Many transcription factors regulate the cold-inducible expression of DREB1 gene in the very complex manner (Thomashow, 2010; Kidokoro et al., 2020). In the downstream, DREB1/CBF transcription factors upregulate many cold-responsive genes (CORs). Multiple COR genes are identified as CBF regulon (Tchagang et al., 2017; Song Y. et al., 2021; Liu et al., 2021) with respect to multiple stresses such as cold, heat, drought, and salt. The expression of the COLD REGULATED 314 THYLAKOID MEMBRANE 1 (COR413-TM1) correlates with cold tolerance (Breton et al., 2003). Overexpression of DREB1A (CBF3) improves stress tolerance to both freezing and dehydration in transgenic plants. Under cold and dehydration conditions, the expression of many genes encoding starch-degrading enzymes changes dynamically; many monosaccharides, disaccharides, trisaccharides, and sugar alcohols accumulate in Arabidopsis (Maruyama et al., 2009).
Winter habit plants require prolonged exposure to cold, such as winter, to promote flowering in spring through a process known as vernalization (Chouard, 1960; Amasino, 2005; Kim et al., 2009). The two important evolutionarily adaptive mechanisms, cold acclimation for winter hardiness and vernalization, are thus initiated within the same time frame upon low temperature exposure (Limin and Fowler, 2002; Danyluk et al., 2003; Li et al., 2018). Studies in Arabidopsis have shown that epigenetic regulation of FLC (FLOWERING LOCUS C) plays an important role in the vernalization (Crevillen et al., 2014); whereas, the FLC genes in cereal plants appear to be implicated in many other aspects of plant growth and development in addition to vernalization (Kennedy and Geuten, 2020).
In wheat, VRN1, together with VRN2 and VRN3, forms a pivotal regulatory module for its vernalization process (Oliver et al., 2009; Chen et al., 2018). Genetic studies revealed that the two loci on chromosome 5A, Frost Resistance-1 (FR-1) and FR-2 affect freezing tolerance and winter hardiness of the temperate cereal plants (Knox et al., 2010; Fowler et al., 2016). FR-1 is believed to be a pleiotropic effect of VRN-A1 (Brule-Babel and Fowler, 1988). The FR-2 QTL loci spanning on chromosome 5A contains a number of genes including a cluster of 21 genes encoding CBFs which are involved in cold acclimation (Vágújfalvi et al., 2003). VRN-A1 appears to down-regulate the expression of COR genes in the CBF regulon adjacent to the FR-2 locus in cold acclimated winter cereals (Limin and Fowler, 2006) indicating an interaction between VRN-A1 and FR-2 loci (Zhu et al., 2014). Low temperature induces the expression of VRN1s, while genes in cold pathways including CBFs and CORs are repressed (Danyluk et al., 2003; Li et al., 2018). On the other hand, CBF proteins are believed to directly bind the promoter of the VRN1s to repress flowering by negatively regulating its expression in cereals (Dhillon et al., 2010; Deng et al., 2015).
Changes in membrane fluidity, cytoskeleton rearrangement, and calcium influxes are among the earliest events taking place in plants upon exposure to low temperatures (Browse and Xin, 2001; Kidokoro et al., 2022). Membrane lipid unsaturation has been well documented for its role in low temperature adaptation in plants (Wolf et al., 2001; Zheng et al., 2021), while a lower membrane unsaturation level is favored under high temperature (Murakami et al., 2000). In addition, the level of desaturated Phosphatidylglycerol (PG) which contains a combination of 16:0, 18:0 and 16:1-trans fatty acids in PG is related to low temperature adaptability of plants (Murata and Los, 1997). Moreover, the reduction of trans-Δ3 hexadecenoic acid (t16:1) has been shown to be correlated with freezing tolerance, especially in cereal crops such as wheat (Huner et al., 1989; Li et al., 2021). Studies have also proposed that adjustment in lipid redistribution between the two glycerolipid pathways as well as lipid exchanges between the ER and chloroplast is critical for temperature adaptation in plants (Li et al., 2015).
Our previous study investigated the interactions between vernalization and cold acclimation pathways in the crown tissue (Li et al., 2018). Further analysis in leaf tissue revealed a mechanistic role of trans-16:1 in PG as a specific metabolite marker for screening freezing tolerance in wheat and genes in lipid pathways were specifically investigated (Li et al., 2021). However, the complexity of gene regulatory networks involved in mediating cold responses as well as lipid metabolism in leaves has not been fully explored. In this paper, we employed four wheat genotypes, winter habit Norstar (N), spring habit Manitou (M), and their near isogenic lines (NILs), winter Manitou (WM) and spring Norstar (SN) with the VRN-A1 alleles swapped (Limin and Fowler, 2002), to study the cold acclimation process in leaves through computational pattern recognition, principal component analysis, and genes and lipids association networks. Genes associated with cold acclimation are identified and characterized.
Results
Transcriptome overview
In this study, RNA-seq data were obtained from leaves grown under low temperature treatment of four wheat genotypes with different LT50s (temperatures at which 50% of a population survives in an artificial freeze test), including Norstar (N, LT50 = −21.7°C), Manitou (M, LT50 = −8.3°C) and their near isogenic lines (NILs) spring Norstar (SN, LT50 = −13°C) and winter Manitou (WM, LT50 = −13.2°C) with the VRN-A1 alleles swapped (Li et al., 2021). On average, 93% of the 26 million reads per sample that satisfied filtering criteria were mapped to the 106,914 known high confident wheat genes in the IWGSC RefSeq v2.1 genome assembly, from which, 12,676 differentially expressed genes (DEGs, Supplementary File S1) were identified based on criteria provided in the Materials and Method Section (|log2 fold-change| ≥ 2, adjusted p-value ≤ 0.01, and the maximum number of transcripts per million reads in a pair of compared samples ≥2, Figure 1). Between the cold treated samples and controls, the number of DEGs were spring Norstar (SN) > Norstar (N) > winter Manitou (WM) > Manitou (M) (Table 1). When the winter-habit genotype was compared with its respective near isogenic line (NIL) of spring-habit genotype, the difference between N and SN was more than three times as many DEGs as between WM and M in the cold treated samples, but the difference was only at about 1.4 times in the control samples (Table 1).
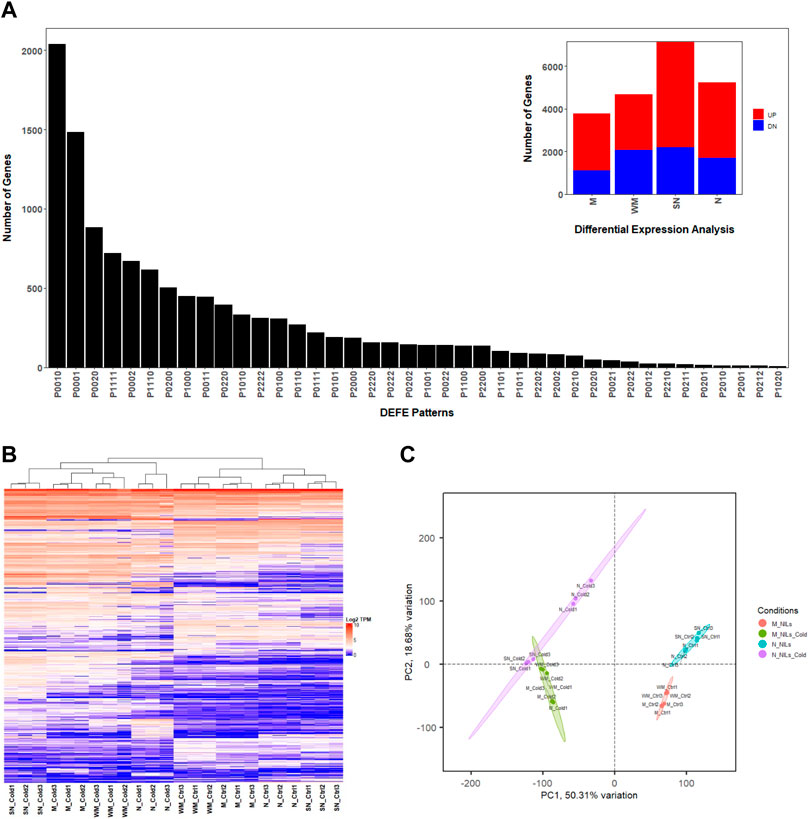
FIGURE 1. Transcriptome overview based on the 12,676 DEGs. (A) Frequency distribution (insert) and top 40 patterns of P series of DEFE analysis; (B) Heatmap; (C) Principal component analysis, where PC1 and PC2 are principal components 1 and 2, respectively.

TABLE 1. Number of DEGs in each pair-wise comparison.
Three series of differential expression feature extraction (DEFE, Pan et al., 2022) analyses were performed. The P series [the cold treated samples compared with their respective controls, P(M, WM, SN, N); see Material and Method Section for details] revealed the numbers of DEGs unique to each genotype were SN (2920, P0010 = 2036, P0020 = 884) > N (2156, P0001 = 1484, P0002 = 672) > WM (811, P0100 = 308, P0200 = 503) > M (637, P1000 = 450, P2000 = 187, Figure 1A). There were 1035 common DEGs (DEFE patterns: P1111 = 722, P2222 = 313) among the four wheat genotypes (Figure 1A). Across all four genotypes, there were more DEGs up-regulated than down-regulated when subjected to cold treatment (Table 1). The top DEFE expression pattern was unique up-regulation to SN (P0010 = 2036), which were followed by those unique up-regulation to N (P0001 = 1484). Among the number of uniquely down-regulated genes, SN had the highest number (P0020 = 884) and followed by N (P0002 = 672). Gene Ontology enrichment analyses of the genes unique to each genotype and common DEGs are available in Supplementary File S2.
Principal component analysis indicated that over 78% of variance were explained collectively by the first three principal components (PC1, PC2, and PC3). PC1 explained 50% variance related to cold treatment and clearly separated cold treated samples from the controls (Figure 1C and Supplementary Figure S1A). PC2 explains over 18% of variance in the differences between the two pairs NILs, and to some degree the between winter-habit and spring-habit as well (Figure 1C and Supplementary Figure S1B). PC3 explained 9% variance mainly associated with difference between winter-habit and spring-habit (Supplementary Figure S1).
Within each pair of NILs, we sought to understand the difference between genotypes of winter-habit (WM and N) and spring-habit (M and SN), and also the similarity and difference in gene expression profiles between the two pairs of NILs (N vs. SN; WM vs. M). Under cold treatment, we identified 1515 up-modulated genes and 2085 down-modulated between the winter-habit Norstar as compared to its spring-habit counterpart spring Norstar (C*1, C*2, Supplementary Figure S2A), the majority of which were unique to the N and SN pair (C01 = 1284, 85%; C02 = 1883, 90%). In comparison, the contrast between winter Manitou and Manitou was smaller (C1* = 360, C2* = 719; C10 = 171, 48%; C20 = 475, 66%). The disparity in the number of DEGs between these two pairs of NILs appeared to be related to the difference in freezing tolerance (delta LT50) between winter-habit and spring habit genotypes in each NIL. The delta LT50 is 8.7 between N and SN, but 4.9 between WM and M. Between the two pairs of NILs under cold treatment, they shared 189 genes up- and 202 down-modulated genes of winter-habit genotypes versus their respective spring-habit counterparts (C11, C22). In the control samples, the difference between the winter-habit and the spring-habit genotypes within each pair of NILs were not as drastic as those under cold treatment (Supplementary Figure S2B). Collectively, between the winter-habit and spring-habit genotypes, we found 4246 DEGs when treated with cold (C**), but 1898 DEGs in the controls (K**).
Genes specific to winter-habit and spring habit
With regard to the winter-habit specific genes, we were particularly interested in those that were commonly differentially expressed in both winter-habit genotypes (N and WM), but not in either of the spring-habit genotypes (SN and M) when they were subjected to cold treatment. These genes could be represented by DEFE patterns P0101 (191 genes) and P0202 (144 genes) for up- and down-regulation, respectively. The genes up- or down-regulated in spring-habit, but not winter-habit genotypes as a result of cold treatment were represented by P1010 (335 genes) and P2020 (48 genes). Under cold treatment, up- or down-modulated in the winter-habit when compared with their spring-habit NIL pair (C11 = 189, C22 = 202), but not in the controls (K00), could be considered as supporting evidence of functional significance in low temperature adaptation. Integrating these three series of DEFE patterns, 63 genes were found to be up-regulated by cold, specific to both winter-habit genotypes (P0101∩C11∩K00 = 63, Table 2), while seven genes were down-regulated (P0202∩C22∩K00 = 7). On the contrary, 64 genes were found to be up-regulated by cold, specific to both spring-habit genotypes (P1010∩C22∩K00 = 64), while two genes were down-regulated (P2020∩C11∩K00 = 2) (see Supplementary File S3 tab Lists). These four groups of genes were distinctive in the three dimensional space represented by the first three principal components (PC1, PC2, and PC3 (Figure 2A and Supplementary Table S1).
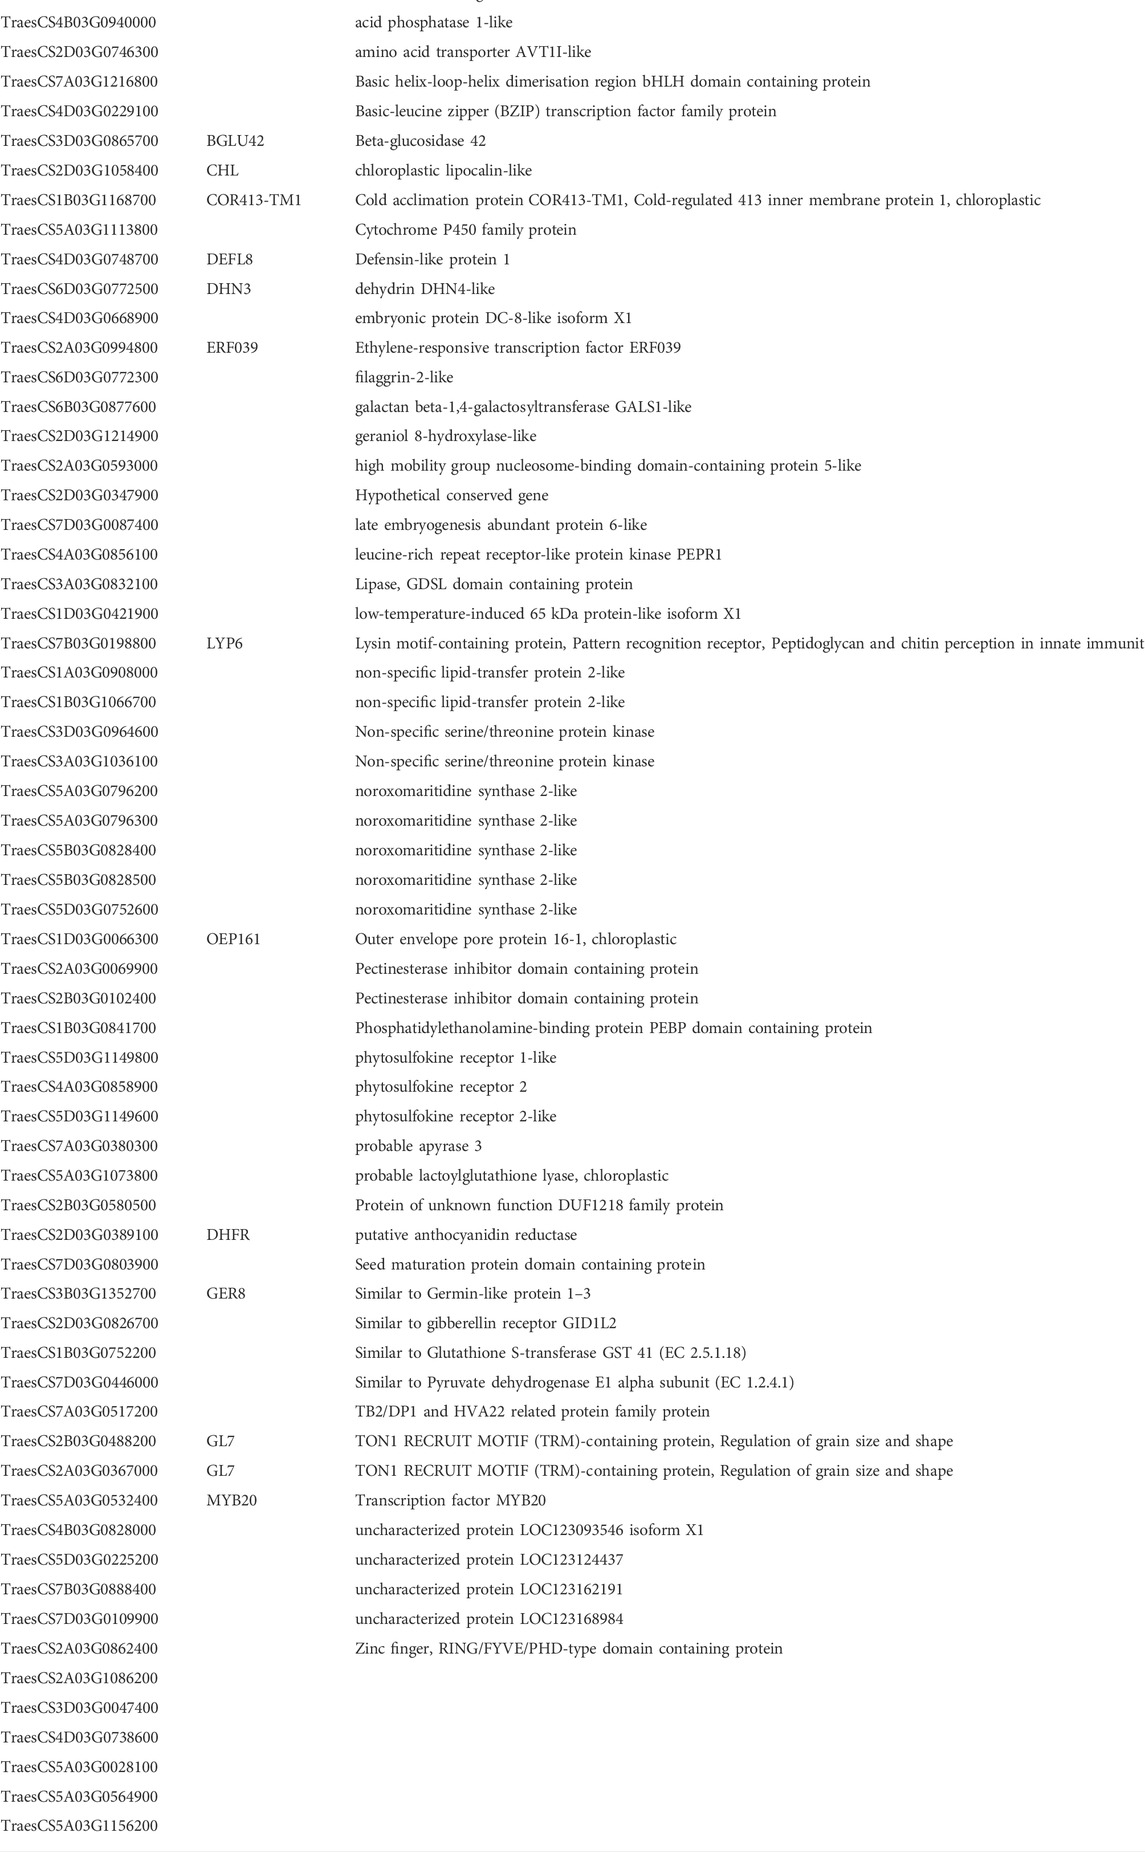
TABLE 2. Winter-habit genes.
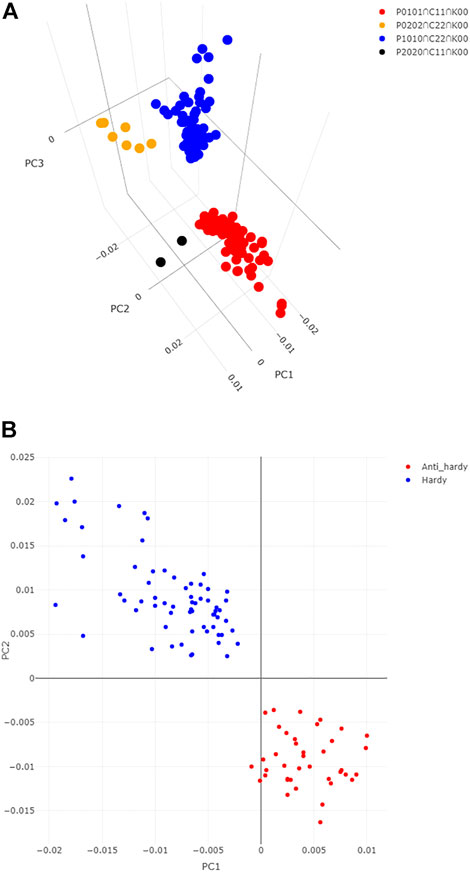
FIGURE 2. Distinction of genes associated with cold acclimation from the others. (A) Distinction of the 63 WHGs from the other three groups of DEGs identified in DEFE analysis as revealed by their scores of the first three principal components. (B) Distinction of the 64 cold hardy genes from the 39 anti-hardy genes revealed by their scores of the first two principal components. Where, PC1, PC2, and PC3 are the principal components 1, 2, and 3.
We named the 63 genes up-regulated specifically in both winter-habit genotypes (P0101∩C11∩K00) as winter-habit genes (WHGs) and the 64 genes up-regulated specifically in both spring-habit genotypes as spring-habit genes (SHGs). Gene Ontology enrichment analysis indicated that WHGs were highly represented by genes with functions in cold acclimation, embryo development ending in seed dormancy, regulation of monopolar cell growth, response to abscisic acid, response to lipid, oxidoreductase activity, acting on paired donors, with incorporation or reduction of molecular oxygen, and heme binding among others (see Supplementary File S3 tab GO_P0101∩C11∩K00). On the other hand, four of the seven genes suppressed by cold treatment in the two winter-habit genotypes had GO annotations that were enriched with calcium-dependent phospholipid binding (TraesCS1B03G0711800), passive transmembrane transporter activity (TraesCS5B03G0835100), fatty acid biosynthetic process (TraesCS7D03G0081000), and glucosidase activity (TraesCS7A03G0020800) that includes sucrose alpha-glucosidase activity (GO:0004575) and beta-fructofuranosidase activity (GO:0004564) (see Supplementary File S3 tab GO_P0202∩C22∩K00).
Under cold treatment, the 64 up-regulated genes specific in the two spring-habit genotypes (P1010∩C22∩K00) were enriched with phosphatidylethanolamine binding, photoperiodism, flowering, oxidoreductase activity, acting on single donors with incorporation of molecular oxygen, S-adenosylmethioninamine biosynthetic process, RNA polymerase II transcription regulatory region sequence-specific DNA binding, and inositol 3-alpha-galactosyltransferase activity among others (see Supplementary File S3 tab GO_P1010∩C22∩K00). Genes down-regulated in the spring-habit genotypes were enriched with cell redox homeostasis, and protein-disulfide reductase activity (see Supplementary File S3 tab GO_P2020∩C11∩K00).
Both WHGs and SHGs groups were enriched with genes encoding oxidoreductase enzyme activities. In this regard, the 63 WHGs included genes encoding a geraniol 8-hydroxylase-like (TraesCS2D03G1214900), an indole-2-monooxygenase-like isoform X1 (TraesCS5A03G1113800), and five noroxomaritidine synthase 2-like (TraesCS5A03G0796200, TraesCS5D03G0752600, TraesCS5B03G0828500, TraesCS5A03G0796300, and TraesCS5B03G0828400); these seven genes acted on paired donors (GO:0016705). Whereas, the 64 SHGs include genes encoding a lipoxygenase (TraesCS5D03G0104900, EC:1.13.11.12), a linoleate 9S-lipoxygenase (TraesCS6B03G0405500, EC:1.13.11.58), and two uncharacterized proteins both involved in oxidoreductase activity and metal ion binding (TraesCS6D03G0269100 and TraesCS6D03G0269200); these four genes acted on single donors (GO:0016701). We thus further looked into the redox pathway and uncovered four peroxiredoxin genes for the DEG list (Figure 3). They were all highly expressed in the most winter hardy Norstar under cold treatment, but the three gene encoding peroxiredoxin-2E-2 were down-regulated in spring Norstar.
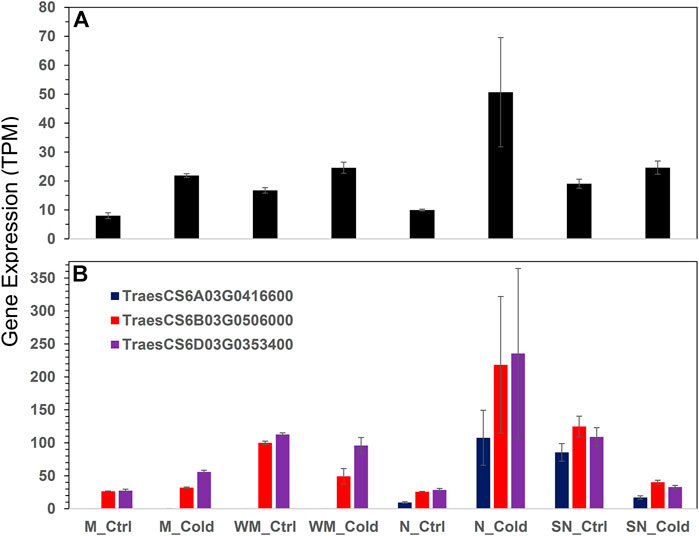
FIGURE 3. Expression of peroxiredoxins across all samples. (A) peroxiredoxin-2F, mitochondrial isoform X1, (B) peroxiredoxin-2E-2, chloroplastic-like. Error bars are one standard error of the mean of three replicates.
Genes associated with cold hardiness
We scaled cold hardiness of each genotype based on their LT50 value (Li et al., 2021) according to the following formula (Table 3):
where, H is termed as cold hardiness index, LT50 is the half lethal temperature of a genotype, −25°C is the temperature below which most wheat genotypes would perish (Skinner and Garland-Campbell, 2008; Li et al., 2021). We considered a gene to be associated with cold hardiness, and therefore defined as cold hardy gene when the log2 fold change values and the expression values of the four genotypes under cold treatment were both significantly correlated (p ≤ 0.05) with the defined cold hardiness (Table 3); in addition, the expression values in all four genotypes under cold treatment were higher than their controls. Conversely, a gene would be considered anti-hardy when 1) it was significantly down-regulated by cold in the extreme hardy genotype Norstar, and 2) both log2FC and expression values were negatively correlated with the defined cold hardiness index among the four genotypes (Table 3). From the 12,676 DEG, 64 emerged as cold-hardy genes (Table 4) and the anti-hardy genes accounted 39 (Supplementary File S4; also in Supplementary File S1, “1” and “−1” in tab DEGs col AH). These two group of genes had distinctive variance distribution in the expression profiles as revealed in PC1 and PC2 two dimensional space (Figure 2B).
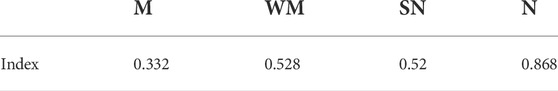
TABLE 3. The cold hardiness indices of the four genotypes in this study.
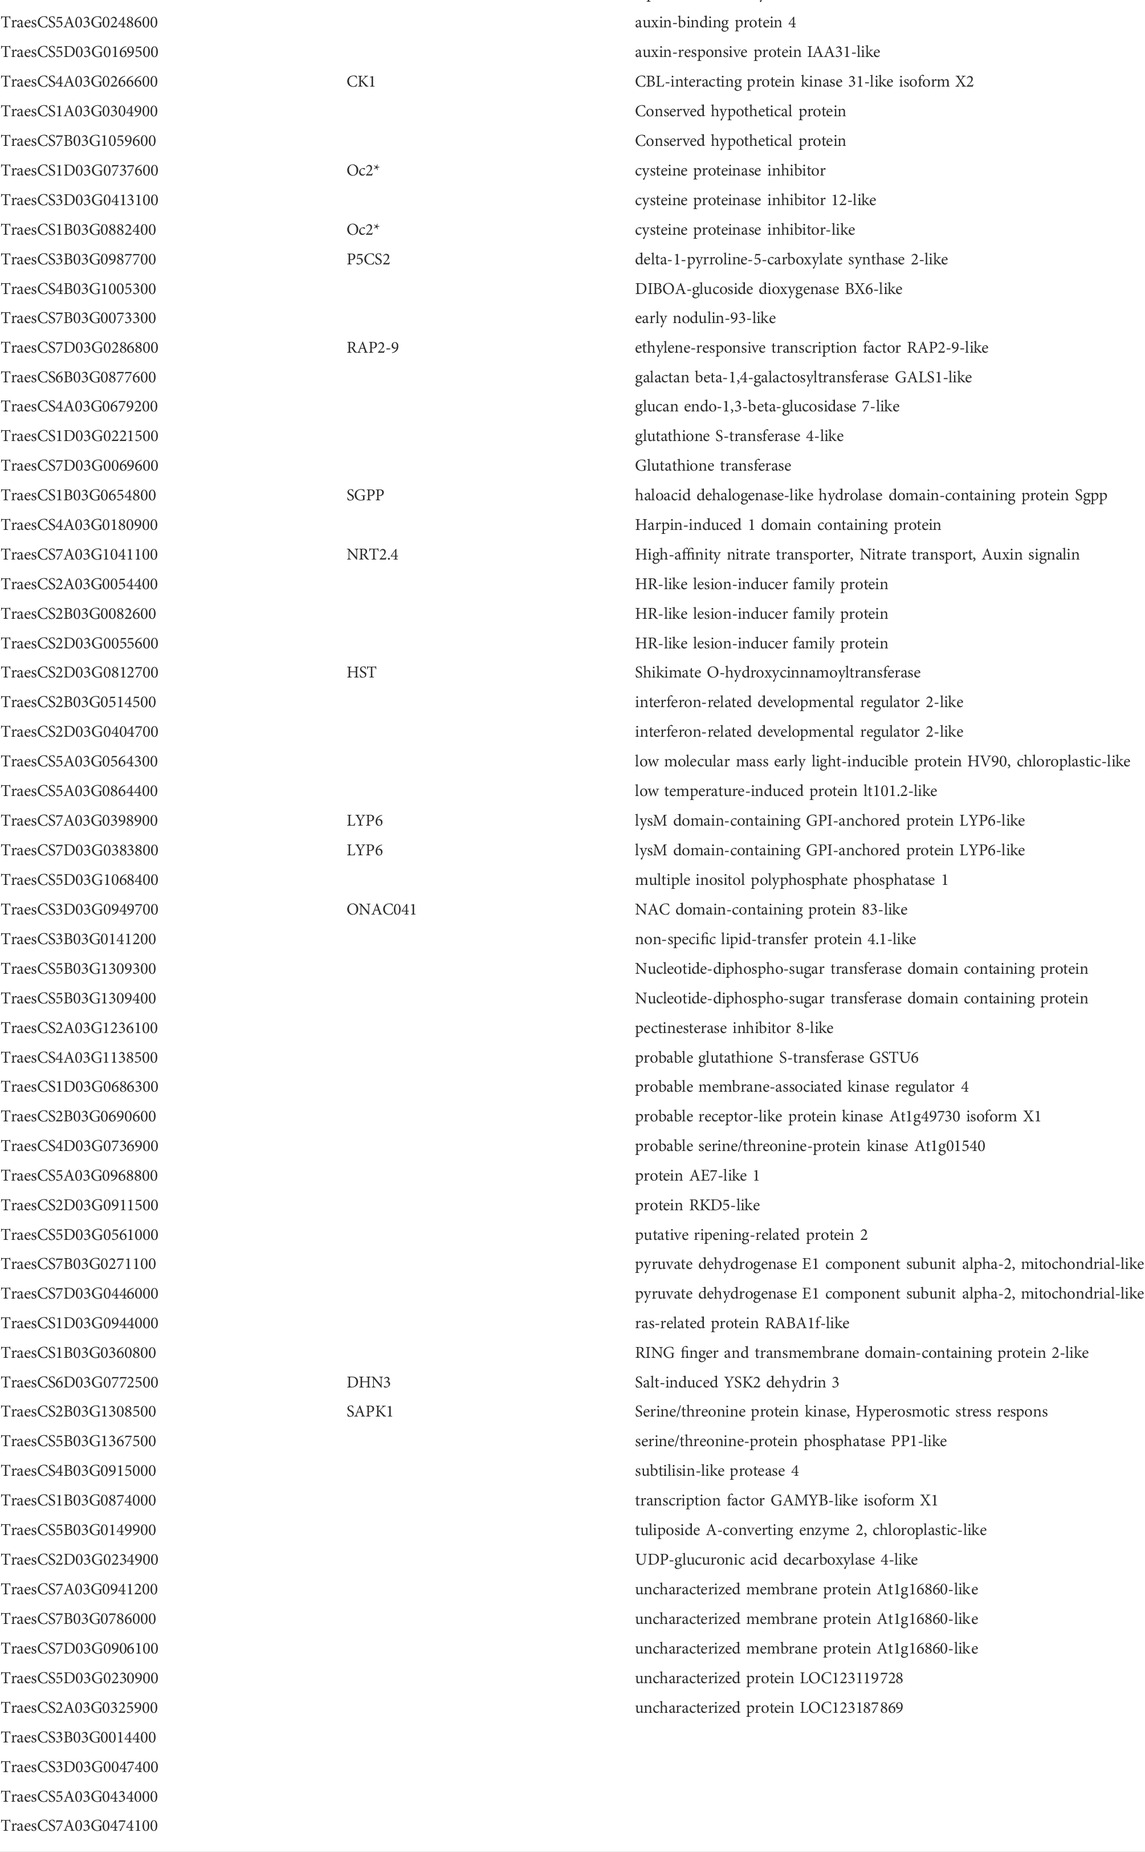
TABLE 4. Cold-Hardy genes.
The differences in cold hardiness index between N and SN (0.348, or delta LT50 = 8.7) was 1.8 time of that between winter Manitou and Manitou (0.196 or delta LT50 = 4.9). We compared the same difference in fold changes of differential expression between the two pairs of NILs and found that 29 of the 64 cold hardy genes had the same or larger extent of difference in their differential expression between the two pairs. In contrast, none in the 39 anti-cold-hardy genes had such an extent of difference. Orthology search against Brachypodium distachyon, Oryza sativa, and Arabidopsis thaliana indicate that the 64 cold hardy genes include genes encoding auxin responsive protein IAA31-like and auxin-binding protein 4; an early nodulin, OSENOD93B; high-affinity nitrate transporter, NRT2.4 that involves both nitrate transport and auxin signalling; HR-like lesion-inducer family protein, lysin motif-containing protein, LYP6; no apical meristem (NAM) protein domain containing protein and others (Table 4 and Supplementary File S4).
There were four cold hardy genes (6.25%) among the 63 WHGs, and the percentage of total 64 cold hardy genes in the entire list of 12,676 DEGs was 0.50%. Therefore, the WHGs contained over 10 time enrichment of cold hardy genes as compared to the entire list of DEGs. These four genes included a galactan beta-1,4-galactosyltransferase (TraesCS6B03G0877600, EC:2.4.1.-), a salt-induced YSK2 dehydrin 3 (DHN3, TraesCS6D03G0772500), and a pyruvate dehydrogenase E1 component subunit alpha 2, mitochondrial isoform (TraesCS7D03G0446000, EC:1.2.4.1) and an unknown gene (TraesCS3D03G0047400). Gene ontology enrichment analysis indicated that the 64 cold hardy genes were enriched with cellular response to water deprivation and cold, chloroplast mRNA processing, kinase inhibitor activity, cysteine-type endopeptidase inhibitor activity, auxin binding among others detailed in Supplementary File S4 tab GO_Hardy.
Gene-lipid association network analyses
Since membrane lipids are known to be altered in response to cold stress and in cold acclimation processes (Li et al., 2015; Li et al., 2021), we combined the 12,676 DEGs with 224 lipid traits in association network and clustering analyses to explore associations between transcriptome and lipidome.
Correlation analyses between all 12,676 DEGs and 224 lipid traits together with five experimental conditions (cold treatment, winter-habit, spring-habit, winter-habit genotypes treated with cold, spring-habit genotypes treated with cold) indicated that majority (58 and 62 genes, respectively) of the 63 WHGs and 64 SHGs were positively correlated with the respectively designated experimental conditions (Supplementary File S3 tab geneTraitCor_R). These two groups of genes correlate with distinctive lipidomics profiles (Table 5). For example, the WHGs were positively correlated with phosphatidylglycerol lipids PG(34:3), PG(34:2), and PG(36:6), most of monogalactosyldiacylglycerol (MGDG) and digalactosyldiacylglycerol (DGDG), total phosphatidylcholine (PC) and total phosphatidylethanolamine (PE), but negatively with PG(34:4), PG(34:1) and total PG. Whereas, high percentage the SHGs were significantly correlated with lysophosphatidylcholines (LPCs) and phosphatidylinositols (PIs).
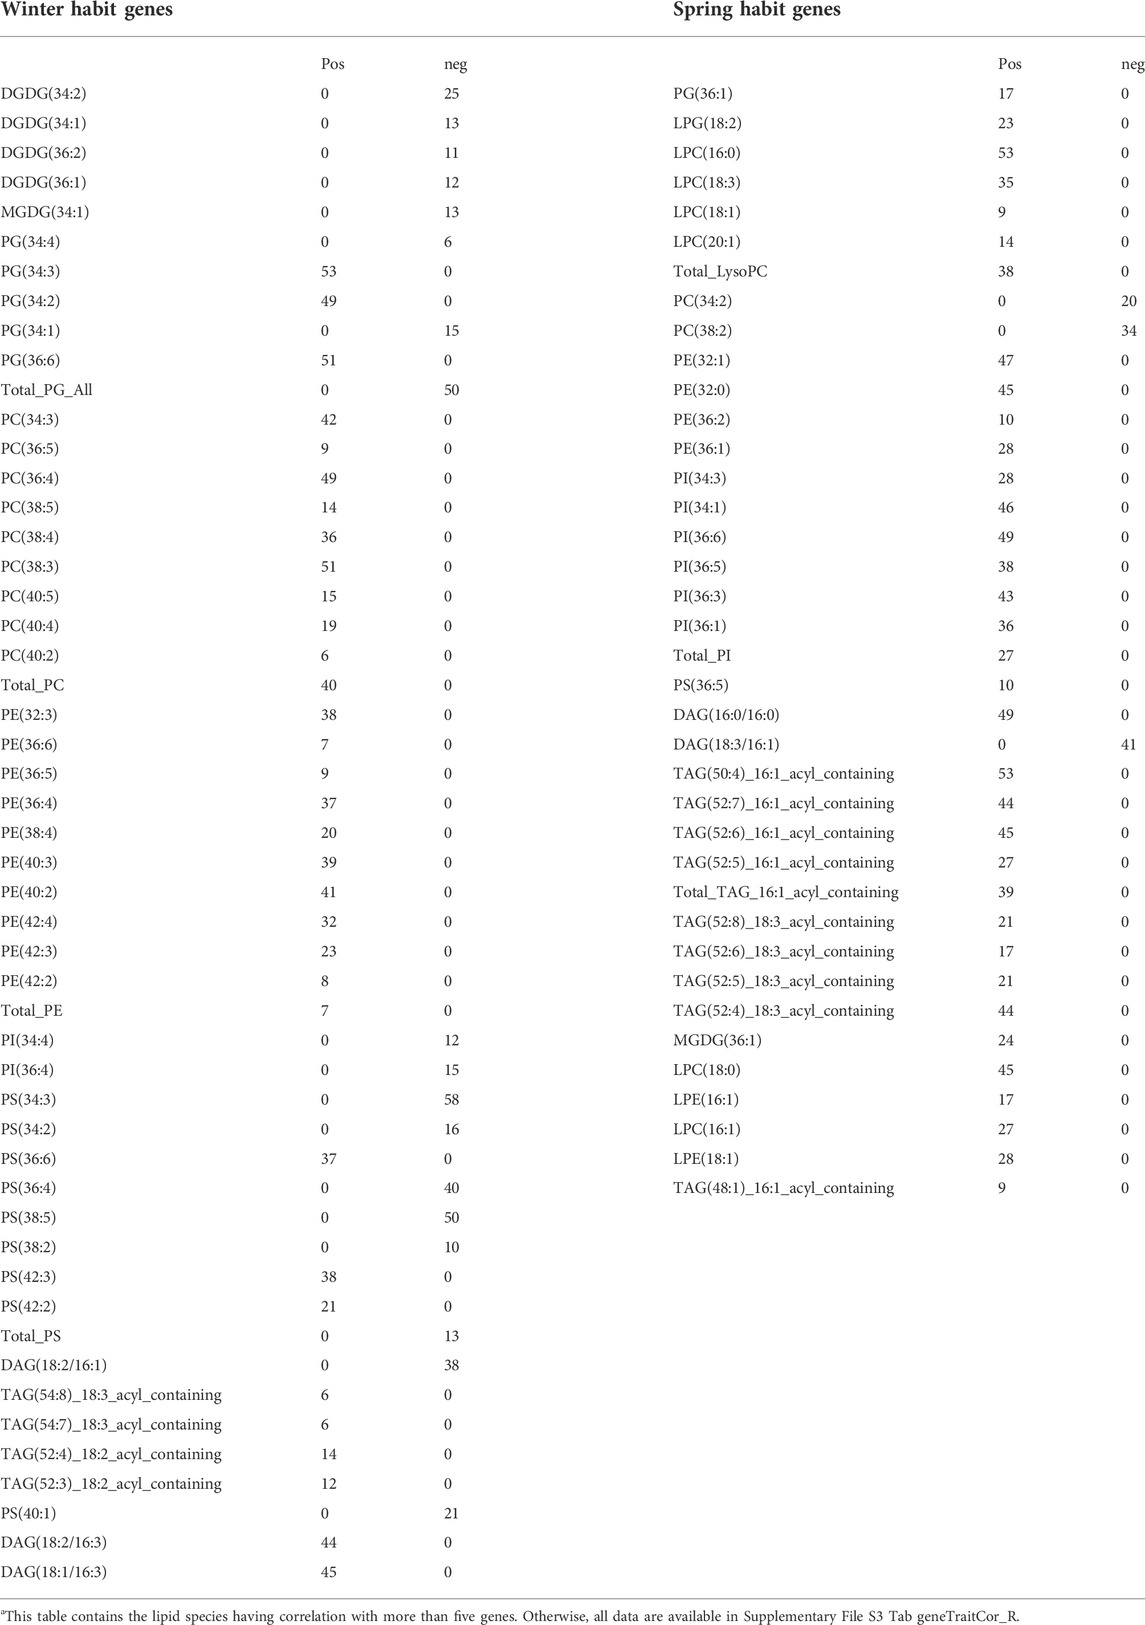
TABLE 5. Number of winter-habit genes (lefta) or spring-habit genes (right) correlated with respective lipid species.
By using topology overlap matrix in the WGCNA R package (Langfelder and Horvath, 2008), the network association degree and cluster membership of each gene were obtained and presented in Supplementary File S1. Correlation analyses were performed between each gene cluster and each lipid trait in addition to experimental design. Among the 50 clusters generated, six were significantly correlated (p < 0.05) with cold treatment to the two winter-habit genotypes, and together contained 71% of the WHGs (Supplementary File S1 tab ClusterTraitCor). The remaining 18 WHGs were in another large cluster less significant correlated with cold treatment to the two winter-habit genotypes (p = 0.067). Similarly, other eight clusters were significantly correlated to cold treatment to the two spring-habit genotypes and contained all 64 SHGs that were found through the aforementioned DEFE analysis. The cluster membership of these two groups was distinct. The association network analysis showed that none of the genes in the two groups were directly associated, through neither their immediate nor secondary neighboring nodes (Supplementary File S3 tabs WHGs_nodes and SHGs_nodes), thereby implying distinct functional space between the two groups of genes and lipids.
Similar analysis between the cold hardy genes and anti-hardy genes were conducted. These two groups were also well separated by distinctive lipidomic profiles, subnetworks, and cluster membership. Interestingly, all 64 cold hardy genes were positively collected with PG(34:3) and PG(36:6). In addition, the majority (64%) of the cold hardy genes were negatively correlated with PG(34:4) (Supplementary File S4 tab geneTraitCor_R).
As for network analysis, we extract the top 1% of the topology overlap matrix, which consists of 6,743 nodes connected with 825,776 edges. For the purpose of this study, we focus on the following subnetworks relevant to cold acclimation. We first defined the association strength (AS) of a subnetwork by using average connection degree of all nodes in the sub-network normalized by total number of nodes in the subnet:
WHG subnet
Fifty-one genes (81%) among the 63 WHGs were associated with at least one other gene in the group with an average connection degree of 33.5. Thus, the overall AS of the WHG subnet was 0.64. The top hub genes included a lipase, GDSL domain containing protein, orthologous to rice gene OsGELP26 (Os01g0827700, connection degree = 44), a HVA22-like protein orthologous to OsEnS-122 (Os08g0467500, 44), a galactan beta-1,4-galactosyltransferase (EC:2.4.1.-, 44), an AAA-ATPase orthologous to At5g57480 (TraesCS5B03G0571900, 43), two pectinesterase inhibitor domain containing protein (Os04g0106000, 44 and 42), two non-specific serine/threonine protein kinases (TraesCS3D03G0964600, TraesCS3A03G1036100, both 42), a defensin (DEFL8, Os03g0130300, 42), pyruvate dehydrogenase E1 component subunit alpha (Os06g0246500, EC:1.2.4.1, 41), transcription factor MYB20 (AT1G66230, 41), a Glutathione S-transferase GST (EC:2.5.1.18, 41), a pathogenesis-related transcriptional factor and ERF domain containing protein OsERF#034 (Os04g0550200, 40), and a cold acclimation protein COR413-TM1 (Os05g0566800, 37). COR413-TM1 was directly associated with all other hub genes mentioned above (Figure 4). A homoeolog of COR413-TM1 on chromosome 1A was directly associated with PG(34:3). Both homoeologs of COR413-TM1 were highly expressed in the two winter-habit genotypes (Figure 5). More details are available in Table 2 (Supplementary File S3 tab WHGs_nodes).
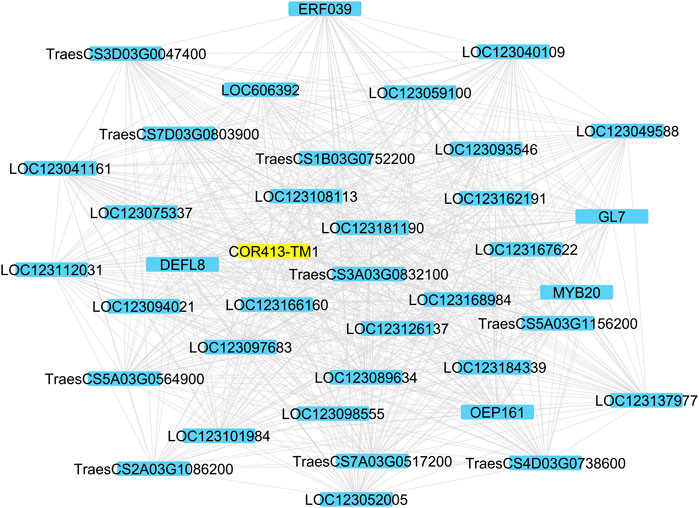
FIGURE 4. The cold acclimation genes directly associated with the Cold acclimation protein COR413-TM1 highlighted. Details are available in Supplementary File S3.

FIGURE 5. Expression of two homoeologs of COR413-TM1 gene in different experimental conditions.
The associations among the 64 SHGs were very loose; only 27 genes (42%) have a direct neighbor within the group and spread over two subnets (Supplementary Figure S3). Collectively among the 27 genes, the association strength was 0.12 (Supplementary File S3 tab SHGs_nodes).
Cold hardy subnet
Similarly, we investigated the subnet of cold hardy versus anti-hardy genes. Among the 64 cold hardy genes, 61 (95%, Table 4 and Supplementary Figure S4A) were inter-associated with at least another gene within the subnet and have an association strength of 0.41. In addition, the cold hardy subnet had four points of contact with the WHGs subnet as described above. All the four points of contact were the hub nodes in both subnets. Phosphatidylglycerol lipids PG(34:3) and PG(36:6) were hub nodes in the cold hardy subnet with connection degrees of 22 and 10, respectively. Only 13 (33%) of the 39 anti-hardy genes have direct association with another gene within the group and they all were directly associated with PG(34:4) (Supplementary Figure S4B). More details are available in Supplementary File S4 tabs ColdHardy_nodes and AntiHardy_nodes). Two distinctive schools of network nodes were evident, one was represented by PG(34:3) and PG(36:6) and consisted of genes closely associated with cold hardiness, while the other was represented by PG(34:4) and consisted of genes closely associated with anti-hardy (Supplementary File S5).
Vernalization subnet
The list of 12,676 DEGs included eight vernalization genes, three VRN1 (TraesCS5A03G0935400, TraesCS5B03G0986000, and TraesCS5D03G0894800), four VRN2 (TraesCS4B03G0958300, TraesCS4D03G0834500, TraesCS4D03G0834600, and TraesCS5A03G1265900), and one VRN3 (TraesCS7B03G0031800) (Figure 6). The VRN1 genes were highly up-regulated by cold in all four wheat genotypes, while their expression were higher in the two spring-habit genotypes (M and SN) than the winter-habit ones. The VRN3 gene was up-regulated by cold treatment in the two spring-habit genotypes, while there was no effect in the two winter-habit genotypes. The VRN2 were generally down-regulated by cold treatment. The VRN2 and VRN3 genes were not involved in the gene association network. Collectively, there were 214 genes in direct association with the three VRN1s, and they were interconnected to form a highly cohesive network with AS at 0.83. Nevertheless, these VRN1 genes had no association even at the secondary neighborhood with either WHGs or cold hardy genes. From the 64 SHGs, one appeared in the VRN1 immediate neighborhood and 42 other genes in the secondary neighborhood (Supplementary File S7). The VRN-B1 (TraesCS5B03G0986000) had a direct association with the phospholipid-transporting ATPase (ALA1, EC:7.6.2.1, TraesCS4B03G0491700) as a single lipid gene in the immediate neighborhood of VRN1 genes. There were other 19 lipid genes in the secondary neighborhood of VRN1 genes.
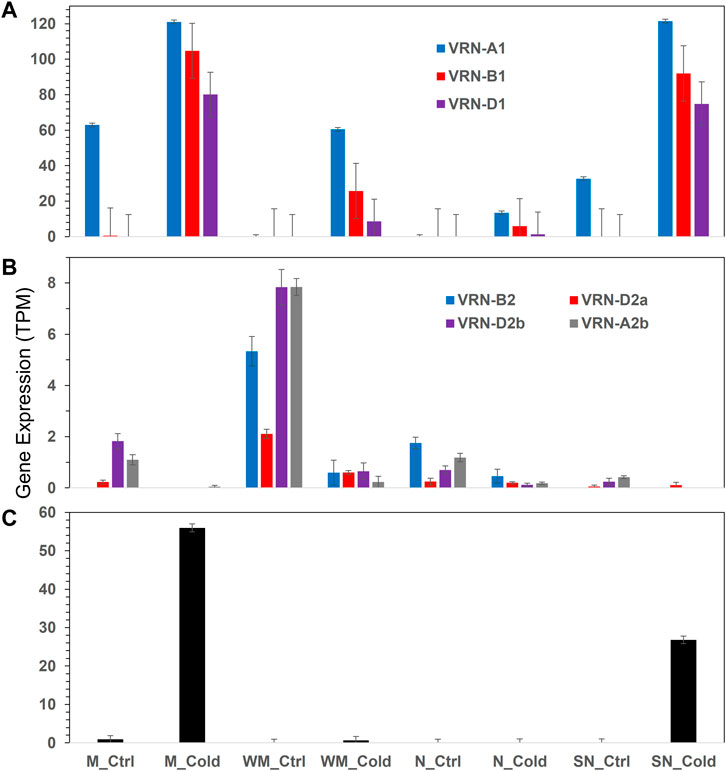
FIGURE 6. Expression of vernalization genes in different experimental conditions. (A) VRN1, (B) VRN2, (C) VRN3. Error bars are one standard error of the mean of three replicates. More details are available in Supplementary File S7.
Discussions
Overview–Integrative computational insights
Cold acclimation are investigated by integration of transcriptomics and lipidomics with various computational approaches including differential expression feature extraction, principal component analysis, correlation analysis, and gene-association network analyses. The differential expression feature extraction approach is a simple and effective pattern recognition method to find expression patterns in various conditions. Through integrating three differential expression feature extraction schemes, 63 winter-habit genes and 64 distinctive spring-habit genes are found. Correlation analysis reveals 64 cold hardy genes and 39 distinctive anti-hardy genes. The integration of transcriptomics and lipidomics analyses identifies two distinctive schools of network nodes (Supplementary File S5). The dimension reduction through principal component analysis is able to explain the majority of variance associated with cold treatment, cold hardiness, between winter-habit and spring-habit, and between two schools of network nodes in the reduced one, two, or three dimensional space represented by the first three principal components: PC1 for cold treatment, PC1+PC2 for cold hardiness and for two schools of network nodes, and PC1+PC2+PC3 for winter-habit and spring-habit. The distinction between the contrasting groups in each scenario is confirmed by integration of these methods. For example, the variance distribution with regard to the contrast between WHGs and SHGs is revealed by the differential expression feature extraction method and confirmed by principal component analysis, lipidomics association, and gene association network propagation. From gene association network perspective, the WHGs are highly associated among themselves as well as with others outside of the group. The association among the 64 SHGs, on the other hand, were very loose as indicated by the proportion of genes involved in the network and the network association strength. The same analogy is applied to the scenario between cold hardy and anti-hardy genes. These three scenarios of knowledge discovery indicate that there is no way of one-size-fit-all approach in the computational pipeline. Each case would have to be designed according to the characteristics of variance distribution in combination with domain knowledge. These pairwise contrasting analysis reveals that WHGs and cold hardiness are unique and yet they are inter-related to certain extent. They are two innate concerted efforts of plants to deal with cold stress.
Limitations and complements
The four genotypes of reciprocal NILs used in this study inspire significantly to the design for this and earlier experiments and indeed help achieving much progress in the field of cold tolerance research in cereal plants (e.g. Limin and Fowler, 2002; Li et al., 2015, 2018, 2021). Nevertheless, the success of computational investigation requires significant sample size, balanced distribution of sample types, and data consistency within each type of samples. The most obvious limitation to the methods and analysis in this study is the small sample size of this dataset, which creates high imbalance between the sizes of sample space and the number of genes, known as the curse of dimensionality. Principle component analysis is a typical method for dimension reduction and able to explain the main variance in this study in one, two, or three dimensional spaces and reveals the distinction between contrasting groups.
The limitation of small sample size is most obvious in network analysis of this study, the size of eight samples is below the conventional necessity for a successful systemic network study such as the AraNet, which comprises from many distinct types of interactions, and millions of experimental or computational observations from diverse data types over decades of studies in Arabidopsis thaliana (Lee et al., 2010; Lee and Lee, 2017). To complement this limitation, we take the top 1% from the topology overlap matrix to reduce the false positive. Taking such high stringency would certainly sacrifice information. For example, the three VRN1 homoeologs have similar network connections and high correlation in expression profile between themselves and in the same cluster; technically, they should be directly inter-connected too. But actually, they are not under the current selection criteria. The homoeologs of COR413-TM1 are also in similar situation; the one in B sub-genome (TraesCS1B03G1168700) is not directly associated with PG(34:3), while the one in A sub-genome (TraesCS1A03G0986400) is. Therefore, caution should be taken at the interpretation of the result. This is complemented by network propagation in this study and such complement enables discovery of the fact that they share similar neighborhood nodes. Applying the small world social circle theory in humanity research, similar to the backbone theory used in WAGNA topology overlap matrix (Langfelder and Horvath, 2008), achieves the overall success of network analysis in this study. Such result is further strengthened through integration of strengths of other methods applied.
The prime condition in this study is cold treatment, which is reflected in two contrasting pairs (WHGs versus SHGs and cold hardy versus anti-hardy) which are revealed by one computational method and supported by PCA and at least one more other method in this study. The cohesiveness of group membership is reflected by an association strength in the membership in each of these groups and is contributed by environmental, physiological, and/or genetic factors. Both groups of WHGs and cold hardy genes have higher membership involvement and association strengths than their respective counterparts. Finally, the vernalization subnetwork is highly relevant to the genetic factor contributed by the vernalization through the recessive allele vrn1 associated with VRN-A1 locus. The association strength of vernalization subnetwork is 0.83, i.e., each gene is directly associated with 83% in immediate neighborhood of VRN1, which indicates the extent of contribution by genetic contribution to over winter cold/freezing tolerance of wheat plants.
Insights into cold acclimation
Cold acclimation is a complex system and the 63 WHGs encompass a wide spectrum of biological processes. Gene association network analysis of WHGs subnet reveals that many hub genes in this group are directly associated collectively with over 70% of the genes in the group with an overall association strength of 0.64. This indicates that these genes coordinate in concerted manner to confer the common goal of cold tolerance.
Signaling of cold stress
In plants, the calcineurin B-like protein (CBL) family represents a group of calcium sensors and plays a pivotal role in decoding calcium transients by specifically interacting with and regulating a family of protein kinases (CIPKs). CIPKs is known to confer cold stress tolerance in cold acclimated Arabidopsis thaliana (Aslam et al., 2022), pepper, and tomato (Ma et al., 2022). Two CIPKs are among the hub genes of WHGs subnet in this study (connection degree = 42) and they are highly expressed in both winter-habit genotypes (WM and N) when treated with cold, but barely any expression in all other samples. They are directly associate with all hub genes in the subnet.
Involvement of carbohydrate metabolism in cold acclimation
Beta-glucosidases are the enzymes that catalyze the hydrolysis of terminal, non-reducing β-D-glucosyl residues from a variety of glucoconjugates which include glucosides, oligosaccharides, and 1-O-glucosyl esters (Godse et al., 2021). Beta-glucosidase is a rate-limiting enzyme that is involved in the hydrolysis of cellulose, affects cell wall structure, and plays a key role in cell adaptations to the physical deformations caused by cold stress (Sun et al., 2021). Beta-glucosidases hydrolyze inert precursors to release antioxidant substances under various abiotic stresses in rice (Opassiri et al., 2007). Expression of beta-glucosidase gene is induced in response to low temperature in chickpea (Khazaei et al., 2015). After cold acclimation, beta-glucosidase is require for freezing tolerance in Arabidopsis thaliana (Thorlby, 2004). In this study, the expression of the beta-glucosidase gene is upregulated to different extent in all four genotypes under cold stress and is much higher (>3 times) in both winter-habit genotypes than in the spring-habit genotypes.
Integrity of plasma membrane
Expression of lipocalins and lipocalin-like proteins in wheat (Triticum aestivum) is known to be associated with the plant’s capacity to develop freezing tolerance, cold acclimation induces a high accumulation of temperature-induced lipocalin TaTIL-1 in an enriched plasma membrane fraction of cold-acclimated wheat but not in nuclei (Charron et al., 2005). The chloroplastic lipocalin AtCHL is known to prevent lipid peroxidation and protect Arabidopsis against oxidative stress (Levesque-Tremblay et al., 2009) and is required for sustained photoprotective energy dissipation (Malnoë et al., 2018). In this study, the chloroplastic lipocalin-like gene (CHL) is highly up-regulated by cold in both winter-habit genotypes, but not (or a minor extent of down-regulation) in the two spring-habit genotypes.
Resistance to oxidative stress and cellular detoxification
Plant adaptation to low temperature not only induces lipid desaturation in cellular membranes but also generation of reactive oxygen species (ROS) and changes in redox state (Murata and Los, 1997; Wallis and Browse, 2002). The multifunctional enzymes glutathione S-transferases (GSTs) participate in oxidative stress resistance and cellular detoxification and highly associated with cold stress of Hami melon (Song W. et al., 2021) and pumpkin (Abdul Kayum et al., 2018). There are 92 GSTs or GSTs like in the DEGs list, the majority of them, including a key hub gene in the WHGs subnetwork (TraesCS1B03G0752200), are significantly upregulated by cold, especially in Norstar and spring Norstar.
The pyruvate dehydrogenase E1 component subunit alpha-2, mitochondrial isoform (PDH-E1a, TraesCS7D03G0446000, EC:1.2.4.1) appears to be a key hub gene in both WHGs and cold hardy subnets of this study. It’s homoeolog in chromosome B (TraesCS7B03G0271100) is also a cold hardy gene and up regulated by cold in all four genotypes. The pyruvate dehydrogenase (PDH) complex catalyzes the oxidative decarboxylation of pyruvate with the formation of acetyl-CoA, CO2 and NADH. Much of the studies were done with animal in relation to the effect of cold. For example, PDH is associated with metabolic rate depression during freezing and anoxia of wood frogs (Al-Attar et al., 2019) and during hibernation of ground squirrel (Herinckx et al., 2017). In plants, PDH is found in both chloroplast and mitochondria. The two genes described above encoding mitochondrial isoform in this study is truly up-regulated by cold, related to respiration and anoxia. Whereas, the chloroplast isoform concerns fatty acid synthesis (Li et al., 2021) and photorespiration (Blume et al., 2013). There are three homoeolog genes in this study (TraesCS2A03G0021400, TraesCS2B03G0027300, and TraesCS2D03G0019300) encoding pyruvate dehydrogenase E1 component subunit alpha 3, the chloroplastic isoform (PDHA1); they are all down-regulated by cold in all four wheat genotypes (Supplementary File S1).
Upon the cold treatment, the WHGs and SHGs show oxidoreductase activity with incorporation of molecular oxygen. But WHGs act on paired donors (EC1.14.-.-) and are from a family of heme-binding and iron containing enzymes. They catalyze an oxidation-reduction (redox) reaction in which hydrogen or electrons are transferred from reduced flavin or flavoprotein and one other donor; one atom of oxygen is incorporated into one of the donors. This group consists of seven genes including one encoding geraniol 8-hydroxylase-like, an indole-2-monooxygenase-like isoform X1, and five noroxomaritidine synthase 2-like. Their expressions are significant in the two winter-habit genotypes but not otherwise. Whereas, as represented by two lipoxygenases (EC1.13.11.-), SHGs act on single donor (EC1.13.-.-) are from a family of non-heme iron containing enzymes, mostly catalyze the dioxygenation of polyunsaturated fatty acids. It has been shown that low temperature or cold stress induced reactive oxygen species (ROS) production is often accompanied by lipid peroxidation and oxidative damage to cellular membranes (Kim et al., 2013).
A recent study showed that a thylakoid-associated protein, peroxiredoxin Q, is required for the production of t16:1 in chloroplast and photosynthesis systems (Lamkemeyer et al., 2006; Horn et al., 2020), indicating a link between t16:1 production and redox status. Three genes encoding the chloroplast peroxiredoxin-2E-2 were uniquely induced in Norstar (Figure 3) which might be related to the reduction in t16:1 levels. Also, the relationship between up-regulation of heme-binding proteins and stress tolerance in general, and specific with regard to cold tolerance. In Arabidopsis thaliana, the heme-associated protein AtHAP5A enhances freezing stress resistance and has significant effects on inhibiting cold-induced ROS accumulation and activating ABA-related genes’ expression (Shi et al., 2014).
Transcriptome regulation
Myeloblastosis transcription factors MYB20 is a key hub gene in the WHGs subnet directly associated with 41 other genes. In Arabidopsis thaliana, MYB20 is well known to acts as a negative regulator of plant response to desiccation and cold stress and its expression is reduced to less than half (Gao et al., 2014). Another study shows transgenic plants overexpressing AtMYB20 (AtMYB20-OX) enhance salt stress tolerance while repression lines (AtMYB20-SRDX) are more vulnerable to NaCl than wild-type plants (Cui et al., 2013). The expression level of MYB20 in this study is near 100 folds in the two winter-habit genotypes (WM and N) as compared to respective controls, and also over 10 folds as compared to the two spring-habit genotypes under cold treatment. MYB20 is involved in the transcriptional network regulating the secondary wall biosynthetic program (Zhong et al., 2008). In addition, MYB proteins activate transcriptional repressors that specifically inhibit flavonoid biosynthesis, which competes with lignin biosynthesis for the aromatic amino acid phenylalanine precursors (Geng et al., 2020)
The COLD REGULATED 314 THYLAKOID MEMBRANE 1 (COR413-TM1) is an integral component of chloroplast inner membrane and well-known in cellular responses of plant to cold, water deprivation, cold acclimation and abscisic acid. COR413-TM1 is characterized to provide normal freezing tolerance in Arabidopsis thaliana (Okawa et al., 2008), Brachypodium distachyon (Colton-Gagnon et al., 2014) and wheat (Breton et al., 2003). There are two homoeologs of COR413-TM1 gene among the 12,676 DEGs in this study. The one on A sub-genome (TraesCS1A03G0986400) is a member of School B and a key hub gene in the PG(34:3) subnet (Supplementary File S6). The other on B sub-genome (TraesCS1B03G1168700) is a major hub gene in WHGs subnet and directly associated to all major hub genes in the subnet. Both COR413-TM1 homoeologs are associated with over 400 DEGs and lipid species in this study.
Vernalization, cold hardiness etc.
During the crossing process of the two wheat cultivars, the non-hardy spring wheat Manitou gained the vrn-A1 loci and became winter Manitou, while the very cold hardy winter-habit Norstar, gained the dominant Vrn-A1 locus and became spring Norstar. It is interesting to note that the LT50 value of the two NILs (WM and SN) are very close, but the change in LT50 is very different between the two pairs. Spring Norstar has a higher change (reduced by 8.7°C) in LT50 from Norstar, also has a highest number of DEGs as well as unique DEGs to the genotype when subjected to cold treatment. As a contrast, winter Manitou has a lower change (increased by 4.9°C) in LT50 from Manitou, also has a lower number of DEGs as well as unique DEGs to the genotype.
Cold acclimation and vernalization are two major mechanisms for winter survival in wheat (Li et al., 2018). Consistent with previous study on crown tissue, the VRN1 genes including VRN-A1, VRN-B1 and VRN-D1 are induced at higher levels after cold treatment in Manitou and spring Norstar than that of in Norstar and winter Manitou. Vernalization requirement duration in winter wheat is controlled by VRN-A1 at the protein level (Li et al., 2013). This is apparently relevant to the genetic background of vernalization genes in leaf and crown tissues as determined by the dominant allele Vrn-A1 in Manitou and spring Norstar versus the recessive allele vrn-A1 in winter Manitou and Norstar. As a result, integration of DEFE, PCA, gene association network analysis, and lipidomics analysis as discussed above, the 63 WHGs significantly expressed in winter-habit genotypes, winter Manitou and Norstar, are highly distinctive from the 64 SHGs. Such distinction is no doubt relevant to the genetic background of the four wheat genotypes.
The VRN2 genes are known to be repressed by cold in cereal plants and the expression VRN3 is subjected to negatively regulation by VRN2 (Kim et al., 2009). Thus the down-regulation of VRN2 in the leaf of this study permits the transient expression of VRN3 gene. Also, the VRN1 gene in cereals is known to plays a dual role of both a promoter of VRN3 and a cold-activated repressor of VRN2 (Kim et al., 2009). Our result is consistent in this regard.
Concluding remarks
Cold acclimation and vernalization are major strategies for winter survival in wheat. The differential expression feature extraction enables the discovery of a group of 63 WHGs that are significantly expressed in both vernalized winter-habit winter Manitou and Norstar, but not in either Manitou or spring Norstar. These genes are cohesively associated with one another in their local subnetwork and have a distinctive lipidomics association to achieve survival in the cold stress. They encompass a wide spectrum of transcriptional reprograming that involves signaling, maintenance of plasma membrane fluidity and rigidity, cell energy and redox homeostasis, and transcriptional regulation. The phosphatidylglycerol lipids, PG(34:3) and PG(36:6), appear to be well associated with majority of these WHGs including COR413-TM1, which play an integral role in chloroplast inner membrane and the well-known in cellular responses of plant to cold, water deprivation, cold acclimation and abscisic acid. The PG(34:3) and PG(36:6) play a master role in cold hardiness. The discovered WHGs and cold hardy genes are highly distinctive as confirmed by PCA, network propagation, and/or lipidomics profiles. The three VRN1 genes are closely associated with their immediate neighborhood, which are highly cohesive.
Materials and methods
Plant materials
Plant materials as detailed in Limin and Fowler (2002) include four wheat (Triticum aestivum L.) genotypes (M: Manitou, WM: winter Manitou, N: Norstar and SN: spring Norstar). Briefly, a non-hardy spring wheat Manitou, determined by dominant Vrn-A1 allele, and a very cold hardy winter-habit Norstar, determined by recessive vrn-A1 allele, were crossed to produce the reciprocal near-isogenic lines (NILs) (Limin and Fowler, 2002). During the crossing process, the vernalization allele in Norstar (vrn-A1) was replaced by the spring-habit allele at Vrn-A1 locus from Manitou to produce spring Norstar. Whereas, replacing the Vrn-A1 allele of Manitou with the vrn-A1 from Norstar made Manitou a vernalization-responsive winter-habit genotype (winter Manitou).
Briefly, for cold treatment under controlled environments, wheat plants were grown in chambers with 16-h-light (∼120 μmol m−2 s−1) and 8-h-dark at 23°C up to the stage of four leaves (3 weeks) and then transferred to 4°C chamber for 6 weeks. The third fully opened leaves from cold-treated and untreated plants were collected at around 10:00 a.m. and immediately frozen in liquid N2. Samples were stored at −80°C until lipidomics and RNA-seq analyses. Each genotype under a condition has three independent biological replicates.
RNA sequencing and data quality control and mapping
The RNA-seq dataset in Li et al. (2021) was reanalyzed in this study. Briefly, total RNA was extracted from 0.1 g wheat leaf tissues for each of the 24 cold treated and un-treated samples using the Agilent Plant RNA isolation kit (Agilent Technologies) and sequenced as described in Li et al. (2021). In total, the RNA-seq dataset contains 24 wheat samples with an average of 34 million reads per sample and available at Gene Expression Omnibus (GEO, GSE156300). We trimmed adaptor sequence, discarded low-quality reads (Phred Score ≤20) and eliminated short reads (length ≤20 bps) using a software package FASTX toolkit (http://hannonlab.cshl.edu/fastx_toolkit/). In average, 26 million reads remained and were aligned to the high confidence gene models in the IWGSC RefSeq Version 2.1 reference genome (Zhu et al., 2021) by using STAR (v2.7.10a, Dobin et al., 2013). From the BAM files generated by STAR, level of mRNA in each sample was quantified as transcript per million (TPM) by using RSEM (Li and Dewey, 2011).
DEG analysis
Recent studies in RNA-seq data analysis indicate that normalized expression data, such as TPM, FPKM or RPKM is not acceptable for DEG analysis (Zhao et al., 2020; Zhao et al., 2021). The read count data from STAR above were used to perform eight pairwise gene differential expression analyses using DESeq2 (Love et al., 2014). Each of the four genotypes were compared between cold-treated and un-treated control (WMC-WMK, MC-MK, NC-NK, and SNC-SNK, where, W = winter, S = spring, M = Manitou, N=Norstar, C = cold, K = control). Similarly, within each pair of NILs (winter Manitou and Manitou, Norstar and spring Norstar), we compared winter-habit genotype with its spring-habit counterpart in the cold treated samples (WMC-MC, NC-SNC) as well as in controls (WMK-MK, NK-SNK). The outputs from DESeq2 include log2 fold change values and associated statistical significance (p-values, and adjusted p-values).
Data reduction and partitioning
We applied the criteria of |log2FC| ≥ 2, adjusted p ≤ 0.01 and the max(TPM of compared samples) ≥ 2 to identify differentially expressed genes (DEGs). Differential Expression Feature Extract (DEFE) method (Pan et al., 2022) was applied to partition the DEGs into groups of various expression profiles, whether they were consistent across all genotypes in response to cold treatment or specific to each or certain pairs of genotypes. Three series of DEFE analyses were performed. Firstly, for the comparison between cold treated samples in the four genotypes versus their respective controls, a series of DEFE patterns were identified with a prefix “P” and followed by four digits each representing a genotype in the order of M, WM, SN, and N. Among the four digits, “0” means not differentially expressed, “1” denotes up regulated and “2” down-regulated. For example, P0210 represents a group of genes that were not differentially expressed in Manitou and Norstar, down-regulated in winter Manitou and up-regulated in spring Norstar when treated with cold. Similarly, we were able to obtain groups which were either consistent between the two winter-habit genotypes in response to cold treatment as well as in control, or they were specific to one individual NIL. The pattern ID in these two series start with either “C” or “K” for cold treated or control samples, respectively, and followed by two digits, representing WM/M and N/SN, respectively.
Clustering, correlation, and gene association networks analyses
The WGCNA R package (Langfelder and Horvath, 2008) was used to cluster the normalized expression data of DEGs together with lipid traits based on the distance measure by topology overlap matrix (TOM). Hierarchical clustering was employed based on the similarity matrix to cluster genes as described in Pan et al. (2018). Briefly, the network connection weight was calculated based on TOM and the top 1% weight was used for network construction. The trait-trait, gene-trait, and cluster-trait correlation matrices were computed. Here, a trait refers to an experimental condition and a lipid species. Network visualization was performed by using Cytoscape (Shannon et al., 2003).
Gene orthologue, annotation and GO enrichment analysis
For the known IWGSC RefSeq 2.1 genes, we obtained their orthologues in Arabidopsis thaliana, Brachypodium distachyon, Oryza sativa Japonica, and gene names and descriptions from EnsemblPlants (http://plants.ensembl.org/Triticum_aestivum/Info/Index) through reciprocal best kit BlastP (e ≤ 10−5). The orthologues, annotations, cluster membership, and mapping of gene IDs with various previous genome assembly are available in the Supplementary File S1.
GOAL software (Tchagang et al., 2010) was used in the gene ontology (GO) enrichment analysis. The GO terms were recently updated from EnsemblPlants release 51 (http://plants.ensembl.org/Triticum_aestivum/Info/Index) and the gene-GO association file for this version of wheat genome are available in the Supplementary File S8. An updated version of GOAL software is available at https://github.com/DT-NRC/GOAL2.0.
Principal component analysis and visualization of data
Principal component analysis was performed by using PCAtools R package in Bioconductor (Blighe and Lun, 2022). The 12,676 DEGs were visualized in heatmap by using ComplexHeatmap R package in Bioconductor (Gu et al., 2016). Otherwise, R versions 4.2.1 were used in this study.
Data availability statement
The datasets presented in this study can be found in online repositories. The names of the repository/repositories and accession number(s) can be found in the article/Supplementary Material.
Author contributions
YP performed computational genomics analysis and led the manuscript preparation. QL and JZ designed the experiment and generated the data. YP, YL, and ZL performed RNA-seq data pre-processing, DEG analysis, and gene orthology analysis. All authors contributed intellectually in data analysis, writing and approved final version for submission.
Funding
This research was supported by grants A1-000455 to YP from the Canadian Wheat Improvement Program, National Research Council of Canada, that reviewed the grants and provided funding for operational costs and services, but otherwise did not contribute intellectually to conceiving of the idea, planning of experiments or interpreting the data.
Acknowledgments
The authors would like to thank Janet Condie at the National Research Council Canada (NRC), Saskatoon, SK for assistance with RNA-seq sequencing. This work was resulted from collaborations under Canadian Wheat Alliance including NRC, Agriculture and Agri-Food Canada and University of Saskatchewan.
Conflict of interest
The authors declare that the research was conducted in the absence of any commercial or financial relationships that could be construed as a potential conflict of interest.
Publisher’s note
All claims expressed in this article are solely those of the authors and do not necessarily represent those of their affiliated organizations, or those of the publisher, the editors and the reviewers. Any product that may be evaluated in this article, or claim that may be made by its manufacturer, is not guaranteed or endorsed by the publisher.
Supplementary material
The Supplementary Material for this article can be found online at: https://www.frontiersin.org/articles/10.3389/fgene.2022.1015673/full#supplementary-material
SUPPLEMENTARY FILE S1 | Details of the 12676 differential expressed genes (DEGs) including their annotation, mapping of gene IDs to various previous genome versions, membership in various groups identified in this study. This data file contains three tabs: 1) DEGs: A list of 12676 DEGs, their annotation, orthologues, expression, DEFE pattern and their membership to various groups proposed; 2) DEFE Stats: Frequency statistics of all DEFE patterns; 3) ClusterTraitCor: Correlation between each of the 50 clusters with an experimental condition or a lipid species.
SUPPLEMENTARY FILE S2 | Gene ontology (Biological Process) enrichment analyses for the genes uniquely up or down regulated by cold in one or all genotypes. This file contains 11 tabs leading by a “Summary” tab providing the statistics overview of the 10 groups of genes uniquely or commonly up or down regulated by cold in the four wheat genotypes. The subsequent tabs labelled by respective DEFE pattern ID followed by “BP” to provide details.
SUPPLEMENTARY FILE S3 | Details of the group of 63 winter-habit genes (WHGs), spring-habit gene (SHGs) and others two groups presented in Figure 2A. This file contains 10 tabs: 1) Lists: membership in the four groups, their annotation, DEFE pattern, and the difference of fold changes between the two pairs of NILs (N/SN – WM/M); 2) geneTraitCor_R: Correlation coefficient of each gene with experimental conditions and with each lipid species; 3) - 6) Gene ontology enrichment analyses of the four groups labelled by their respective DEFE patterns: GO_P0101∩C11∩K00, GO_P0202∩C22∩K00, GO_P1010∩C22∩K00, GO_P2020∩C11∩K00; 7) - 10) Gene associate network analysis, nodes and edges of WHGs (P0101∩C11∩K00) and SHGs (P1010∩C22∩K00).
SUPPLEMENTARY FILE S4 | Details of cold hardy genes and anti-hardy genes presented in Figure 2B. This file contains 8 tabs: 1) Lists: members in the two groups and their annotation; 2) geneTraitCor_R: Correlation coefficient of each gene with experimental conditions and with each lipid species; 3) - 4) Gene ontology enrichment analyses of the two groups labelled by their respective group names; 5) - 8) Gene associate network analysis of these two groups of genes including notes and edges.
SUPPLEMENTARY FILE S5 | Description with supporting figures of the two schools of network nodes represented by phosphatidylglycerol lipids, PG(34:4) for School A, PG(34:3) and PG(36:6) for School B.
SUPPLEMENTARY FILE S6 | Details of the two schools of network nodes presented in Supplementary File S5. This file contains 10 tabs: 1) School_A [PG(34_4)]_nodes: PG(34:4) and 371 genes in its immediate neighbourhood, their respective association degree in the entire network and in this subnetwork, and overall association strength; 2) PG(34_4)_edges: connection edges of this subnet; 3) PG(34_4)_GO: Gene ontology enrichment analysis (GOEA) of the 371 genes; 4) School_B_nodes: PG(34:3), PG(36:6) and 105 genes in their immediate neighbourhood, their respective association degree in the entire network and in respective subnetwork; 5) - 10) the nodes, edges and GOEA of the genes in PG(34:3) and PG(36:6) subnets.
SUPPLEMENTARY FILE S7 | The network property of the 214 genes in the immediate neighbourhood of three homoeologs of the VRN1 gene (VRN-A1, VRN-B1, VRN-D1). This file contains three tabs: 1) The eight VRN genes; 2) the 217 nodes, 3) the 19570 edges.
SUPPLEMENTARY FILE S8 | Gene-GO associations used for gene ontology enrichment analysis in this study. These associations were assemble from EnselblPlants release 51. The gene ID of IWGSC Refseq v1.2 was converted to IWGSC RefSeq v2.1 based on the ID mapping provided by Zhu et al., (2021).
SUPPLEMENTARY FILE S1 | The third principal component (PC3) separates winter-habit genotypes from the spring-habit ones in each pair of the NILs when treated with cold. (A) PC3 vs. PC1, (B) PC3 vs. PC2.
SUPPLEMENTARY FILE S2 | Frequency distribution of DEGs presented by DEFE patterns of the two pairs of NILs between winter-habit and spring-habit genotypes. (A) C series: cold-treated samples; (B) K series: control samples.
SUPPLEMENTARY FILE S3 | Contrast in network association strength: (A) winter-habit genes were generally well associated within the group; (B) less than half of the spring-habit genes were loosely associated another gene in the group.
SUPPLEMENTARY FILE S4 | Contrast between cold hardy and anti-hardy genes in network association perspective: (A) cold hardy genes were generally well associated within the group, the four WHGs and PG(34:3) and PG(36:6) are highlighted; (B) only 1/3 of the anti-hardy genes were loosely associated with another gene.
SUPPLEMENTARY TABLE S1 | Range of PC scores of the genes up- or down-regulated specifically to winter-habit or spring-habit genotypes.
References
Abdul Kayum, M., Nath, U. K., Park, J. I., Biswas, M. K., Choi, E. K., Song, J. Y., et al. (2018). Genome-wide identification, characterization, and expression profiling of glutathione S-transferase (GST) family in pumpkin reveals likely role in cold-stress tolerance. Genes (Basel) 9, 84. doi:10.3390/genes9020084
Al-Attar, R., Wijenayake, S., and Storey, K. B. (2019). Metabolic reorganization in winter: Regulation of pyruvate dehydrogenase (PDH) during long-term freezing and anoxia. Cryobiology 86, 10–18. doi:10.1016/j.cryobiol.2019.01.006
Amasino, R. M. (2005). Vernalization and flowering time. Curr. Opin. Biotechnol. 16, 154–158. doi:10.1016/j.copbio.2005.02.004
Aslam, M., Greaves, J. G., Jakada, B. H., Fakher, B., Wang, X., and Qin, Y. (2022). AcCIPK5, a pineapple CBL-interacting protein kinase, confers salt, osmotic and cold stress tolerance in transgenic Arabidopsis. Plant Sci. 320, 111284. doi:10.1016/j.plantsci.2022.111284
Blighe, K., and Lun, A. (2022). PCAtools: Everything principal components analysis. Available at: https://bioconductor.org/packages/devel/bioc/vignettes/PCAtools/inst/doc/PCAtools.html.
Blume, C., Behrens, C., Eubel, H., Braun, H. P., and Peterhansel, C. (2013). A possible role for the chloroplast pyruvate dehydrogenase complex in plant glycolate and glyoxylate metabolism. Phytochemistry 95, 168–176. doi:10.1016/j.phytochem.2013.07.009
Breton, G., Danyluk, J., Charron, J. B., and Sarhan, F. (2003). Expression profiling and bioinformatic analyses of a novel stress-regulated multispanning transmembrane protein family from cereals and Arabidopsis. Plant Physiol. 132, 64–74. doi:10.1104/pp.102.015255
Browse, J., and Xin, Z. (2001). Temperature sensing and cold acclimation. Curr. Opin. Plant Biol. 4, 241–246. doi:10.1016/s1369-5266(00)00167-9
Brule-Babel, A. L., and Fowler, D. B. (1988). Genetic-control of cold hardiness and vernalization requirement in winter-wheat. Crop Sci. 28, 879–884. doi:10.2135/cropsci1988.0011183X002800060001x
Charron, J. B., Ouellet, F., Pelletier, M., Danyluk, J., Chauve, C., and Sarhan, F. (2005). Identification, expression, and evolutionary analyses of plant lipocalins. Plant Physiol. 139, 2017–2028. doi:10.1104/pp.105.070466
Chen, S., Wang, J., Deng, G., Chen, L., Cheng, X., Xu, H., et al. (2018). Interactive effects of multiple vernalization (Vrn-1)- and photoperiod (Ppd-1)-related genes on the growth habit of bread wheat and their association with heading and flowering time. BMC Plant Biol. 18, 374. doi:10.1186/s12870-018-1587-8
Chouard, P. (1960). Vernalization and its relations to dormancy. Annu. Rev. Plant Physiol. 11, 191–238. doi:10.1146/annurev.pp.11.060160.001203
Colton-Gagnon, K., Ali-Benali, M. A., Mayer, B. F., Dionne, R., Bertrand, A., Do Carmo, S., et al. (2014). Comparative analysis of the cold acclimation and freezing tolerance capacities of seven diploid Brachypodium distachyon accessions. Ann. Bot. 113, 681–693. doi:10.1093/aob/mct283
Crevillén, P., Yang, H., Cui, X., Greeff, C., Trick, M., Qiu, Q., et al. (2014). Epigenetic reprogramming that prevents transgenerational inheritance of the vernalized state. Nature 515, 587–590. doi:10.1038/nature13722
Cui, M. H., Yoo, K. S., Hyoung, S., Nguyen, H. T., Kim, Y. Y., Kim, H. J., et al. (2013). An Arabidopsis R2R3-MYB transcription factor, AtMYB20, negatively regulates type 2C serine/threonine protein phosphatases to enhance salt tolerance. FEBS Lett. 587, 1773–1778. doi:10.1016/j.febslet.2013.04.028
Danyluk, J., Kane, N. A., Breton, G., Limin, A. E., Fowler, D. B., and Sarhan, F. (2003). TaVRT-1, a putative transcription factor associated with vegetative to reproductive transition in cereals. Plant Physiol. 132, 1849–1860. doi:10.1104/pp.103.023523
Deng, W., Casao, M. C., Wang, P., Sato, K., Hayes, P. M., Finnegan, E. J., et al. (2015). Direct links between the vernalization response and other key traits of cereal crops. Nat. Commun. 6, 5882. doi:10.1038/ncomms6882
Dhillon, T., Pearce, S. P., Stockinger, E. J., Distelfeld, A., Li, C., Knox, A. K., et al. (2010). Regulation of freezing tolerance and flowering in temperate cereals: The VRN-1 connection. Plant Physiol. 153, 1846–1858. doi:10.1104/pp.110.159079
Dobin, A., Davis, C. A., Schlesinger, F., Drenkow, J., Zaleski, C., Jha, S., et al. (2013). Star: Ultrafast universal RNA-seq aligner. Bioinformatics 29, 15–21. doi:10.1093/bioinformatics/bts635
Fowler, D. B., N'Diaye, A., Laudencia-Chingcuanco, D., and Pozniak, C. J. (2016). Quantitative trait loci associated with phenological development, low-temperature tolerance, grain quality, and agronomic characters in wheat (Triticum aestivum L.). PLoS One 11, e0152185. doi:10.1371/journal.pone.0152185
Fürtauer, L., Weiszmann, J., Weckwerth, W., and Nägele, T. (2019). MYB20, MYB42, MYB43, and MYB85 regulate phenylalanine and lignin biosynthesis during secondary cell wall formation. Plant Physiol. 20, 5411. PMID: 31671650. doi:10.3390/ijms20215411
Gao, S., Zhang, Y. L., Yang, L., Song, J. B., and Yang, Z. M. (2014). AtMYB20 is negatively involved in plant adaptive response to drought stress. Plant Soil 376, 433–443. doi:10.1007/s11104-013-1992-6
Geng, P., Zhang, S., Liu, J., Zhao, C., Wu, J., Cao, Y., et al. (2020). MYB20, MYB42, MYB43, and MYB85 regulate phenylalanine and lignin biosynthesis during secondary cell wall formation. Plant Physiol. 182, 1272–1283. doi:10.1104/pp.19.01070
Godse, R., Bawane, H., Tripathi, J., and Kulkarni, R. (2021). Unconventional β-glucosidases: A promising biocatalyst for industrial biotechnology. Appl. Biochem. Biotechnol. 193, 2993–3016. doi:10.1007/s12010-021-03568-y
Gu, Z., Eils, R., and Schlesner, M. (2016). Complex heatmaps reveal patterns and correlations in multidimensional genomic data. Bioinformatics 32, 2847–2849. doi:10.1093/bioinformatics/btw313
Herinckx, G., Hussain, N., Opperdoes, F. R., Storey, K. B., Rider, M. H., and Vertommen, D. (2017). Changes in the phosphoproteome of Brown adipose tissue during hibernation in the ground squirrel, Ictidomys tridecemlineatus. Physiol. Genomics 49, 462–472. doi:10.1152/physiolgenomics.00038.2017
Horn, P. J., Smith, M. D., Clar, T. R., Froehlich, J. E., and Benning, C. (2020). PEROXIREDOXIN Q stimulates the activity of the chloroplast 16:1Δ3trans FATTY ACID DESATURASE4. Plant J. 102, 718–729. doi:10.1111/tpj.14657
Huner, N. P. A., Williams, J. P., Maissan, E. E., Myscich, E. G., Krol, M., Laroche, A., et al. (1989). Low temperature-induced decrease in trans-delta-hexadecenoic acid content is correlated with freezing tolerance in cereals. Plant Physiol. 89, 144–150. doi:10.1104/pp.89.1.144
Kennedy, A., and Geuten, K. (2020). The role of FLOWERING LOCUS C relatives in cereals. Front. Plant Sci. 11, 617340. doi:10.3389/fpls.2020.617340
Khazaei, M., Maali-Amiri, R., Talei, A. R., and Ramezanpour, S. (2015). Differential transcript accumulation of dhydrin and beta-glucosidase genes to cold-induced oxidative stress in chickpea. J. Agr. Sci. Tech. 17, 725–734.
Kidokoro, S., Kim, J. S., Ishikawa, T., Suzuki, T., Shinozaki, K., and Yamaguchi-Shinozaki, K. (2020). DREB1A/CBF3 is repressed by transgene-induced DNA methylation in the Arabidopsis ice1-1 mutant. Plant Cell 32, 1035–1048. doi:10.1105/tpc.19.00532
Kidokoro, S., Shinozaki, K., and Yamaguchi-Shinozaki, K. (2022). Transcriptional regulatory network of plant cold-stress responses. Trends Plant Sci. 21, 922–935. doi:10.1016/j.tplants.2022.01.008
Kim, D. H., Doyle, M. R., Sung, S., and Amasino, R. M. (2009). Vernalization: Winter and the timing of flowering in plants. Annu. Rev. Cell Dev. Biol. 25, 277–299. doi:10.1146/annurev.cellbio.042308.113411
Kim, H. S., Oh, J. M., Luan, S., Carlson, J. E., and Ahn, S. J. (2013). Cold stress causes rapid but differential changes in properties of plasma membrane H+-ATPase of camelina and rapeseed. J. Plant Physiol. 170, 828–837. doi:10.1016/j.jplph.2013.01.007
Knox, A. K., Dhillon, T., Cheng, H., Tondelli, A., Pecchioni, N., and Stockinger, E. J. (2010). CBF gene copy number variation at Frost Resistance-2 is associated with levels of freezing tolerance in temperate-climate cereals. Theor. Appl. Genet. 121, 21–35. doi:10.1007/s00122-010-1288-7
Lamkemeyer, P., Laxa, M., Collin, V., Li, W., Finkemeier, I., Schöttler, M. A., et al. (2006). Peroxiredoxin Q of Arabidopsis thaliana is attached to the thylakoids and functions in context of photosynthesis. Plant J. 45, 968–981. doi:10.1111/j.1365-313X.2006.02665.x
Langfelder, P., and Horvath, S. (2008). Wgcna: an R package for weighted correlation network analysis. BMC Bioinforma. 9, 559. doi:10.1186/1471-2105-9-559
Lee, I., Ambaru, B., Thakkar, P., Marcotte, E. M., and Rhee, S. Y. (2010). Rational association of genes with traits using a genome-scale gene network for Arabidopsis thaliana. Nat. Biotechnol. 28, 149–156. doi:10.1038/nbt.1603
Lee, T., and Lee, I. (2017). AraNet: A network biology server for Arabidopsis thaliana and other non-model plant species. Methods Mol. Biol. 1629, 225–238. doi:10.1007/978-1-4939-7125-1_15
Levesque-Tremblay, G., Havaux, M., and Ouellet, F. (2009). The chloroplastic lipocalin AtCHL prevents lipid peroxidation and protects Arabidopsis against oxidative stress. Plant J. 60, 691–702. doi:10.1111/j.1365-313X.2009.03991.x
Li, B., and Dewey, C. N. (2011). Rsem: Accurate transcript quantification from RNA-seq data with or without a reference genome. BMC Bioinforma. 12, 323. PMID: 21816040; PMCID: PMC3163565. doi:10.1186/1471-2105-12-323
Li, G., Yu, M., Fang, T., Cao, S., Carver, B. F., and Yan, L. (2013). Vernalization requirement duration in winter wheat is controlled by TaVRN-A1 at the protein level. Plant J. 76, 742–753. doi:10.1111/tpj.12326
Li, Q., Zheng, Q., Shen, W., Cram, D., Fowler, D. B., Wei, Y., et al. (2015). Understanding the biochemical basis of temperature-induced lipid pathway adjustments in plants. Plant Cell 27, 86–103. doi:10.1105/tpc.114.134338
Li, Q., Byrns, B., Badawi, M. A., Diallo, A. B., Danyluk, J., Sarhan, F., et al. (2018). Transcriptomic insights into phenological development and cold tolerance of wheat grown in the field. Plant Physiol. 176, 2376–2394. doi:10.1104/pp.17.01311
Li, Q., Shen, W., Mavraganis, I., Wang, L., Gao, P., Gao, J., et al. (2021). Elucidating the biochemical basis of trans-16:1 fatty acid change in leaves during cold acclimation in wheat. Plant-Environment Interact. 2, 101–111. doi:10.1002/pei3.10044
Limin, A. E., and Fowler, D. B. (2002). Developmental traits affecting low-temperature tolerance response in near-isogenic lines for the vernalization locus Vrn-A1 in wheat (Triticum aestivum L. em Thell). Ann. Bot. 89, 579–585. doi:10.1093/aob/mcf102
Limin, A. E., and Fowler, D. B. (2006). Low-temperature tolerance and genetic potential in wheat (Triticum aestivum L.): Response to photoperiod vernalization, and plant development. Planta 224, 360–366. doi:10.1007/s00425-006-0219-y
Liu, Q., Ding, Y., Shi, Y., Ma, L., Wang, Y., Song, C., et al. (2021). The calcium transporter ANNEXIN1 mediates cold-induced calcium signaling and freezing tolerance in plants. EMBO J. 40, e104559. doi:10.15252/embj.2020104559
Love, M. I., Huber, W., and Anders, S. (2014). Moderated estimation of fold change and dispersion for RNA-seq data with DESeq2. Genome Biol. 15, 550. doi:10.1186/s13059-014-0550-8
Ma, X., Gai, W. X., Li, Y., Yu, Y. N., Ali, M., and Gong, Z. H. (2022). The CBL-interacting protein kinase CaCIPK13 positively regulates defence mechanisms against cold stress in pepper. J. Exp. Bot. 73, 1655–1667. doi:10.1093/jxb/erab505
Malnoë, A., Schultink, A., Shahrasbi, S., Rumeau, D., Havaux, M., and Niyogi, K. K. (2018). The plastid lipocalin lcnp is required for sustained photoprotective energy dissipation in Arabidopsis. Plant Cell 30, 196–208. doi:10.1105/tpc.17.00536
Maruyama, K., Takeda, M., Kidokoro, S., Yamada, K., Sakuma, Y., Urano, K., et al. (2009). Metabolic pathways involved in cold acclimation identified by integrated analysis of metabolites and transcripts regulated by DREB1A and DREB2A. Plant Physiol. 150, 1972–1980. doi:10.1104/pp.109.135327
Murakami, Y., Tsuyama, M., Kobayashi, Y., Kodama, H., and Iba, K. (2000). Trienoic fatty acids and plant tolerance of high temperature. Science 287, 476–479. doi:10.1126/science.287.5452.476
Murata, N., and Los, D. A. (1997). Membrane fluidity and temperature perception. Plant Physiol. 115, 875–879. doi:10.1104/pp.115.3.875
Okawa, K., Nakayama, K., Kakizaki, T., Yamashita, T., and Inaba, T. (2008). Identification and characterization of Cor413im proteins as novel components of the chloroplast inner envelope. Plant Cell Environ. 31, 1470–1483. doi:10.1111/j.1365-3040.2008.01854.x
Oliver, S. N., Finnegan, E. J., Dennis, E. S., Peacock, W. J., and Trevaskis, B. (2009). Vernalization-induced flowering in cereals is associated with changes in histone methylation at the VERNALIZATION1 gene. Proc. Natl. Acad. Sci. U. S. A. 106, 8386–8391. doi:10.1073/pnas.0903566106
Opassiri, R., Pomthong, B., Akiyama, T., Nakphaichit, M., Onkoksoong, T., Cairns, M. K., et al. (2007). A stress-induced rice (Oryza sativa L.) beta-glucosidase represents a new subfamily of glycosyl hydrolase family 5 containing a fascin-like domain. Biochem. J. 408, 241–249. doi:10.1042/BJ20070734
Pan, Y., Liu, Z., Rocheleau, H., Fauteux, F., Wang, Y., McCartney, C., et al. (2018). Transcriptome dynamics associated with resistance and susceptibility against fusarium head blight in four wheat genotypes. BMC Genomics 19, 642. doi:10.1186/s12864-018-5012-3
Pan, Y., Surendra, A., Liu, Z., Ouellet, T., and Foroud, N. A. (2022). “Differential expression feature extraction (DEFE) – A case study in wheat FHB RNA-seq data analysis,” in Methods in molecular biology - plant pathogen interactions. Editors N. Foroud, and J. Neilson (Springer Nature book series). (accepted).
Shannon, P., Markiel, A., Ozier, O., Baliga, N. S., Wang, J. T., Ramage, D., et al. (2003). Cytoscape: A software environment for integrated models of biomolecular interaction networks. Genome Res. 13, 2498–2504. doi:10.1101/gr.1239303
Shi, H., Ye, T., Zhong, B., Liu, X., Jin, R., and Chan, Z. (2014). AtHAP5A modulates freezing stress resistance in Arabidopsis through binding to CCAAT motif of AtXTH21. New Phytol. 203, 554–567. doi:10.1111/nph.12812
Shi, Y., Ding, Y., and Yang, S. (2018). Molecular regulation of CBF signaling in cold acclimation. Trends Plant Sci. 23, 623–637. doi:10.1016/j.tplants.2018.04.002
Skinner, D. Z., and Garland-Campbell, K. A. (2008). The relationship of LT50 to prolonged freezing survival in winter wheat. Can. J. Plant Sci. 88, 885–889. doi:10.4141/CJPS08007
Song, W., Zhou, F., Shan, C., Zhang, Q., Ning, M., Liu, X., et al. (2021a). Identification of glutathione S-transferase genes in Hami melon (Cucumis melo var. saccharinus) and their expression analysis under cold stress. Front. Plant Sci. 12, 672017. doi:10.3389/fpls.2021.672017
Song, Y., Zhang, X., Li, M., Yang, H., Fu, D., Lv, J., et al. (2021b). The direct targets of CBFs: In cold stress response and beyond. J. Integr. Plant Biol. 63, 1874–1887. doi:10.1111/jipb.13161
Sun, S., Lin, M., Qi, X., Chen, J., Gu, H., Zhong, Y., et al. (2021). Full-length transcriptome profiling reveals insight into the cold response of two kiwifruit genotypes (A. arguta) with contrasting freezing tolerances. BMC Plant Biol. 21, 365. doi:10.1186/s12870-021-03152-w
Tchagang, A. B., Gawronski, A., Bérubé, H., Phan, S., Famili, F., and Pan, Y. (2010). Goal: A software tool for assessing biological significance of genes groups. BMC Bioinforma. 11, 229. doi:10.1186/1471-2105-11-229
Tchagang, A. B., Fauteux, F., Tulpan, D., and Pan, Y. (2017). Bioinformatics identification of new targets for improving low temperature stress tolerance in spring and winter wheat. BMC Bioinforma. 18, 174. doi:10.1186/s12859-017-1596-x
Thomashow, M. F. (2010). Molecular basis of plant cold acclimation: Insights gained from studying the CBF cold response pathway. Plant Physiol. 154, 571–577. doi:10.1104/pp.110.161794
Thorlby, G., Fourrier, N., and Warren, G. (2004). The SENSITIVE TO FREEZING2 gene, required for FREEZING tolerance in Arabidopsis thaliana, encodes a beta-glucosidase. Plant Cell 16, 2192–2203. doi:10.1105/tpc.104.024018
Vágújfalvi, A., Galiba, G., Cattivelli, L., Dubcovsky, J., and VagujfAlvi, A. (2003). The cold-regulated transcriptional activator Cbf3 is linked to the frost-tolerance locus Fr-A2 on wheat chromosome 5A. Mol. Genet. Genomics 269, 60–67. doi:10.1007/s00438-003-0806-6
Wallis, J. G., and Browse, J. (2002). Mutants of Arabidopsis reveal many roles for membrane lipids. Prog. Lipid Res. 41, 254–278. doi:10.1016/s0163-7827(01)00027-3
Wolf, C., Koumanov, K., Tenchov, B., and Quinn, P. J. (2001). Cholesterol favors phase separation of sphingomyelin. Biophys. Chem. 89, 163–172. doi:10.1016/s0301-4622(00)00226-x
Zhao, S., Ye, Z., and Stanton, R. (2020). Misuse of RPKM or TPM normalization when comparing across samples and sequencing protocols. RNA 26, 903–909. doi:10.1261/rna.074922.120
Zhao, Y., Li, M. C., Konaté, M. M., Chen, L., Das, B., Karlovich, C., et al. (2021). TPM, FPKM, or normalized counts? A comparative study of quantification measures for the analysis of RNA-seq data from the NCI patient-derived models repository. J. Transl. Med. 19, 269. doi:10.1186/s12967-021-02936-w
Zheng, Y., Yang, Y., Wang, M., Hu, S., Wu, J., and Yu, Z. (2021). Differences in lipid homeostasis and membrane lipid unsaturation confer differential tolerance to low temperatures in two Cycas species. BMC Plant Biol. 21, 377. doi:10.1186/s12870-021-03158-4
Zhong, R., Lee, C., Zhou, J., McCarthy, R. L., and Ye, Z. H. (2008). A battery of transcription factors involved in the regulation of secondary cell wall biosynthesis in Arabidopsis. Plant Cell 20, 2763–2782. doi:10.1105/tpc.108.061325
Zhu, J., Pearce, S., Burke, A., See, D. R., Skinner, D. Z., Dubcovsky, J., et al. (2014). Copy number and haplotype variation at the VRN-A1 and central FR-A2 loci are associated with frost tolerance in hexaploid wheat. Theor. Appl. Genet. 127, 1183–1197. doi:10.1007/s00122-014-2290-2
Zhu, T., Wang, L., Rimbert, H., Rodriguez, J. C., Deal, K. R., De Oliveira, R., et al. (2021). Optical maps refine the bread wheat Triticum aestivum cv. Chinese Spring genome assembly. Plant J. 107, 303–314. doi:10.1111/tpj.15289
Glossary
ABA abscisic acid
AS association strength
CBF C-repeat binding factor
COR cold regulated gene
COR413-TM1 COLD REGULATED 314 THYLAKOID MEMBRANE 1
DEFE Differential Expression Feature Extraction
DEG differentially expressed gene
DGDG digalactosyldiacylglycerol
DREB1 dehydration-responsive element-binding protein 1
FC fold change
FLC FLOWERING LOCUS C
GDSL amino acid sequence motif consisting of Gly, Asp, Ser, and Leu around the active site Ser
GO Gene Ontology
IWGSC International Wheat Genome Sequencing Consortium
M Manitou
MGDG monogalactosyldiacylglycerol
MYB myeloblastosis domain containing transcription factor
N Norstar
NAM no apical meristem
NIL near-isogenic line
PC principal component phosphatidylcholine
PC principal component phosphatidylcholine
PCA principal component analysis
PE phosphatidylethanolamine
PG Phosphatidylglycerol
PI phosphatidylinositols
PPT palmitoyl-protein thioesterase
ROS reactive oxygen species
SA salicylic acid
SHG spring-habit gene
SN spring Norstar
TF transcription factor
TOM topology overlap matrix
VRN vernalization gene
WGCNA weighted gene correlation network analysis
WHG winter-habit gene
WM winter Manitou
Keywords: cold acclimation, transcriptomics, lipidomics, phosphatidylglycerol lipid, differential expression feature extraction, RNA-seq, wheat
Citation: Pan Y, Li Y, Liu Z, Zou J and Li Q (2022) Computational genomics insights into cold acclimation in wheat. Front. Genet. 13:1015673. doi: 10.3389/fgene.2022.1015673
Received: 10 August 2022; Accepted: 03 October 2022;
Published: 20 October 2022.
Edited by:
Richard D Emes, University of Nottingham, United KingdomReviewed by:
Gábor Galiba, Centre for Agricultural Research, HungaryMuhammad Ahsan Asghar, Centre for Agricultural Research, Hungary
Copyright © 2022 His Majesty the King in Right of Canada. This is an open-access article distributed under the terms of the Creative Commons Attribution License (CC BY). The use, distribution or reproduction in other forums is permitted, provided the original author(s) and the copyright owner(s) are credited and that the original publication in this journal is cited, in accordance with accepted academic practice. No use, distribution or reproduction is permitted which does not comply with these terms.
*Correspondence: Youlian Pan, eW91bGlhbi5wYW5AbnJjLWNucmMuZ2MuY2E=; Qiang Li, cWxpQG1haWwuaHphdS5lZHUuY24=