 Mariana Saint Just Ribeiro1†
 Pulak Tripathi
 Bahram Namjou
 John B. Harley
 Iouri Chepelev
- 1Center for Autoimmune Genomics and Etiology, Cincinnati Children’s Hospital Medical Center, Cincinnati, OH, United States
- 2Research Service, US Department of Veterans Affairs Medical Center, Cincinnati, OH, United States
- 3Cincinnati Education and Research for Veterans Foundation, Cincinnati, OH, United States
A major goal of genetics research is to elucidate mechanisms explaining how genetic variation contributes to phenotypic variation. The genetic variants identified in genome-wide association studies (GWASs) generally explain only a small proportion of heritability of phenotypic traits, the so-called missing heritability problem. Recent evidence suggests that additional common variants beyond lead GWAS variants contribute to phenotypic variation; however, their mechanistic underpinnings generally remain unexplored. Herein, we undertake a study of haplotype-specific mechanisms of gene regulation at 8p23.1 in the human genome, a region associated with a number of complex diseases. The FAM167A-BLK locus in this region has been consistently found in the genome-wide association studies (GWASs) of systemic lupus erythematosus (SLE) in all major ancestries. Our haplotype-specific chromatin interaction (Hi-C) experiments, allele-specific enhancer activity measurements, genetic analyses, and epigenome editing experiments revealed that: 1) haplotype-specific long-range chromatin interactions are prevalent in 8p23.1; 2) BLK promoter and cis-regulatory elements cooperatively interact with haplotype-specificity; 3) genetic variants at distal regulatory elements are allele-specific modifiers of the promoter variants at FAM167A-BLK; 4) the BLK promoter interacts with and, as an enhancer-like promoter, regulates FAM167A expression and 5) local allele-specific enhancer activities are influenced by global haplotype structure due to chromatin looping. Although systemic lupus erythematosus causal variants at the FAM167A-BLK locus are thought to reside in the BLK promoter region, our results reveal that genetic variants at distal regulatory elements modulate promoter activity, changing BLK and FAM167A gene expression and disease risk. Our results suggest that global haplotype-specific 3-dimensional chromatin looping architecture has a strong influence on local allelic BLK and FAM167A gene expression, providing mechanistic details for how regional variants controlling the BLK promoter may influence disease risk.
Introduction
Contemporary genetics research aims to understand mechanisms of how variation in DNA sequence underlies phenotypic variation in normal and disease states. Genome-wide association studies (GWASs) have identified thousands of genetic loci associated with over 4,000 phenotypes (www.ebi.ac.uk/gwas/). However, genetic variants identified in GWAS studies explain only a modest fraction of total genetic risk in complex diseases, leading to the so-called missing heritability problem (Manolio et al., 2009). Recent evidence suggests that additional common variants beyond the lead GWAS single nucleotide polymorphisms (SNPs) contribute to disease risk (Gusev et al., 2013; Corradin et al., 2014; Gusev et al., 2014; Corradin et al., 2016; Boyle et al., 2017). However, mechanistic underpinnings of how additional genetic variants contribute to disease risk have not been thoroughly investigated for the vast majority of disease risk loci. Some suggest that a proper account of genetic interactions may help solve the missing heritability problem (Zuk et al., 2012). GWAS associations most often occur in non-coding regions of the genome, presumably at gene regulatory elements (GREs) (Hindorff et al., 2009), suggesting that additional risk variants will be found in GREs as well.
Transcriptional regulation is a complex process involving 3-dimensional (3D) chromatin interactions of GREs (Li et al., 2018). Combinations of genetic polymorphisms affecting various components in this process may thus alter gene expression and contribute to disease risk. The importance of 3D genome architecture for gene regulation in normal and disease states has been increasingly appreciated and is clearly a tremendous source for important new knowledge (Babu and Fullwood, 2015; Krijger and de Laat, 2016). The techniques based on chromosome conformation capture have emerged as methods of choice for mapping the 3D structure of the human genome (de Wit and de Laat, 2012). In particular, capture Hi-C, a high-throughput method to identify chromatin interactions in large genomic regions, has been used to determine high-resolution 3D genome structures at some disease-associated loci (Dryden et al., 2014; Jäger et al., 2015).
In order to investigate the role of haplotype-specific 3D chromatin structure in allelic gene expression, we have chosen the 8p23.1 region on human chromosome 8.8p23.1 contains associations with a number of complex diseases and the largest (4.5 Mb) known common DNA inversion region in humans (Salm et al., 2012; Namjou et al., 2014). The FAM167A-BLK locus in this region, for example, has been consistently found to be associated with systemic lupus erythematosus (SLE) GWASs in all major ancestries (International Consortium for Systemic Lupus Erythematosus Genetics (SLEGEN) et al., 2008; Hom et al., 2008; Ito et al., 2009; Suarez-Gestal et al., 2009; Sánchez et al., 2011; Castillejo-López et al., 2012; Delgado-Vega et al., 2012; Guthridge et al., 2014).
Associations with the BLK locus have also been identified in rheumatoid arthritis (RA), systemic sclerosis (SSc), Sjӧgren’s syndrome (SjS), Kawasaki’s disease (KD), antiphospholipid syndrome (APS) and maturity-onset diabetes of the young (MODY), thus justifying a focused mechanistic study of this locus (Hom et al., 2008; Borowiec et al., 2009; Yin et al., 2009; Gourh et al., 2010; Tsuchiya et al., 2010; Lessard et al., 2013). BLK is a signal transduction molecule that is important for sustaining the inflammatory response, including autoimmune responses. BLK probably plays an important role in early B cell development; thus, its dysregulation may result in a breakdown of peripheral self-tolerance during B cell development (Nashi et al., 2010; Simpfendorfer et al., 2012).
SLE patients have lower levels of the BLK gene product, a finding that is correlated with the risk alleles at the FAM167A-BLK locus (Hom et al., 2008). The strongest SLE association signal at the BLK locus is from the promoter SNP rs13277113 (Hom et al., 2008). The trans-population mapping and sequencing strategy was used in (Guthridge et al., 2014) to identify two putative SLE causal variants, rs922483 and rs1382568, at the BLK promoter region. The data available have led to a general consensus in the SLE genetics research community that causal variants at FAM167A-BLK are very likely to be in the BLK promoter region.
Our haplotype-specific chromatin interaction high-resolution Hi-C experiments, allele-specific enhancer activity H3K27ac measurements, genetic analyses, and epigenome editing experiments revealed that 1) haplotype-specific long-range chromatin interactions in 8p23.1 are prevalent, 2) BLK promoter and cis-regulatory elements cooperatively and haplotype-specifically interact, 3) BLK promoter interacts with and, as an enhancer-like promoter, regulates FAM167A expression, and 4) genetic variants at distal regulatory elements are allele-specific genetic modifiers of the promoter variants at FAM167A-BLK.
Our findings suggest a ‘risk dosage’ model whereby disease risk alleles at multiple regulatory elements at BLK locus synergistically decrease gene expression, thereby increasing SLE disease risk. Although SLE causal genetic variants are thought to reside in the BLK promoter region, we show that haplotype-specific distal genetic variants at regulatory elements modulate the effects of BLK promoter variants on gene expression and disease risk. More generally, our results suggest that global haplotype-specific 3-dimensional chromatin looping architecture may have a strong influence on local allelic gene expression and disease risk in SLE, as well as in other complex diseases, and provide a model for a risk dosage approach to regulatory susceptibility loci, in general.
Results
Haplotype-specific chromatin looping
Long-range chromatin interactions are important for transcriptional regulation of genes (Chepelev et al., 2012; Krijger and de Laat, 2016). We suspected that causal genetic variants at FAM167A-BLK dysregulate normal gene expression by altering chromatin looping interactions. We thus hypothesized that in B cell lines heterozygous for SLE-associated SNPs in the 8p23.1 region, 3D chromatin structures of risk and non-risk haplotypes would differ. To test this hypothesis, we prepared capture Hi-C libraries from two 1,000 Genomes EBV-infected lymphoblastoid cell lines (LCLs), NA07000 and NA07056, both heterozygous for the SLE-associated SNP rs922483 (Guthridge et al., 2014), located in the promoter of BLK.
Capture Hi-C is a high-throughput, cost-effective method to identify long-range 3D chromatin interactions in a subset of the genome (Dryden et al., 2014) (see Materials and Methods, and Figure 1). We identified the haplotype-resolved 3D structure of a 3 Mb region in 8p23.1 at 5 kb resolution. At the false discovery rate (FDR) of 5%, we have identified 780 and 791 differential haplotype-specific chromatin interactions in NA07000 and NA07056 cell lines, respectively (Supplementary Tables S1, S2). Approximately half of these interactions are stronger and half of the interactions are weaker on SLE risk haplotype than on non-risk haplotype. Among the differential haplotype-specific interactions in 8p23.1, some are in the vicinity of the BLK locus (Figure 2).
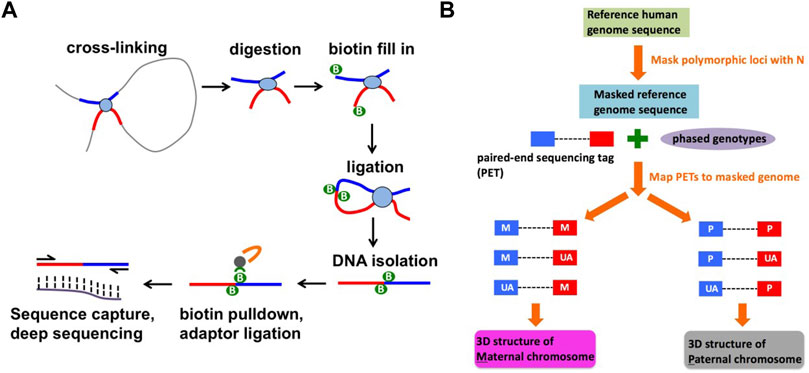
FIGURE 1. Identification of haplotype-specific chromatin interactions. (A) A schematic diagram of capture Hi-C method. (B) A computational strategy to identify haplotype-specific chromatin interactions.
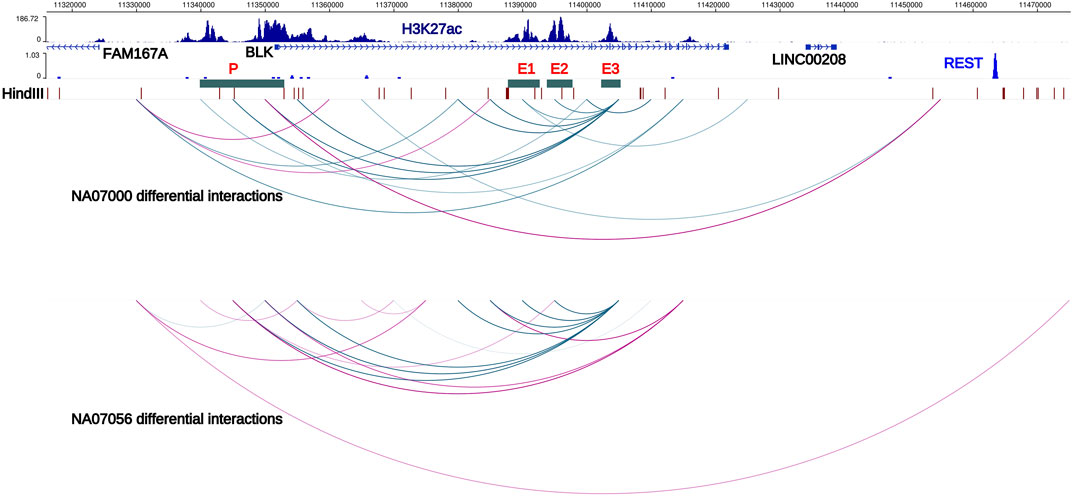
FIGURE 2. Haplotype-specific chromatin interactions at FAM167A-BLK locus. Arcs represent haplotype-specific chromatin interactions from our Hi-C data in NA07000 and NA07056 LCLs. Blue arcs depict long-range chromatin interactions which are weaker on risk haplotype. Purple arcs depict interactions that are stronger on the risk haplotype than on the non-risk haplotype. Interaction of BLK promoter with the enhancer E3 is weaker and with the REST repressor binding region is stronger on SLE risk haplotype, consistent with reduced expression of BLK on the risk haplotype. Interaction of enhancer E3 with enhancers E1 and E2 is weaker on the risk haplotype. Also displayed are the H3K27ac signals in NA12878 LCLs (ENCODE data) and HindIII restriction sites. E1, E2, E3; putative enhancers 1, 2, and 3. P; BLK promoter, locus of SLE credible set BLK-CS-11 (Supplementary Table S5).
In the ENCODE Project (encodeproject.org) data, several extended regions at the BLK locus show enrichment for the H3K27ac histone modification mark in LCLs and primary B cells. (We designate these regions E1, E2, E3, and P in Figure 2). The H3K27ac mark is thought to be associated with active enhancers in the genome (Creyghton et al., 2010). Our haplotype-specific Hi-C data described below strongly suggest that these regions positively regulate BLK expression. Our capture Hi-C data show that enhancer E3, located more than 50 kb away from the BLK transcription start site, interacts with the promoter in a haplotype-specific manner. Consistent with lower expression of BLK on the SLE risk haplotype, P-E3 interaction frequency on the SLE risk haplotype is lower than on the non-risk haplotype (Figure 2). It has been known for some time that enhancers can interact with other enhancers in the 3D genome (Chepelev et al., 2012). We found that enhancers also interact with each other in a haplotype-specific way (Figure 2), again with weaker interactions on the risk haplotype. These results are consistent with long-range chromatin interactions between enhancers playing a role in co-operatively enhancing BLK expression.
Intriguingly, we found that the interaction of the BLK promoter with a distal REST binding site located 115 kb away (Figure 2) is stronger on SLE risk haplotype, consistent with the repressive role of REST (repressor element 1-silencing transcription factor) (Ooi and Wood, 2007) and lower expression level of BLK gene on SLE risk haplotype.
Function of the FAM167A gene located 27 kb upstream of BLK has recently been shown to be an activator of the non-canonical activation pathway of NFκB, which is potentially important for mechanisms of the inflammatory phenotypes with genetic associations at this locus (Mentlein et al., 2018; Yang et al., 2022). We, therefore, retain FAM167A as an SLE candidate gene, acknowledging the existing circumstantial evidence supporting BLK as a participant in the mechanism altering disease risk. FAM167A is upregulated 8-fold upon B cell receptor stimulation (publicly available RNA-seq data in GEO GSE61608). Further, RA-associated variants exhibit high LD (r2 > 0.8) with a B cell selective cis-eQTL for FAM167A expression identified in a cohort of early RA patients (Thalayasingam et al., 2018). The haplotype-specific expression patterns of these two genes are anti-correlated: BLK is less expressed on the SLE risk haplotype than on the non-risk haplotype, whereas FAM167A is more expressed on the risk haplotype than on the non-risk haplotype (Figure 3B) (Hom et al., 2008). Our capture Hi-C data revealed that FAM167A and BLK promoters interact, with the interaction being stronger on risk-haplotype in NA07000, but not in NA07056 cells (Figures 2,3A). Our model is summarized in Figure 3B. It has previously been proposed that promoters can regulate other promoters via chromatin looping interaction (Xu et al., 2011). Many promoter-promoter chromatin interactions have previously been identified genome-wide (Chepelev et al., 2012; Li et al., 2012). Promoters with enhancer activity, the so-called enhancer-like promoters, have been described recently (Dao et al., 2017; Dao and Spicuglia, 2018). That the promoters of FAM167A and BLK genes may functionally interact in this manner is consistent with these data and remains an intriguing possibility.
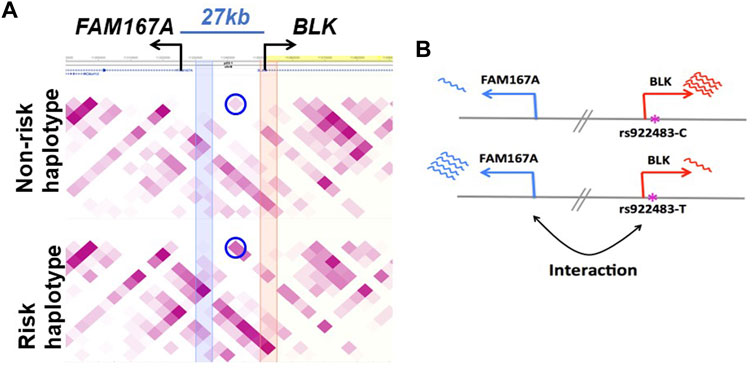
FIGURE 3. Haplotype-specific FAM167A-BLK promoter-promoter interactions in NA07000 cells. (A) FAM167A-BLK interaction is stronger on SLE risk haplotype. Shown is a heatmap view of Hi-C chromatin interaction frequencies on non-risk and risk haplotypes, darker purple representing higher interaction frequencies. Each square represents an interaction between two 5 kb genomic regions located at the diagonal extension intersecting the horizontal line. The circled squares represent interactions between two 5 kb regions located where blue and orange vertical bands meet the horizontal line (at FAM167A and BLK promoters). (B) BLK and FAM167A have anti-correlated expression patterns. BLK is less and FAM167A is more expressed on the risk (lower panel) than on the non-risk (upper panel) haplotype. Shown also is a putatively SLE causal promoter SNP rs922483 with its non-risk (C) and risk (T) alleles.
Since SLE causal variants at FAM167A-BLK are very likely to be in the BLK promoter region (see discussion in Introduction) and given our findings above, we hypothesized that these variants may have functional effects on modulating FAM167A expression, and on disease risk, via haplotype-specific chromatin interaction between promoters of BLK and FAM167A. We thus sought to perturb BLK expression and measure changes in FAM167A expression.
We infected NA07000 LCL cells, in which BLK and FAM167A are expressed, with a lentivirus to express a dCas9-KRAB fusion protein for targeted gene repression (see Figure 4A) (Thakore et al., 2015). When localized to genomic DNA, KRAB recruits a heterochromatin-forming complex that causes histone methylation and deacetylation. We targeted dCas9-KRAB to the E3 enhancer region in NA07000 cells by transfection of plasmids expressing appropriate guide RNAs (gRNAs) (Supplementary Tables S3,S4). The BLK expression was down-regulated by ∼19% and FAM167A expression was up-regulated by ∼37% as a consequence of the targeting of dCas9-KRAB to the E3 enhancer region (Figures 4B,C).
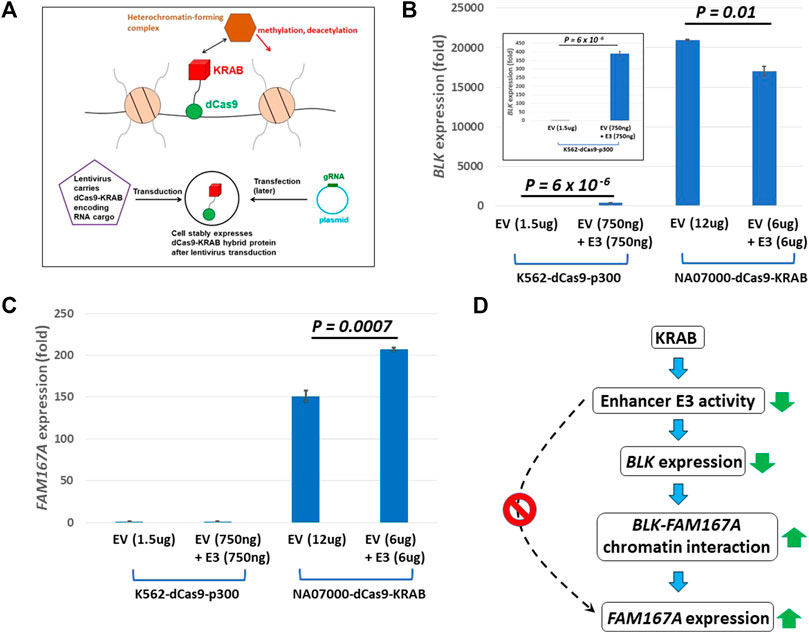
FIGURE 4. dCas9-KRAB targeting reveals regulation of FAM167A expression by BLK promoter region. (A) Schematics of epigenome editing (repressor KRAB) experiment in NA07000 LCL cell line. (B) Targeting of dCas9-KRAB to enhancer E3 in NA07000 cells results in down-regulation of BLK. Targeting of dCas9-p300 to enhancer E3 in K562 cells results in ∼400 folds up-regulation of BLK (two left-most bars in the main figure and the inset for an expanded view). For the schematics of dCas9-p300 experiments, see Figure 6A. (C) Targeting of dCas9-KRAB to enhancer E3 in NA07000 cells results in up-regulation of FAM167A expression. (D) A model to explain data in (B–C). The dotted arrow with the red ‘STOP’ sign symbolizes the following finding from (C) (two left-most small bars grouped as ‘K562-dCas9-p300’ cell line): targeting of activator p300 to enhancer E3 in K562 cells did not result in up-regulation of FAM167A expression. This suggests that E3 does not directly regulate FAM167A expression. Rather, the effect of repressing E3 on FAM167A expression is mediated by FAM167A-BLK promoter-promoter interaction (see Figures 2,3). In (B,C), the BLK and FAM167A expression values shown are relative to their expression levels in K562-dCas9-p300 cells transfected with empty vector (EV) (the left-most bars in (B) and (C) have values identically equal to 1). EV, empty vector.
The up-regulation of FAM167A may be a direct or an indirect consequence of perturbation of chromatin state at enhancer E3 by KRAB. In order to distinguish between these two possibilities, we chose K562 cells to perform epigenome editing to activate enhancer E3. The BLK and FAM167A genes are not expressed beyond the basal level in K562 cells and the BLK enhancers are not active since they have no H3K27ac signal in K562 cells (Supplementary Figure S1). We infected K562 cells with a lentivirus to express a dCas9-p300 fusion protein (Hilton et al., 2015; Klann et al., 2017) (see Figure 6A). The p300 is a histone acetyltransferase that acetylates H3K27. While BLK is strongly up-regulated by targeting of dCas9-p300 to enhancer E3 in K562 (Figure 4B), FAM167A expression did not change (Figure 4C). This suggests that the E3 region is not directly involved in regulating FAM167A expression. More likely, the effect of targeting dCas9-KRAB to E3 on FAM167A expression is indirect and is mediated by increased long-range chromatin interaction frequency between promoters of BLK and FAM167A, brought about by down-regulation of BLK expression (see the model in Figure 4D). We hypothesize that upon down-regulation of BLK transcription, an enhancer-like activity of BLK promoter goes up, which leads to its long-range chromatin interaction with FAM167A promoter and up-regulation of FAM167A expression.
Haplotype-specific enhancer activity
Our Hi-C data revealed haplotype-specific interactions of enhancers with the BLK promoter. We thus hypothesized that enhancer activities should be stronger on the SLE non-risk haplotype. We cloned NA07056 risk and non-risk haplotype enhancer sequences into luciferase reporter vectors and transfected LCLs with these constructs. The reporter assay data show that the activity of enhancer E3 is haplotype-specific, and is less active on the SLE risk haplotype (Figure 5A). This result is consistent with the chromatin interaction analysis above. Reporter experiments revealed that enhancer activity of non-risk E3 sequence is ∼1.5 times higher than the activity of risk E3 sequence (Figure 5A). Intriguingly, our allele-specific ChIP-qPCR experiments showed that the H3K27ac signal at E3 enhancer on non-risk haplotype is ∼8.5 times higher than on the risk haplotype (Figure 5B). We hypothesize that the allelic differences in regulatory element activities are determined not only by local DNA sequence variations at the element but also by allelic differences at distal sites, due to the amplification effect of chromatin looping interactions in the 3D chromatin context. We have tested our hypothesis for one enhancer (E3) in one cell line in our experiments, suspecting that this is a more general phenomenon and that analogous findings would hold true also at many other regulatory regions.
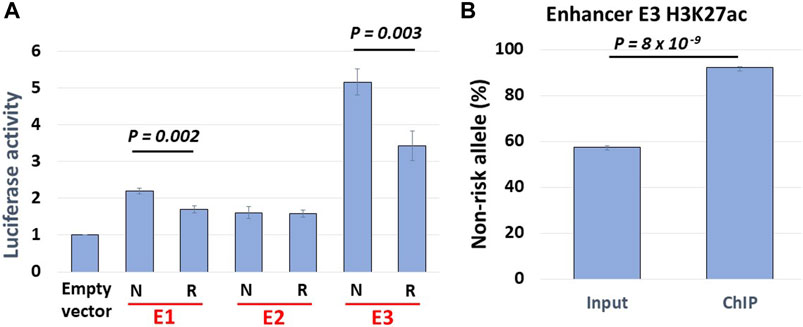
FIGURE 5. Haplotype-specific enhancer activity. (A) Allelic luciferase activities of enhancers in NA07056 cells. N: SLE non-risk haplotype sequence, R: SLE risk haplotype sequence. Non-risk enhancer E3 sequence reporter activity is ∼1.5x higher than that of risk sequence. (B) Allele-specific ChIP-qPCR at E3 enhancer in NA07056 cells in which the SNP rs2244931 is heterozygous. Non-risk to risk enhancer activity ratio in native chromatin context is significantly higher ∼8.5x (calculated as normalized ratio (N/R)ChIP/(N/R)Input; See Materials and Methods for details), presumably due to “amplification of E3 enhancer activity due to long-range chromatin interactions” effect (see haplotype-specific E1-E3 and E2-E3 interactions in Figure 2).
Epigenome editing reveals participating elements in BLK regulation
Our Hi-C data revealed haplotype-specific chromatin looping interactions between enhancers and the promoter at the BLK locus. Based on these findings, we hypothesize that enhancers and promoter pairs synergistically regulate BLK expression. For the lack of baseline BLK expression and the absence of an H3K27ac signal at the enhancers (Supplementary Figure S1), we again chose K562 cells, here performing epigenome editing to activate BLK expression and test the hypothesis. We infected K562 cells with a lentivirus to express a dCas9-p300 fusion protein (Hilton et al., 2015; Klann et al., 2017) (see Figure 6A). The p300 is a histone acetyltransferase that acetylates H3K27. We targeted dCas9-p300 to E2, E3 and promoter regions singly and in combinations in K562 cells by transfection of plasmids expressing appropriate guide RNAs (gRNAs) (Supplementary Tables S3,S4). Strong synergistic activation of the BLK gene (500 to 900-fold increases) was observed for E2-E3 and E3-promoter targeting by p300 (Figures 6B,C), thereby confirming the regulatory role of this genome region for BLK.
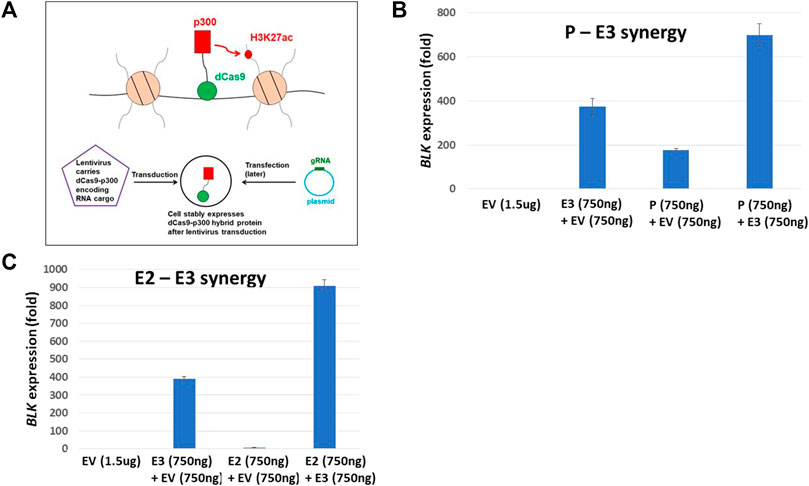
FIGURE 6. dCas9-p300 targeting reveals synergistic interaction of regulatory elements. (A) Schematics of epigenome editing (activator p300) experiment in K562 cell line. (B) P-E3 synergy: upregulation of BLK expression when both the BLK promoter P and the enhancer E3 are targeted by p300 protein is significantly higher than when p300 is targeted to either P (p-value = 0.004) or E3 (p-value = 0.004) alone. (C) E2-E3 synergy: upregulation of BLK expression when both enhancers E2 and E3 are targeted by p300 protein is significantly higher than when p300 is targeted to either E2 (p-value = 0.0008) or E3 (p-value = 0.0008) alone. In B-C, the BLK expression values shown are relative to the BLK expression level in K562-dCas9-p300 cells transfected with empty vector (EV) (the left-most bars in (B) and (C) have values identically equal to 1).
Multiple genetic variants contribute to variance in BLK expression
Since gene regulation is a complex process involving interactions of multiple regulatory regions and protein complexes, we reasoned that many genetic variants may contribute to variance in BLK expression. We analyzed gene expression and genotype data from 344 European individuals (Lappalainen et al., 2013), henceforth denoted as dataset D344, using the genetic relationship matrix approach as implemented in GCTA software (Yang et al., 2010) to estimate BLK gene expression variance explained by various sets of SNPs. The SLE-associated proxy rs922483 alone explained around 25% of expression variance. Inclusion of all SNPs in putative regulatory regions of BLK, as defined by the H3K27ac epigenetic mark and REST binding region (see Figure 2; Supplementary Table S7), increased the variance explained to 44%, supporting the contention that multiple SNPs at the BLK locus explain variance in gene expression.
Enhancer haplotypes modulate BLK expression
Given our findings, we sought to find more direct evidence for the causal effects of enhancer haplotypes on BLK expression. To this end, we derived an SLE credible set of 11 SNPs, termed BLK-CS-11, from existing genotype data (see Materials and Methods, and Supplementary Table S5) and used phased genotype data for individuals of European ancestry from the 1000 Genomes Project (1000genomes.org) to extract haplotype sequences of the BLK locus. We then computed frequencies of different promoter haplotype sequences in the dataset.
The frequency of promoter risk haplotype CCCCTTAAACA (based on 11 SNPs in BLK-CS-11) (Figure 7A), which we denote henceforth as prom-R, is 24%. The most frequent non-risk haplotype TGTACCGGGTG, which we denote as prom-N, is present at 72%. In subsequent analyses, we will focus on these two main haplotypes, which together account for 96% of all European haplotypes. The rows in the heatmap plot in Figure 7A correspond to the haplotypes, with the rows labeled as “Risk” representing promoter “risk” haplotypes and the rows labeled as ‘Non-risk’ representing promoter “non-risk” haplotypes, respectively.
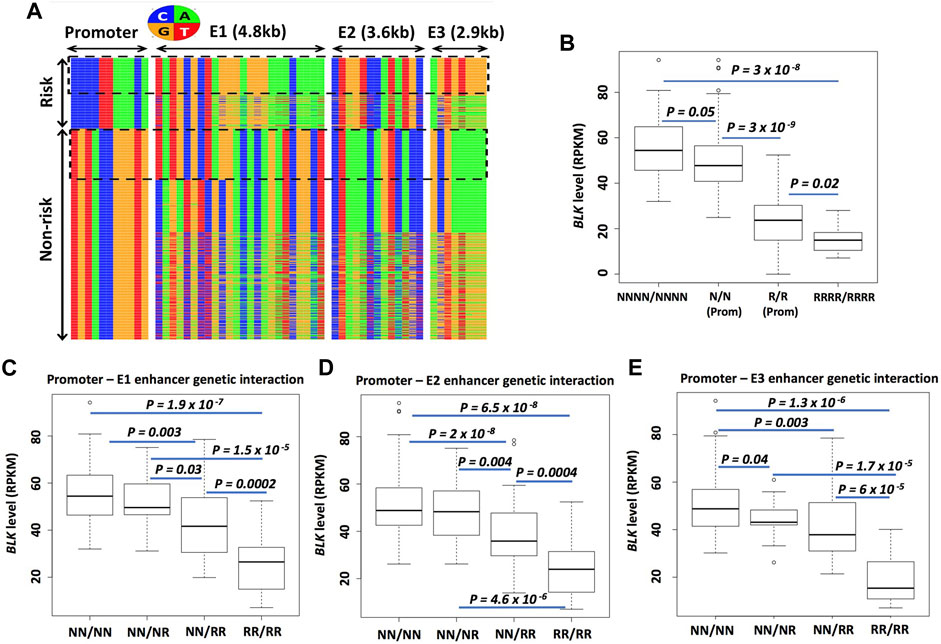
FIGURE 7. Enhancer haplotypes modulate BLK expression. (A) Promoter-E1-E2-E3 haplotypes conditioned on promoter risk and non-risk haplotypes. Each row represents a haplotype and each column - a SNP. Nucleotides are color-coded as shown in the circle above the haplotype heatmap (B) Risk haplotypes at enhancers lower BLK expression. (C–E) “Risk dosage” effect. The BLK expression level tends to decrease as the total number of ‘risk’ haplotypes in the regulatory regions (promoter and enhancers E1, E2, E3) increases. In (B–E), N means non-risk haplotype and R means risk haplotype. NNNN/NNNN and RRRR/RRRR denote multilocus genotypes at P-E1-E2-E3; N/N and R/R denote multilocus genotypes at the promoter; NN/NN, NN/NR and so on in (C–E) denote multilocus genotypes at P-E1, P-E2 or P-E3. See Materials and Methods for details on the notation.
We next asked, conditioned on the promoter haplotype, what are the local haplotype sequences at candidate enhancer E1, E2, and E3 regions defined by islands of H3K27ac enrichment? The promoter and enhancer haplotype sequences are displayed in Figure 7A. The haplotypes are grouped based on promoter haplotype: risk for prom-R (upper block) and non-risk for prom-N (lower block). . We conditioned on the promoter haplotype prom-R and counted different local haplotypes at E1, E2, and E3. The most frequent E1, E2, and E3 haplotypes, conditioned on prom-R haplotype, denoted as E1-R, E2-R, and E3-R, respectively, are present in 87%, 85%, and 54% of all prom-R haplotypes, respectively. Our choice of the label “R” in the naming of these enhancer haplotypesmay seem arbitrary; the use of this label emphasizes the effect of these haplotypes on BLK expression and disease risk discussed below. Interestingly, the haplotype combination (prom-R, E1-R, E2-R, E3-R), which can be seen in the upper dotted box in Figure 7A, is frequent and constitutes 48% of all promoter-E1-E2-E3 haplotypes conditioned on prom-R and 11% of all European subject chromosomes.
Similarly, the most frequent E1, E2, and E3 haplotypes, conditioned on prom-N haplotype, denoted as E1-N, E2-N, and E3-N, respectively, are present in 25%, 70%, and 50% of all prom-N haplotypes, respectively. Interestingly, the haplotype combination (prom-N, E1-N, E2-N, E3-N), which can be seen in the lower dotted box in Figure 7A, is frequent and constitutes 24% of all promoter-E1-E2-E3 haplotypes conditioned on prom-N. All other alternative local haplotypes at E1, E2, and E3, different from N and R haplotypes defined above, are denoted by E1-A, E2-A, and E3-A, respectively. We will use simplified notation, such as RNRN for (prom-R, E1-N, E2-R, E3-N) haplotype, subsequently.
We next asked: how does the BLK mRNA level depend on different haplotype combinations at the promoter, E1, E2, and E3? To answer, we used RNA-seq expression data from dataset D344 [gene expression from 344 European individuals (Lappalainen et al., 2013)]. We have defined two groups of samples based on their multilocus genotypes (i.e., pairs of haplotypes in each individual) NNNN/NNNN and RRRR/RRRR. We have also defined two more groups of samples based only on promoter multilocus genotypes prom-N/prom-N and prom-R/prom-R, denoted N/N and R/R, respectively. The boxplot of expression levels in these 4 groups is shown in Figure 7B. There is a clear “risk-dosage” dependent decrease in BLK expression level in these data, with the contributions of “risk” from both the promoter and enhancer variants. Analyses for BLK promoter-enhancer pairs, shown in Figures 7C–E, support a risk-dosage model according to which the risk status of local haplotypes at cis-regulatory regions cumulatively contributes to a reduction in BLK expression. As defined earlier, alternative local haplotypes at E1, E2, and E3, different from N and R haplotypes, are denoted as “A”. By replacing N’s with A’s in the analyses, we found almost identical results as above, suggesting that A and N enhancer haplotypes have similar effects on BLK expression (data not shown).
Genetic interactions at FAM167A-BLK locus are enriched in regulatory regions
We have provided evidence supporting the hypothesis that enhancer haplotypes can influence BLK expression by acting as genetic modifiers of promoter haplotypes. However, we excluded from our analysis genetic variants outside of gene regulatory elements/regions (GREs). What is the contribution of the non-GRE variants to BLK expression and do these variants interact? To address this question, we analyzed data D344 [gene expression data from 344 European individuals (Lappalainen et al., 2013)]. For each pair of SNPs, we fitted a linear (y = b0 + b1x1 + b2x2) and an interaction (y = b0 + b1x1 + b2x2 + b12x1x2) model to BLK expression and genotype data (y denotes expression level and x1, x2 denote 0/1/2 coded genotypes of the two SNPs under consideration). The log-likelihood ratio test was used to determine statistically significant genetic interactions. If our hypothesis is true, then the genetic interactions are predicted to be predominantly between SNPs located at GREs. However, SNPs at the BLK locus are in high linkage disequilibrium with each other; therefore, the statistically identified genetic interactions may not necessarily be between genetic variants that causally influence BLK expression.
In order to perform an unbiased test of genetic interaction enrichment at regulatory regions, we separated genetically interacting SNP pairs identified by our statistical analysis into two groups: 1) SNPs pairs that are in two different gene regulatory regions (GRE-GRE group) and 2) SNP pairs with at least one SNP not in a regulatory region (non-GRE-GRE group). The genomic coordinates of gene regulatory regions and details of the analysis are given in Materials and Methods. A ranked list of–log10(p-value) of genetic interactions in each group was generated. Quantile-quantile analysis revealed that genetic interactions in the GRE-GRE group are more significant than in the non-GRE-GRE group (p-value = 0.0003) (Figure 8), thereby demonstrating enrichment of genetic interactions between gene regulatory elements.
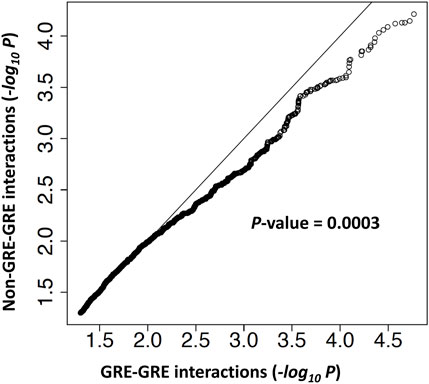
FIGURE 8. Genetic interactions are enriched at gene regulatory elements. A quantile-quantile (Q–Q) plot of -log10 p-values from the log-likelihood ratio test of genetic interaction. Genetic interactions were separated into two groups. In the GRE-GRE group, both SNPs are located in gene regulatory regions. In the non-GRE-GRE group, at least one SNP is located outside of the regulatory regions.
Materials and methods
Cell culture
K562 cells were obtained from the American Tissue Collection Center (ATCC). NA07056 and NA07000 LCLs were obtained from the Coriell Institute for Medical Research cell repository. K562 cells were maintained in Iscove’s Modified Dulbecco’s Medium supplemented with 10% FBS and 1% penicillin-streptomycin. LCLs were maintained in RPMI medium supplemented with 10% FBS and 1% penicillin-streptomycin. K562 and LCLs were grown at 37°C in 5% CO2.
Capture Hi-C experiments
Capture Hi-C libraries were prepared according to the protocol described in (Jäger et al., 2015). The protocol consists of two parts: Hi-C library preparation and target enrichment (Figure 1A). A SureSelect Custom Target Enrichment Library covering a 3 Mb region in the 8p23.1 (hg19 coordinates: chr8:8,190,000–11,838,000) was designed using eArray software (Agilent). Hi-C library preparation, comprising chromatin fixation, HindIII digestion, biotin labelling, ligation, and crosslink reversal was performed as described in (Rao et al., 2014) with minor modifications described in (Jäger et al., 2015). Target enrichment was performed according to the SureSelect protocol (Agilent) with minor modifications described in (Jäger et al., 2015). We have prepared 10 capture Hi-C libraries from 5 independent batches of NA07000 cells and 4 capture Hi-C libraries from 2 independent batches of NA07056 cells. The libraries were sequenced on Illumina HiSeq 2,500 system, producing 461 million and 206 million paired-end 2 × 125 bp reads for NA07000 and NA07056, respectively.
Allele-specific luciferase assay
We amplified ∼2 kb DNA fragments located in the E1, E2, and E3 enhancer regions (see Figure 2; the hg19 coordinates of the fragments are chr8:1,1,391,971–11,391,971, chr8:11,394,297–11,396,127 and chr8:11,402,768–11,404,795, respectively) from the genomic DNA of NA07056 lymphoblastoid cells using PCR with primers listed in Supplementary Table S6. The PCR products were cloned into pCR2.1-TOPO vector (catalog #K4500-01, Invitrogen) and sub-cloned into pGL4 luciferase reporter vectors (catalog #E6651, Promega). The bacterial cells were then transformed, and single-cell colonies were isolated and Sanger-sequenced to identify SLE risk and non-risk clones using phased haplotype data from the 1000 Genomes Project.
An internal control reporter vector containing Renilla luciferase was simultaneously transfected with our experimental vectors as a control for assay-to-assay variability. One microgram of each vector was transfected into the NA07056 (106 cells per sample in triplicate). Cells were then incubated at 37°C for 24 h. Luciferase activity was measured with the Dual-Luciferase Reporter Assay System (catalog #E1960, Promega). Luciferase activity was normalized through the division of BLK risk or non-risk construct reporter activity by the reporter activity of the pRL-TK-Renilla luciferase construct. The mean and standard error of measurement were calculated on the basis of the normalized luciferase activities. The one-sided Student’s t-test was used to compare the N and R groups in Figure 5A.
Allele-specific H3K27ac ChIP-qPCR
Three independent chromatin immunoprecipitation (ChIP) experiments in NA07056 cells were carried out using antibodies against H3K27ac (catalog #C15410196, pAb-196–050, Diagenode) following a standard protocol. Enhancer E3 (see Figure 2) SNP rs2244931 is heterozygous in NA07056 (C/G, where G is on the SLE risk haplotype). Allelic H3K27ac levels at rs2244931 were quantified using TaqMan custom SNP Genotyping Assay, TaqMan Genotyping Master Mix (catalog # 4,371,353, Applied Biosystems), and input/ChIP DNA. The allelic ratios in the ChIP and input DNA were determined by fitting log2 transformed VIC/FAM ratios to a standard curve constructed from DNA with known rs2244931 allelic ratios obtained by mixing gRNA from cell lines homozygous for rs2244931 (C/C and G/G) as well as heterozygous (C/G). The normalized non-risk to risk allele ratio of the H3K27ac signal was determined as the ratio (N/R)ChIP/(N/R)Input of non-risk/risk allele ratios in ChIP and input DNA samples. In Figure 5B, the percentage of the non-risk allele RT-qPCR signal in input DNA is ∼57.5% and that of the risk allele is ∼42.5%. Similarly, the non-risk allele RT-qPCR signal in ChIP DNA constitutes ∼92% and the risk allele signal constitutes ∼8%. Thus, the normalized (true) non-risk to risk ratio of the H3K27ac signal is (92/8)/(57.5/42.5) = 8.5. The one-sided Student’s t-test was used to compare percentages of non-risk alleles RT-qPCR signals in input and ChIP DNA (Figure 5B).
CRISPR epigenome editing
The plasmid pLV-dCas9-p300-P2A-PuroR was a gift from Charles Gersbach (Addgene plasmid # 83,889) (Klann et al., 2017). The plasmid pLV hU6-sgRNA hUbC-dCas9-KRAB-T2a-GFP was a gift from Charles Gersbach (Addgene plasmid # 71,237) (Thakore et al., 2015). The plasmid pSPgRNA was a gift from Charles Gersbach (Addgene plasmid #47108) (Perez-Pinera et al., 2013). For dCas9-p300 and dCas9-KRAB experiments, lentivirus was produced by transfecting HEK293 cells with pLV-dCas9-p300-P2A-PuroR and pLV hU6-sgRNA hUbC-dCas9-KRAB-T2a-GFP plasmids, respectively, at Cincinnati Children’s Hospital Medical Center’s Viral Vector Core facility.
For dCas9-p300 experiments, 5 million K562 cells were incubated for 3 days with the concentrated dCas9-p300 lentivirus at the cell to virus ratio of 1:5 in the presence of 8ug/ml polybrene. After 3 days, virus-infected cells were selected with 2 ug/ml of puromycin. We named the resulting cells K562-dCas9-p300.
For dCas9-KRAB experiments, 10 million NA07000 cells were spinfected (in 12 well plate, 1 million cells/ml of media, centrifuged at 800Xg for 2 h at 30°C) with the concentrated dCas9-KRAB lentivirus at the cell to virus ratio of 1:5 in the presence of 8 ug/ml polybrene. After spinfection, 1 ml of fresh media was added to each well (2 ml total) and cultured for 4 days at 37°C. Cells were then washed 3 times with fresh cultured media and continued to grow for 10 more days. After 2 weeks of infection, GFP + virus-infected cells were sorted and cultured to grow more GFP + virus-infected cells. We named the resulting cells NA07000-dCas9-KRAB.
For the regions P, E2 and E3 in Figure 2, we designed several gRNAs targeting these regions (see Supplementary Table S3 for the list of gRNA oligos and Supplementary Table S4 for Addgene IDs of the plasmids generated in this study). Each gRNA oligo pair was phosphorylated using T4 PNK, annealed and cloned into BbsI-digested pSPgRNA plasmid. For each of the P, E2, and E3 regions, we generated equimolar pools of gRNA plasmids (see Supplementary Tables S3,S4).
For BLK repression experiments, NA07000-dCas9-KRAB cells were transfected with E3 gRNA plasmid together with the empty vector (EV + E3) or the empty vector alone (EV) (see Figure 4). The empty vector is simply the intact pSPgRNA plasmid. As indicated in Figure 4, the total amount of plasmids used in each transfection was 12 ug, with 6 ug of EV plasmid included whenever it was necessary in order to have a balanced total DNA amount of 12 ug. The optimal amount, 12 ug, of plasmids used for transfection in NA07000-dCas9-KRAB experiments above was determined from exploratory transfection experiments performed with E3 gRNA plasmid alone at varying DNA amounts and selecting the amount which resulted in the largest down-regulation of BLK expression (data not shown).
For synergy experiments, K562-dCas9-p300 cells were transfected with pairs of gRNA pools (P + E3 or E2+E3), a single gRNA pool together with the empty vector (EV + P, EV + E2, or EV + E3) or the empty vector alone (EV) (see Figure 6). The empty vector is simply the intact pSPgRNA plasmid. As indicated in Figure 6, the total amount of plasmids used in each transfection was 1.5 ug, with 750 ng of EV plasmid included whenever it was necessary in order to have a balanced total DNA amount of 1.5 ug. The optimal amount, 1.5 ug, of plasmids used for transfection in K562-dCas9-p300 experiments above was determined from exploratory transfection experiments performed with E3 gRNA plasmid alone at varying DNA amounts and selecting the amount which resulted in the highest upregulation of BLK expression (data not shown).
At 24 h, cells were harvested and mRNA was extracted using Dynabeads mRNA DIRECT kit (catalog # 61,006, Invitrogen). cDNA was generated using SuperScript™ IV VILO™ Master Mix kit (catalog # 11,756,050, Invitrogen). The BLK and FAM167A mRNA levels were measured by RT-qPCR using TaqMan Fast Advanced Master mix (catalog# 4,444,963, ThermoFisher Scientific) and TaqMan probes for BLK (Hs01017458_m1), FAM167A (Hs00697562_m1) and GAPDH (Hs03929097_g1). The one-sided Student’s t-test was used to compare expression levels in Figures 4B,C and Figures 6B,C.
Analysis of capture Hi-C data
The capture Hi-C paired-end sequencing reads were mapped to the SNP-masked hg19 human genome using HiC-Pro software as follows (Servant et al., 2015) (Figure 1B). First, we obtained phased genotype VCF files for NA07000 and NA07056 cell lines from the 1000 Genomes Project (version v5a.20,130,502), and generated two SNP-masked hg19 genomes files for these cell lines. The heterozygous (Ref/Alt) and homozygous alternative allele (Alt/Alt) loci in the genomes were masked as “N” in order to mitigate the reference mapping bias. The individual reads in each mapped paired-end read are evaluated for the presence of heterozygous SNPs and labeled as one of the following using phased genotype data from the 1000 Genomes Project: parent-1 allele (M), parent-2 allele (P), or allele unassigned (UA). The M-M, M-UA, and UA-M paired-end reads were grouped as “parent-1” and P-P, P-UA and UA-P paired-end reads were grouped as “parent-2” to compute chromatin interaction frequencies on two parental chromosomes at 5 kb resolution. To identify differences in chromatin interaction frequencies of homologous chromosomes, we determined haplotype-specific interaction frequency matrices in 5 kb bins for each replicate library. For n replicate libraries from each cell line, we computed n matrices for parent-1 haplotype and n matrices for parent-2 haplotype. Treating the entries of these matrices as sequence count data with the study design {M, M, … , M, P, P, … , P} (n consecutive M’s followed by n consecutive P’s), we determined differences between chromatin interaction frequencies on parent-1 and parent-2 chromosomes using multiHiCcompare (version 1.10.0) method (Stansfield et al., 2019) with the following parameters: make_hicexp (zero.p = 0.8, A.min = 5), cyclic_loess (span = 0.2), logfc_cutoff = 0.5, logcpm_cutoff = 0.5, p. method = “fdr” and p.adj_cutoff = 0.05. Differential chromatin interaction data was uploaded as custom tracks to WashU Epigenome Browser (https://epigenomegateway.wustl.edu/) and the images were then exported (Figures 2,3A).
Enhancer haplotype analysis
Using Bayesian approaches to describe “credible sets” of disease-causal SNPs following published methods (Wellcome Trust Case Control Consortium et al., 2012), we have identified the smallest set of SNPs accounting for 95% of the posterior probability from 3,892 European-American SLE cases and 3,464 controls (Rasmussen et al., 2011). This credible causal set at FAM167A-BLK locus, henceforth denoted as BLK-CS-12, consists of 12 SNPs that are in high linkage disequilibrium (LD) (r2 > 0.9), spans a 13 kb region near BLK promoter. Conditional analysis on any of the 12 markers reduces association for the other 11, consistent with a single genetic association. Since the 12 markers are in perfect linkage disequilibrium with each other, without loss of generality, we have omitted a rare indel variant (rs202125301) from BLK-CS-12 and used the set of 11 SNPs (Supplementary Table S5), which we denote as BLK-CS-11, in our analyses leading to Figure 7.
We have written a collection of Perl and R codes to perform analyses leading to Figure 7. We obtained phased genotype VCF file for the European population (GBR, FIN, CEU, IBS, and TSI; 503 individuals in total) from the 1000 Genomes Project (version v5a.20,130,502), and retained genetic variants with minor allele frequency (MAF) ≥ 5% for downstream analysis. From the resulting VCF file, we have extracted phased genotype data for 11 SNPs from the BLK-CS-11 set, 24 SNPs from the enhancer E1 region (hg19 coordinate chr8:11,387,781–11,392,710), 13 SNPs from enhancer E2 region (chr8:11,393,832–11,397,791) and 8 SNPs from enhancer E3 region (chr8:11,402,260–11,405,263). These SNP numbers correspond to the number of columns (11 + 24+13 + 8) in the heatmap plot in Figure 7A. From the phased genotype data for 11 promoter variants from BLK-CS-11, we extracted 1,006 haplotypes (from 503 individuals), of which 725 are “non-risk” (TGTACCGGGTG), 243 are “risk” (CCCCTTAAACA) and 38 are “idiosyncratic.” We omitted the idiosyncratic haplotypes from the downstream analyses. The rows in the heatmap plot in Figure 7A correspond to the haplotypes, with the rows labeled as ‘Risk’ representing 243 promoter “risk” haplotypes and the rows labeled as “Non-risk” representing 725 promoter “non-risk” haplotypes, respectively. Each entire row in the heatmap represents the concatenation of promoter, E1, E2, and E3 local haplotypes from the same chromosome.
Conditioned on the promoter haplotype, we further stratified haplotypes on the basis of the local haplotype sequences at candidate enhancer E1, E2, and E3 regions as described in detail in the Main text. In Figure 7B, NNNN/NNNN denotes a multilocus genotype at P-E1-E2-E3. It denotes all individuals in the dataset D344 [gene expression and genotype data from 344 European individuals (Lappalainen et al., 2013)] who possess the P-E1-E2-E3 haplotype shown in the lower dotted box in the ‘Non-risk’ block in Figure 7A on both parental chromosomes 8. Similarly, RRRR/RRRR denotes two identical haplotypes from the upper dotted box in the “Risk” block in Figure 7A.
N/N (prom) in Figure 7A denotes individuals from the D344 dataset who possess prom-N (i.e. non-risk) promoter haplotype (TGTACCGGGTG) on both chromosomes 8, with the local haplotypes at E1, E2, and E3 unspecified. In other words, an individual from the N/N (prom) group can have any promoter-E1-E2-E3 haplotype shown in the “Non-risk” block in Figure 7A. Similarly, an individual from the R/R (prom) group can have any promoter-E1-E2-E3 haplotype shown in the “Risk” block in Figure 7A.
NN/RR in Figure 7E denotes the multilocus genotype (TGTACCGGGTG)-(GCGAAAAA)/(CCCCTTAAACA)-(AGTGTGGG) at promoter-E3, with the local haplotypes at E1 and E2 unspecified. Other multilocus genotypes in Figures 7C–E are similarly defined.
The one-sided Student’s t-test was used to compare BLK expression level distributions in the two groups of individuals in Figures 7B–E.
Statistical test of genetic interactions enrichment in regulatory regions
From the dataset D344, we retrieved SNPs from the 143 kb region R143k (hg19 coordinate chr8:11, 331, 000–11,474,000) at the BLK locus. The log-likelihood ratio test was used to determine statistically significant genetic interactions. For each pair of SNPs from the region R143k, we fitted a linear (y = b0 + b1x1 + b2x2) and an interaction (y = b0 + b1x1 + b2x2 + b12x1x2) model to BLK expression and genotype data, where y denotes expression level and x1, x2 denote 0/1/2 coded genotypes of the two SNPs under consideration. The log-likelihood ratio test was used to determine statistically significant genetic interactions i.e. the test of whether the interaction model explains the observed data better than the linear model does.
For each pair of SNPs from the region R143k, we thus have a p-value from the log-likelihood test of genetic interaction. To test the hypothesis that genetic interactions are enriched in gene regulatory regions at the BLK locus, we separated SNPs from the R143k region into two groups: SNPs from the putative regulatory regions of BLK, as defined by the H3K27ac epigenetic mark and REST binding region (see Figure 2; Supplementary Table S7) (denoted as GRR) and SNPs outside of the putative regulatory regions. For each SNP pair (SNP1, SNP2), if both SNPs belong to GRR, then the SNP pair is of the “GRE-GRE” type in the notation of Figure 8. If at least one of the two SNPs is outside of GRR, the SNP pair is of the “Non-GRE-GRE” type. The question of whether the genetic interactions are predominantly between SNPs located in gene regulatory regions thus reduces to the problem of comparison of the distribution of the genetic interaction log-likelihood p-values defined above for the group of GRE-GRE SNP pairs and non-GRE-GRE SNP pairs. We used the quantile-quantile plot (Q-Q plot) plot to show that the p-values of SNP-SNP interactions in the GRE-GRE group are more significant than those in the non-GRE-GRE group. One-sided Kolmogorov-Smirnov test was used to compare the distribution of the log-likelihood p-values to obtain p-value = 0.0003 shown in Figure 8.
Discussion
Why are our findings on genetic interactions important for SLE? After all, credible causal SNPs are clearly localized to the BLK promoter region. Our hypothesis is that SNPs located in enhancer regions can further contribute to disease risk by modulating the effects of promoter SNPs on BLK expression. Indeed, a previous model proposes that genetic variants in weak linkage disequilibrium (LD) with risk variants can influence disease risk via physical interactions in the 3D chromatin context (Corradin et al., 2016). Our functional experiments and genetic analyses provide explicit evidence supporting the validity of this model.
In this study, we presented evidence that global haplotype-specific 3D chromatin interactions between regulatory regions can have a strong influence on local allelic gene expression, and consequently, on disease risk. Our capture Hi-C data revealed that many long-range chromatin interactions in the 8p23.1 region are haplotype-specific. Focusing specifically on the FAM167A-BLK locus, we found that the BLK promoter and the enhancer E3 located 52 kb downstream from the promoter haplotype-specifically interact in the 3D chromatin context, with the interaction being weaker on the SLE risk haplotype, consistent with the reduced expression of BLK on the risk haplotype (Figures 2,3). Interestingly, we found that the enhancer E3 interacts with haplotype-specificity with two nearby enhancers E1 and E2, which are members of the same super-enhancer cluster to which E3 belongs (Hnisz et al., 2013), with the interactions being weaker on the risk haplotype. We hypothesized that these interactions amplify the enhancer activity of E3. To test this hypothesis, we have performed allele-specific enhancer reporter assay and allele-specific H3K27ac ChIP-qPCR experiments (Figure 5). Our reporter experiments revealed that enhancer activity of non-risk E3 sequence is ∼1.5 times higher than the activity of risk E3 sequence (Figure 5A). Consistent with our ‘local enhancer activity amplification due to long-range chromatin interactions’ hypothesis, allele-specific ChIP-qPCR experiments demonstrated that H3K27ac signal at E3 enhancer on non-risk haplotype is ∼8.5 times higher than on risk haplotype (Figure 5B), the reasoning being that enhancer activity in reporter assays lacks long-range chromatin context whereas the H3K27ac ChIP-qPCR measures endogenous enhancer activity in this particular chromatin context. Together, these findings support our hypothesis that local allele-specific enhancer activities are influenced by global haplotype structure due to chromatin looping interactions.
Our chromatin interaction data also revealed that BLK promoter interacts haplotype-specifically with a distal repressor REST binding site and the FAM167A gene promoter, with the interactions being stronger on the SLE risk haplotype (Figures 2,3), consistent with reduced expression of BLK on the risk haplotype, and the hypothesis that BLK promoter is “enhancer-like” and may regulate expression of FAM167A, respectively. For recent research on transcriptional regulation by “enhancer-like” promoters, see (Xu et al., 2011; Dao et al., 2017; Dao and Spicuglia, 2018). We tested our hypothesis on the regulation of FAM167A expression by the “enhancer-like” BLK promoter using dCas9-KRAB chromatin repressor experiments (Figure 4). These experiments have provided strong evidence in support of our hypothesis.
These results nominate FAM167A, in addition to BLK, or both as potential risk genes at the FAM167A-BLK locus. If the regulatory structure we present herein is responsible for the change in disease risk for SLE, and maybe, other disorders associated with the FAM167A-BLK locus, rather than a different regulatory structure in another cell type, then perhaps FAM176A is the true gene mediating disease risk for two reasons. First, down-regulating signal transduction from the B cell receptor by reducing BLK expression would seem to be counter-intuitive for a disease like SLE where autoantibody generation is central to pathogenesis. Second, DIORA-1 (the gene product of FAM167A) has an activity that could well have a profound influence on the inflammatory response. DIORA-1 is a disordered protein (Mentlein et al., 2018) that is secreted and binds desmoglein-1 (DSG1) to gain cell entry, which then activates NFκB via its non-canonical pathway by liberating NFκB-inhibitor kinase from DSG1. DIORA-1 appears responsible for much BCR-ABL-tyrosine kinase inhibitor resistance in chronic myelogenous leukemia (CML) (Yang et al., 2022). Certainly, DIORA-1 has functional properties that make the level of activity of this gene product attractive for mediating SLE risk. An understanding of the evolutionary advantage for BLK and FAM167A to be reciprocally regulated in the way we describe awaits a deeper understanding of the inter-relationships of the pathways impacted by their two gene products. However, the multiple diseases with risk variants at this locus would be consistent with a continuing evolutionary impact.
Haplotype-specific enhancer-enhancer and enhancer-promoter chromatin interactions (Figure 2), and evidence for the “local enhancer activity amplification due to long-range chromatin interactions” hypothesis (Figure 5) have led us to seek functional evidence of synergistic interactions of BLK transcriptional regulatory elements. Using dCas9-p300 CRISPR epigenome editing experiments, we have activated the silent BLK locus in K562 cells and demonstrated enhancer-enhancer and enhancer-promoter synergies in BLK activation (Figure 6).
Our genetic analyses have revealed that enhancer haplotypes can modulate BLK expression (Figure 7) and suggested a “risk dosage” model whereby disease risk alleles at multiple regulatory elements at BLK locus synergistically decrease gene expression, and consequently, increase disease risk.
These studies have been done with LCLs, which are generally, B cell lines that have been infected by Epstein-Barr virus (EBV), which is strong etiologic candidate for causing SLE and Multiple Sclerosis (MS) (Harley and James, 2006; Bjornevik et al., 2022; Laurynenka et al., 2022). The LCL is a stable transformed cell line expressing the Latency III program of EBV. The EBV gene product and transcription co-factor, EBNA2, is concentrated at SLE and MS risk loci, including BLK (Harley et al., 2018, p. 2; Yin et al., 2021). Recently, Afrasiabi et al. (2022), have extended these observations by showing that BLK and FAM167A are bound by EBNA2 and the products of both genes are differentially expressed as eQTLs in greater magnitude in LCLs than in B cells that are not EBV infected, with BLK and FAM167A being affected in opposing directions. Both BLK and FAM167A are correlated with EBV DNA copy number per cell, with the association with FAM167A being much more convincing. Finally, the level of EBNA2 in their data is inversely proportional to the level of BLK expression. These observations add another level of complexity relating the environment to disease risk that begs for an understanding of how these differences may or may not be components of mechanisms that influence disease risk.
Common SNPs with effect sizes well below genome-wide statistical significance account for a large proportion of “missing heritability” of many traits (Yang et al., 2010). However, mechanistic details of how weak-effect genetic variants contribute to heritability and disease risk remain largely unknown because we still have very limited knowledge of how these variants percolate through the entire cellular and gene regulatory networks (Boyle et al., 2017). Investigations such as those in (Corradin et al., 2016; Boyle et al., 2017), and the present study represent important steps toward deciphering the mechanistic details of the genotype-phenotype map in disease etiology.
Data availability statement
The high-throughput sequencing data from this study have been submitted to the NCBI Gene Expression Omnibus (GEO; https://www.ncbi.nlm.nih.gov/geo) under accession number GSE211246. The original contributions presented in the study are included in the article/Supplementary Material. Further inquiries can be directed to the corresponding authors.
Author contributions
IC conceived the study. IC, MS-JR, PT, and JH designed the study. MS-JR and PT performed the experiments. IC, PT, MS-JR, and BN analyzed the data. IC and JH drafted the article. All authors contributed to the article and approved the submitted version.
Funding
This work was supported by funding (to IC) from the Lupus Research Alliance, Arthritis National Research Foundation, National Psoriasis Foundation, and Cincinnati Children’s Research Foundation, and by the following grants (to JH): NIH grants R01 AI024717, R01 AI148276, U01 AI130830, UM1 AI144292, U54 GM104938, and P30 AR073750 and a USDVA Merit Award I01 BX001834.
Acknowledgments
We would like to thank Cincinnati Children’s Hospital Medical Center’s DNA Sequencing and Genotyping Core, and Viral Vector Core for the sequencing and lentivirus production services provided for this study. We would also like to thank Isaac Harley for his comments on the manuscript and for bringing recent work on the functional characterization of FAM167A gene product DIORA-1 to our attention.
Conflict of interest
The authors declare that the research was conducted in the absence of any commercial or financial relationships that could be construed as a potential conflict of interest.
Publisher’s note
All claims expressed in this article are solely those of the authors and do not necessarily represent those of their affiliated organizations, or those of the publisher, the editors and the reviewers. Any product that may be evaluated in this article, or claim that may be made by its manufacturer, is not guaranteed or endorsed by the publisher.
Supplementary material
The Supplementary Material for this article can be found online at: https://www.frontiersin.org/articles/10.3389/fgene.2022.1008582/full#supplementary-material
References
Afrasiabi, A., Keane, J. T., Ong, L. T. C., Alinejad-Rokny, H., Fewings, N. L., Booth, D. R., et al. (2022). Genetic and transcriptomic analyses support a switch to lytic phase in Epstein Barr virus infection as an important driver in developing Systemic Lupus Erythematosus. J. Autoimmun. 127, 102781. doi:10.1016/j.jaut.2021.102781
Babu, D., and Fullwood, M. J. (2015). 3D genome organization in health and disease: Emerging opportunities in cancer translational medicine. Nucleus 6, 382–393. doi:10.1080/19491034.2015.1106676
Bjornevik, K., Cortese, M., Healy, B. C., Kuhle, J., Mina, M. J., Leng, Y., et al. (2022). Longitudinal analysis reveals high prevalence of Epstein-Barr virus associated with multiple sclerosis. Science 375, 296–301. doi:10.1126/science.abj8222
Borowiec, M., Liew, C. W., Thompson, R., Boonyasrisawat, W., Hu, J., Mlynarski, W. M., et al. (2009). Mutations at the BLK locus linked to maturity onset diabetes of the young and beta-cell dysfunction. Proc. Natl. Acad. Sci. U. S. A. 106, 14460–14465. doi:10.1073/pnas.0906474106
Boyle, E. A., Li, Y. I., and Pritchard, J. K. (2017). An expanded view of complex traits: From polygenic to omnigenic. Cell 169, 1177–1186. doi:10.1016/j.cell.2017.05.038
Castillejo-López, C., Delgado-Vega, A. M., Wojcik, J., Kozyrev, S. V., Thavathiru, E., Wu, Y.-Y., et al. (2012). Genetic and physical interaction of the B-cell systemic lupus erythematosus-associated genes BANK1 and BLK. Ann. Rheum. Dis. 71, 136–142. doi:10.1136/annrheumdis-2011-200085
Chepelev, I., Wei, G., Wangsa, D., Tang, Q., and Zhao, K. (2012). Characterization of genome-wide enhancer-promoter interactions reveals co-expression of interacting genes and modes of higher order chromatin organization. Cell Res. 22, 490–503. doi:10.1038/cr.2012.15
Corradin, O., Saiakhova, A., Akhtar-Zaidi, B., Myeroff, L., Willis, J., Cowper-Sal lari, R., et al. (2014). Combinatorial effects of multiple enhancer variants in linkage disequilibrium dictate levels of gene expression to confer susceptibility to common traits. Genome Res. 24, 1–13. doi:10.1101/gr.164079.113
Corradin, O., Cohen, A. J., Luppino, J. M., Bayles, I. M., Schumacher, F. R., and Scacheri, P. C. (2016). Modeling disease risk through analysis of physical interactions between genetic variants within chromatin regulatory circuitry. Nat. Genet. 48, 1313–1320. doi:10.1038/ng.3674
Creyghton, M. P., Cheng, A. W., Welstead, G. G., Kooistra, T., Carey, B. W., Steine, E. J., et al. (2010). Histone H3K27ac separates active from poised enhancers and predicts developmental state. Proc. Natl. Acad. Sci. U. S. A. 107, 21931–21936. doi:10.1073/pnas.1016071107
Dao, L. T. M., and Spicuglia, S. (2018). Transcriptional regulation by promoters with enhancer function. Transcription 9, 307–314. doi:10.1080/21541264.2018.1486150
Dao, L. T. M., Galindo-Albarrán, A. O., Castro-Mondragon, J. A., Andrieu-Soler, C., Medina-Rivera, A., Souaid, C., et al. (2017). Genome-wide characterization of mammalian promoters with distal enhancer functions. Nat. Genet. 49, 1073–1081. doi:10.1038/ng.3884
de Wit, E., and de Laat, W. (2012). A decade of 3C technologies: insights into nuclear organization. Genes Dev. 26, 11–24. doi:10.1101/gad.179804.111
Delgado-Vega, A. M., Dozmorov, M. G., Quirós, M. B., Wu, Y.-Y., Martínez-García, B., Kozyrev, S. V., et al. (2012). Fine mapping and conditional analysis identify a new mutation in the autoimmunity susceptibility gene BLK that leads to reduced half-life of the BLK protein. Ann. Rheum. Dis. 71, 1219–1226. doi:10.1136/annrheumdis-2011-200987
Dryden, N. H., Broome, L. R., Dudbridge, F., Johnson, N., Orr, N., Schoenfelder, S., et al. (2014). Unbiased analysis of potential targets of breast cancer susceptibility loci by Capture Hi-C. Genome Res. 24, 1854–1868. doi:10.1101/gr.175034.114
Gourh, P., Agarwal, S. K., Martin, E., Divecha, D., Rueda, B., Bunting, H., et al. (2010). Association of the C8orf13-BLK region with systemic sclerosis in North-American and European populations. J. Autoimmun. 34, 155–162. doi:10.1016/j.jaut.2009.08.014
Gusev, A., Bhatia, G., Zaitlen, N., Vilhjalmsson, B. J., Diogo, D., Stahl, E. A., et al. (2013). Quantifying missing heritability at known GWAS loci. PLoS Genet. 9, e1003993. doi:10.1371/journal.pgen.1003993
Gusev, A., Lee, S. H., Trynka, G., Finucane, H., Vilhjálmsson, B. J., Xu, H., et al. (2014). Partitioning heritability of regulatory and cell-type-specific variants across 11 common diseases. Am. J. Hum. Genet. 95, 535–552. doi:10.1016/j.ajhg.2014.10.004
Guthridge, J. M., Lu, R., Sun, H., Sun, C., Wiley, G. B., Dominguez, N., et al. (2014). Two functional lupus-associated BLK promoter variants control cell-type- and developmental-stage-specific transcription. Am. J. Hum. Genet. 94, 586–598. doi:10.1016/j.ajhg.2014.03.008
Harley, J. B., and James, J. A. (2006). Epstein-Barr virus infection induces lupus autoimmunity. Bull. NYU Hosp. Jt. Dis. 64, 45–50.
Harley, J. B., Chen, X., Pujato, M., Miller, D., Maddox, A., Forney, C., et al. (2018). Transcription factors operate across disease loci, with EBNA2 implicated in autoimmunity. Nat. Genet. 50, 699–707. doi:10.1038/s41588-018-0102-3
Hilton, I. B., D’Ippolito, A. M., Vockley, C. M., Thakore, P. I., Crawford, G. E., Reddy, T. E., et al. (2015). Epigenome editing by a CRISPR-Cas9-based acetyltransferase activates genes from promoters and enhancers. Nat. Biotechnol. 33, 510–517. doi:10.1038/nbt.3199
Hindorff, L. A., Sethupathy, P., Junkins, H. A., Ramos, E. M., Mehta, J. P., Collins, F. S., et al. (2009). Potential etiologic and functional implications of genome-wide association loci for human diseases and traits. Proc. Natl. Acad. Sci. U. S. A. 106, 9362–9367. doi:10.1073/pnas.0903103106
Hnisz, D., Abraham, B. J., Lee, T. I., Lau, A., Saint-André, V., Sigova, A. A., et al. (2013). Super-enhancers in the control of cell identity and disease. Cell 155, 934–947. doi:10.1016/j.cell.2013.09.053
Hom, G., Graham, R. R., Modrek, B., Taylor, K. E., Ortmann, W., Garnier, S., et al. (2008). Association of systemic lupus erythematosus with C8orf13-BLK and ITGAM-ITGAX. N. Engl. J. Med. 358, 900–909. doi:10.1056/NEJMoa0707865
International Consortium for Systemic Lupus Erythematosus Genetics (SLEGEN) Harley, J. B., Alarcón-Riquelme, M. E., Criswell, L. A., Jacob, C. O., Kimberly, R. P., Moser, K. L., et al. (2008). Genome-wide association scan in women with systemic lupus erythematosus identifies susceptibility variants in ITGAM, PXK, KIAA1542 and other loci. Nat. Genet. 40, 204–210. doi:10.1038/ng.81
Ito, I., Kawasaki, A., Ito, S., Hayashi, T., Goto, D., Matsumoto, I., et al. (2009). Replication of the association between the C8orf13-BLK region and systemic lupus erythematosus in a Japanese population. Arthritis Rheum. 60, 553–558. doi:10.1002/art.24246
Jäger, R., Migliorini, G., Henrion, M., Kandaswamy, R., Speedy, H. E., Heindl, A., et al. (2015). Capture Hi-C identifies the chromatin interactome of colorectal cancer risk loci. Nat. Commun. 6, 6178. doi:10.1038/ncomms7178
Klann, T. S., Black, J. B., Chellappan, M., Safi, A., Song, L., Hilton, I. B., et al. (2017). CRISPR-Cas9 epigenome editing enables high-throughput screening for functional regulatory elements in the human genome. Nat. Biotechnol. 35, 561–568. doi:10.1038/nbt.3853
Krijger, P. H. L., and de Laat, W. (2016). Regulation of disease-associated gene expression in the 3D genome. Nat. Rev. Mol. Cell Biol. 17, 771–782. doi:10.1038/nrm.2016.138
Lappalainen, T., Sammeth, M., Friedländer, M. R., ’t Hoen, P. A. C., Monlong, J., Rivas, M. A., et al. (2013). Transcriptome and genome sequencing uncovers functional variation in humans. Nature 501, 506–511. doi:10.1038/nature12531
Laurynenka, V., Ding, L., Kaufman, K. M., James, J. A., and Harley, J. B. (2022). A high prevalence of anti-EBNA1 heteroantibodies in systemic lupus erythematosus (SLE) supports anti-EBNA1 as an origin for SLE autoantibodies. Front. Immunol. 13, 830993. doi:10.3389/fimmu.2022.830993
Lessard, C. J., Li, H., Adrianto, I., Ice, J. A., Rasmussen, A., Grundahl, K. M., Kelly, J. A., et al. (2013). Variants at multiple loci implicated in both innate and adaptive immune responses are associated with Sjögren’s syndrome. Nat. Genet. 45, 1284–1292. doi:10.1038/ng.2792
Li, G., Ruan, X., Auerbach, R. K., Sandhu, K. S., Zheng, M., Wang, P., et al. (2012). Extensive promoter-centered chromatin interactions provide a topological basis for transcription regulation. Cell 148, 84–98. doi:10.1016/j.cell.2011.12.014
Li, Y., Hu, M., and Shen, Y. (2018). Gene regulation in the 3D genome. Hum. Mol. Genet. 27, R228–R233. doi:10.1093/hmg/ddy164
Manolio, T. A., Collins, F. S., Cox, N. J., Goldstein, D. B., Hindorff, L. A., Hunter, D. J., et al. (2009). Finding the missing heritability of complex diseases. Nature 461, 747–753. doi:10.1038/nature08494
Mentlein, L., Thorlacius, G. E., Meneghel, L., Aqrawi, L. A., Ramírez Sepúlveda, J. I., Grunewald, J., et al. (2018). The rheumatic disease-associated FAM167A-BLK locus encodes DIORA-1, a novel disordered protein expressed highly in bronchial epithelium and alveolar macrophages. Clin. Exp. Immunol. 193, 167–177. doi:10.1111/cei.13138
Namjou, B., Ni, Y., Harley, I. T. W., Chepelev, I., Cobb, B., Kottyan, L. C., et al. (2014). The effect of inversion at 8p23 on BLK association with lupus in Caucasian population. PloS One 9, e115614. doi:10.1371/journal.pone.0115614
Nashi, E., Wang, Y., and Diamond, B. (2010). The role of B cells in lupus pathogenesis. Int. J. Biochem. Cell Biol. 42, 543–550. doi:10.1016/j.biocel.2009.10.011
Ooi, L., and Wood, I. C. (2007). Chromatin crosstalk in development and disease: lessons from REST. Nat. Rev. Genet. 8, 544–554. doi:10.1038/nrg2100
Perez-Pinera, P., Kocak, D. D., Vockley, C. M., Adler, A. F., Kabadi, A. M., Polstein, L. R., et al. (2013). RNA-guided gene activation by CRISPR-Cas9-based transcription factors. Nat. Methods 10, 973–976. doi:10.1038/nmeth.2600
Rao, S. S. P., Huntley, M. H., Durand, N. C., Stamenova, E. K., Bochkov, I. D., Robinson, J. T., et al. (2014). A 3D map of the human genome at kilobase resolution reveals principles of chromatin looping. Cell 159, 1665–1680. doi:10.1016/j.cell.2014.11.021
Rasmussen, A., Sevier, S., Kelly, J. A., Glenn, S. B., Aberle, T., Cooney, C. M., et al. (2011). The lupus family registry and repository. Rheumatology 50, 47–59. doi:10.1093/rheumatology/keq302
Salm, M. P. A., Horswell, S. D., Hutchison, C. E., Speedy, H. E., Yang, X., Liang, L., et al. (2012). The origin, global distribution, and functional impact of the human 8p23 inversion polymorphism. Genome Res. 22, 1144–1153. doi:10.1101/gr.126037.111
Sánchez, E., Comeau, M. E., Freedman, B. I., Kelly, J. A., Kaufman, K. M., Langefeld, C. D., et al. (2011). Identification of novel genetic susceptibility loci in African American lupus patients in a candidate gene association study. Arthritis Rheum. 63, 3493–3501. doi:10.1002/art.30563,
Servant, N., Varoquaux, N., Lajoie, B. R., Viara, E., Chen, C.-J., Vert, J.-P., et al. (2015). HiC-pro: an optimized and flexible pipeline for hi-C data processing. Genome Biol. 16, 259. doi:10.1186/s13059-015-0831-x
Simpfendorfer, K. R., Olsson, L. M., Manjarrez Orduño, N., Khalili, H., Simeone, A. M., Katz, M. S., et al. (2012). The autoimmunity-associated BLK haplotype exhibits cis-regulatory effects on mRNA and protein expression that are prominently observed in B cells early in development. Hum. Mol. Genet. 21, 3918–3925. doi:10.1093/hmg/dds220
Stansfield, J. C., Cresswell, K. G., and Dozmorov, M. G. (2019). multiHiCcompare: joint normalization and comparative analysis of complex Hi-C experiments. Bioinformatics 35, 2916–2923. doi:10.1093/bioinformatics/btz048
Suarez-Gestal, M., Calaza, M., Endreffy, E., Pullmann, R., Ordi-Ros, J., Sebastiani, G. D., et al. (2009). Replication of recently identified systemic lupus erythematosus genetic associations: a case-control study. Arthritis Res. Ther. 11, R69. doi:10.1186/ar2698
Thakore, P. I., D’Ippolito, A. M., Song, L., Safi, A., Shivakumar, N. K., Kabadi, A. M., et al. (2015). Highly specific epigenome editing by CRISPR-Cas9 repressors for silencing of distal regulatory elements. Nat. Methods 12, 1143–1149. doi:10.1038/nmeth.3630
Thalayasingam, N., Nair, N., Skelton, A. J., Massey, J., Anderson, A. E., Clark, A. D., et al. (2018). CD4+ and B Lymphocyte expression quantitative traits at rheumatoid arthritis risk loci in patients with untreated early arthritis: Implications for causal gene identification. Arthritis Rheumatol. 70, 361–370. doi:10.1002/art.40393
Tsuchiya, N., Ito, I., and Kawasaki, A. (2010). Association of IRF5, STAT4 and BLK with systemic lupus erythematosus and other rheumatic diseases. Nihon Rinsho Meneki Gakkai Kaishi 33, 57–65. doi:10.2177/jsci.33.57
Wellcome Trust Case Control Consortium Maller, J. B., McVean, G., Byrnes, J., Vukcevic, D., Palin, K., Su, Z., et al. (2012). Bayesian refinement of association signals for 14 loci in 3 common diseases. Nat. Genet. 44, 1294–1301. doi:10.1038/ng.2435
Xu, Z., Wei, G., Chepelev, I., Zhao, K., and Felsenfeld, G. (2011). Mapping of INS promoter interactions reveals its role in long-range regulation of SYT8 transcription. Nat. Struct. Mol. Biol. 18, 372–378. doi:10.1038/nsmb.1993
Yang, J., Benyamin, B., McEvoy, B. P., Gordon, S., Henders, A. K., Nyholt, D. R., et al. (2010). Common SNPs explain a large proportion of the heritability for human height. Nat. Genet. 42, 565–569. doi:10.1038/ng.608
Yang, T., Sim, K.-Y., Ko, G.-H., Ahn, J.-S., Kim, H.-J., and Park, S.-G. (2022). FAM167A is a key molecule to induce BCR-ABL-independent TKI resistance in CML via noncanonical NF-κB signaling activation. J. Exp. Clin. Cancer Res. 41, 82. doi:10.1186/s13046-022-02298-1
Yin, H., Borghi, M. O., Delgado-Vega, A. M., Tincani, A., Meroni, P.-L., and Alarcón-Riquelme, M. E. (2009). Association of STAT4 and BLK, but not BANK1 or IRF5, with primary antiphospholipid syndrome. Arthritis Rheum. 60, 2468–2471. doi:10.1002/art.24701
Yin, X., Kim, K., Suetsugu, H., Bang, S.-Y., Wen, L., Koido, M., et al. (2021). Meta-analysis of 208370 East Asians identifies 113 susceptibility loci for systemic lupus erythematosus. Ann. Rheum. Dis. 80, 632–640. doi:10.1136/annrheumdis-2020-219209
Keywords: gene regulation, enhancer, enhancer-like promoter, genetic interaction, missing heritability, BLK, systemic lupus erythematosus (SLE), FAM167A
Citation: Saint Just Ribeiro M, Tripathi P, Namjou B, Harley JB and Chepelev I (2022) Haplotype-specific chromatin looping reveals genetic interactions of regulatory regions modulating gene expression in 8p23.1. Front. Genet. 13:1008582. doi: 10.3389/fgene.2022.1008582
Received: 01 August 2022; Accepted: 18 August 2022;
Published: 07 September 2022.
Edited by:
Yonghu Sun, Shandong Provincial Hospital of Dermatology, ChinaReviewed by:
Zhilian Jia, City of Hope National Medical Center, United StatesLongli Kang, Xizang Minzu University, China
Copyright © 2022 Saint Just Ribeiro, Tripathi, Namjou, Harley and Chepelev. This is an open-access article distributed under the terms of the Creative Commons Attribution License (CC BY). The use, distribution or reproduction in other forums is permitted, provided the original author(s) and the copyright owner(s) are credited and that the original publication in this journal is cited, in accordance with accepted academic practice. No use, distribution or reproduction is permitted which does not comply with these terms.
*Correspondence: Iouri Chepelev, aWNoZXBlbGV2QGdtYWlsLmNvbQ==; John B. Harley, am9obmJoYXJsZXlAeWFob28uY29t
†These authors have contributed equally to this work and share first authorship