 Yue Gong
 Benzhi Dong
 Zixiao Zhang1
 Yixiao Zhai
 Bo Gao
 Tianjiao Zhang
- 1College of Information and Computer Engineering, Northeast Forestry University, Harbin, China
- 2Department of Radiology, The Second Affiliated Hospital, Harbin Medical University, Harbin, China
- 3Department of Neurology, The Fourth Affiliated Hospital of Harbin Medical University, Harbin, China
Vesicular transport proteins are related to many human diseases, and they threaten human health when they undergo pathological changes. Protein function prediction has been one of the most in-depth topics in bioinformatics. In this work, we developed a useful tool to identify vesicular transport proteins. Our strategy is to extract transition probability composition, autocovariance transformation and other information from the position-specific scoring matrix as feature vectors. EditedNearesNeighbours (ENN) is used to address the imbalance of the data set, and the Max-Relevance-Max-Distance (MRMD) algorithm is adopted to reduce the dimension of the feature vector. We used 5-fold cross-validation and independent test sets to evaluate our model. On the test set, VTP-Identifier presented a higher performance compared with GRU. The accuracy, Matthew’s correlation coefficient (MCC) and area under the ROC curve (AUC) were 83.6%, 0.531 and 0.873, respectively.
1 Introduction
Researchers have paid more attention to vesicular transport proteins in recent years. Vesicular transport is that macromolecular substances or granular substances cannot pass through the cell membrane, but transport across the cell membrane in another special way, that is, substances are wrapped by the membrane, formed vesicular, fused with the membrane or broken in the process of transport in and out of the cell. Vesicular transport proteins are contained in the cell membrane, which can promote the activity of dominant molecules on the vesicle membrane. When macromolecules and particles cannot cross the cell membrane, vesicular transport proteins take on the task of transporting them. To date, many studies have confirmed that abnormal vesicular transport proteins may cause a variety of human diseases (Zhang et al., 2019; Zeng et al., 2020a), such as Hermansky-Pudlaksyndrome and chylomron retention disease (Cláudio et al., 2001; Suzuki et al., 2006). As the relationship between vesicular transport proteins and related diseases is gradually becoming clear, it is particularly important to deepen the study of vesicular transport proteins.
In view of the importance of vesicular transport proteins in eukaryotic cells, researchers in the area of cell biology have been committed to developing experimental techniques that can identify vesicular transport proteins and have achieved excellent results, such as morpholino knockdown (Hager et al., 2010) and dissection (Orci et al., 1989). These techniques can accurately identify vesicular transport proteins, but these technologies are often not very efficient and are expensive, so it is particularly necessary to find a time-saving and high accuracy method to identify vesicular transport proteins.
In recent years, protein function prediction has been a hot topic in the field of computational biology (Ding et al., 2020a; Fu et al., 2020; Guo et al., 2020; Tao et al., 2020; Wang et al., 2020; Zhai et al., 2020; Cai et al., 2021; Li et al., 2021; Yang, 2021). With the continuous enrichment of protein data, the technology of applying machine learning and data mining to protein function prediction is gradually maturing (Liu et al., 2019; Ding et al., 2020b; Ding et al., 2020c; Liu et al., 2020; Zhao et al., 2021). For example, some researchers used machine learning technology and created high accuracy models by sequence analysis (Chou, 2009; Cui et al., 2019; Jin et al., 2021; Shao et al., 2021), position-specific scoring matrix (PSSM) (Jones, 1999), and to determine various physicochemical and biochemical properties of amino acids (Kawashima and Kanehisa, 2000; Zhang et al., 2021; Zulfiqar et al., 2021). The above studies have shown that the use of computer technology in protein identification is reliable. Deep learning has attracted much attention, and researchers have been trying to create new deep neural networks to solve protein-related problems, such as the prediction of DNA-binding proteins (Qu et al., 2017), human protein subcellular localization (Wei et al., 2018a) and SNARE-CNN (Le and Nguyen, 2019). An increasing number of models and algorithms that can accurately identify proteins have been developed. Therefore, we adopted a machine learning method to obtain a model that can identify vesicular transport proteins.
In the previous study of Nguyen Quoc Khanh Le (Le et al., 2019), the strategy that includes gated recurrent units and PSSM was adopted, and the accuracy and Matthew’s correlation coefficient (MCC) of the final model reached 82.3% and 0.52 in the cross-validation set and 85.8% and 0.44 in the independent test data set, which is an excellent result. Deep learning can often achieve high accuracy, but this method will be time-consuming due to training and has a high requirement for computer equipment. Taking PSSM as input to the model for training will also increase the training time, so we hope to find a more efficient and more accurate method to identify vesicular transport proteins.
The method used in this paper extracts information such as transition probability composition, autocovariance transformation and other information from PSSM as a feature vector. We adopted undersampling, oversampling and combined sampling methods to reduce the imbalance of the data set. The Max-Relevance-Max-Distance algorithm (Zou et al., 2016) was used to sort features and reduce the number of features. In this work, we selected XGBoost as the classifier and evaluated our model with 5-fold cross-validation. Finally, we obtained a better model than a previous study, which had high efficiency and accurate identification of vesicular transport proteins.
2 Materials and Methods
The flowchart of our work is shown in Figure 1, and each section in the figure is described in detail in the following sections.
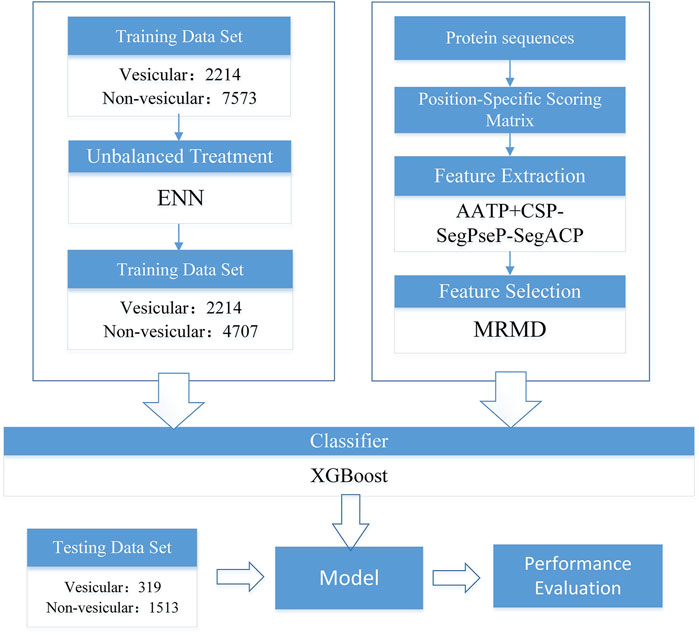
FIGURE 1. Training flow chart of the prediction model of vesicular transport proteins.
2.1 Benchmark Dataset
In this work, we used the dataset provided in Nguyen Quoc Khanh Le’s study (Le et al., 2019) as the benchmark dataset. The numbers of vesicular transport proteins and non-vesicular transport proteins were 2,533 and 9,086, respectively, and we took vesicular transport proteins as positive samples and non-vesicular transport proteins as negative samples. We divided the data set into a training set and a testing set, and the details are shown in Table 1.
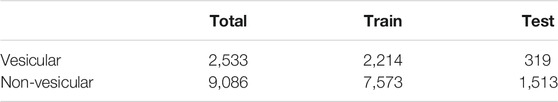
TABLE 1. Statistics of the dataset in this work.
2.2 Unbalanced Datasets Treatment
We used seven methods from an unbalanced-learning library (Lemaître et al., 2017) to address the imbalance in the dataset. The methods used for undersampling were RandomUnder, ClusterCentroids, NearMiss and EditedNearesNeighbours (ENN). The method used for over-sampling was SMOTE, a total of 5,300 positive sample data have been generated. We used default parameters for these methods. For the cleaning undersampling techniques, ENN adjusted the ratio of positive and negative samples to 1:2. The other four methods changed the number of positive and negative samples to equal. The methods used from the combined methods were SMOTEENN and SMOTETomek. We adjusted the parameters of these two methods and adjusted the proportion of positive and negative samples to 1:1.
As the SMOTE, SMOTEENN and SMOTETomek methods will generate new samples, the results of 5-fold cross-validation processed by these methods are not accurate, so special cross-validation should be performed when using these three methods. K-fold cross-validation divides the training dataset into k subdatasets; k-1 subdatasets are used to train the model, and the rest are used for validation. Our method uses SMOTE and other unbalanced data processing methods to train the k-1 subdataset and then uses the validation set to evaluate the model.
2.3 Feature Extraction
To date, a strategy that includes deep learning and PSSM profiles has been frequently adopted to realize the identification of unknown proteins and has achieved excellent results. However, the strategy is slightly inefficient, so in this work, we used other machine learning models and adopted RPSSM (Ding et al., 2014), CSP-SegPseP-SegACP (Liang et al., 2015), AATP (Zhang et al., 2012), DWT (Wang et al., 2017; Wang, 2019) and SOMA (Liang and Zhang, 2017) to extract features from the PSSM matrix and make a comparison. Among them, AATP and CSP-SegPseP-SegACP have the highest MCC and AUC, so they are selected as feature extraction methods.
2.3.1 Position-Specific Scoring Matrix
PSSM can reveal the evolutionary information of proteins (Jones, 1999). PSSM was mainly used to predict protein secondary structure, now it has been widely used in the field of bioinformatics. Previous studies have shown that it is reliable to extract PSSM from protein sequences, and the evolutionary information in PSSM has more research value than the sequence itself (Kim and Park, 2004).
According to the definition of PSSM, we described PSSM by the following formula:
where
2.3.2 AATP
AATP can be extracted from PSSM, which consists of two feature vectors: amino acid composition (AAC) and transition probability composition (TPC). AAC can be described by the following:
where
TPC is a feature vector of 400 dimensions that is extracted from the transition probability matrix (TPM) by:
where
The new feature vector AATP can be obtained by integrating AAC and TPC, and each protein sequence can extract 20 + 400 = 420 features.
2.3.3 CSP-SegPseP-SegACP
CSP-SegPseP-SegACP consists of the following three parts: Pseudo-position-specific scoring matrix (PsePSSM), Autocovariance Transformation and Consensus Sequence Based on PSSM.
2.3.3.1 PsePSSM
In this step, PSSM is processed twice. For the first time, PSSM was divided into two equal length segments
where
Next, the PSSM is divided into three segments
This time, 180-dimensional feature vectors are obtained. Combined with the results of the previous stage, a 380-dimensional feature vector can be extracted from PSSM.
2.3.3.2 Autocovariance Transformation
In this step, the information contained in the sequence is further extracted by calculating the autocovariance transformation. Similar to the previous step, the PSSM is divided into two segments and three segments, and then the ACT-PSSM feature vector is obtained by the following equations when divided into two segments:
where
2.3.3.3 Consensus Sequence Based on PSSM
This step adopts the method in (Patthy, 1987) and generates a consensus sequence as follows:
Next, we compute CSAAC, which shows 20 amino acid composition features of the consensus sequence, and CSCM, which represents 20 composition moment features for CS. Through the combination of the above two feature vectors, we obtain a 40-dimensional feature vector based on CS.
The 700-dimensional CSP-SegPseP-SegACP feature vector is obtained by fusing the features obtained from the above three steps.
2.4 Feature Selection
In this section, we adopted Max-Relevance-Max-Distance algorithm (MRMD) (Zou et al., 2016) to reduce the dimension of the feature vector, MRMD uses the Pearson correlation coefficient to balance the correlation between the subfeature set and the target class and uses various distance functions to obtain the redundancy of each subfeature set. The subfeature set selected by MRMD has low redundancy and strong correlation with the target class.
2.5 Classification
We compared the performance of four different popular classification methods which are the RF, SVM, KNN and XGBoost to identified VTP. Due to six performance evaluations on the training set, we chose XGBoost as our classification method.
XGBoost (Chen and Guestrin, 2016) is a machine learning method with an excellent classification effect and high efficiency that has been widely used in recent years(Long et al., 2021; Yang et al., 2021). It stands out from many of the challenges of machine learning and data mining. In this paper, XGBoost performed very well, and it still obtained good results under the premise of high training efficiency.
3 Results
3.1 Assessment of Predictive Ability
In this work, our goal was to obtain a model to predict whether the unknown type of protein sequence belongs to vesicular transport proteins, so we took vesicular transport proteins in the data set as positive samples and non-vehicular transport proteins as negative samples. In each section of our work, to evaluate our model, we used 5-fold cross-validation several times and calculated the average value as the final result. After obtaining the results of cross-validation, we used a test data set to test our model and make adjustments.
To evaluate our model comprehensively, we used several methods, including accuracy (ACC), sensitivity (Sens), specificity (Spec), precision, Matthew’s correlation coefficient (MCC) and area under the ROC curve (AUC) (Jiang et al., 2013; Wei et al., 2014; Wei et al., 2017; Wei et al., 2018b; Su et al., 2019; Zeng et al., 2020b; Hong et al., 2020; Su et al., 2020; Tang et al., 2020; Dao, 2021; Shao and Liu, 2021; Wang, 2021). These methods are defined as follows:
where TP, FP, TN and FN represent true positives, false positives, true negatives, and false negatives, respectively.
3.2 Comparison of the Different Unbalanced Data Processing Methods
In the previous section, we selected CSP-SegPseP-SegACP and AATP as the feature extraction methods. Next, we compared the effects of different unbalanced processing methods on the model.
When the samples are in an unbalanced state, the model trained by machine learning tends to be more inclined to a large number of samples. (Fdez-Glez et al., 2018).
We used seven methods from an unbalanced-learning library to address the imbalance in the data set. The methods are RandomUnder, ClusterCentroids, NearMiss, EditedNearesNeighbours (ENN), SMOTE, SMOTEENN and SMOTETomek. The RandomUnder, ClusterCentroids and NearMiss adjusted the number of positive and negative samples to 2214:2214. The ENN adjusted the number of positive and negative samples to 2214:4707. The SMOTE adjusted the number of positive and negative samples to 7573:7573. The SMOTEENN and SMOTETomek adjusted the number of positive and negative samples to 5000:5000.
In this part of our work, we set the XGBoost parameter scale_pos_weight = default to avoid XGBoost training being more biased towards positive samples. Other parameters of XGBoost are set as follows: learning_rate = 0.1, n_estimators = 1,000, max_depth = 8, min_child_weight = 1, gamma = 0, subsample = 0.8, colsample_bytree = 0.8, objective = “binary:logistic”, nthread = 20. We found that the ENN method is the best, and its ACC, MCC, AUC and so on are significantly higher than those of the other methods. Therefore, ENN was selected as the final unbalanced data processing method. The result on the training set after using different imbalance processing algorithms is shown in Figure 2.

FIGURE 2. The values of the different unbalanced data processing methods on the training set.
When dealing with unbalanced data, we cannot precisely control the proportion of positive and negative samples when using ENN. The dataset was still slightly unbalanced, so we continued to adjust the parameter scale_pos_weight of XGBoost, which makes the classifier tend to have small samples in the training process. Finally, we set scale_pos_weight = 0.6. The performance of the model is shown in Table 2.

TABLE 2. Evaluation of model performance after processing unbalanced data by ENN.
3.3 Comparison of the Different Feature Extraction Methods
In previous studies, the training model using PSSM as input can effectively predict vesicular transport proteins, which indicates that PSSM has important information to identify vesicular transport proteins. In this paper, the methods of extracting features from PSSM were used to further extract the key information in PSSM and to improve the efficiency of the training model.
In this section, RPSSM, AATP, CSP-SegPseP-SegACP, SOMA, and DWT were used to extract features from PSSM. In addition to different feature extraction methods, other experimental conditions are completely consistent. We adopted XGBoost as the classifier, set the scale_pos_weight = 0.1 for the temporary method for dealing with unbalanced data sets, and used cross validation to evaluate our model. The result is shown in Figure 3A. By comparison, we found that RPSSM, CSP-SegPseP-SegACP and AATP performed better.
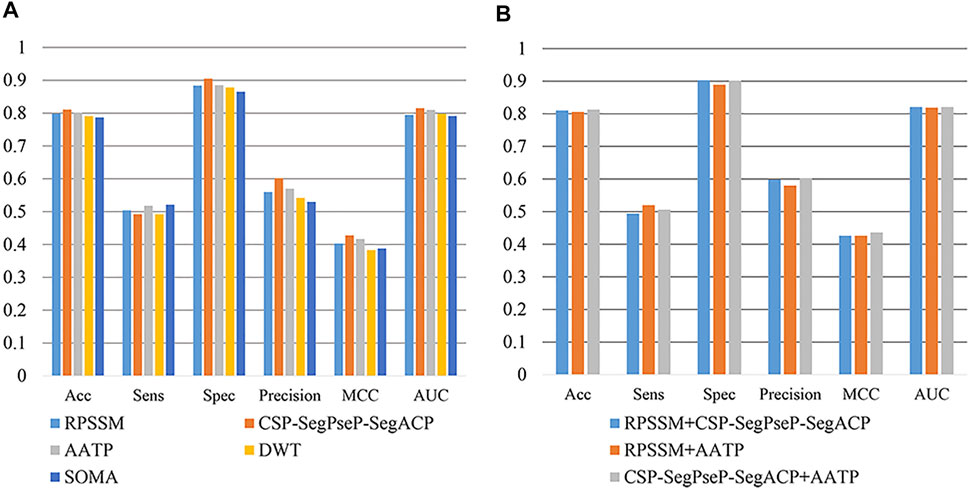
FIGURE 3. (A) Comparison of single feature extraction methods. (B) Comparison of combining feature extraction methods.
Next, we combined these three methods in pairs for comparison. We found that the combination of CSP-SegPseP-SegACP and AATP was the best method, through these two methods, we extracted 1,120 dimension feature vectors. The result after using the combination methods on the training set is shown in Figure 3B.
3.4 Feature Selection
After dealing with the imbalance of the data set, our model has made significant progress. In this section, we reduced the dimension of the feature vector by feature selection.
In the process of machine learning, the high dimensionality of the input feature vector will have a huge impact on the model, which will make the model too complex and reduce the generalization. Therefore, when the dimension of the feature vector is high, dimensionality reduction can improve the learning ability of the machine learning model and reduce the time required to train the model.
In this work, we adopted Max-Relevance-Max-Distance algorithm (MRMD). By using AATP and CSP-SegPseP-SegACP to extract features, and then combined the features and normalized them by Z-score standardization. The dimension of the feature vector is 1,120. In this work, we used the latest version of MRMD to improve our model. MRMD has five feature ranking methods: Hits_a, Hits_h, TrustRank, PageRank and LeaderRank. TrustRank and PageRank were originally used in web search system, MRMD modified them and applied them to feature selection. LeaderRank is derived from the basic PageRank algorithm. It adds a background node to make two-way connection with all nodes. Hits is similar to PageRank and is also applied to web search, the difference is that the number of web pages processed by hits is small, and it is related to queries. We used all five methods, and then we chose Hits_h by comparing the results of cross-validation. The results are shown in Table 3. Finally, through MRMD, we changed the 1120-dimensional feature vector to 791 dimensions, and the accuracy was also improved.
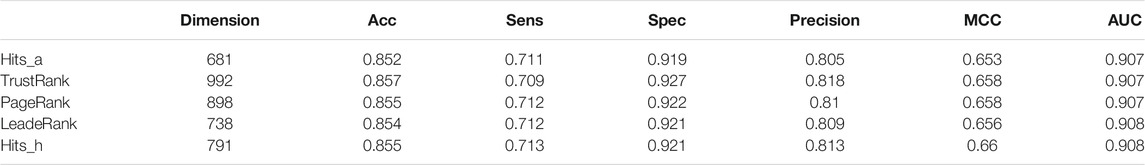
TABLE 3. The results of using different sorting methods in MRMD on the training set.
3.5 Performance on Different Methods
Through the above processing, we obtained a good performance model. In this model, the parameters of XGBoost are: learning_rate = 0.1, n_estimators = 1,000, max_depth = 8, min_child_weight = 1, gamma = 0, subsample = 0.8, colsample_bytree = 0.8, objective = “binary:logistic”, nthread = 20, scale_pos_weight = 0.6. Next, we compared the effect of our cross-validation set on different methods. In this section, we applied the data processed by the same feature extraction method, imbalance processing method and feature selection method to different machine learning models.
We used Random Forest, KNN and SVM for comparison. We optimized the parameters of each classifier and set n_estimators = 100 in random forest, k = 10 in KNN, gamma = 0.5 and cost = 8 in SVM. The results are shown in Table 4. We drew the ROC and calculated the AUC, which are shown in Figure 4. Obviously, XGBoost is the best choice. Compared with other methods, XGBoost was also very efficient in the process of training the model.
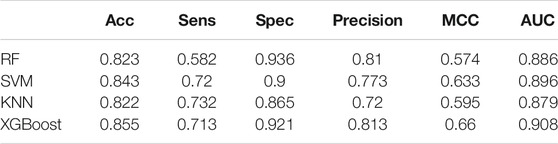
TABLE 4. Comparison of six performance evaluations on the training set.
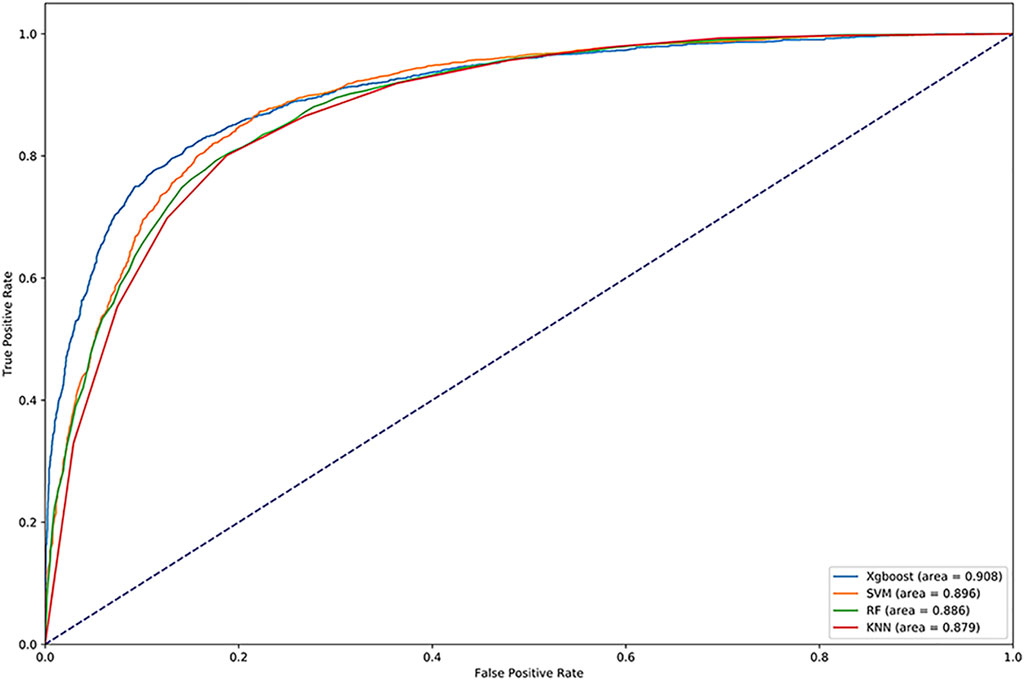
FIGURE 4. ROC curve of vesicle transporters identified by different methods.
Then, we used independent test sets to test the model performance. Nguyen Quoc Khanh Le used Gru neural network for deep learning in his research, we used the model provided by Nguyen Quoc Khanh Le’s research result to classify vesicular transport proteins, and then compared with our model. The results are shown in Table 5. The PR curves of the two models are shown in Figure 5. Obviously, the performance of our model is better.
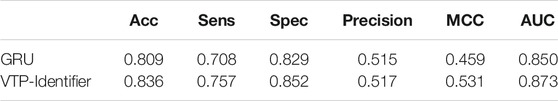
TABLE 5. Performance comparison between our model and GRU.
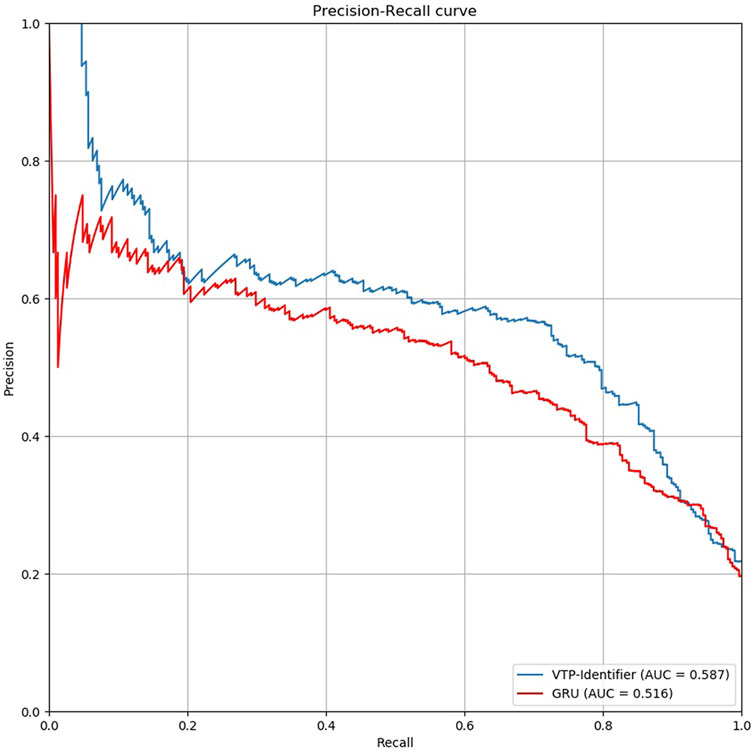
FIGURE 5. Comparison of PR curves between our model and GRU.
4 Discussion
In this paper, we provide a method to identify vesicular transport proteins based on feature extraction from PSSM. In our dataset, the number of vesicular transport proteins and non-vesicular transport proteins are 2,533 and 9,086, and the number of training sets are 2,214 and 7,573. We used ENN to address the imbalance of the training data set, reduced the number of non-vesicular transport proteins from 7,573 to 4,707. We used AATP and CSP-SegPseP-SegACP to extract features from PSSM and then obtained 1,120 dimensional feature vector. Next we used MRMD to reduce the dimension of the feature vector and the dimension is reduced to 791. Finally, we sent the processed data to XGBoost and got a model to accurately identify vesicular transport proteins. The experimental comparison shows that our model is better than the previous research result. The accuracy of our model on the test set is 83.6%, which exceeds the previous research results obtained by Nguyen Quoc Khanh Le through deep learning.
Data Availability Statement
The datasets presented in this study can be found in online repositories. The names of the repository/repositories and accession number(s) can be found below: https://github.com/1024488648/vesicle_transporter.
Author Contributions
TJZ and JYZ conceived and designed the project. YG and ZXZ conducted the experiments and analyzed the data. YG and YXZ wrote the manuscript. BZD and BG revised the manuscript. All authors read and approved the final manuscript.
Funding
This work was supported by the Fundamental Research Funds for the Central Universities (2572021BH01) and the National Natural Science Foundation of China (62172087, 62172129).
Conflict of Interest
The authors declare that the research was conducted in the absence of any commercial or financial relationships that could be construed as a potential conflict of interest.
Publisher’s Note
All claims expressed in this article are solely those of the authors and do not necessarily represent those of their affiliated organizations, or those of the publisher, the editors and the reviewers. Any product that may be evaluated in this article, or claim that may be made by its manufacturer, is not guaranteed or endorsed by the publisher.
References
Cai, L., Wang, L., Fu, X., Xia, C., Zeng, X., and Zou, Q. (2021). ITP-pred: an Interpretable Method for Predicting, Therapeutic Peptides with Fused Features Low-Dimension Representation. Brief Bioinform 22 (4), bbaa367. doi:10.1093/bib/bbaa367
Chen, T., and Guestrin, C. (2016). “Xgboost: A Scalable Tree Boosting System,” in Proceedings of the 22nd Acm Sigkdd International Conference on Knowledge Discovery and Data Mining.
Chou, K.-C. (2009). Pseudo Amino Acid Composition and its Applications in Bioinformatics, Proteomics and System Biology. Cp 6 (4), 262–274. doi:10.2174/157016409789973707
Cláudio, N., Pereira, F. J., and Barral, D. C. (2001). Membrane Traffic and Disease. eLS. doi:10.1002/9780470015902.a0020892
Cui, X., Yu, Z., Yu, B., Wang, M., Tian, B., and Ma, Q. (2019). UbiSitePred: A Novel Method for Improving the Accuracy of Ubiquitination Sites Prediction by Using LASSO to Select the Optimal Chou's Pseudo Components. Chemometrics Intell. Lab. Syst. 184, 28–43. doi:10.1016/j.chemolab.2018.11.012
Dao, F. Y. (2021). DeepYY1: a Deep Learning Approach to Identify YY1-Mediated Chromatin Loops. Brief Bioinform 22 (4). doi:10.1093/bib/bbaa356
Ding, S., Li, Y., Shi, Z., and Yan, S. (2014). A Protein Structural Classes Prediction Method Based on Predicted Secondary Structure and PSI-BLAST Profile. Biochimie 97, 60–65. doi:10.1016/j.biochi.2013.09.013
Ding, Y., Tang, J., and Guo, F. (2020). Human Protein Subcellular Localization Identification via Fuzzy Model on Kernelized Neighborhood Representation. Appl. Soft Comput. 96, 106596. doi:10.1016/j.asoc.2020.106596
Ding, Y., Tang, J., and Guo, F. (2020). Identification of Drug-Target Interactions via Dual Laplacian Regularized Least Squares with Multiple Kernel Fusion. Knowledge-Based Syst. 204, 106254. doi:10.1016/j.knosys.2020.106254
Ding, Y., Tang, J., and Guo, F. (2020). Identification of Drug-Target Interactions via Fuzzy Bipartite Local Model. Neural Comput. Applic 32 (14), 10303–10319. doi:10.1007/s00521-019-04569-z
Fdez-Glez, J., Ruano-Ordás, D., Méndez, J. R., Fdez-Riverola, F., Laza, R., and Pavón, R. (2018). Determining the Influence of Class Imbalance for the Triage of Biomedical Documents. Cbio 13 (6), 592–605. doi:10.2174/1574893612666170718151238
Fu, X., Cai, L., Zeng, X., and Zou, Q. (2020). StackCPPred: a Stacking and Pairwise Energy Content-Based Prediction of Cell-Penetrating Peptides and Their Uptake Efficiency. Bioinformatics 36 (10), 3028–3034. doi:10.1093/bioinformatics/btaa131
Guo, Z., Wang, P., Liu, Z., and Zhao, Y. (2020). Discrimination of Thermophilic Proteins and Non-thermophilic Proteins Using Feature Dimension Reduction. Front. Bioeng. Biotechnol. 8, 584807. doi:10.3389/fbioe.2020.584807
Hager, H. A., Roberts, R. J., Cross, E. E., Proux-Gillardeaux, V., and Bader, D. M. (2010). Identification of a Novel Bves Function: Regulation of Vesicular Transport. Embo J. 29 (3), 532–545. doi:10.1038/emboj.2009.379
Hong, Z., Zeng, X., Wei, L., and Liu, X. (2020). Identifying Enhancer-Promoter Interactions with Neural Network Based on Pre-trained DNA Vectors and Attention Mechanism. Bioinformatics 36 (4), 1037–1043. doi:10.1093/bioinformatics/btz694
Jiang, Q., Wang, G., Jin, S., Li, Y., and Wang, Y. (2013). Predicting Human microRNA-Disease Associations Based on Support Vector Machine. Ijdmb 8 (3), 282–293. doi:10.1504/ijdmb.2013.056078
Jin, S., Zeng, X., Xia, F., Huang, W., and Liu, X. (2021). Application of Deep Learning Methods in Biological Networks. Brief. Bioinform. 22 (2), 1902–1917. doi:10.1093/bib/bbaa043
Jones, D. T. (1999). Protein Secondary Structure Prediction Based on Position-specific Scoring Matrices 1 1Edited by G. Von Heijne. J. Mol. Biol. 292 (2), 195–202. doi:10.1006/jmbi.1999.3091
Kawashima, S., and Kanehisa, M. (2000). AAindex: Amino Acid index Database. Nucleic Acids Res. 28 (1), 374. doi:10.1093/nar/28.1.374
Kim, H., and Park, H. (2004). Prediction of Protein Relative Solvent Accessibility with Support Vector Machines and Long-Range Interaction 3D Local Descriptor. Proteins 54 (3), 557–562. doi:10.1002/prot.10602
Le, N. Q. K., and Nguyen, V.-N. (2019). SNARE-CNN: a 2D Convolutional Neural Network Architecture to Identify SNARE Proteins from High-Throughput Sequencing Data. PeerJ Comp. Sci. 5, e177. doi:10.7717/peerj-cs.177
Le, N. Q. K., Yapp, E. K. Y., Nagasundaram, N., Chua, M. C. H., and Yeh, H.-Y. (2019). Computational Identification of Vesicular Transport Proteins from Sequences Using Deep Gated Recurrent Units Architecture. Comput. Struct. Biotechnol. J. 17, 1245–1254. doi:10.1016/j.csbj.2019.09.005
Lemaître, G., Nogueira, F., and Aridas, C. K. (2017). Imbalanced-learn: A python Toolbox to Tackle the Curse of Imbalanced Datasets in Machine Learning. J. Machine Learn. Res. 18 (1), 559–563.
Li, H.-L., Pang, Y.-H., and Liu, B. (2021). BioSeq-BLM: a Platform for Analyzing DNA, RNA and Protein Sequences Based on Biological Language Models. Nucleic Acids Res. doi:10.1093/nar/gkab829
Liang, Y., Liu, S., and Zhang, S. (2015). Prediction of Protein Structural Classes for Low-Similarity Sequences Based on Consensus Sequence and Segmented PSSM. Comput. Math. Methods Med., 2015. doi:10.1155/2015/370756
Liang, Y., and Zhang, S. (2017). Predict Protein Structural Class by Incorporating Two Different Modes of Evolutionary Information into Chou's General Pseudo Amino Acid Composition. J. Mol. Graphics Model. 78, 110–117. doi:10.1016/j.jmgm.2017.10.003
Liu, B., Gao, X., and Zhang, H. (2019). BioSeq-Analysis2.0: an Updated Platform for Analyzing DNA, RNA and Protein Sequences at Sequence Level and Residue Level Based on Machine Learning Approaches. Nucleic Acids Res. 47 (20), e127. doi:10.1093/nar/gkz740
Liu, B., Li, C.-C., and Yan, K. (2020). DeepSVM-fold: Protein Fold Recognition by Combining Support Vector Machines and Pairwise Sequence Similarity Scores Generated by Deep Learning Networks. Brief. Bioinform. 21 (5), 1733–1741. doi:10.1093/bib/bbz098
Long, J., Yang, H., Yang, Z., Jia, Q., Liu, L., Kong, L., et al. (2021). Integrated Biomarker Profiling of the Metabolome Associated with Impaired Fasting Glucose and Type 2 Diabetes Mellitus in Large-Scale Chinese Patients. Clin. Transl Med. 11 (6), e432. doi:10.1002/ctm2.432
Orci, L., Malhotra, V., Amherdt, M., Serafini, T., and Rothman, J. E. (1989). Dissection of a Single Round of Vesicular Transport: Sequential Intermediates for Intercisternal Movement in the Golgi Stack. Cell 56 (3), 357–368. doi:10.1016/0092-8674(89)90239-0
Patthy, L. (1987). Detecting Homology of Distantly Related Proteins with Consensus Sequences. J. Mol. Biol. 198 (4), 567–577. doi:10.1016/0022-2836(87)90200-2
Qu, Y.-H., Yu, H., Gong, X.-J., Xu, J.-H., and Lee, H.-S. (2017). On the Prediction of DNA-Binding Proteins Only from Primary Sequences: A Deep Learning Approach. PloS one 12 (12), e0188129. doi:10.1371/journal.pone.0188129
Shao, J., and Liu, B. (2021). ProtFold-DFG: Protein Fold Recognition by Combining Directed Fusion Graph and PageRank Algorithm. Brief Bioinform 22 (3), bbaa192. doi:10.1093/bib/bbaa192
Shao, J., Yan, K., and Liu, B. (2021). FoldRec-C2C: Protein Fold Recognition by Combining Cluster-To-Cluster Model and Protein Similarity Network. Brief Bioinform 22 (3), bbaa144. doi:10.1093/bib/bbaa144
Su, R., Hu, J., Zou, Q., Manavalan, B., and Wei, L. (2020). Empirical Comparison and Analysis of Web-Based Cell-Penetrating Peptide Prediction Tools. Brief. Bioinform. 21 (2), 408–420. doi:10.1093/bib/bby124
Su, R., Liu, X., Wei, L., and Zou, Q. (2019). Deep-Resp-Forest: A Deep forest Model to Predict Anti-cancer Drug Response. Methods 166, 91–102. doi:10.1016/j.ymeth.2019.02.009
Suzuki, T., Araki, Y., Yamamoto, T., and Nakaya, T. (2006). Trafficking of Alzheimer's Disease-Related Membrane Proteins and its Participation in Disease Pathogenesis. J. Biochem. 139 (6), 949–955. doi:10.1093/jb/mvj121
Tang, Y.-J., Pang, Y.-H., Liu, B., and Idp-Seq2Seq, (2020). IDP-Seq2Seq: Identification of Intrinsically Disordered Regions Based on Sequence to Sequence Learning. Bioinformaitcs 36 (21), 5177–5186. doi:10.1093/bioinformatics/btaa667
Tao, Z., Li, Y., Teng, Z., and Zhao, Y. (2020). A Method for Identifying Vesicle Transport Proteins Based on LibSVM and MRMD. Comput. Math. Methods Med. 2020, 8926750. doi:10.1155/2020/8926750
Wang, H., Ding, Y., Tang, J., and Guo, F. (2020). Identification of Membrane Protein Types via Multivariate Information Fusion with Hilbert-Schmidt Independence Criterion. Neurocomputing 383, 257–269. doi:10.1016/j.neucom.2019.11.103
Wang, X., Yang, Y., Liu, J., and Wang, G. (2021). The Stacking Strategy-Based Hybrid Framework for Identifying Non-Coding RNAs. Brief Bioinform 22 (5). doi:10.1093/bib/bbab023
Wang, Y. (2019). CrystalM: a Multi-View Fusion Approach for Protein Crystallization Prediction. IEEE/ACM Trans. Comput. Biol. Bioinformatics. doi:10.1109/tcbb.2019.2912173
Wang, Y., Ding, Y., Guo, F., Wei, L., and Tang, J. (2017). Improved Detection of DNA-Binding Proteins via Compression Technology on PSSM Information. PloS one 12 (9), e0185587. doi:10.1371/journal.pone.0185587
Wei, L., Zhou, C., Chen, H., Song, J., and Su, R. (2018). ACPred-FL: a Sequence-Based Predictor Using Effective Feature Representation to Improve the Prediction of Anti-cancer Peptides. Bioinformatics 34 (23), 4007–4016. doi:10.1093/bioinformatics/bty451
Wei, L., Ding, Y., Su, R., Tang, J., and Zou, Q. (2018). Prediction of Human Protein Subcellular Localization Using Deep Learning. J. Parallel Distributed Comput. 117, 212–217. doi:10.1016/j.jpdc.2017.08.009
Wei, L., Liao, M., Gao, Y., Ji, R., He, Z., and Zou, Q. (2014). Improved and Promising Identification of Human MicroRNAs by Incorporating a High-Quality Negative Set. Ieee/acm Trans. Comput. Biol. Bioinf. 11 (1), 192–201. doi:10.1109/tcbb.2013.146
Wei, L., Xing, P., Zeng, J., Chen, J., Su, R., and Guo, F. (2017). Improved Prediction of Protein-Protein Interactions Using Novel Negative Samples, Features, and an Ensemble Classifier. Artif. Intelligence Med. 83, 67–74. doi:10.1016/j.artmed.2017.03.001
Yang, C. (2021). Granular Multiple Kernel Learning for Identifying RNA-Binding Protein Residues via Integrating Sequence and Structure Information. Neural Comput. Appl., 1–13. doi:10.1007/s00521-020-05573-4
Yang, H., Luo, Y., Ren, X., Wu, M., He, X., Peng, B., et al. (2021). Risk Prediction of Diabetes: Big Data Mining with Fusion of Multifarious Physical Examination Indicators. Inf. Fusion 75, 140–149. doi:10.1016/j.inffus.2021.02.015
Yang, J.-Y., and Chen, X. (2011). Improving Taxonomy-Based Protein Fold Recognition by Using Global and Local Features. Proteins 79 (7), 2053–2064. doi:10.1002/prot.23025
Zeng, X., Zhong, Y., Lin, W., and Zou, Q. (2020). Predicting Disease-Associated Circular RNAs Using Deep Forests Combined with Positive-Unlabeled Learning Methods. Brief. Bioinformatics 21 (4), 1425–1436. doi:10.1093/bib/bbz080
Zeng, X., Zhu, S., Lu, W., Liu, Z., Huang, J., Zhou, Y., et al. (2020). Target Identification Among Known Drugs by Deep Learning from Heterogeneous Networks. Chem. Sci. 11 (7), 1775–1797. doi:10.1039/c9sc04336e
Zhai, Y., Chen, Y., Teng, Z., and Zhao, Y. (2020). Identifying Antioxidant Proteins by Using Amino Acid Composition and Protein-Protein Interactions. Front. Cel Dev. Biol. 8, 591487. doi:10.3389/fcell.2020.591487
Zhang, D., Chen, H. D., Zulfiqar, H., Yuan, S. S., Huang, Q. L., Zhang, Z. Y., et al. (2021). iBLP: An XGBoost-Based Predictor for Identifying Bioluminescent Proteins. Comput. Math. Methods Med. 2021, 6664362. doi:10.1155/2021/6664362
Zhang, S., Ye, F., and Yuan, X. (2012). Using Principal Component Analysis and Support Vector Machine to Predict Protein Structural Class for Low-Similarity Sequences via PSSM. J. Biomol. Struct. Dyn. 29 (6), 1138–1146. doi:10.1080/07391102.2011.672627
Zhang, X., Zou, Q., Rodriguez-Paton, A., and Zeng, X. (2019). Meta-path Methods for Prioritizing Candidate Disease miRNAs. Ieee/acm Trans. Comput. Biol. Bioinform 16 (1), 283–291. doi:10.1109/TCBB.2017.2776280
Zhao, X., Wang, H., Li, H., Wu, Y., and Wang, G. (2021). Identifying Plant Pentatricopeptide Repeat Proteins Using a Variable Selection Method. Front. Plant Sci. 12, 506681. doi:10.3389/fpls.2021.506681
Zou, Q., Zeng, J., Cao, L., and Ji, R. (2016). A Novel Features Ranking Metric with Application to Scalable Visual and Bioinformatics Data Classification. Neurocomputing 173, 346–354. doi:10.1016/j.neucom.2014.12.123
Keywords: protein function prediction, vesicular transport proteins, machine learning, XGBoost, position-specific scoring matrix
Citation: Gong Y, Dong B, Zhang Z, Zhai Y, Gao B, Zhang T and Zhang J (2022) VTP-Identifier: Vesicular Transport Proteins Identification Based on PSSM Profiles and XGBoost. Front. Genet. 12:808856. doi: 10.3389/fgene.2021.808856
Received: 04 November 2021; Accepted: 29 November 2021;
Published: 03 January 2022.
Edited by:
Quan Zou, University of Electronic Science and Technology of China, ChinaCopyright © 2022 Gong, Dong, Zhang, Zhai, Gao, Zhang and Zhang. This is an open-access article distributed under the terms of the Creative Commons Attribution License (CC BY). The use, distribution or reproduction in other forums is permitted, provided the original author(s) and the copyright owner(s) are credited and that the original publication in this journal is cited, in accordance with accepted academic practice. No use, distribution or reproduction is permitted which does not comply with these terms.
*Correspondence: Tianjiao Zhangmailto, dGlhbmppYW96aGFuZ0BuZWZ1LmVkdS5jbg==; Jingyu Zhangmailto, emhhbmdqaW5neXV5eEAxNjMuY29t