- Laboratory of Genetics and Molecular Biology, College of Wildlife and Protected Area, Northeast Forestry University, Harbin, China
Aberrant activation of calmodulin 1 (CALM1) has been reported in human cancers. However, comprehensive understanding of the role of CALM1 in most cancer types has remained unclear. We systematically analyzed the expression landscape, DNA methylation, gene alteration, immune infiltration, clinical relevance, and molecular pathway of CALM1 in multiple cancers using various online tools, including The Cancer Genome Atlas, cBioPortal and the Human Protein Atlas databases. Kaplan–Meier and receiver operating characteristic (ROC) curves were plotted to explore the prognostic and diagnostic potential of CALM1 expression. Multivariate analyses were used to evaluate whether the CALM1 expression could be an independent risk factor. A nomogram predicting the overall survival (OS) of patients was developed, evaluated, and compared with the traditional Tumor-Node-Metastasis (TNM) model using decision curve analysis. R language was employed as the main tool for analysis and visualization. Results revealed CALM1 to be highly expressed in most cancers, its expression being regulated by DNA methylation in multiple cancers. CALM1 had a low mutation frequency (within 3%) and was associated with immune infiltration. We observed a substantial positive correlation between CALM1 expression and macrophage and neutrophil infiltration levels in multiple cancers. Different mutational forms of CALM1 hampered immune cell infiltration. Additionally, CALM1 expression had high diagnostic and prognostic potential. Multivariate analyses revealed CALM1 expression to be an independent risk factor for OS. Therefore, our newly developed nomogram had a higher clinical value than the TNM model. The concordance index, calibration curve, and time-dependent ROC curves of the nomogram exhibited excellent performance in terms of predicting the survival rate of patients. Moreover, elevated CALM1 expression contributes to the activation of cancer-related pathways, such as the WNT and MAPK pathways. Overall, our findings improved our understanding of the function of CALM1 in human cancers.
Introduction
As one of the most common diseases worldwide, cancer threatens human life and public health. The pathogenesis of cancer is very complex and involves several cancer-critical genes, which control fundamental cell division and growth processes (Rezatabar et al., 2019; Lacroix et al., 2020). Therefore, it is important to perform multi-omics analysis for any cancer-critical gene, followed by further assessment of their molecular function in tumorigenesis and correlation of the same with clinical prognosis.
Calmodulin (CALM), the best-studied Ca2+-binding protein, is composed of 148 amino acids, and contains two globular domains linked by a highly flexible central linker domain (Ikura and Ames, 2006). A previous study had shown CALM to be a valuable peripheral biomarker for Alzheimer’s disease, discriminating the latter from other disorders related to dementia (Esteras et al., 2013). Another study showed that CALM expression significantly increases in cerebrospinal fluid of patients with Creutzfeldt Jakob disease (CJD) and might be used as a diagnostic biomarker for CJD (Chen et al., 2021). Moreover, the abnormally high expression of CALM can indicate liver fibrosis (Ji et al., 2019) and recurrence of nasopharyngeal carcinoma (Meng et al., 2017). In mammals, three genes encode CALM, namely CALM1, CALM2, and CALM3 (Zhang et al., 2012). Although these genes only differ in their non-coding regions, they have distinct cellular functions, based on subcellular distribution and epigenetics (Toutenhoofd and Strehler, 2000). In this study, we specifically focused on CALM1. CALM1 can regulate cell motility, differentiation, and proliferation (Chin and Means, 2000); increased CALM1 expression had previously been detected in nasopharyngeal carcinoma (Zamanian Azodi et al., 2018), prostate cancer (Adeola et al., 2016), and bladder cancer (Zhang et al., 2018) and has been reported to play an oncogenic role in esophageal squamous cell carcinoma (Liu et al., 2021). However, our knowledge regarding the expression pattern, gene mutation, molecular function, and clinical value of CALM1 and relationship of CALM1 expression with DNA methylation and immune infiltration in most cancers is still lacking.
Here, we aimed to conduct comprehensive and systematic analyses of CALM1 in human cancers. This study had five analysis modules, namely gene expression, DNA methylation and gene alterations, immune infiltration, prognostic and diagnostic potential, and relevant cellular pathways. We found that CALM1 expression was upregulated in most cancer types and was closely related to immune infiltration and cancer-related cellular pathways. DNA methylation affected CALM1 expression in multiple cancers. Additionally, CALM1 expression had high diagnostic and prognostic potential. Taken together, our findings revealed that CALM1 could be a promising prognostic and diagnostic biomarker for determining patient survival in human cancers.
Materials and Methods
Data Acquisition and Processing
We downloaded gene expression RNA-seq data of 33 The Cancer Genome Atlas (TCGA) cancer types and corresponding normal tissues from the Genotype-Tissue Expression database (GTEx; http://www.gtexportal.org/) and TCGA database (https://cancergenome.nih.gov/). These data were detected from 798 TCGA normal tissues, 9,807 TCGA cancer tissues, and 7,498 GTEx normal tissues, and were further processed using the Toil method (Vivian et al., 2017) and log2 transformed. Relevant clinical information (survival time, TNM stage, pathologic stage, etc.) of each patient and DNA methylation data (HM450) were also extracted from TCGA. Alteration frequency, mutation type and mutated site of CALM1 in 33 TCGA cancer types were obtained from the cBioPortal database (https://www.cbioportal.org/). GSE41613 was downloaded from the GEO database (https://www.ncbi.nlm.nih.gov/geo/), including 97 HNSC samples with complete follow-up information (survival time and status). Additionally, we calculated the enrichment rate of immune cells in each cancer sample by the ssGSEA algorithm that used the specific markers (Bindea et al., 2013) of immune cell as a gene set to calculate the enrichment score of immune cells in each sample.
Gene Expression Analysis
We compared the CALM1 mRNA distribution between cancer tissues and adjacent non-cancer tissues in 33 TCGA cancer types. Owing to the abnormal distribution of CALM1 expression values, we used the Mann–Whitney U test to compare CALM1 expression between normal and cancer tissues. Subsequently, we investigated the correlation between CALM1 expression and clinical features in different cancers using the Kruskal–Wallis test. Protein-wide omics data from the Human Protein Atlas (HPA; https://www.proteinatlas.org/) was used to verify the expression of CALM1 between normal and cancer tissues. Analysis and visualization of data were based on the R language and a p-value of <0.05 indicated significance.
DNA Methylation and Gene Alteration Analysis
We performed DNA methylation analysis using the transcriptome data of CALM1 and DNA methylation data (HM450) from TCGA. Beta values were used to estimate the methylation levels of CALM1 DNA. Differences in CALM1 methylation between cancer tissues and adjacent non-cancer tissues were compared using the Mann–Whitney U test. The Pearson correlation method was used to measure the relationship between CALM1 expression and methylation. A p-value of <0.05 and correlation coefficient of < −0.1 were regarded as the cut-off points. Subsequently, we conducted gene alteration analysis based on the cBioPortal database (Cerami et al., 2012). Genetic alterations of CALM1 were obtained from the “Quick select” module. Results of alteration frequency and the mutation type of CALM1 in human cancers were obtained using the “Cancer Type Summary” module. The 3D structure of the mutated site of CALM1 was further observed with the “Mutations” module.
Immune Infiltration Analysis
Using the ssGSEA algorithm in the R package GSVA (Sonja et al., 2013) and the transcriptome data of CALM1 from TCGA, we investigated the correlation between CALM1 expression and immune infiltration in human cancers. The Spearman correlation method was used to calculate the correlation coefficient. A total of four immune cells were included in this analysis, namely macrophages, B-cells, CD8+ T-cells, and neutrophils. Subsequently, we used the Tumor IMmune Estimation Resource 2 (TIMER2; http://timer.cistrome.org/) database (Li et al., 2020) to verify the correlation via the “Gene” module. Additionally, we investigated the correlation between immune infiltration abundance and Somatic Copy Number Alteration (SCNA) of CALM1 using the “SCNA” module of the TIMER database (https://cistrome.shinyapps.io/timer/; (Li et al., 2017).
Prognostic and Diagnostic Potential Analysis
We performed Kaplan–Meier (KM) analysis to assess the effect of CALM family genes expression on patient survival. Patients were divided into low- and high-expression groups according to the median expression of the CALM family genes. Differences in survival rates between the two groups were compared by Cox regression. Moreover, we used the GSE41613 dataset to verify the prognostic potential of CALM1 expression in head and neck squamous cell carcinoma (HNSC). The University of Alabama Cancer database (UALCAN; http://ualcan.path.uab.edu/; Chandrashekar et al., 2017) was used to verify the prognostic potential of CALM1 expression in liver hepatocellular carcinoma (LIHC). Subsequently, the diagnostic ROC curve (Do and Le, 2020; Do et al., 2021) was plotted, and the area under the curve (AUC) was calculated to define the diagnostic value of CALM family genes mRNA levels in cancers. The Cox proportional hazards regression model was used to evaluate whether CALM1 expression could be a risk factor for overall survival (OS) in TCGA cancers. Using TCGA-HNSC data, we established a nomogram integrating CALM1 expression, N stage, smoker, and radiation therapy for predicting patient survival rate at 1, 3, and 5 years. Performance of this nomogram was evaluated via concordance index (C-index), calibration curve, and time-dependent receiver operating characteristic (ROC) curves and compared with that of the traditional TNM nomogram via decision curve analysis (DCA).
To further assess the general applicability of the established model, we selected the TCGA-LIHC cohort as the validation set. Similarly, a nomogram integrating CALM1 expression, TNM stage, pathologic stage and tumor status was developed, and its efficacy in predicting patient survival rate was evaluated using the C-index, calibration curve, ROC curves and DCA. Gene expression and clinicopathological information were extracted from TCGA. Analysis and visualization of data were accomplished using R language, and a p-value of <0.05 indicated significance.
Insights Into CALM1 Function
The Search Tool for the Retrieval of Interacting Genes/Proteins (STRING; https://string-db.org/) is commonly used to predict protein-protein interactions (Szklarczyk et al., 2019). According to this database, we screened 50 experimentally determined CALM1-binding proteins. Subsequently, we obtained 100 CALM1-correlated genes using the “Similar Gene Detection” module of the Gene Expression Profiling Interactive Analysis 2 (GEPIA2; http://gepia2.cancer-pku.cn/) database (Tang et al., 2019). Four genes with the strongest correlation with CALM1 were screened for further expression analysis by the TIMER2 database. Finally, to elucidate functional differences for CALM1-high expression group versus CALM1-low expression group in HNSC and LIHC, we performed Gene Set Enrichment Analysis (GSEA) using the R package “clusterProfiler” (Yu et al., 2012). An adjusted p-value of <0.05 and FDR of <0.25 indicated significance.
Results
Gene Expression Analysis Data
We assessed CALM1 mRNA expression profiles in human cancers using data from the TCGA and GTEx databases. The results showed that CALM1 mRNA expression is increased in 13 cancers, including the lymphoid neoplasm diffuse large B-cell lymphoma (DLBC; P = 0.002), LIHC (P < 0.001), cervical squamous cell carcinoma and endocervical adenocarcinoma (CESC; P < 0.001), HNSC (P < 0.001), acute myeloid leukemia (LAML; P < 0.001), ovarian serous cystadenocarcinoma (OV; P < 0.001), pancreatic adenocarcinoma (PAAD; P < 0.001), pheochromocytoma and paraganglioma (PCPG; P = 0.003), testicular germ cell tumor (TGCT; P < 0.001), stomach adenocarcinoma (STAD; P < 0.001), skin cutaneous melanoma (SKCM; P < 0.001), thymoma (THYM; P = 0.001), and uterine corpus endometrioid carcinoma (UCEC; P < 0.001), compared with that in normal tissues. However, CALM1 mRNA expression is decreased in colon adenocarcinoma (COAD; P < 0.001), kidney chromophobe (KICH; P = 0.001), lower grade glioma (LGG; P < 0.001), lung adenocarcinoma (LUAD; P < 0.001), prostate adenocarcinoma (PRAD; P < 0.001), and rectum adenocarcinoma (READ; P < 0.001) (Figure 1A). The abbreviations and full names of TCGA cancers are listed in Supplementary Table S1. For paired normal and cancer tissues, the same difference in CALM1 mRNA expression was verified in kidney renal papillary cell carcinoma (KIRC; P < 0.001), HNSC (P < 0.001), COAD (P < 0.001), KICH (P < 0.001), kidney clear cell carcinoma (KIRC; P < 0.001), LUAD (P < 0.001), PRAD (P < 0.001), READ (P = 0.031), STAD (P = 0.004), and thyroid carcinoma (THCA; P < 0.05) (Figure 1B). Overall, compared with non-cancer tissues, most cancer types had higher CALM1 expression. We also observed a significant association between CALM1 expression and clinical features (e.g., TNM stage, pathologic stage, and histologic grade) in human cancers (Figure 1C).
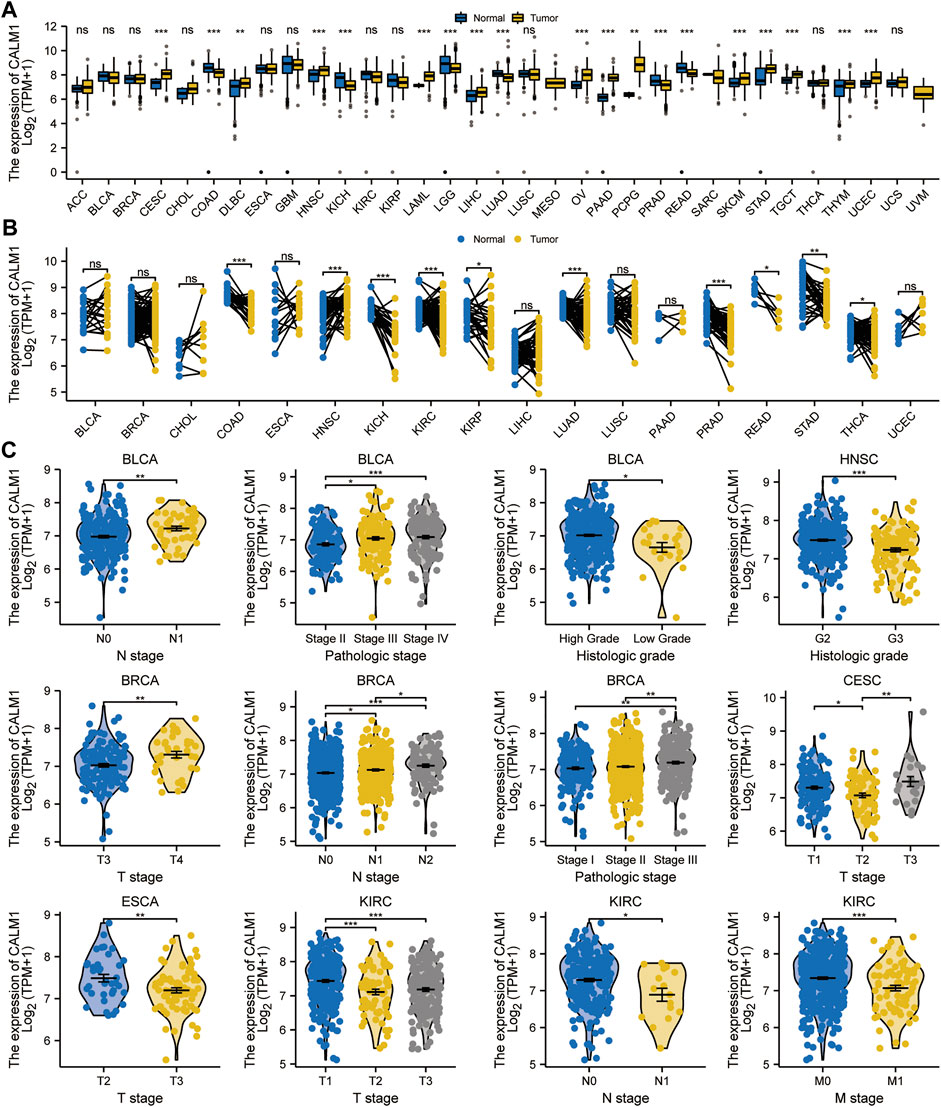
FIGURE 1. Expression levels of CALM1 gene in human cancers and relevant clinical features. (A, B) Expression levels of CALM1 mRNA in cancer and adjacent/paired normal tissues. *P < 0.05; **P < 0.01; ***P < 0.001; ns, no significance. (C) Relationship between CALM1 mRNA expression and clinical features in human cancers. *P < 0.05; **P < 0.01; ***P < 0.001.
Additionally, we used immunohistochemistry staining to verify CALM1 expression in human cancers (Figure 2). The results showed that CALM1 staining was increased in breast cancer, liver cancer, and pancreatic cancer but decreased in colorectal cancer, prostate cancer, and lung cancer, compared with that in normal tissues. These results demonstrated that the protein expression of CALM1 increases in breast cancer, liver cancer, and pancreatic cancer, but decreases in colorectal cancer, prostate cancer, and lung cancer, compared with that in normal tissues, which is consistent with the mRNA levels of CALM1.
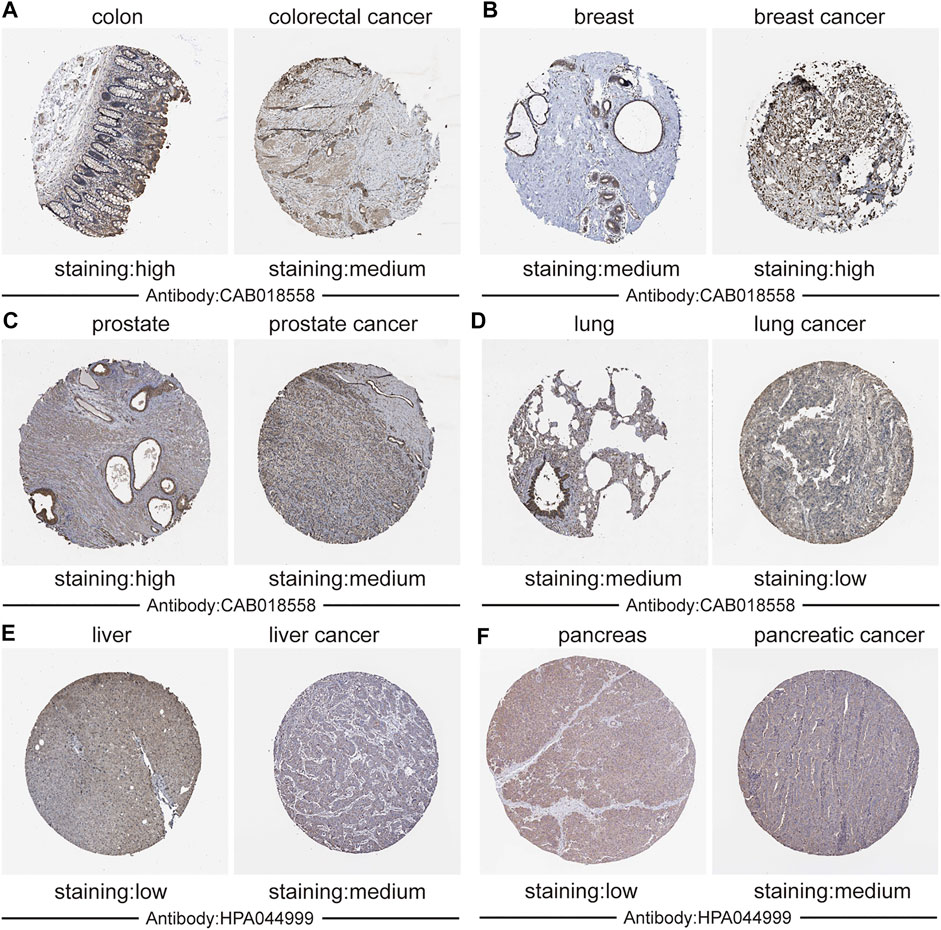
FIGURE 2. Validation the expression of CALM1 on translational level using immunohistochemistry from the Human Protein Atlas database. (A) Colon and colorectal cancer. (B) Breast and breast cancer. (C) Prostate and Prostate cancer. (D) Lung and lung cancer. (E) Liver and liver cancer. (F) Pancreatic and pancreatic cancer. Staining: low, medium, and high. Antibody: CAB018558 and HPA044999.
DNA Methylation and Alteration Analysis Data
Based on the data from TCGA, we analyzed CALM1 methylation levels between normal and cancer specimens. The results showed CALM1 methylation to be significantly increased in cervical and endocervical cancer (CESC) and COAD compared with that in normal tissues, but significantly decreased in LIHC and PCPG (Figure 3A), showing an inverse trend compared with that of the expression pattern. Subsequently, we explored the relationship between CALM1 mRNA expression and DNA methylation. Our results showed a negative association between DNA methylation and CALM1 expression in four selected cancers (Figure 3B), which further demonstrates the regulatory ability of DNA methylation on CALM1 expression. Additionally, DNA alteration analysis indicated that CALM1 has a relatively low alteration rate, with the maximum not exceeding 3%. These alterations included missense mutations, amplification, and deep deletion; the adrenocortical carcinoma (ACC), PCPG, sarcoma (SARC), and LGG cases only carried amplification alteration of CALM1 (Figure 3C). The alteration case numbers, types, and sites of CALM1 are shown in Figure 3D. We found that the primary genetic alteration of CALM1 was a missense mutation. R107 was observed in the 3D structure as the most frequent alteration site of CALM1 (Figure 3E) that could induce translation from R (Arginine) to H (Histidine) or C (Cysteine). However, genetic alterations in CALM1 barely influenced the OS of cancer patients.
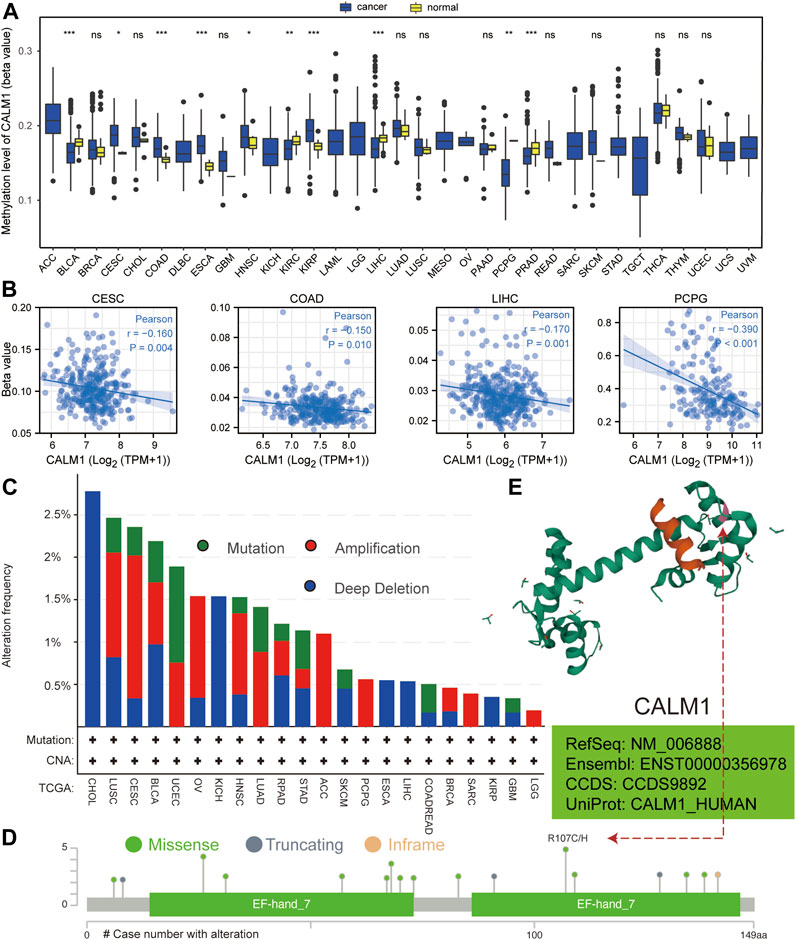
FIGURE 3. Analysis of DNA methylation and alteration of CALM1 in human cancers. (A) Methylation level of CALM1 in normal and cancer specimens. *P < 0.05; **P < 0.01; ***P < 0.001; ns, no significance. (B) Relationship between CALM1 mRNA levels and DNA methylation in cervical and endocervical cancer (CESE), colon adenocarcinoma (COAD), liver hepatocellular carcinoma (LIHC), and pheochromocytoma and paraganglioma (PCPG). (C) Alteration frequency and mutation type of CALM1 is displayed. (D) The types, sites, and case numbers of CALM1 genetic alteration are presented. (E) The mutation site numbered 107 is displayed in the 3D structure of CALM1 protein.
Immune Infiltration Analysis Data
Previous studies have shown that immune cells in the tumor microenvironment can affect patient prognosis. Therefore, it is meaningful to explore the association between CALM1 expression and immune infiltration. The results from TCGA indicated a positive relationship between CALM1 expression and macrophages, B-cells, and neutrophils in COAD, LUAD, PRAD, and SKCM. The number of CD8+T-cells was negatively correlated with CALM1 expression in LUAD and PRAD, but positively correlated with that in COAD and SKCM (Figure 4). The results from TIMER2 verified CALM1 expression to be positively correlated with levels of neutrophils and macrophages in four selected cancers (Supplementary Figure S1A). Additionally, we found that different mutant forms of CALM1 (e.g., arm-level gain, arm-level deletion, and deep deletion) to hamper the infiltration of immune cells (Supplementary Figure S1B).
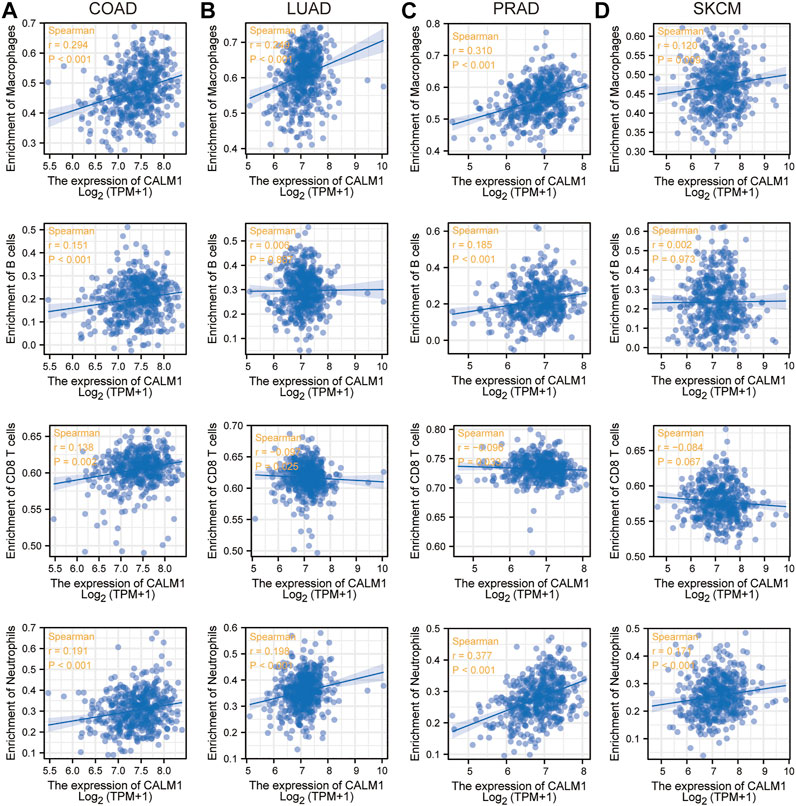
FIGURE 4. Immune infiltration analysis of CALM1 expression. Correlation between CALM1 mRNA levels and immune infiltration in colon adenocarcinoma (COAD) (A), lung adenocarcinoma (LUAD) (B), prostate adenocarcinoma (PRAD) (C), and skin cutaneous melanoma (SKCM) (D).
Prognostic and Diagnostic Potential Data
To evaluate the prognostic and diagnostic potentials of the CALM family genes, we performed KM and diagnostic ROC curve analyses using the data from TCGA. KM survival analysis showed that patients with elevated CALM1 expression had a favorable OS in KIRC, SARC, glioblastoma multiforme and brain lower-grade glioma (GBMLGG), and COAD, but poorer OS in uveal melanoma (UVM), acute myeloid leukemia (LAML) and BLCA (Figure 5A). The ROC curve demonstrated that CALM1 expression had a high diagnostic value in COAD, KICH, LUAD, READ, and PAAD (AUC >0.9; Figure 5B). Similarly, CALM2 and CALM3 also had high prognostic and diagnostic potentials in human cancers (Supplementary Figure S2, S3). Taken together, the results showed that the CALM family genes could be a promising prognostic and diagnostic biomarker in human cancers.
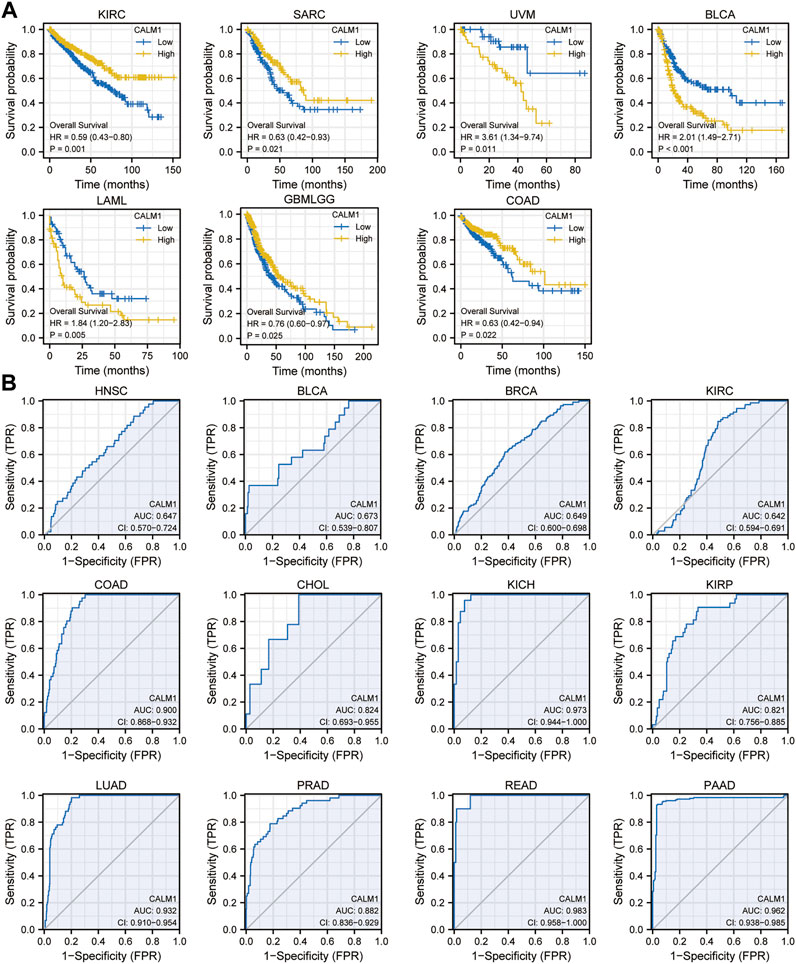
FIGURE 5. Analysis of prognostic and diagnostic potentials of CALM1 expression in human cancers. (A) Kaplan–Meier survival analysis was conducted to investigate the prognostic value of CALM1 expression. (B) ROC analysis was performed for investigating the diagnostic value of CALM1 expression. HR, hazard ratio; AUC, area under curve; CI, confidence interval; ROC, receiver operating characteristic.
Specifically, in HNSC, patients with decreased CALM1 expression showed a favorable OS (P = 0.007; Figure 6A). KM analysis using data from the GSE41613 dataset confirmed that the low mRNA level of CALM1 was associated with a favorable OS (P = 0.034; Figure 6B). The Cox regression models demonstrated CALM1 to be an independent risk factors for OS (Figure 6C). Furthermore, we developed a nomogram integrating CALM1 expression, N stage, smoker, and radiation therapy for predicting the survival probability of HNSC patients (Figure 6D). The calibration curve showed excellent agreement between predicted and actual probabilities at 1, 3, and 5 years with a C-index of 0.625 (range, 0.602–0.649) (Supplementary Figure S4A). The accuracies calculated by AUC in predicting 1, 3 and 5 years OS were 0.662, 0.649, and 0.658, respectively (Supplementary Figure S4B). DCA revealed our nomogram to have a higher net benefit in predicting OS, compared with the traditional TNM model (Supplementary Figure S4C).
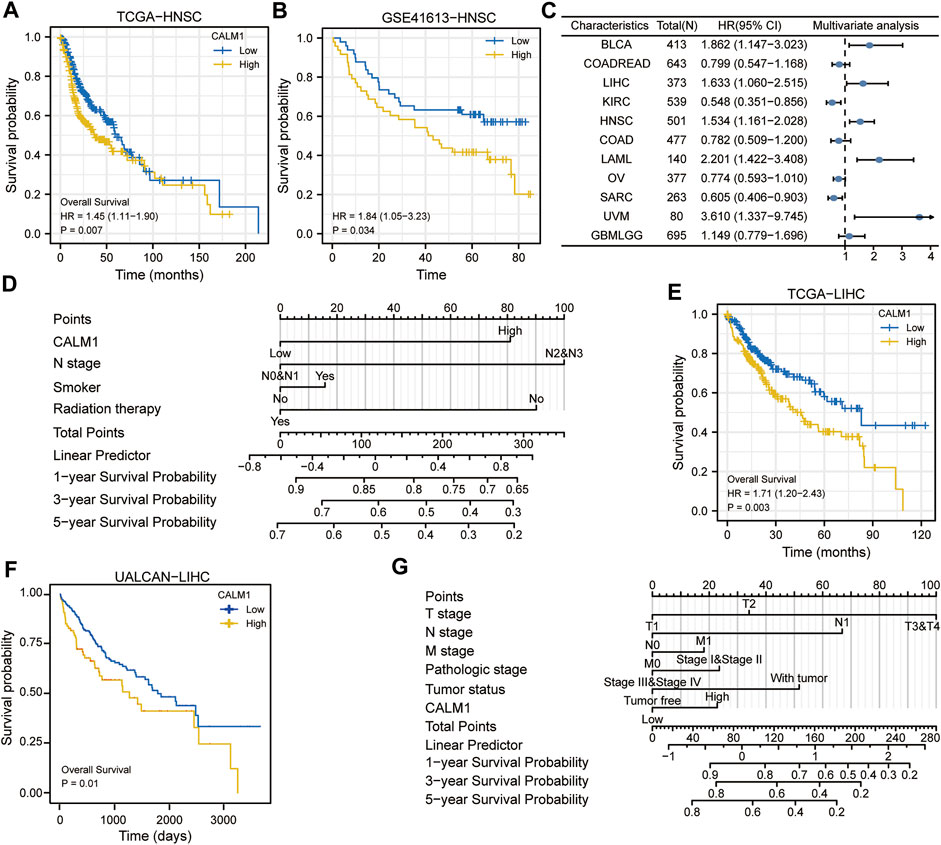
FIGURE 6. Evaluation prognostic potential of CALM1 expression and establishment of nomograms in HNSC and LIHC. (A) Survival curves show that overall survival was different for patients with low or high expression of CALM1 in HNSC. (B) The GSE41613 dataset was used to verify the prognostic potential of CALM1 expression in HNSC. (C) Forest plot for the prognostic analysis of CALM1 expression in human cancers. (D) Construction of the nomogram model integrating CALM1 expression, N stage, smoker, and radiation therapy in HNSC. (E) Survival analysis show patients with decreased CALM1 expression had a favorable overall survival in LIHC. (F) The UALCAN database was used to verify the prognostic potential of CALM1 expression in LIHC. (G) Construction of a nomogram model integrating CALM1 expression, TNM stages, pathologic stages, and tumor status in LIHC. HNSC, head and neck squamous cell carcinoma; LIHC, liver hepatocellular carcinoma.
To further assess the prognostic predictive value of CALM1 expression, we selected TCGA-LIHC as the validation set. KM survival analysis confirmed patients with decreased CALM1 expression had a favorable OS (P = 0.003; Figure 6E), which is consistent with the results of UALCAN (P = 0.01; Figure 6F). Subsequently, we developed a new nomogram integrating CALM1 expression, TNM stage, pathologic stage, and tumor status (Figure 6G). The calibration curve showed excellent agreement between predicted and actual probabilities at 1, 3, and 5 years with a C-index of 0.665 (range, 0.630–0.700; Supplementary Figure S4D). The accuracies calculated by AUC in predicting 1, 3 and 5 years OS were 0.688, 0.760, and 0.761, respectively (Supplementary Figure S4E). However, DCA revealed that the traditional TNM model has a higher net benefit in predicting OS, compared with our nomogram (Supplementary Figure S4F). Taken together, CALM1 mRNA levels had good applicability and can not only predict the prognosis of HNSC but also serve as a prognostic predictive biomarker for LIHC.
Insights Into CALM1 Function
To understand the mechanism underlying the role of CALM1 in tumorigenesis, we conducted KEGG and GO enrichment analyses using 50 CALM1-binding proteins and 100 CALM1 expression-correlated genes. In total, 50 CALM1-binding proteins were identified using the STRING database, which was further verified experimentally. The interaction network of these proteins is presented in Figure 7A. A total of 100 CALM1 expression-correlated genes were identified using the GEPIA2 database. Among them, SLC9A6, KLC1, ARPP19, and IDS were significantly related to CALM1 overexpression, according to the data from the TIMER2 database (Figure 7B). The intersection analysis integrating 50 CALM1-binding proteins and 100 CALM1 expression-correlated genes showed two common members, namely CAMK2G and SCN2A (Figure 7C). Finally, we conducted GSEA to explore the roles of CALM1 in cancers. We found that WNT and MAPK signaling pathways associated gene sets were significantly enriched in the CALM1 high expression group in both HNSC (Figure 7D) and LIHC (Figure 7E). Other cancer-related gene sets, such as the PI3K-Akt and Hippo signaling pathways, were found to be affected by different CALM1 expression levels (Supplementary Figure S5).
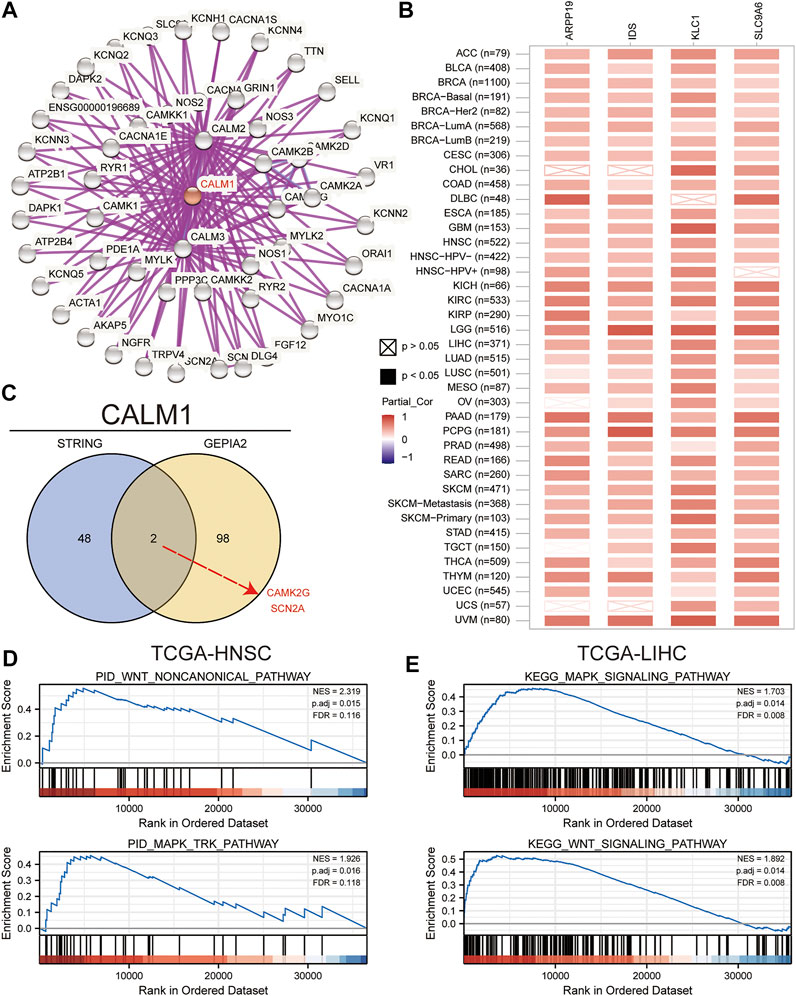
FIGURE 7. Insights into CALM1 function. (A) We obtained the protein-protein interaction network of CALM1 using the STRING website. (B) We analyzed the pan-cancer correlation between CALM1 expression and SLC9A6, ARPP19, KLC1, and IDS using the TIMER2 website. (C) We conducted an intersection analysis for the CALM1-binding and CALM1-correlated genes. Finally, we performed GSEA to elucidate functional differences for CALM1-high expression group versus CALM1-low expression group in HNSC (D) and LIHC (E). SLC9A6, solute carrier family 9-member a6; ARPP19, CAMP regulated phosphoprotein; KLC1, kinesin light chain 1; IDS, iduronate 2-sulfatase; CAMK2G, calcium/calmodulin dependent protein kinase II gamma; SCN2A, sodium voltage-gated channel alpha subunit 2; GSEA, Gene Set Enrichment Analysis; TCGA, The Cancer Genome Atlas; HNSC, head and neck squamous cell carcinoma; LIHC, liver hepatocellular carcinoma.
Discussion
As the major Ca2+ sensor, CALM, encoded by the CALM1 gene in mammals, is highly conserved in eukaryotic cells. Previous studies had found CALM1 to be upregulated in nasopharyngeal carcinoma, prostate cancer, and bladder cancer, and had reported its oncogenic role in esophageal squamous cell carcinoma. However, little is known regarding the global function and expression landscape of CALM1 in other cancers. In this report, we comprehensively assessed the CALM1 expression pattern based on TCGA data. The results demonstrated that CALM1 levels are increased in CESC, DLBC, HNSC, LAML, LIHC, OV, PAAD, PCPG, SKCM, STAD, TGCT, UCEC, and THYM, but decreased in COAD, KICH, LGG, LUAD, PRAD, and READ, compared with that in normal tissues. Further validation using the HPA databases revealed that the protein expression of CALM1 increases in breast cancer, liver cancer, and pancreatic cancer, but decreases in colorectal cancer, prostate cancer, and lung cancer, compared with that in normal tissues. The differential expression profiles might reflect the distinct molecular functions of CALM1 in human cancers.
Since cancer progression involves a series of abnormal regulations affected by gene alterations (Liu et al., 2021) or DNA methylation (Liu et al., 2021), we aimed to investigate the potential correlation across gene alterations, DNA methylation, and patient survival. We observed several genetic alterations of CALM1, including deep deletion, amplification, and missense mutation; although these alterations might affect cancer progression, according to the data from the cBioPortal database, they did not affect prognostic outcomes. Additionally, we found CALM1 methylation to be significantly increased in CESC and COAD compared with normal tissues and significantly decreased in LIHC and PCPG, showing an inverse trend compared with that of the expression pattern. This finding implies that CALM1 expression is regulated by DNA methylation in human cancers. Subsequently, we found a negative association between DNA methylation and CALM1 expression in CESC, COAD, LIHC, and PCPG, which further demonstrates the regulatory ability of DNA methylation on CALM1 expression. The results collectively suggested that CALM1 methylation plays a significant and complicated role in human cancers; however, more in-depth research is needed to verify this conclusion.
Previous studies had found immune cell infiltration to significantly affect cancer progression and prognosis (Liu et al., 2017). M1 macrophages are known to inhibit cancer progression, CD4+T-cells can recognize cancer antigens (Lin et al., 2019), CD8+T-cells can inhibit cancer metastasis (Joseph et al., 2021), and immune infiltration of T-cells can significantly influence the efficacy of immunotherapy (Borst et al., 2018). This study found a statistically significant positive correlation between immune infiltration and CALM1 expression in human cancers. The different CALM1 mutational forms hampered immune infiltration. The results collectively imply that CALM1 plays an essential role in the regulation and recruitment of immune cell infiltration, which might eventually affect patient prognostic outcomes.
Another key finding of this study is that CALM1 expression can indicate different prognostic outcomes in human cancers. Kaplan–Meier survival analysis showed that patients with elevated CALM1 expression had a favorable OS in KIRC, SARC, GBMLGG, and COAD, but poorer OS in UVM, LAML, LIHC, and BLCA. The multivariate Cox model further confirmed CALM1 expression as an independent risk factor for OS in human cancers. Additionally, we constructed a nomogram integrating clinical variables and CALM1 expression for predicting survival rate in HNSC patients, and it performed better than the traditional TNM model. The ROC curve demonstrated that CALM1 expression had a high diagnostic value in COAD, KICH, LUAD, READ, and PAAD (AUC >0.9). Overall, the results suggest that CALM1 could be a valuable prognostic and diagnostic biomarker in human cancers.
We performed GSEA to predict the potential molecular function of CALM1 in cancers. A previous study analyzing the hyperglycemia of obese diabetic mice had revealed that elevated CALM1 expression can directly activate the PI3K-Akt pathway to repress gluconeogenic gene expression in hepatocytes (Chen et al., 2017). Consistent with this report, our functional enrichment analysis showed that increased CALM1 expression could activate the PI3K-Akt signaling pathway. This pathway involves cell apoptosis, oxidative stress, and inflammation, and plays a vital regulatory role in various malignant tumors. Our results show that increased CALM1 expression could also activate other cancer-related pathways, such as the Hippo, Wnt, and MAPK signaling pathways. Previous studies had revealed that the activated Hippo pathway increases ovarian cancer stemness and tumor resistance (Muñoz-Galván et al., 2020). The activated Wnt pathway promotes cell growth and migration in squamous cell lung carcinoma (Wu et al., 2021). Similarly, the activated MAPK pathway regulates various cellular functions, such as apoptosis, survival, differentiation, and proliferation (Liu et al., 2018). The results overall suggest that CALM1 is closely associated with cancer progression.
This study has some limitations. First, no experimental validation was performed. Second, the correlation between mRNA levels and protein expression of CALM1 would need further verification. Third, since CALM1 plays a very complex role in cancer prognosis, we could not define the exact role of CALM1 as either oncogenic or protective.
Conclusion
Our study was the first to elucidate the expression landscape, DNA methylation, gene alteration, immune infiltration, clinical relevance, and molecular pathways of CALM1 in multiple cancers using in-silico multi-omics analysis. CALM1 was found to be differentially expressed in human cancers and adjacent normal tissues, with a low mutation frequency. DNA methylation of CALM1 regulated its expression in multiple cancers. CALM1 expression was closely related to immune infiltration and cancer-related cellular pathways. Additionally, CALM1 expression had a high diagnostic and prognostic potential in human cancers. These findings collectively offer a relatively comprehensive understanding of the functional significance of CALM1 in human cancers.
Data Availability Statement
The original contributions presented in the study are included in the article/Supplementary Material, further inquiries can be directed to the corresponding authors.
Author Contributions
DZ: Conceptualization, Supervision, Funding acquisition. XL: Conceptualization, Supervision, Funding acquisition. LF: Visualization, Writing—original draft, Data curation, Project administration. MY: Formal analysis, Data curation, Writing—original draft, Project administration.
Funding
This work was supported by the Fundamental Research Funds for the Central Universities (grant numbers 2572019BE01, XL); and the National Science Foundation of China (grant numbers 31671283, DZ).
Conflict of Interest
The authors declare that the research was conducted in the absence of any commercial or financial relationships that could be construed as a potential conflict of interest.
Publisher’s Note
All claims expressed in this article are solely those of the authors and do not necessarily represent those of their affiliated organizations, or those of the publisher, the editors and the reviewers. Any product that may be evaluated in this article, or claim that may be made by its manufacturer, is not guaranteed or endorsed by the publisher.
Supplementary Material
The Supplementary Material for this article can be found online at: https://www.frontiersin.org/articles/10.3389/fgene.2021.793508/full#supplementary-material
References
Adeola, H. A., Smith, M., Kaestner, L., Blackburn, J. M., and Zerbini, L. F. (2016). Novel Potential Serological Prostate Cancer Biomarkers Using CT100+ Cancer Antigen Microarray Platform in a Multi-Cultural South African Cohort. Oncotarget 7, 13945–13964. doi:10.18632/oncotarget.7359
Bindea, G., Mlecnik, B., Tosolini, M., Kirilovsky, A., Waldner, M., Obenauf, A. C., et al. (2013). Spatiotemporal Dynamics of Intratumoral Immune Cells Reveal the Immune Landscape in Human Cancer. Immunity 39, 782–795. doi:10.1016/j.immuni.2013.10.003
Borst, J., Ahrends, T., Bąbała, N., Melief, C. J. M., and Kastenmüller, W. (2018). CD4+ T Cell Help in Cancer Immunology and Immunotherapy. Nat. Rev. Immunol. 18, 635–647. doi:10.1038/s41577-018-0044-0
Cerami, E., Gao, J., Dogrusoz, U., Gross, B. E., Sumer, S. O., Aksoy, B. A., et al. (2012). The cBio Cancer Genomics Portal: An Open Platform for Exploring Multidimensional Cancer Genomics Data: Figure 1. Cancer Discov. 2, 401–404. doi:10.1158/2159-8290.Cd-12-0095
Chandrashekar, D. S., Bashel, B., Balasubramanya, S. A. H., Creighton, C. J., Ponce-Rodriguez, I., Chakravarthi, B. V. S. K., et al. (2017). UALCAN: A Portal for Facilitating Tumor Subgroup Gene Expression and Survival Analyses. Neoplasia 19, 649–658. doi:10.1016/j.neo.2017.05.002
Chen, C., Hu, C., Zhou, W., Chen, J., Shi, Q., Xiao, K., et al. (2021). Calmodulin Level Is Significantly Increased in the Cerebrospinal Fluid of Patients with Sporadic Creutzfeldt‐Jakob Disease. Eur. J. Neurol. 28, 1134–1141. doi:10.1111/ene.14655
Chen, Z., Ding, L., Yang, W., Wang, J., Chen, L., Chang, Y., et al. (2017). Hepatic Activation of the FAM3C-HSF1-CaM Pathway Attenuates Hyperglycemia of Obese Diabetic Mice. Diabetes 66, 1185–1197. doi:10.2337/db16-0993
Chin, D., and Means, A. R. (2000). Calmodulin: a Prototypical Calcium Sensor. Trends Cell Biol. 10, 322–328. doi:10.1016/s0962-8924(00)01800-6
Do, D. T., and Le, N. Q. K. (2020). Using Extreme Gradient Boosting to Identify Origin of Replication in Saccharomyces cerevisiae via Hybrid Features. Genomics 112, 2445–2451. doi:10.1016/j.ygeno.2020.01.017
Do, D. T., Le, T. Q. T., and Le, N. Q. K. (2021). Using Deep Neural Networks and Biological Subwords to Detect Protein S-Sulfenylation Sites. Brief. Bioinform. 22, 1–11. doi:10.1093/bib/bbaa128
Esteras, N., Alquézar, C., de la Encarnación, A., Villarejo, A., Bermejo-Pareja, F., and Martín-Requero, Á. (2013). Calmodulin Levels in Blood Cells as a Potential Biomarker of Alzheimer's Disease. Alzheimers Res. Ther. 5, 55–10. doi:10.1186/alzrt219
Ikura, M., and Ames, J. B. (2006). Genetic Polymorphism and Protein Conformational Plasticity in the Calmodulin Superfamily: Two Ways to Promote Multifunctionality. Proc. Natl. Acad. Sci. 103, 1159–1164. doi:10.1073/pnas.0508640103
Ji, D., Chen, G. F., Wang, J. C., Cao, L. H., Lu, F., Mu, X. X., et al. (2019). Identification of TAF1 , HNF4A , and CALM2 as Potential Therapeutic Target Genes for Liver Fibrosis. J. Cell. Physiol. 234, 9045–9051. doi:10.1002/jcp.27579
Joseph, R., Soundararajan, R., Vasaikar, S., Yang, F., Allton, K. L., Tian, L., et al. (2021). CD8+ T Cells Inhibit Metastasis and CXCL4 Regulates its Function. Br. J. Cancer 125, 176–189. doi:10.1038/s41416-021-01338-5
Lacroix, M., Riscal, R., Arena, G., Linares, L. K., and Le Cam, L. (2020). Metabolic Functions of the Tumor Suppressor P53: Implications in normal Physiology, Metabolic Disorders, and Cancer. Mol. Metab. 33, 2–22. doi:10.1016/j.molmet.2019.10.002
Li, T., Fan, J., Wang, B., Traugh, N., Chen, Q., Liu, J. S., et al. (2017). TIMER: A Web Server for Comprehensive Analysis of Tumor-Infiltrating Immune Cells. Cancer Res. 77, e108–e110. doi:10.1158/0008-5472.CAN-17-0307
Li, T., Fu, J., Zeng, Z., Cohen, D., Li, J., Chen, Q., et al. (2020). TIMER2.0 for Analysis of Tumor-Infiltrating Immune Cells. Nucleic Acids Res. 48, W509–W514. doi:10.1093/nar/gkaa407
Lin, P., Guo, Y.-n., Shi, L., Li, X.-j., Yang, H., He, Y., et al. (2019). Development of a Prognostic index Based on an Immunogenomic Landscape Analysis of Papillary Thyroid Cancer. Aging 11, 480–500. doi:10.18632/aging.101754
Liu, F., Yang, X., Geng, M., and Huang, M. (2018). Targeting ERK, an Achilles' Heel of the MAPK Pathway, in Cancer Therapy. Acta Pharmaceutica Sinica B 8, 552–562. doi:10.1016/j.apsb.2018.01.008
Liu, T., Han, X., Zheng, S., Liu, Q., Tuerxun, A., Zhang, Q., et al. (2021). CALM1 Promotes Progression and Dampens Chemosensitivity to EGFR Inhibitor in Esophageal Squamous Cell Carcinoma. Cancer Cell Int 21, 121–133. doi:10.1186/s12935-021-01801-6
Liu, X., Wu, S., Yang, Y., Zhao, M., Zhu, G., and Hou, Z. (2017). The Prognostic Landscape of Tumor-Infiltrating Immune Cell and Immunomodulators in Lung Cancer. Biomed. Pharmacother. 95, 55–61. doi:10.1016/j.biopha.2017.08.003
Meng, H., Zhu, X., Li, L., Liang, Z., Li, X., Pan, X., et al. (2017). Identification of CALM as the Potential Serum Biomarker for Predicting the Recurrence of Nasopharyngeal Carcinoma Using a Mass Spectrometry-Based Comparative Proteomic Approach. Int. J. Mol. Med. 40, 1152–1164. doi:10.3892/ijmm.2017.3094
Muñoz-Galván, S., Felipe-Abrio, B., Verdugo-Sivianes, E. M., Perez, M., Jiménez-García, M. P., Suarez-Martinez, E., et al. (2020). Downregulation of MYPT1 Increases Tumor Resistance in Ovarian Cancer by Targeting the Hippo Pathway and Increasing the Stemness. Mol. Cancer 19, 1–16. doi:10.1186/s12943-020-1130-z
Rezatabar, S., Karimian, A., Rameshknia, V., Parsian, H., Majidinia, M., Kopi, T. A., et al. (2019). RAS/MAPK Signaling Functions in Oxidative Stress, DNA Damage Response and Cancer Progression. J. Cell. Physiol. 234, 14951–14965. doi:10.1002/jcp.28334
Sonja, H., Robert, C., and Justin, G. (2013). GSVA: gene set variation analysis for microarray and RNA-Seq data. BMC Bioinformatics 14, 7–21. doi:10.1186/1471-2105-14-7
Szklarczyk, D., Gable, A. L., Lyon, D., Junge, A., Wyder, S., Huerta-Cepas, J., et al. (2019). STRING V11: Protein-Protein Association Networks with Increased Coverage, Supporting Functional Discovery in Genome-wide Experimental Datasets. Nucleic Acids Res. 47, D607–D613. doi:10.1093/nar/gky1131
Tang, Z., Kang, B., Li, C., Chen, T., and Zhang, Z. (2019). GEPIA2: an Enhanced Web Server for Large-Scale Expression Profiling and Interactive Analysis. Nucleic Acids Res. 47, W556–W560. doi:10.1093/nar/gkz430
Toutenhoofd, S. L., and Strehler, E. E. (2000). The Calmodulin Multigene Family as a Unique Case of Genetic Redundancy: Multiple Levels of Regulation to Provide Spatial and Temporal Control of Calmodulin Pools? Cell Calcium 28, 83–96. doi:10.1054/ceca.2000.0136
Vivian, J., Rao, A. A., Nothaft, F. A., Ketchum, C., Armstrong, J., Novak, A., et al. (2017). Toil Enables Reproducible, Open Source, Big Biomedical Data Analyses. Nat. Biotechnol. 35, 314–316. doi:10.1038/nbt.3772.Toil
Wu, Q., Luo, X., Terp, M. G., Li, Q., Li, Y., Shen, L., et al. (2021). DDX56 Modulates post-transcriptional Wnt Signaling through miRNAs and Is Associated with Early Recurrence in Squamous Cell Lung Carcinoma. Mol. Cancer 20, 1–17. doi:10.1186/s12943-021-01403-w
Yu, G., Wang, L. G., Han, Y., and He, Q. Y. (2012). clusterProfiler: an R Package for Comparing Biological Themes Among Gene Clusters. OMICS: A J. Integr. Biol. 16, 284–287. doi:10.1089/omi.2011.0118
Zamanian Azodi, M., Rezaei Tavirani, M., Rezaei Tavirani, M., Vafaee, R., and Rostami-Nejad, M. (2018). Nasopharyngeal Carcinoma Protein Interaction Mapping Analysis via Proteomic Approaches. Asian Pac. J. Cancer Prev. 19, 845–851. doi:10.22034/APJCP.2018.19.3.845
Zhang, L., Feng, C., Zhou, Y., and Zhou, Q. (2018). Dysregulated Genes Targeted by microRNAs and Metabolic Pathways in Bladder Cancer Revealed by Bioinformatics Methods. Oncol. Lett. 15, 9617–9624. doi:10.3892/ol.2018.8602
Keywords: multi-omics, calmodulin, prognosis analysis, immune infiltration, cancer biomarker
Citation: Yao M, Fu L, Liu X and Zheng D (2022) In-Silico Multi-Omics Analysis of the Functional Significance of Calmodulin 1 in Multiple Cancers. Front. Genet. 12:793508. doi: 10.3389/fgene.2021.793508
Received: 12 October 2021; Accepted: 23 December 2021;
Published: 12 January 2022.
Edited by:
Dechao Bu, Institute of Computing Technology (CAS), ChinaReviewed by:
Nguyen Quoc Khanh Le, Taipei Medical University, TaiwanHan Wang, Northeast Normal University, China
Copyright © 2022 Yao, Fu, Liu and Zheng. This is an open-access article distributed under the terms of the Creative Commons Attribution License (CC BY). The use, distribution or reproduction in other forums is permitted, provided the original author(s) and the copyright owner(s) are credited and that the original publication in this journal is cited, in accordance with accepted academic practice. No use, distribution or reproduction is permitted which does not comply with these terms.
*Correspondence: Dong Zheng, emhlbmdkb25nODlAeWVhaC5uZXQ=; Xuedong Liu, bGl1eHVlZG9uZzg5QHllYWgubmV0
†These authors have contributed equally to this work and share first authorship
 Maolin Yao
 Lanyi Fu†
 Dong Zheng