 Nivedhitha Mahendran
 P. M. Durai Raj Vincent
 Kathiravan Srinivasan
 Chuan-Yu Chang
- 1School of Information Technology and Engineering, Vellore Institute of Technology, Vellore, India
- 2School of Computer Science and Engineering, Vellore Institute of Technology, Vellore, India
- 3Department of Computer Science and Information Engineering, National Yunlin University of Science and Technology, Yunlin, Taiwan
Alzheimer’s is a progressive, irreversible, neurodegenerative brain disease. Even with prominent symptoms, it takes years to notice, decode, and reveal Alzheimer’s. However, advancements in technologies, such as imaging techniques, help in early diagnosis. Still, sometimes the results are inaccurate, which delays the treatment. Thus, the research in recent times focused on identifying the molecular biomarkers that differentiate the genotype and phenotype characteristics. However, the gene expression dataset’s generated features are huge, 1,000 or even more than 10,000. To overcome such a curse of dimensionality, feature selection techniques are introduced. We designed a gene selection pipeline combining a filter, wrapper, and unsupervised method to select the relevant genes. We combined the minimum Redundancy and maximum Relevance (mRmR), Wrapper-based Particle Swarm Optimization (WPSO), and Auto encoder to select the relevant features. We used the GSE5281 Alzheimer’s dataset from the Gene Expression Omnibus We implemented an Improved Deep Belief Network (IDBN) with simple stopping criteria after choosing the relevant genes. We used a Bayesian Optimization technique to tune the hyperparameters in the Improved Deep Belief Network. The tabulated results show that the proposed pipeline shows promising results.
Introduction
Dementia is a broad term for a group of disorders with abnormal changes in the brain. The common forms of dementia interrupt the communication between the brain cells (Salat et al., 2001). When the communication between the cells is disrupted, the cognitive abilities, such as memory loss, feelings, thinking, and problem solving, behavior, and language proficiency of the individual will also be disrupted (Jo et al., 2019). Some of the common types of dementia are Parkinson’s disease, Lewy body dementia, Alzheimer’s disease (AD), Down’s syndrome, vascular dementia, dementia caused by alcohol, and HIV. Among these, 60–70% is accounted for by AD (Lawrence and Sahakian, 1995). Recently, there are increasing researches in the field of gerontology, a study of the physical aspects of aging. One such neurological disorder that appears in the elderly is the AD. Our work in this paper focuses on AD. AD is known to humankind for more than 100 years, yet the molecular mechanism and pathogenesis is far from fully understood (Reitz et al., 2011).
As commonly said, AD is a progressive, neurodegenerative brain disease, which is irreversible. The term progressive concerning AD means it gets worse over time because of irreversible degeneration of neurons (neurodegenerative) (Nussbaum and Ellis, 2003). In other words, the pathological change of AD is a slowly accumulating process. AD affects the hippocampus and cortex regions of the brain primarily. The primary reason for developing AD symptoms is more than the required accumulation of proteins around the brain cells (Wenk, 2003). The high levels of proteins make the communication between brain cells tedious. The actual reason for the onset of AD is still uncertain. Yet, few hypotheses were framed over the years, such as the accumulation of Tau and amyloid proteins, cholinergic, and genetics (Citron, 2010). Even with dominant symptoms, the dysfunctions of AD take years to be noticed, decoded, and revealed.
The early diagnosis starts with recognizing the mild cognitive impairment (MCI), which has a high possibility of causing AD (Liu et al., 2014). The onset of AD is commonly found around 65 years; however, early onset at a younger age is rare. Even after thorough research, the cause and progression seem to be uncertain (Huber et al., 2018). The proper diagnosis can be made only after the autopsy, yet, with advanced technologies in clinical screening, such as cerebrospinal fluid analysis, imaging techniques have led to early AD diagnosis. These methods provide inaccurate results, which delays the treatment at times (Wang and Liu, 2019). The limitations in clinical screening have led to the molecular data-based analysis. Identifying molecular biomarkers offers promising results, as it establishes accurate relationships between the phenotype and genotype symptoms. The accurate and early diagnosis of AD will help patients have the awareness and indulge in preventive measures, for instance, medications and changes in their lifestyle.
Although the molecular biomarkers offer better results than the clinical screening, the environmental and genetic factors should be taken into account. There are more than 1,000 even 10,000 features generated through transcripts, genes, proteins, and their interaction with each other (Moradifard et al., 2018). It is a considerable challenge to find the AD causing biomarkers from such Big data. Thus, machine learning and Artificial intelligence-based methods are focused on these days to meet the challenges. There is another issue with the molecular biomarkers; more than the volume, the dimensionality of the dataset increases faster (Tanveer et al., 2020). Molecular data, such as gene expression, are ultra-high dimensional datasets. The dimensionality is achieving higher levels of thousands and hundreds of thousands.
Meanwhile, the sample size did not witness the same amount of growth. Such a situation is commonly known as the High Dimensionality Low Sample Size (HDLSS) problem or “curse of dimensionality”. The machine learning techniques widely used are not suited for such cursed dimensional data (Lee and Lee, 2020). The inconsistent ratio between the number of features and the number of samples will lead to overfitting, incompatible algorithm, and extended computational time.
To solve the curse of dimensionality problem, feature selection is proposed as a solution. In this study, we develop a gene selection pipeline combining filter, wrapper, and unsupervised method to select the relevant features in causing AD. Later, the selected genes are passed through the Improved Deep Belief Network (IDBN), which is implemented to classify the AD and non-AD individuals. The selection of relevant features will make the classification of AD and non-AD individuals accurate and easy.
Background and Motivation
Alzheimer’s Disease and Machine Learning Algorithms
The most widely used technique in diagnosing AD is the clinical screening methods, such as brain imaging. At times, the clinical screening methods provide inaccurate results due to technical errors, which eventually delays the treatment. Hence, the research is gradually moving towards molecular data, for instance, microarray data. In the process of finding out differentially expressed genes, thousands of genes are captured and monitored to evaluate the effects of a disease or a treatment (Fung and Stoeckel, 2007). For detecting the expression of hundreds and thousands of genes simultaneously, microarray technology is used widely. In microarray, thousands of genes or DNA sequences are printed in already defined positions. The DNA microarray datasets have vast volumes of genes captured, which might not be relevant to the undertaken domain (treatment/disease) (Huang et al., 2018).
Considering the huge volume of features involved, machine learning-based methods help greatly in classifying AD patients from healthy individuals. Machine learning is a continuously growing area of research, advantageous in many domains, mainly in healthcare. Machine learning algorithms are trained on a set of data, learn from the data, find out the patterns, and predict the future possibilities without much human intervention (Orimaye et al., 2017). It is a part of Artificial Intelligence, assists in data analysis, and automates model building. There are three categories of machine learning algorithm based on the dataset used (Hutter et al., 2019): supervised learning, when the data are structured and attributes are labeled; unsupervised learning, when the data are unstructured and the attributes are unlabeled; and semi-supervised/semi-unsupervised learning, when the data are a combination of supervised and unsupervised categories. Although machine learning algorithms offer great assistance in finding patterns and classification, it is not suitable when the ratio of sample to feature is largely different. In that case, machine learning algorithms will have an overfitting problem.
Related Works
Artificial Intelligent models have been widely deployed in genetics research (Mahendran et al., 2020). Deep learning approaches remove certain data pre-processing, which is usually deployed in machine learning (Srinivasan et al., 2017; Agarwal et al., 2018; Chakriswaran et al., 2019; Khan et al., 2021a; Khan et al., 2021b; Khan et al., 2021c) (Sanchez-Riera et al., 2018; Srinivasan et al., 2020; Afza et al., 2021; Ashwini et al., 2021; Attique Khan et al., 2021; Khan et al., 2021d; Mamdiwar et al., 2021; Srinivasan et al., 2021). AD is a neurological disorder identified through brain imaging, and there are many works focused on classifying AD through brain images with the help of machine learning or deep learning techniques. For instance, Convolutional Neural Network (CNN) and LeNet architecture is applied on the MRI data to classify AD (Sarraf and Tofighi, 2016a). There are many such works focused on classifying AD through the brain images (Sarraf and Tofighi, 2016b; Farooq et al., 2017; Ji et al., 2019; Ramzan et al., 2020; Tufail et al., 2020), though the imaging data provide inaccurate results at times. Thus, the focus recently is shifted to the molecular dataset such as the Gene Expression and DNA Methylation data, though the problem with such data is the dimensionality. There is a huge number of features, yet very small sample size.
Therefore, the research is focused more on the gene selection techniques to select the relevant features in classifying the AD. For instance, Park et al. (Park et al., 2020) implemented machine learning-based gene selection and a deep learning classifier combining the gene expression and DNA Methylation datasets. Also, the gene pair interaction-based research is done to identify the biomarkers accurately to classify the AD (Chen et al., 2019). Furthermore, there are approaches implemented to detect the possible progression of a dementia to AD with the help of machine learning techniques (Martínez-Ballesteros et al., 2017; Miao et al., 2017). Also, the artificial intelligence approaches are adopted in precision medicine to validate the drugs for AD.
Feature Selection
There are four mainly used feature selection techniques, Filter, Wrapper, Hybrid, and Ensemble (Bashir et al., 2019). Filter-based techniques are independent of the classifier model and computationally efficient at times (Acharya et al., 2019). The search for relevant features is isolated completely from the classifier model. The features with the lowest relevance score are eliminated. The filter methods are further classified into univariate and multivariate filters, where univariate treats and evaluates the features individually and multivariate evaluates the feature dependencies. The wrapper methods are implemented as a part of the classification model (Zhou et al., 2018). The feature subsets selected are validated through training and testing datasets. The features with maximum evaluation score are selected for the final classification. The wrapper method’s major drawbacks are as follows: it demands high computational time, it is classifier dependent, and overfitting (Mirzaei et al., 2018).
The ensemble methods simultaneously build different feature subsets and combine the results using standard aggregate methods, such as majority voting, sum rule, mean rule, and weighted voting (Pes, 2019). The exponential growth of technologies across all the domains created a data explosion, which is continuously spreading at an unprecedented speed. The previously mentioned feature selection methods are not suitably designed for a dataset with HDLSS problem and unstable and not robust with changing inputs. Thus, ensemble methods are designed aiming to bring more robustness and stability to the model (Neumann et al., 2017). The main goal of the ensemble model is to attain a better trade-off between stability and predictive performance. The ensemble methods are generally grouped under homogeneous and heterogeneous methods. The homogeneous algorithms use selection algorithm with the varying dataset, for instance, boosting or bagging. The homogeneous ensembles handle the stability issues better. The heterogeneous ensembles implement different selection algorithms with the same dataset. In both cases, the output will be combined to a single feature set, which probably provides an optimal solution (Pes, 2019). Apart from homogeneous and heterogeneous methods, there is another group called the hybrid, which uses different selection algorithms with other datasets.
Though these three feature selection methods are needed, there are various reasons that make them unreliable, unstable, and sometimes ignore the algorithms’ stability. However, there is a fourth method that is focused on much these days, the hybrid method. To solve the issues with respect to filter and wrapper methods, a hybrid method is introduced. It combines two or more feature selection techniques and produces a new method with added benefits. In most cases, wrapper and filter methods are made hybrid by combining their advantages (Hoque et al., 2018; Kollias et al., 2018; Thavavel and Karthiyayini, 2018). This study implemented a feature selection pipeline for selecting relevant genes from the raw Alzheimer’s gene expression dataset. The filter method is simple and ignores the feature dependencies most of the time and also occasionally includes the redundant features. Wrapper methods are at high risk of overfitting and are stuck in the local optima. It is also computationally intensive. Ensemble methods are better than filter and wrapper; however, on the dataset with the High Dimensional and Low Sample Size (HDLSS) issue, it does not perform well. Thus, we desired to implement a feature selection method catering to the HDLSS issue. Hybrid methods are flexible and robust upon high-dimensional data. Also, they offer higher performance and better computational complexity than the filter and wrapper methods. The pipeline consists of a filter method, wrapper method, and unsupervised gene selection method.
Dataset and Resources
For a better treatment of AD, the gene expressions are captured preferentially during normal neurological aging (Lima et al., 2016; Carpenter and Huang, 2018). The data captured during the course of AD will improve the understanding of the underlying pathogenesis of AD. This practice will help in the early diagnosis and treatment of AD. The dataset (GSE5281) (Liang et al., 2007) used in this study is from one of the widely accessed data repository, Gene Expression Omnibus (GEO). The dataset consists of information about AD and normal aged brain with 161 samples and 54,675 features (gene expression). The gene expressions are captured from six brain regions of Homo sapiens using the LCM cells on the Affymetrix U133 plus 2.0 array with approximately 55,000 transcripts. Among the 161 records, 74 controls and 87 are affected. We have used RStudio for implementing the mentioned approaches in this study. To analyze the gene expression dataset, R has many beneficial packages such as the Bio-conductor.
Methodology
We implemented a gene selection pipeline by combining a filter (mRmR), wrapper (Wrapper-based PSO), and unsupervised method (Autoencoder). The mRmR eliminates the genes with maximum redundancy (high correlation among themselves) and the selected genes are inputted to the Wrapper-based PSO, which has k-means as the wrapper method and selects the relevant genes. The selected genes are passed through an autoencoder for further compression. The compressed genes are used for classifying the AD and non-AD individuals using the IDBN. The process flow of the proposed framework is shown in Figure 1.
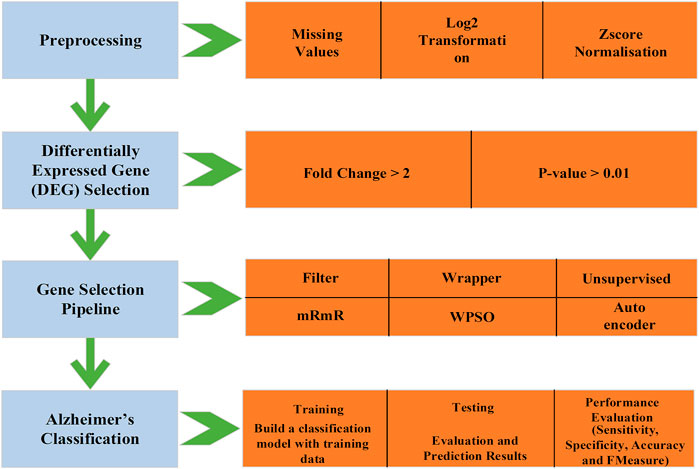
FIGURE 1. Process flow diagram—proposed system.
Minimum Redundancy and Maximum Relevance (mRmR)
mRmR is the most widely used practical statistical approach for feature selection. It was proposed by Peng et al. (Ding and Peng, 2005) initially for classifying patterns. The mRmR method strives to choose the feature subset that is highly relevant to the outcome (target class) and minimally redundant. In simple terms, the features are highly similar to the outcome class (relevance) and dissimilar among themselves (redundancy). The feature selection process in mRmR is carried out by adding the features with the highest feature importance to the feature list at each step (El Akadi et al., 2011; Billah and Waheed, 2020).
The aim of mRmR in gene selection is to select a gene subset, Gs, with {Xm} features that are highly correlated with the target class T (output class). The mRmR involves three steps, finding the relevance, finding the redundancy, and combining the two to get the mRmR feature set.
Step 1 Maximum RelevanceThe maximum relevance is calculated using the mean of Mutual Information of all the features in Xm with target class T. The Mutual Information between R and S random variables can be calculated by
Where.R—response variable.S—number of features.ΩR and ΩS—sample spaces with respect to R and S,p (r, s)—joint probability density, andp ()—marginal density function.The maximum relevance is given by
Where MI(T, Xm)—Mutual Information of feature Xm with class T.
Step 2 Minimum RedundancyThe minimum redundancy is calculated with the formula
Step 3 Combining the above two constraintsThe maximum relevance and minimum redundancy are combined to form the mRmR using the formula
Where α = (Relevance (Gs) − Redundancy (Gs))
Particle Swarm Optimization (PSO)
PSO is a stochastic, metaheuristic algorithm inspired by the birds’ swarming behavior. From the birds’ flocking behavior, it is understood that each individual is affected by the leader or the global optima and the personal performance or the local optima (Deepthi and Thampi, 2015). The PSO is an optimization technique based on population proposed by Eberhart and Kennedy (Kennedy and Eberhart, 1995), successfully applied in many global search problems. It is considered in many feature selection problems as it is easy to implement, and has reasonable computational time, global search, and fewer parameters.
In PSO, the population is initialized with particles, each having its own position and velocity. The quality of the particles is estimated at each iteration with the help of a fitness function. Every particle in the search space will carry the present position (xppos), present velocity (vpvel), and personal best (ypbest). After every iteration, the velocity can be updated by
Where.
iw—inertia weight,
ac1 and ac2—acceleration constants,
r1 and r2—random numbers (range [0, 1]),
vpvel (old)—present best solution of the particle,
ypbest—personal best solution of the particle, and
ŷgbest—global best solution.
The new position of the particle can be determined by
The positions and the velocity of the particle are updated at every iteration using the formulas given. The process is stopped when certain minimized fitness function criteria are achieved or a particular predefined iteration is reached. For position and velocity updates, the particles use the knowledge of their own and that of other neighboring particles. The final output represents the optimal feature set. We implemented a wrapper-based PSO with the k-means algorithm as the wrapper method. This wrapper method will aid in overcoming the problem of reaching local optima.
The fitness function for each subset is calculated using the below equation,
Where.
k—number of clusters,
i—object in the cluster,
cx—cluster centroid, and
d—Euclidean distance.
Autoencoders
Autoencoder is an artificial neural network with feed-forward processing. The autoencoder consists of input and output with one or more hidden layers, where the number of neurons (features) in the input and output layer is the same (Chicco et al., 2014). The autoencoder’s main aim is to reconstruct the inputs such that the difference between the input and the output is minimized. The learning in autoencoder is compressed and distributed (encoding) (Ferri et al., 2021). The training of autoencoder involves three steps:
1. If “x” is the input and “x̂" is the output, the feed-forward pass is done to estimate the values of all the nodes in the hidden layers after applying the activation function. For an autoencoder with a single hidden layer, the hidden unit vector hu is given by
Where.
hu—hidden unit,
afunc—activation function.
We—parameter matrix (encoding),
x—input, and
biase—bias parameter vector (encoding).
2. Map the hidden representation into the space “x” with the help of the decoding function. The decoding function is given by
Where.
Wd—parameter matrix (decoding) and
biasd—bias parameter vector (decoding).
3. Calculate back propagation error using the formula
Deep Belief Network
In Deep Belief Network (DBN), the Restricted Boltzmann Machines are stacked together to form a network (An et al., 2020). RBMs are energy-based generative models with two layers, visible and hidden. Both the layers have nodes connected to each other (Mahendran et al., 2020; Sureshkumar et al., 2020). The major components in RBMs are bias, weight, and activation function (Le Roux and Bengio, 2008; Sekaran and Sudha, 2020). The output is produced after processing with the activation function. We implemented an IDBN with stopping criteria. We chose the hyperparameters using the Bayesian Optimization technique. The Bayesian approach for tuning the hyperparameter keeps past records and verifies the probability to select the next set of parameters. It takes informative decisions in choosing the parameters. The final values for the hyperparameters in IDBN are as follows: learning rate = 0.01, hidden layers = 9, number of nodes per layer = 342, and dropout rate = 0.85. We used the Rectified Linear Unit (RLu) as the activation function. To avoid the overfitting problem, we introduced a stopping criteria strategy. After every 40 epochs, the test accuracy of the last 10 epochs will be compared and checked for convergence, and the training accuracy will also be checked. If both the conditions are satisfied, the learning is ended.
Evaluation Metrics
For evaluating the results of the proposed model, we have used the standard evaluation metrics such as Accuracy, Sensitivity, Specificity, and FMeasure.
• Accuracy: It is a simple ratio between the correctly classified as AD and non-AD to the total number of samples.
• Sensitivity: It is a measure to identify correctly those with AD.
• Specificity: It is a measure to identify correctly those without AD.
• FMeasure: It is the weighted average of recall and precision (the percentage of samples that are classified as AD positive and are actually positive).
Pseudocode
mRmR—WPSO—AE
mRmR.
Input: Candidates (set of initial genes).
Step 1: for genes gi in candidates do.
Step 2: relevance = calculate the relevance score using Eq. 2;
Step 3: redundancy = 0;
Step 4: for genes gj in candidates do.
Step 5: redundancy = calculate the redundancy score using Eq. 3;
Step 6: end for.
Step 7: mrmr_values [gi] = Eq. 4;
Step 8: end for.
Step 9: selected_genes = take (number_of_genes_required);
WPSO.
Step 10: Initialize x random gene subsets from the selected_genes with y number of genes in each subset.
Step 11: For every random subset x, initialize position and velocity vectors.
Step 12: Cluster initial subset with K = k using k-means clustering.
Step 13: Evaluate the fitness_value using Eq. 7
Step 14: Based on the fitness function, update the subset’s pbest and pbestloc.
Step 15: repeat.
Step 16: if (fitness_value < pbest) then.
Step 17: update pbest and pbestloc;
Step 18: end if.
Step 19: Initialize gbest and gbestloc after finding the minimum fitness_value in all the subsets.
Step 20: for j = 0 to swarm_size-1 do.
Step 21: Estimate velocity using Eq. 5;
Step 22: Update subset location using Eq. 6;
Step 23: end for.
Step 24: Set the fitness_value by computing the squared error using the present location of the gene subset.
Step 25: until predefined number of iterations reached;
Output: Best subset of genes (gbestloc).
Autoencoder.
Input: gbestloc_matrix (GM)
Step 26: Initialize hidden units (hu), where hu < m, and hidden layers (d).
Step 27: Training:
Step 28: for each GMi (gene profile) of GM, where i
Step 29: for each hidden layer d.
Step 30: compute hidden activation function using Eq. 8
Step 31: reconstruct the output using Eq. 9
Step 32: evaluate the error using Eq. 10
Step 33: update the weight by back propagating the error.
Step 34: Testing:
Step 35: for each GMi (gene profile) of GM, where i
Step 36: autoencode GMi and produce.
Step 37: set
Results and Discussion
This study’s primary aim is to improve the classification accuracy of the model in classifying Alzheimer patients by selecting the most relevant feature subset. The dataset used in this study has 161 samples and 54,675 features. The raw gene expression level data are highly skewed, as can be seen in the box plot shown in Figure 2. Thus, we applied log2 transformation to make it symmetrical. The results after applying the log2 transformation can be seen in the box plot shown in Figure 3. We applied Z-score normalization on the transformed data to make it comparable across all the platforms. Once the data are normalized, the differentially expressed genes are identified with fold change and p-value. The threshold used for fold change and p-value is |FC| > 2 and p-value > 0.01. The heat map from Figure 4 shows the levels of differentially expressed genes. The plot from Figure 5 shows the p-value and fold change levels of the differentially expressed genes. False represents the expression levels that are below the threshold, and true represents the expression levels that are above the threshold. The respective genes are selected and carried forward for the next stage, which is feature selection.
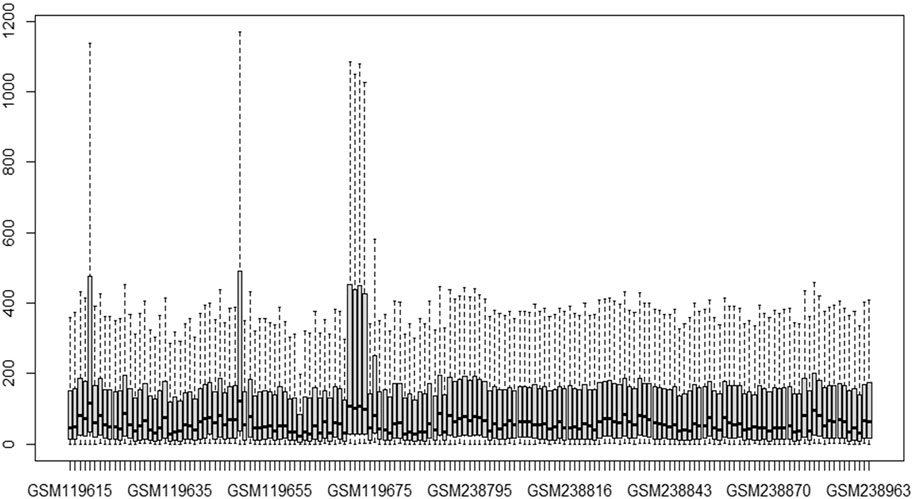
FIGURE 2. Boxplot of gene expression data before transformation.

FIGURE 3. Boxplot of gene expression data after transformation.
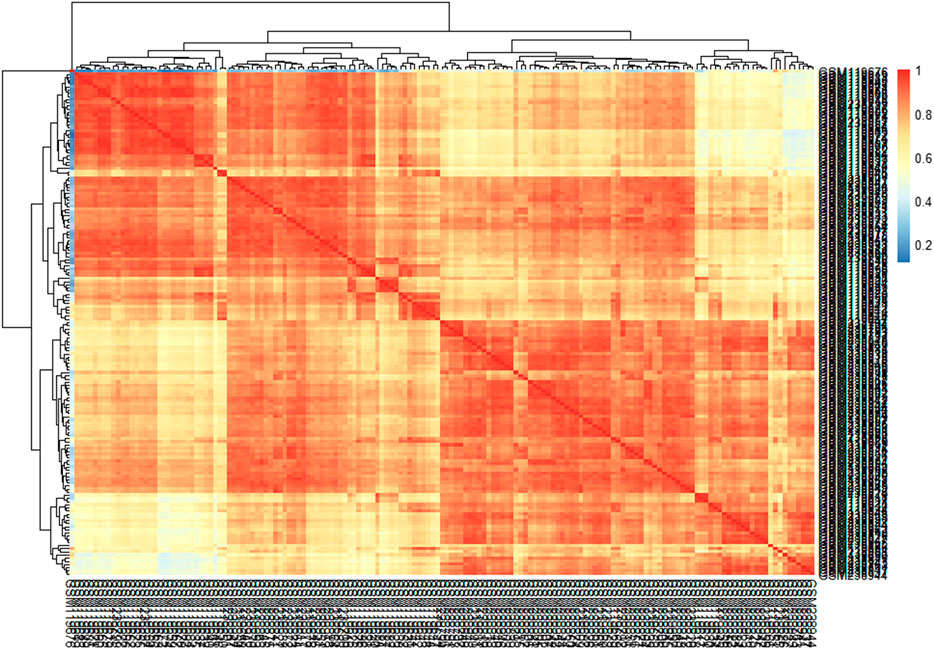
FIGURE 4. Heat map of differentially expressed genes.
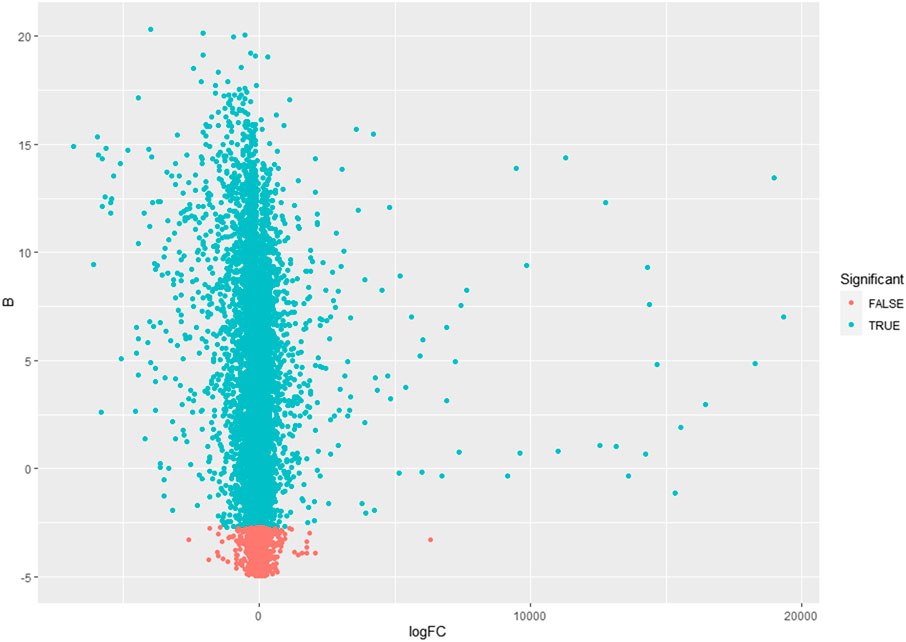
FIGURE 5. p-value and fold change plot.
We designed a feature selection pipeline with mRmR, PSO, and autoencoder. The mRmR selects the gene with maximum relevance and minimum redundancy. Then, we applied a wrapper-based PSO technique with k-means clustering as the wrapper to further select the candidate genes. The candidate genes selected are passed through an autoencoder to form the latent representation of the provided input, compress the data without much information loss, and then rebuild as output with as low error as possible. The primary goal of passing the genes through autoencoder is to make the data less sensitive to variations in training. After selecting the relevant features (CTD-3092A11.2, CHGB, JPX, MAFF, AC004951.6, APLNR, MT1M, SST, PCYOX1L, PRO 1804, and SLC39A12), we implemented an IDBN.
We used the leave-one-out cross-validation method to evaluate the proposed model (Srinivasan et al., 2019). Leave-one-out validation is used because the sample size is less than the feature size. The metrics we used to evaluate the model are Sensitivity, Specificity, Accuracy, and FMeasure. We compared the results of the proposed feature selection pipeline with widely used Principal Component Analysis (PCA), Correlation-based Feature Selection (CBFS), and minimum Redundancy and maximum Relevance (mRmR). We also implemented two linear and two non-linear classifiers Support Vector Machine (SVM), Linear Discriminant Analysis (LDA), Naïve Bayes (NB), and Multi-Layer Perceptron (MLP), to compare the results with the IDBN.
The results are tabulated in Table 1. The tabulated results show that the proposed feature selection algorithm pipeline (mRmR-WPSO-AE), along with IDBN, classifies Alzheimer’s slightly better than the other implemented models. The linear models SVM and LDA produce an accuracy of 92.91 and 89.74% with the proposed gene selection pipeline, which is better than the PCA’s 87.62% (SVM), 85.94% (LDA), CBFS’s 79.04% (SVM), 77.65% (LDA), and mRmR’s 85.21% (SVM), 84.78% (LDA). Also, with the non-linear models, NB and MLP produce an accuracy of 88.75 and 94.56%, which is again better than the PCA’s 83.08% (NB), 91.87% (MLP), CBFS’s 76.89% (NB), 82.07% (MLP), and mRmR’s 83.45% (NB), 87.80% (MLP). SVM performs better among the linear models than LDA along all the implemented gene selection methods, and MLP performs better than NB in the non-linear category. The combination of the proposed gene selection pipeline (mRmR-WPSO-AE) and IDBN shows the promising result with 96.78% accuracy in classifying Alzheimer’s patients. From the plots shown in Figures 6–9, it is clear that IDBN shows slightly better results than the other implemented classification models. The plot from Figure 10 shows the Accuracy comparison of the implemented models. The plot shows that the IDBN and mRmR-WPSO-AE have better accuracy than the other models.
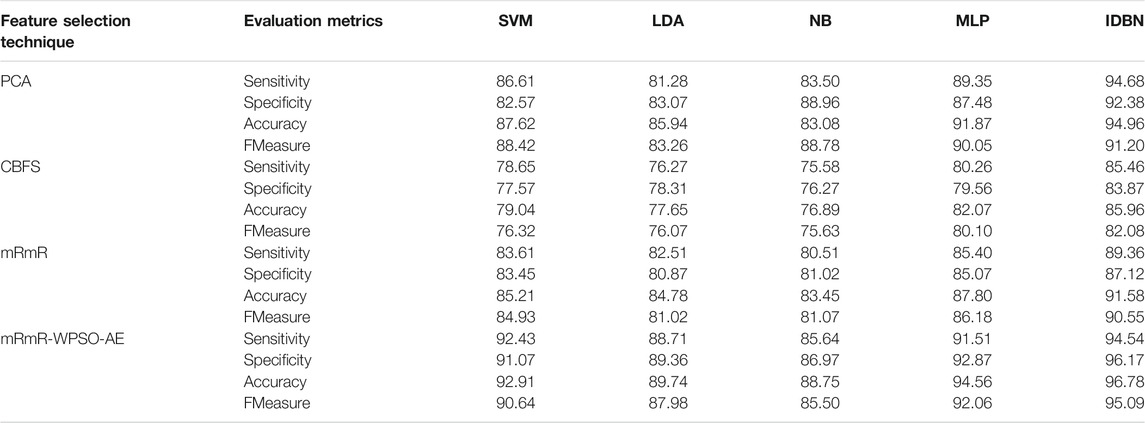
TABLE 1. Results analysis.
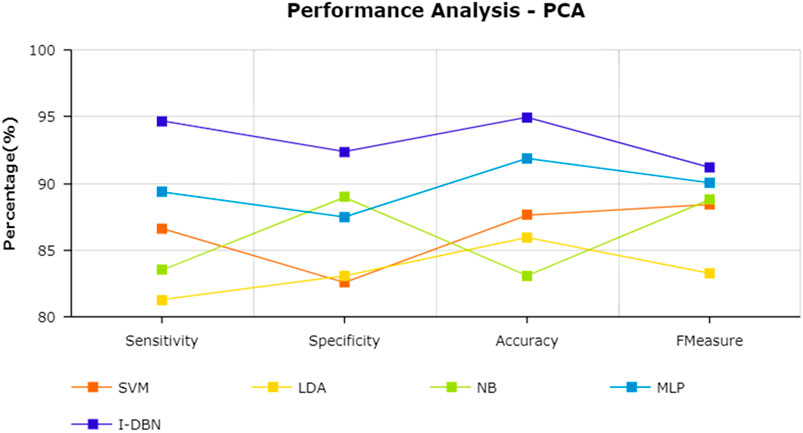
FIGURE 6. Performance analysis—PCA.
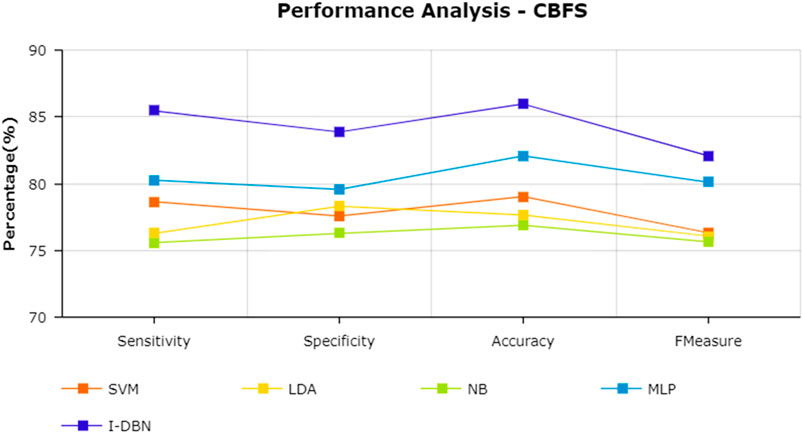
FIGURE 7. Performance analysis—CBFS.
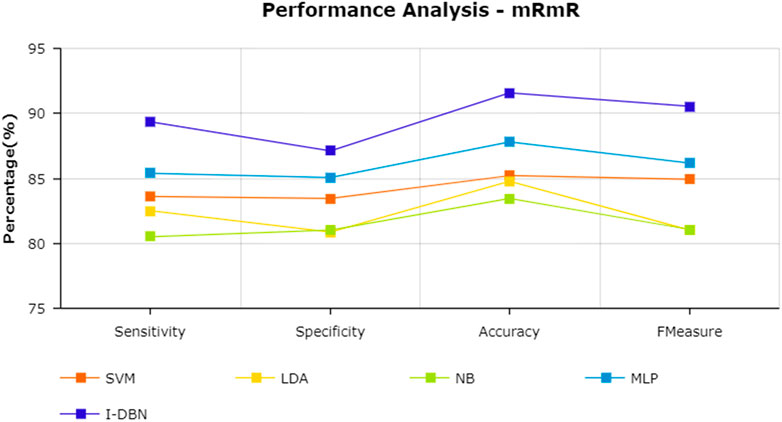
FIGURE 8. Performance analysis—mRmR.
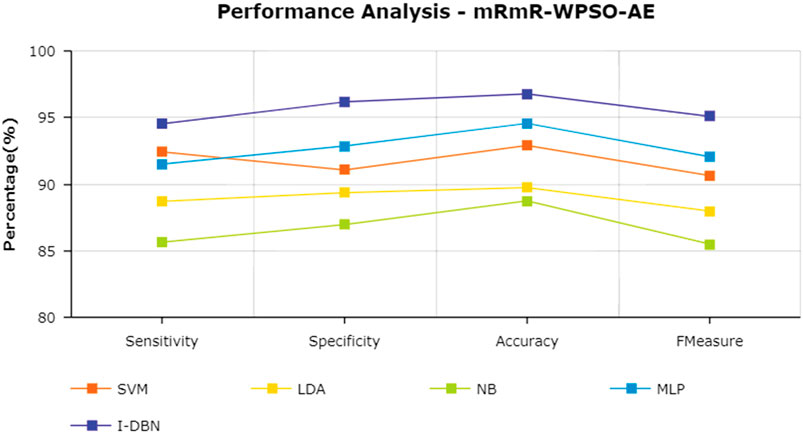
FIGURE 9. Performance analysis—mRmR-WPSO-AE.
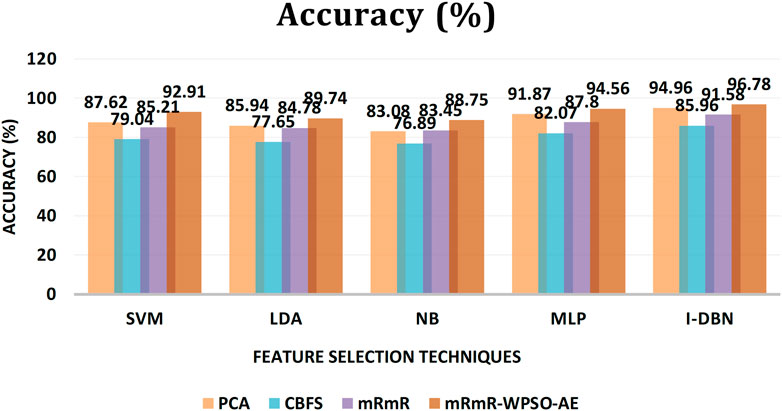
FIGURE 10. Accuracy comparison of the implemented models.
Conclusion and Future Work
Alzheimer’s is a progressive degenerative brain disease in the elderly. It is difficult to diagnose even with dominant symptoms. The proper diagnoses are made only during an autopsy after the death of the individual. Recent advances have made it easy to be detected early, using clinical screening with technologies such as brain imaging. Although brain imaging proves effective in most cases, in some cases, the results are inaccurate. The inaccuracies in the results make it difficult for early diagnoses and appropriate treatment for the individual. Thus, the research now shifts to molecular biomarker identification, which helps to differentiate clearly between genotype and phenotype characteristics.
The molecular data-based research proves to be effective. Still, it generates huge volumes of data consisting of transcripts, transcriptomes, etc. It creates a “curse of dimensionality” problem. Thus, machine learning-based feature selection techniques are implemented to select only the relevant genes affecting the target class (outcome). We implemented one such gene selection method for choosing the relevant genes. We designed a hybrid gene selection pipeline by combining mRmR, WPSO, and AE. We compared the results with other commonly used feature selection techniques, such as PCA, CBFS, and mRmR. We compared the results by implementing two linear (SVM and LDA) and two non-linear (NB and MLP) machine learning classification algorithms. We also implemented the IDBN with simple criteria to avoid overfitting. The results show that the proposed pipeline and the IDBN perform slightly better than the linear and non-linear models implemented in this study. In the future, we would implement the proposed pipeline on SNP and DNA Methylation dataset to evaluate the model’s generalization.
Data Availability Statement
The original contributions presented in the study are included in the article/Supplementary Material, further inquiries can be directed to the corresponding authors.
Author Contributions
PV and C-YC did the conceptualization and supervised the research. C-YC carried out the funding acquisition. NM investigated the data, performed the methodology, and implemented the software code. C-YC and KS carried out the project administration and validated the results. NM wrote the manuscript. PV and KS reviewed and edited the manuscript. All authors contributed to the article and approved the submitted version.
Funding
This work was supported by the Ministry of Science and Technology, Taiwan: MOST 109-2221-E-224-048-MY2.
Conflict of Interest
The authors declare that the research was conducted in the absence of any commercial or financial relationships that could be construed as a potential conflict of interest.
Publisher’s Note
All claims expressed in this article are solely those of the authors and do not necessarily represent those of their affiliated organizations, or those of the publisher, the editors, and the reviewers. Any product that may be evaluated in this article, or claim that may be made by its manufacturer, is not guaranteed or endorsed by the publisher.
References
Acharya, U. R., Fernandes, S. L., WeiKoh, J. E., Ciaccio, E. J., Fabell, M. K. M., Tanik, U. J., et al. (2019). Automated Detection of Alzheimer's Disease Using Brain MRI Images- A Study with Various Feature Extraction Techniques. J. Med. Syst. 43 (9), 302–314. doi:10.1007/s10916-019-1428-9
Afza, F., Sharif, M., Mittal, M., Khan, M. A., and Hemanth, D. J. (2021). A Hierarchical Three-step Superpixels and Deep Learning Framework for Skin Lesion Classification. Methods 2021, 1046–2023. doi:10.1016/j.ymeth.2021.02.013
Agarwal, P., Wang, H.-C., and Srinivasan, K. (2018). Epileptic Seizure Prediction over EEG Data Using Hybrid CNN-SVM Model with Edge Computing Services. MATEC Web Conf. 210, 03016. doi:10.1051/matecconf/201821003016
An, N., Jin, L., Ding, H., Yang, J., and Yuan, J. (2020). A Deep Belief Network-Based Method to Identify Proteomic Risk Markers for Alzheimer Disease. arXiv preprint arXiv:2003.05776.
Ashwini, K., Srinivasan, K., and Chang, C. Y. (2021). Deep Learning Assisted Neonatal Cry Classification via Support Vector Machine Models. Front. Public Health 9, 670352. doi:10.3389/fpubh.2021.670352
Attique Khan, M., Sharif, M., Akram, T., Kadry, S., and Hsu, C. H. (2021). A Two‐stream Deep Neural Network‐based Intelligent System for Complex Skin Cancer Types Classification. Int. J. Intell. Syst. 2021, 1–29. doi:10.1002/int.22691
Bashir, S., Khan, Z. S., Khan, F. H., Anjum, A., and Bashir, K. (2019). “Improving Heart Disease Prediction Using Feature Selection Approaches,” in 2019 16th international bhurban conference on applied sciences and technology (IBCAST) (Islamabad, Pakistan: IEEE), 619–623. doi:10.1109/ibcast.2019.8667106
Billah, M., and Waheed, S. (2020). Minimum Redundancy Maximum Relevance (mRMR) Based Feature Selection from Endoscopic Images for Automatic Gastrointestinal Polyp Detection. Multimedia Tools Appl. 79 (33), 23633–23643. doi:10.1007/s11042-020-09151-7
Carpenter, K. A., and Huang, X. (2018). Machine Learning-Based Virtual Screening and its Applications to Alzheimer's Drug Discovery: a Review. Curr. Pharm. Des. 24 (28), 3347–3358. doi:10.2174/1381612824666180607124038
Chakriswaran, P., Vincent, D. R., Srinivasan, K., Sharma, V., Chang, C.-Y., and Reina, D. G. (2019). Emotion AI-Driven Sentiment Analysis: A Survey, Future Research Directions, and Open Issues. Appl. Sci. 9, 5462. doi:10.3390/app9245462
Chen, H., He, Y., Ji, J., and Shi, Y. (2019). A Machine Learning Method for Identifying Critical Interactions between Gene Pairs in Alzheimer's Disease Prediction. Front. Neurol. 10, 1162. doi:10.3389/fneur.2019.01162
Chicco, D., Sadowski, P., and Baldi, P. (2014). “Deep Autoencoder Neural Networks for Gene Ontology Annotation Predictions,” in Proceedings of the 5th ACM conference on bioinformatics, computational biology, and health informatics, Newport Beach, CA, September 20–23, 2014 (New York, NY: Association for Computing Machinery, 533–540. doi:10.1145/2649387.2649442
Citron, M. (2010). Alzheimer's Disease: Strategies for Disease Modification. Nat. Rev. Drug Discov. 9 (5), 387–398. doi:10.1038/nrd2896
Deepthi, P. S., and Thampi, S. M. (2015). “PSO Based Feature Selection for Clustering Gene Expression Data,” in 2015 IEEE International Conference on Signal Processing, Informatics, Communication and Energy Systems (SPICES) (Kozhikode, India: IEEE), 1–5. doi:10.1109/spices.2015.7091510
Ding, C., and Peng, H. (2005). Minimum Redundancy Feature Selection from Microarray Gene Expression Data. J. Bioinform. Comput. Biol. 03 (02), 185–205. doi:10.1142/s0219720005001004
El Akadi, A., Amine, A., El Ouardighi, A., and Aboutajdine, D. (2011). A Two-Stage Gene Selection Scheme Utilizing MRMR Filter and GA Wrapper. Knowl Inf. Syst. 26 (3), 487–500. doi:10.1007/s10115-010-0288-x
Farooq, A., Anwar, S., Awais, M., and Rehman, S. (2017). “A Deep CNN Based Multi-Class Classification of Alzheimer's Disease Using MRI,” in 2017 IEEE International Conference on Imaging systems and techniques (IST) (Beijing, China: IEEE), 1–6.
Ferri, R., Babiloni, C., Karami, V., Triggiani, A. I., Carducci, F., Noce, G., et al. (2021). Stacked Autoencoders as New Models for an Accurate Alzheimer's Disease Classification Support Using Resting-State EEG and MRI Measurements. Clin. Neurophysiol. 132 (1), 232–245. doi:10.1016/j.clinph.2020.09.015
Fung, G., and Stoeckel, J. (2007). SVM Feature Selection for Classification of SPECT Images of Alzheimer's Disease Using Spatial Information. Knowl Inf. Syst. 11 (2), 243–258. doi:10.1007/s10115-006-0043-5
Hoque, N., Singh, M., and Bhattacharyya, D. K. (2018). EFS-MI: an Ensemble Feature Selection Method for Classification. Complex Intell. Syst. 4 (2), 105–118. doi:10.1007/s40747-017-0060-x
Huang, X., Liu, H., Li, X., Guan, L., Li, J., Tellier, L. C. A. M., et al. (2018). Revealing Alzheimer's Disease Genes Spectrum in the Whole-Genome by Machine Learning. BMC Neurol. 18 (1), 5–8. doi:10.1186/s12883-017-1010-3
Huber, C. M., Yee, C., May, T., Dhanala, A., and Mitchell, C. S. (2018). Cognitive Decline in Preclinical Alzheimer's Disease: Amyloid-Beta versus Tauopathy. J. Alzheimers Dis. 61 (1), 265–281. doi:10.3233/JAD-170490
Hutter, F., Kotthoff, L., and Vanschoren, J. (2019). Automated Machine Learning: Methods, Systems, Challenges. Basingstoke, UK: Springer Nature, 219.
Ji, H., Liu, Z., Yan, W. Q., and Klette, R. (2019). “Early Diagnosis of Alzheimer's Disease Using Deep Learning,” in Proceedings of the 2nd International Conference on Control and Computer Vision, Jeju, Republic of Korea, June 15–18, 2019 (New York, NY: Association for Computing Machinery), 87–91. doi:10.1145/3341016.3341024
Kennedy, J., and Eberhart, R. (1995). “Particle Swarm Optimization,” in Proceedings of the IEEE International Conference on Neural Networks, Perth, WA (Citeseer), Vol. 4, 1942–1948. doi:10.1109/ICNN.1995.488968
Jo, T., Nho, K., and Saykin, A. J. (2019). Deep Learning in Alzheimer's Disease: Diagnostic Classification and Prognostic Prediction Using Neuroimaging Data. Front. Aging Neurosci. 11, 220. doi:10.3389/fnagi.2019.00220
Khan, M. A., Akram, T., Zhang, Y.-D., and Sharif, M. (2021). Attributes Based Skin Lesion Detection and Recognition: A Mask RCNN and Transfer Learning-Based Deep Learning Framework. Pattern Recognition Lett. 143, 58–66. doi:10.1016/j.patrec.2020.12.015
Khan, M. A., Muhammad, K., Sharif, M., Akram, T., and Albuquerque, V. H. C. D. (2021). “Multi-Class Skin Lesion Detection and Classification via Teledermatology”. In IEEE Journal of Biomedical and Health Informatics. doi:10.1109/JBHI.2021.3067789
Khan, M. A., Sharif, M., Akram, T., Damaševičius, R., and Maskeliūnas, R. (2021). Skin Lesion Segmentation and Multiclass Classification Using Deep Learning Features and Improved Moth Flame Optimization. Diagnostics 11, 811. doi:10.3390/diagnostics11050811
Khan, M. A., Zhang, Y.-D., Sharif, M., and Akram, T. (2021). Pixels to Classes: Intelligent Learning Framework for Multiclass Skin Lesion Localization and Classification. Comput. Electr. Eng. 90, 106956. doi:10.1016/j.compeleceng.2020.106956
Kollias, D., Tagaris, A., Stafylopatis, A., Kollias, S., and Tagaris, G. (2018). Deep Neural Architectures for Prediction in Healthcare. Complex Intell. Syst. 4 (2), 119–131. doi:10.1007/s40747-017-0064-6
Lawrence, A. D., and Sahakian, B. J. (1995). Alzheimer Disease, Attention, and the Cholinergic System. Alzheimer Dis. associated Disord. 9 (Suppl 2), 43–49. doi:10.1097/00002093-199501002-00008
Le Roux, N., and Bengio, Y. (2008). Representational Power of Restricted Boltzmann Machines and Deep Belief Networks. Neural Comput. 20 (6), 1631–1649. doi:10.1162/neco.2008.04-07-510
Lee, T., and Lee, H. (2020). Prediction of Alzheimer's Disease Using Blood Gene Expression Data. Sci. Rep. 10 (1), 1–13. doi:10.1038/s41598-020-60595-1
Liang, W. S., Dunckley, T., Beach, T. G., Grover, A., Mastroeni, D., Walker, D. G., et al. (2007). Gene Expression Profiles in Anatomically and Functionally Distinct Regions of the normal Aged Human Brain. Physiol. Genomics 28 (3), 311–322. doi:10.1152/physiolgenomics.00208.2006
Lima, A. N., Philot, E. A., Trossini, G. H. G., Scott, L. P. B., Maltarollo, V. G., and Honorio, K. M. (2016). Use of Machine Learning Approaches for Novel Drug Discovery. Expert Opin. Drug Discov. 11 (3), 225–239. doi:10.1517/17460441.2016.1146250
Liu, S., Liu, S., Cai, W., Pujol, S., Kikinis, R., and Feng, D. (2014). “Early Diagnosis of Alzheimer's Disease with Deep Learning,” in 2014 IEEE 11th international symposium on biomedical imaging (ISBI) (Beijing, China: IEEE), 1015–1018.
Mahendran, N., Durai Raj Vincent, P. M., Srinivasan, K., and Chang, C.-Y. (2020). Machine Learning Based Computational Gene Selection Models: A Survey, Performance Evaluation, Open Issues, and Future Research Directions. Front. Genet. 11, 603808. doi:10.3389/fgene.2020.603808
Mamdiwar, S. D., R, A., Shakruwala, Z., Chadha, U., Srinivasan, K., and Chang, C.-Y. (2021). Recent Advances on IoT-Assisted Wearable Sensor Systems for Healthcare Monitoring. Biosensors 11, 372. doi:10.3390/bios11100372
Martínez-Ballesteros, M., García-Heredia, J. M., Nepomuceno-Chamorro, I. A., and Riquelme-Santos, J. C. (2017). Machine Learning Techniques to Discover Genes with Potential Prognosis Role in Alzheimer’s Disease Using Different Biological Sources. Inf. Fusion 36, 114–129. doi:10.1016/j.inffus.2016.11.005
Miao, Y., Jiang, H., Liu, H., and Yao, Y.-d. (2017). An Alzheimers Disease Related Genes Identification Method Based on Multiple Classifier Integration. Comput. Methods Programs Biomed. 150, 107–115. doi:10.1016/j.cmpb.2017.08.006
Mirzaei, S., El Yacoubi, M., Garcia-Salicetti, S., Boudy, J., Kahindo, C., Cristancho-Lacroix, V., et al. (2018). Two-stage Feature Selection of Voice Parameters for Early Alzheimer's Disease Prediction. IRBM 39 (6), 430–435. doi:10.1016/j.irbm.2018.10.016
Moradifard, S., Hoseinbeyki, M., Ganji, S. M., and Minuchehr, Z. (2018). Analysis of microRNA and Gene Expression Profiles in Alzheimer's Disease: a Meta-Analysis Approach. Sci. Rep. 8 (1), 1–17. doi:10.1038/s41598-018-20959-0
Neumann, U., Genze, N., and Heider, D. (2017). EFS: an Ensemble Feature Selection Tool Implemented as R-Package and Web-Application. BioData Min 10 (1), 21–29. doi:10.1186/s13040-017-0142-8
Nussbaum, R. L., and Ellis, C. E. (2003). Alzheimer's Disease and Parkinson's Disease. N. Engl. J. Med. 348 (14), 1356–1364. doi:10.1056/nejm2003ra020003
Orimaye, S. O., Wong, J. S., Golden, K. J., Wong, C. P., and Soyiri, I. N. (2017). Predicting Probable Alzheimer's Disease Using Linguistic Deficits and Biomarkers. BMC bioinformatics 18 (1), 34–13. doi:10.1186/s12859-016-1456-0
Park, C., Ha, J., and Park, S. (2020). Prediction of Alzheimer's Disease Based on Deep Neural Network by Integrating Gene Expression and DNA Methylation Dataset. Expert Syst. Appl. 140, 112873. doi:10.1016/j.eswa.2019.112873
Pes, B. (2019). Ensemble Feature Selection for High-Dimensional Data: a Stability Analysis across Multiple Domains. Neural Comput. Appl. 32, 1–23. doi:10.1007/s00521-019-04082-3
Ramzan, F., Khan, M. U. G., Rehmat, A., Iqbal, S., Saba, T., Rehman, A., et al. (2020). A Deep Learning Approach for Automated Diagnosis and Multi-Class Classification of Alzheimer's Disease Stages Using Resting-State fMRI and Residual Neural Networks. J. Med. Syst. 44 (2), 37–16. doi:10.1007/s10916-019-1475-2
Reitz, C., Brayne, C., and Mayeux, R. (2011). Epidemiology of Alzheimer Disease. Nat. Rev. Neurol. 7 (3), 137–152. doi:10.1038/nrneurol.2011.2
Salat, D. H., Kaye, J. A., and Janowsky, J. S. (2001). Selective Preservation and Degeneration within the Prefrontal Cortex in Aging and Alzheimer Disease. Arch. Neurol. 58 (9), 1403–1408. doi:10.1001/archneur.58.9.1403
Sanchez-Riera, J., Srinivasan, K., Hua, K.-L., Cheng, W.-H., Hossain, M. A., and Alhamid, M. F. (2018). Robust RGB-D Hand Tracking Using Deep Learning Priors. IEEE Trans. Circuits Syst. Video Technol. 28 (9), 2289–2301. doi:10.1109/TCSVT.2017.2718622
Sarraf, S., and Tofighi, G. (2016). Classification of Alzheimer's Disease Using Fmri Data and Deep Learning Convolutional Neural Networks. arXiv preprint arXiv:1603.08631.
Sarraf, S., and Tofighi, G. (2016). “Deep Learning-Based Pipeline to Recognize Alzheimer's Disease Using fMRI Data,” in 2016 future technologies conference (FTC) (San Francisco, CA, USA: IEEE), 816–820. doi:10.1109/ftc.2016.7821697
Sekaran, K., and Sudha, M. (2020). Predicting Autism Spectrum Disorder from Associative Genetic Markers of Phenotypic Groups Using Machine Learning. J. Ambient Intelligence Humanized Comput. 12, 1–14. doi:10.1007/s12652-020-02155-z
Srinivasan, K., Ankur, A., and Sharma, A. (2017). “Super-resolution of Magnetic Resonance Images Using Deep Convolutional Neural Networks,” in 2017 IEEE International Conference on Consumer Electronics, June 12–14, 2017 (Taipei, Taiwan: IEEE), 41–42. doi:10.1109/ICCE-China.2017.7990985
Srinivasan, K., Cherukuri, A., Vincent, D., Garg, A., and Chen, B. (2019). An Efficient Implementation of Artificial Neural Networks with K-fold Cross-Validation for Process Optimization. J. Internet Technol. 20 (4), 1213–1225. doi:10.3966/160792642019072004020
Srinivasan, K., Garg, L., Datta, D., A. Alaboudi, A., Agarwal, N. R., and George Thomas, A. (2021). Performance Comparison of Deep CNN Models for Detecting Driver's Distraction. Comput. Mater. Continua 68 (3), 4109–4124. doi:10.32604/cmc.2021.016736
Srinivasan, K., Mahendran, N., Vincent, D. R., Chang, C.-Y., and Syed-Abdul, S. (2020). Realizing an Integrated Multistage Support Vector Machine Model for Augmented Recognition of Unipolar Depression. Electronics 9, 647. doi:10.3390/electronics9040647
Sureshkumar, V., Chandrasekar, V., Venkatesan, R., and Prasad, R. K. (2020). Improved Performance Accuracy in Detecting Tumor in Liver Using Deep Learning Techniques. J. Ambient Intelligence Humanized Comput. 12, 1–8. doi:10.1007/s12652-020-02107-7
Tanveer, M., Richhariya, B., Khan, R. U., Rashid, A. H., Khanna, P., Prasad, M., et al. (2020). Machine Learning Techniques for the Diagnosis of Alzheimer's Disease. ACM Trans. Multimedia Comput. Commun. Appl. 16 (1s), 1–35. doi:10.1145/3344998
Thavavel, V., and Karthiyayini, M. (2018). Hybrid Feature Selection Framework for Identification of Alzheimer’s Biomarkers. Indian J. Sci. Technol. 11 (22), 1–10. doi:10.17485/ijst/2018/v11i22/123310
Tufail, A. B., Ma, Y.-K., and Zhang, Q.-N. (2020). Binary Classification of Alzheimer's Disease Using sMRI Imaging Modality and Deep Learning. J. Digit Imaging 33 (5), 1073–1090. doi:10.1007/s10278-019-00265-5
Wang, L., and Liu, Z.-P. (2019). Detecting Diagnostic Biomarkers of Alzheimer's Disease by Integrating Gene Expression Data in Six Brain Regions. Front. Genet. 10, 157. doi:10.3389/fgene.2019.00157
Wenk, G. L. (2003). Neuropathologic Changes in Alzheimer's Disease. J. Clin. Psychiatry 64 (Suppl. 9), 7–10.
Keywords: deep learning, Alzheimer’s disease, gene selection, gene expression, molecular bio-markers
Citation: Mahendran N, Vincent PMDR, Srinivasan K and Chang C- (2021) Improving the Classification of Alzheimer’s Disease Using Hybrid Gene Selection Pipeline and Deep Learning. Front. Genet. 12:784814. doi: 10.3389/fgene.2021.784814
Received: 28 September 2021; Accepted: 20 October 2021;
Published: 12 November 2021.
Edited by:
Quan Zou, University of Electronic Science and Technology of China, ChinaReviewed by:
M.A. Khan, HITEC University, PakistanSuresh Manic Kesavan, National University of Science and Technology, Oman
Copyright © 2021 Mahendran, Vincent, Srinivasan and Chang. This is an open-access article distributed under the terms of the Creative Commons Attribution License (CC BY). The use, distribution or reproduction in other forums is permitted, provided the original author(s) and the copyright owner(s) are credited and that the original publication in this journal is cited, in accordance with accepted academic practice. No use, distribution or reproduction is permitted which does not comply with these terms.
*Correspondence: P. M. Durai Raj Vincent, cG12aW5jZW50QHZpdC5hYy5pbg==; Chuan-Yu Chang, Y2h1YW55dUB5dW50ZWNoLmVkdS50dw==