 Yanhong Sun1,2
 Qing Li
- 1Fisheries Research Institute, Wuhan Academy of Agricultural Sciences, Wuhan, China
- 2Wuhan Xianfeng Aquaculture Technology Co., Ltd., Wuhan, China
- 3Key Laboratory of Ecological Impacts of Hydraulic-Projects and Restoration of Aquatic Ecosystem of Ministry of Water Resources, Institute of Hydroecology, Ministry of Water Resources and Chinese Academy of Sciences, Wuhan, China
Certain members of the Actinopterygii class are known to exhibit sexual dimorphism (SD) that results in major phenotypic differences between male and female fishes of a species. One of the most common differences between the two sexes is in body weight, a factor with a high economic value in aquaculture. In this study, we used RNA sequencing (RNA-seq) to study the liver and brain transcriptomes of Ancherythroculter nigrocauda, a fish exhibiting SD. Females attain about fourfold body weight of males at sexual maturity. Sample clustering showed that both sexes were grouped well with their sex phenotypes. In addition, 2,395 and 457 differentially expressed genes (DEGs) were identified in the liver and brain tissues, respectively. The gene ontology (GO) and Kyoto Encyclopedia of Genes and Genomes (KEGG) pathway enrichment analyses predicted the association of PPAR signaling, cytochrome P450, and steroid hormone biosynthesis to the differences in sexual size. In addition, weighted gene co-expression network analyses (WGCNA) were conducted, and the green module was identified to be significantly correlated with sexual size dimorphism (SSD). Altogether, these results improve our understanding of the molecular mechanism underlying SSD in A. nigrocauda.
1 Introduction
Sexual dimorphism (SD) is a common phenomenon exhibited by several members of the fish class Actinopterygii (Mei and Gui, 2015). One of the most common types of SD is sexual size dimorphism (SSD), i.e., one of the sexes has a relatively large body size—a characteristic that has a great economic value for aquaculture (Mei and Gui, 2015). SSD has been reported in more than 20 fishes, including olive flounder (Ryu et al., 2020), Japanese flounder (Yoneda et al., 2007), and Nile tilapia (Beardmore et al., 2001). The size of the female fish exhibiting SSD is evolutionarily linked to fecundity, whereas that of a male displaying SSD is linked to male–male competition (Parker, 1992). Ancherythroculter nigrocauda exhibits female-biased SSD, wherein the female A. nigrocauda grows considerably faster than males. Several studies have attributed this difference in growth between sexes to the influence of sex chromosomes in different species (Lindholm and Breden, 2002; Saether et al., 2007); however, these results lack a common pattern. In addition, increasing evidence supports the function of autosomes in SSD (Mank et al., 2007; Poissant et al., 2008). These discordances imply a complex mechanism governing SSD in fish than that proposed by current models.
A. nigrocauda is an aquaculture fish with high economic importance in China. Its breeding selection in the past decades has successfully fostered its body weight on sexual maturity from about 100 to 500 g (Unpublished data). A sexually mature female can grow to a body weight of about fourfold compared to a sexually mature male. Growth, a polygenic trait, depends on the interaction among environmental, nutritional, and genetic factors in fish (Fu et al., 2019). Fish growth is genetically controlled by the expression of growth hormone/insulin-like growth factor (GH/IGF) core genes that regulate the hypothalamus–pituitary–gonadal (HPG) axis and the subsequent activation of the Jak2/Stat5b pathway via a GH/GHR signal (Li and Lin, 2010; Rotwein, 2012). In zebrafish, Stat5b regulates sexually dimorphic gene expression in the liver (Huang et al., 2018). Although certain studies have been conducted in fishes, it is still difficult to uncover the genetic network regulating SSD (Wang et al., 2018a; Ryu et al., 2020).
The liver is a critical regulator of metabolic homeostasis because it integrates sex hormone signals triggered by alterations in metabolism and physiological state (Toews et al., 2021). Sex hormones control the body’s growth by influencing the release of GH and its activity (Ryu et al., 2020). As an important upstream regulator, the brain regulates the reproductive and somatotropic axes by secreting different neuroendocrine factors. In this study, we used the transcriptome data from liver and brain tissues to explore the genetic network regulating SD in A. nigrocauda. The core differentially expressed genes (DEGs) were identified and their effect on the growth rate was studied. The expression data from different tissues can provide us a better understanding of the function and influence of the liver and brain on SSD.
2 Methods
2.1 Samples Used
In this study, six female and six male fish aged 18 months were collected from the fishing farm in the Institute of Aquaculture, Wuhan Agriculture Academy (114.24 N, 30.34 E). These were reared in the same pond. Their body weights are shown in Table 1; their sex was confirmed by studying the mature gonads. Before sacrifice, all fish were anesthetized with MS222 (Sigma, United States). Six liver and six brain tissues from both sexes (a total of 24 samples) were collected and placed in liquid nitrogen to extract the total RNA.
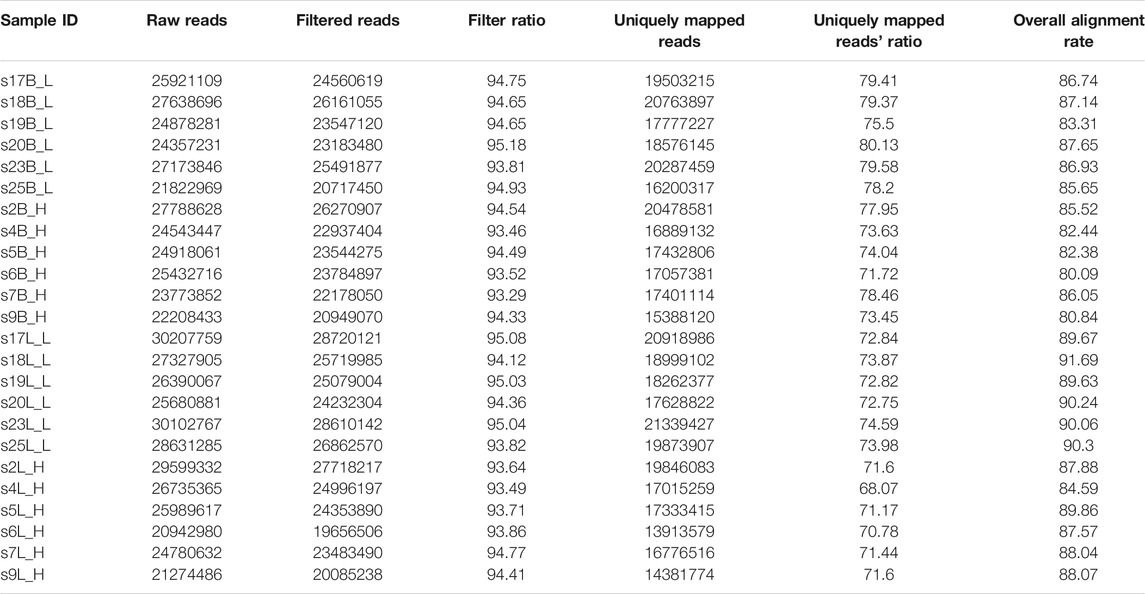
TABLE 1. Summary of sequencing and mapping statistics for 24 samples used in the study.
All fish experiments were performed according to the guidelines established by Wuhan Agriculture Academy. All fish were treated humanely and ethically, and all experimental procedures were approved by the Wuhan Agriculture Academy.
2.2 RNA Extraction and Library Construction
The total RNA from the liver and brain tissues was extracted using the SV Total RNA Isolation System (Promega, United States) according to the manufacturer’s instructions. Next, the RNA concentration and purity were evaluated using NanoDrop 2000 (Thermo Fisher Scientific, United States). Finally, an Agilent Bioanalyzer 2,100 (Agilent Technologies, United States) was used to assess the integrity of RNA, and only samples with RNA integrity number (RIN) greater than 7 were used to construct the libraries.
The libraries were constructed using a TruSeq Stranded mRNA Prep Kit (Illumina, United States) according to the manufacturer’s instructions. The libraries were sequenced by Biomarker Technologies (Beijing, China) on the Illumina NovaSeq platform using the PE150 strategy. The raw sequencing data were deposited in the NCBI Sequence Read Archive (SRA) under accession numbers PRJNA762193.
2.3 Raw Read Filtering, Genome Mapping, and DEG Identification
Trimmomatic v0.3.8 (Bolger et al., 2014) was used to trim the raw reads and remove the adapters and low-quality bases. In addition, leading and trailing sequences with quality lower than 20 were removed. Finally, trimmed and filtered reads shorter than 60 bp were also removed. The filtered reads were mapped to the A. nigrocauda genome (data unpublished) using HISAT v2.0.0 (Kim et al., 2015) with default parameters. The program htseq-count within HTSeq v0.12.4 (Anders et al., 2015) was used to obtain the count as BAM files mapping to each gene.
Differentially expressed genes (DEGs) were identified using a negative binomial distribution model by analyzing the read coverage data included in DESeq2 in the R software (Love et al., 2014). Only genes with twofold expression change and padj < 0.05 were treated as authentic DEGs.
2.4 GO and KEGG Enrichment Analyses
The enrichment analyses were performed using GeneSCF v1.1-p2 (Subhash and Kanduri, 2016). For gene ontology (GO) and Kyoto Encyclopedia of Genes and Genomes (KEGG) enrichment analyses, “−org = zfin” and “−org = dre” were used as parameters. The GO and KEGG databases were updated in July 2020 (http://www.genome.jp/kegg/).
2.5 Gene Co-Expression Network Construction With WGCNA
To find the relationship between the body weight and identified DEGs, the WGCNA was conducted using the WGCNA package v1.70-3 following a previously published procedure (Langfelder and Horvath, 2008). For this analysis, we only used the top 50% of genes with large variance to check the presence of outliers. The expression correlation coefficients of these genes were used as a suitable soft threshold using a scale-free topology model. Next, all gene models with similar expression patterns were identified using the gene cluster dendrogram with dynamic tree cut algorithm (minModuleSize = 30 and mergeCutHeight = 0.25) (Wang et al., 2018a). Finally, we used all genes within each module to assess their correlation with body weight. Modules with a high correlation value and p < 0.05 were considered as body weight-related modules.
3 Results
3.1 RNA-Seq of Liver and Brain Tissues From Female and Male A. nigrocauda
Liver and brain tissues were isolated from six female and six male fish aged 18 months and reared in the same pond. The difference in the body weight between males and females was found to be significant using the t-test (p = 3.618e-06; Supplementary Table S1), proving that A. nigrocauda exhibited SSD. We extracted the mRNA from tissues and used it to construct a library, which was subsequently sequenced on an Illumina NovaSeq platform. The liver and brain tissue samples had 26.47 and 25.03 million read pairs on average, respectively (Table 1). The percentage of clean reads in raw reads ranged from 93.49 to 95.08 in the liver tissue and from 93.29 to 95.18 in the brain tissue (Table 1). After mapping filtered reads to the A. nigrocauda genome, the average overall alignment rate was 88.98 and 84.56 for liver and brain, respectively. Among the mapped reads, 72.12 and 76.78% reads on average were uniquely mapped to the liver and brain, respectively (Table 1).
3.2 Gene Expression Analysis for Liver and Brain Tissues
Based on the reference annotation, we found that 19,080 genes were expressed in at least six samples in the liver. Among these, 865 genes exhibited extremely high expression with a Fragments per Kilobase of transcript per Million (FPKM) greater than 100 in the six samples. The KEGG enrichment analysis showed that these genes were enriched [false discovery rate (FDR) < 0.05] in 42 pathways, including oxidative phosphorylation, PPAR signaling pathway, fatty acid degradation, and other pathways involved primarily in liver metabolism (Supplementary Table S2). Similarly, 26,672 genes were expressed in at least six brain samples, of which 1,507 genes were highly expressed and enriched in 23 KEGG pathways, such as ribosome, spliceosome, and proteasome (Supplementary Table S3).
After quantification of all genes in the two tissues, we performed sample clustering to assess the quality of our RNA-seq data. No anomalies were observed in the Euclidean distance matrix in the liver tissue when compared with samples’ body weight (Figure 1A). However, we found samples from brain tissue were mixed and did not group by their body weight (Figure 1B).
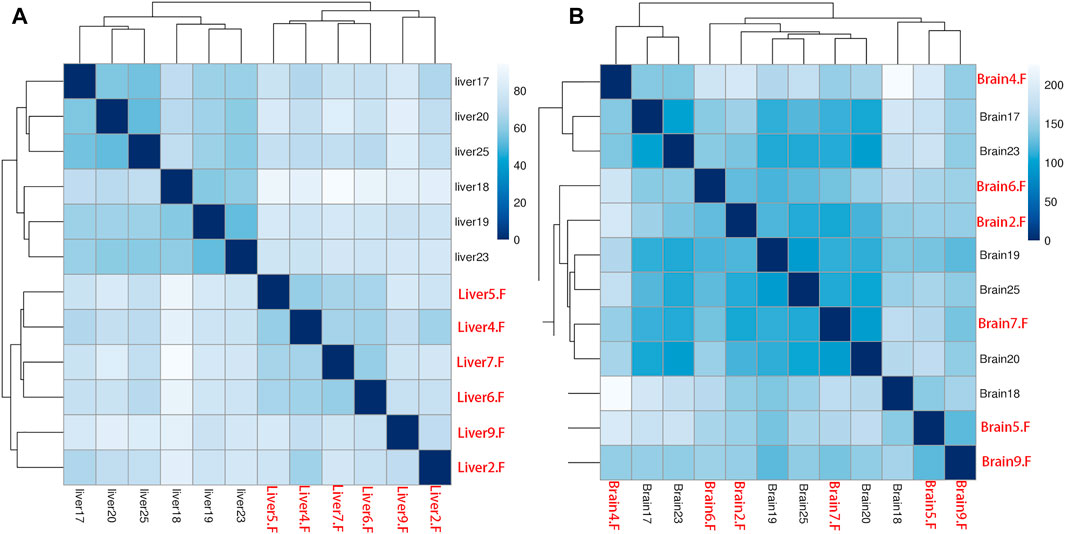
FIGURE 1. Person’s correlation for all samples in liver (A) and brain (B) tissues based on gene expression. All female samples are colored with red and all male samples are colored with black.
3.3 Differential Gene Expression Analysis in the Liver and Brain
To further understand the difference in SD between the liver and brain tissues of the two sexes, a comparative transcriptome analysis was conducted. A total of 2,395 DEGs were detected in the liver tissue, of which 1,401 genes were upregulated and 994 genes were downregulated in the female liver when compared with the male liver (Figure 2A; Supplementary Table S4). Moreover, the top 30 DEGs in the liver tissue were hierarchically clustered to obtain a comprehensive view of all DEGs between the two sexes (Figure 2C). In these DEGs, mhc1uka has been reported to show a much higher expression in testes than in ovary in zebrafish at 21dpf (Yan et al., 2019). And psmb4’s overexpression enhanced the cell growth and viability of breast cancer and ovarian cancer cells (Liu et al., 2016; Wang et al., 2018b). Col6a1, which belongs to Collagen type VI (COL6) family, served an important role in regulating cell proliferation, apoptosis and invasion (Chen et al., 2013). We next used the geneSCF tool to perform the GO enrichment analysis and found that the GO terms related to cholesterol homeostasis were over-represented: cholesterol homeostasis (GO:GO:0042632), triglyceride homeostasis (GO:0070328), and triglyceride metabolism (GO:0006641). In addition, the KEGG enrichment analysis was performed and the top 20 pathways are presented in Figure 3A. Among these, the PPAR signaling pathway and ECM-receptor interaction were on the top of the list.
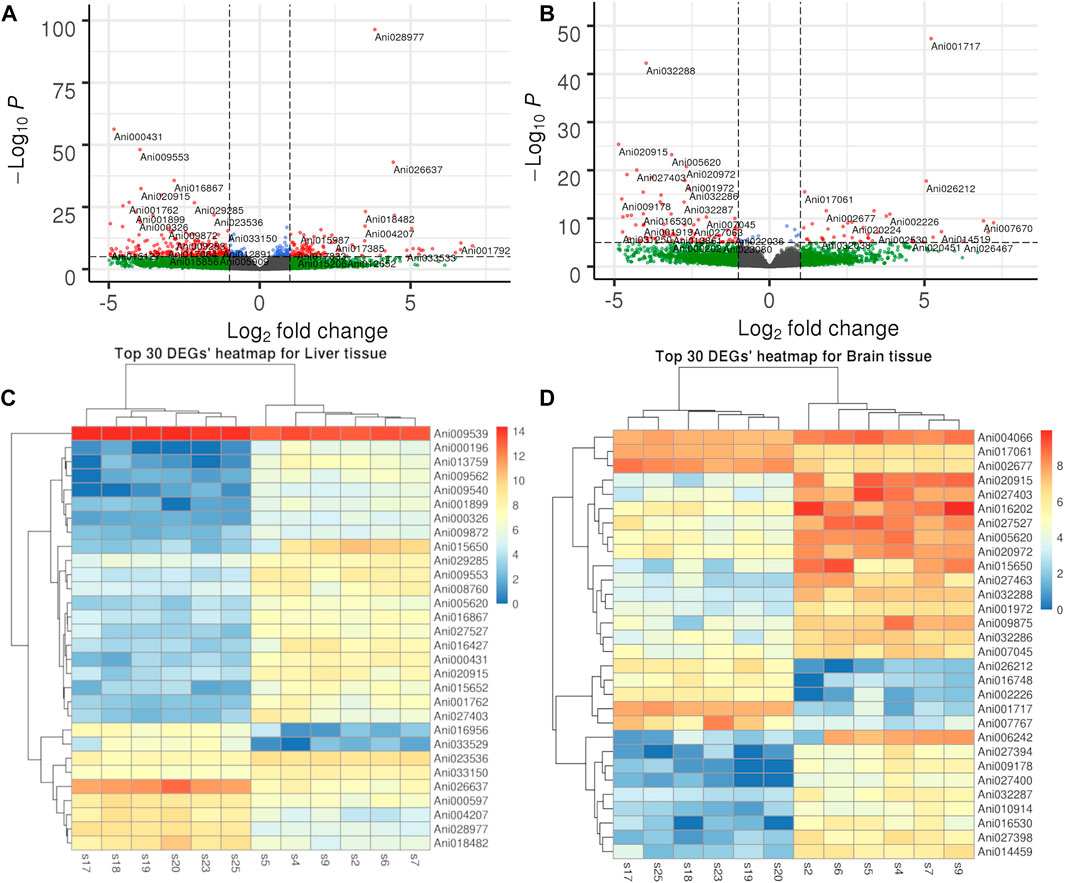
FIGURE 2. Volcano plot and heatmap of DEGs in liver and brain tissues. (A). Volcano plot of DEGs in liver tissue. (B). Volcano plot of DEGs in brain tissue. (C). Hierarchical clustering of top 30 DEG in liver tissue. (D). Hierarchical clustering of top 30 DEG in brain tissue.
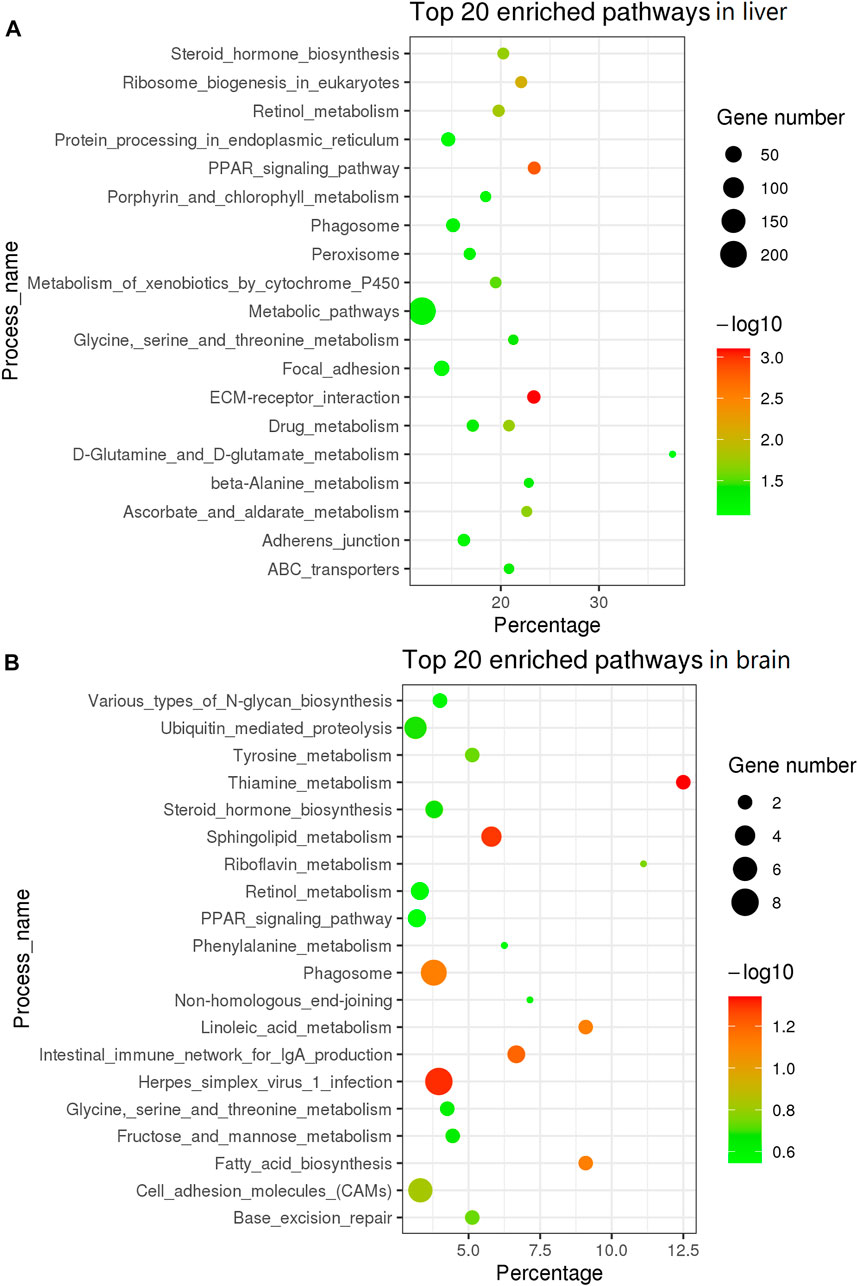
FIGURE 3. KEGG enrichment analysis of top 20 pathway in liver and brain tissue. (A) KEGG in top 20 pathways in liver. (B) KEGG in top 20 pathways in brain tissue.
In the brain tissue, we found only 457 DEGs, of which 293 genes were upregulated and 164 genes were downregulated in the female tissue when compared to the male tissue (Figure 2B; Supplementary Table S5). The top 30 DEGs in the brain tissue were hierarchically clustered and show the same pattern as that in liver tissue (Figure 2D). The KEGG enrichment analysis of these DEGs revealed that they were largely enriched in steroid hormone biosynthesis, PPAR signaling pathway, and cell adhesion molecules (CAMs) (Figure 3B).
We also found 152 DEGs presented in both tissues, among which there are many growth-related genes showed much higher expression level in female samples, such as atriaid (positive regulation of osteoblast proliferation), cetp (triglyceride transport), and pm20d1.1 (amide biosynthetic process). Besides, we also found genes involved in energy supply and oxygen circulation were on the top of enriched DEGs, as a key metabolic organelle, mitochondria is the core for energy supply in cells and therefore is key to cell growth (Ryu et al., 2020). Apart from the evenly distributed protein coding genes, these DEGs showed a totally different pattern that some chromosomes have more DEGs than others. We found the density of DEGs on LG1 and LG20 were much higher than the rest (Table 2). Though DEGs on LG20 were not located in sex-specific region of A. nigrocauda, they were only several megabases away from that region (Sun et al., 2021). For DEGs on LG1, they were not randomly distributed, either. Previous study didn’t find any sex-specific region on LG1, but the DEGs were mostly located in a 5 Mb regions.
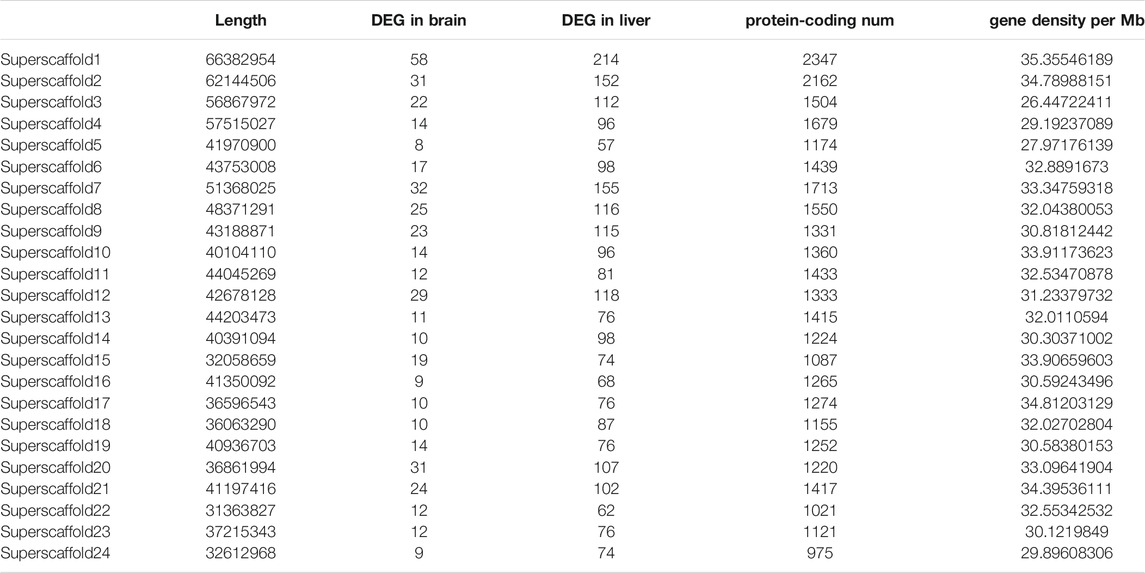
TABLE 2. The uneven distribution of DEGs on each chromosome in brain and liver tissues.
3.4 Construction of Gene Co-expressed Network Using WGCNA
To identify the genetic modules correlating with body weight in the transcriptome data, we used WGCNA to construct a co-expressed gene network using genes whose variances were among the top 50% of all annotated genes. Next, only 16,803 genes were used for subsequent analysis. Based on the power estimation of these genes, a gene cluster dendrogram was constructed with a power value of 16 (Figure 4). Afterward, 10 modules were identified with gene numbers ranging from 31 to 9,935 (Supplementary Table S6). To identify body weight-correlated modules, module–phenotype correlation was conducted, which showed that only the green module exhibited a significant correlation (p = 0.04) (Figure 5).
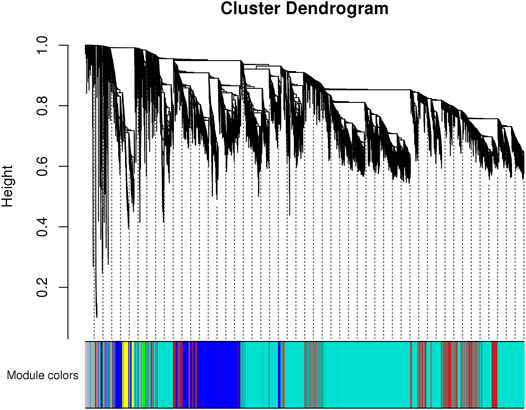
FIGURE 4. The gene cluster dendrogram constructed by all genes’ correlation coefficients. The vertical distance of the line shows the distance between different genes.
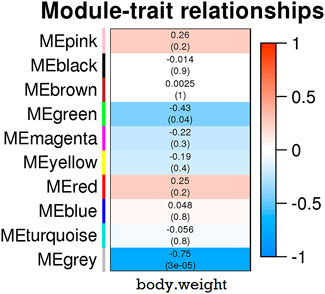
FIGURE 5. The relationship between 10 modules and growth traits in samples. The eigengene in each module was calculated and shown in each row. The color bar indicates correlation value from low (blue) to high (red).
For the KEGG pathway enrichment analysis, 168 genes within green module were significantly enriched in protein processing in the endoplasmic reticulum (dre04141, FDR = 1.74E-12), ribosome biogenesis in eukaryotes (dre03008, FDR = 6.95E-07), and protein export (dre03060, FDR = 8.75E-4). In the GO biological process, these genes were enriched in protein transport (GO:0015031), protein glycosylation (GO:0006486), and other protein metabolic processes (FDR < 0.05).
4 Discussion
The phenomenon of SSD is reported in several fish species and forms the genetic foundation for monosex breeding in aquaculture (Mei and Gui, 2015). The SSD in fish is primarily caused by differences in gene expression, which recently have expanded from the involvement of sex-chromosome to autosomes (Parsch and Ellegren, 2013). However, the genetic mechanism is still unclear in several fish species. We performed a comparative transcriptome analysis in both sexes of A. nigrocauda using liver and brain tissues. According to a previous report, biological replicate for each group is a prerequisite for conducting comparative RNA-seq analysis. In addition, the use of a higher number of replicates results in the identification of more authentic DEGs (McIntyre et al., 2011; Schurch et al., 2016). We found that the majority of transcriptome analyses regarding SSD were based on only two or three replicates in each group (Wang et al., 2018a; Ryu et al., 2020), leading to the loss of numerous authentic DEGs and several false-positive genes (Fang and Cui, 2011). To overcome these disadvantages, we included six samples in each group (Figure 1), which we believed to be the best arrangement in an SSD-related study to date. In addition, sample clustering revealed a distinct expression pattern in different sexes (Figure 1). Furthermore, the high quality of raw sequencing reads and mapping ratio proved the high quality of RNA-seq data (Table 1).
We selected sexually matured A. nigrocauda to study the gene expression patterns in liver and brain tissues. The majority of the previous studies on SSD in other fishes used only one tissue (Huang et al., 2018; Ryu et al., 2020); only a few have studied the expression patterns in different tissues simultaneously (Wang et al., 2018a), providing a definite genetic pattern regulating the body size. The gene expression is tissue-specific, with different tissues showing distinct expression patterns in a single study. Therefore, multi-tissue transcriptome analyses are attracting attention because of their high resolution in deciphering biological or genetic regulation (Fu et al., 2019).
The hypothalamic–pituitary–adrenal (HPA) axis is critical for fish growth and sex-related actions (Toews et al., 2021). The liver greatly affects ontogenesis by integrating diverse endocrine signals that regulate body growth and sexual maturity in fish. In addition, hepatocytes respond to alterations in the metabolism and physiological state. Several hepatic genes regulating these responses are hormone-dependent, which in turn are controlled by factors such as GH and IGF1. Furthermore, other glucocorticoid hormones are known to regulate hepatic gluconeogenesis and glucose availability from the brain and other tissues (Loria et al., 2009). We demonstrated that several DEGs in the liver, such as ghrb, igfbp1b, igfbp6b, and igf2bp2b, belonged to the GH/IGF pathway and exhibited a sex-specific expression pattern. This pattern was the same as that observed in Cynoglossus semilaevis, which also exhibits female-biased SSD (Wang et al., 2018a). In addition to the GH/IGF pathway, its downstream regulated Jak2/Stat5b pathway significantly affects the body weight of fish, too (Rotwein, 2012). For example, Stat5b regulates the male-biased genes in the liver, whereas Stat5a primarily regulates the female-biased gene in the liver (Lamba et al., 2014; Huang et al., 2018). In this study, although stat5b did not show a significant expression pattern in the liver and brain tissues (p = 0.79 and p = 0.99, respectively), stat5a was significantly expressed in the liver (FDR = 0.0279). In addition, both Stat5b and Stat5a regulate SD by controlling the activity of hepatic cytochromes P450 (CYPs) (Lamba et al., 2016). CYPs have been reported to exhibit a sexual dimorphism expression pattern (Xiong et al., 2015). We found cyp2ad3, cyp2p7, cyp2k6, cyp1c1, cyp2k16, and cyp2x7 displayed a substantially higher expression in the female liver than in the male liver. However, the expression of cyp11c1, cyp27b1, cyp3a65, and cyp2k21 weas higher in the male liver than in the female liver.
Numerous neuroendocrine factors that control the reproductive axes are secreted in the brain tissue. We found only 457 DEGs between female and male brains compared to a considerably higher number in the liver. However, this finding was similar to that obtained in C. semilaevis brain and could be attributed to the fact that the crucial stage for feminization or masculinization of the fish brain might begin during the early stage of its development (Wang et al., 2018a). When fishes reach sexual maturity, the brain’s differentiation in both sexes is completed due to exposure to different sex steroid hormones. Previous studies have reported Pomc as a candidate gene for SSD in tilapia (Wan et al., 2021). Its high expression in the female tilapia brain has been associated with the slow growth of the fish (Wan et al., 2021). We found that the expression of Pomc waes considerably higher in the male brain than in the female brain, a pattern same as that observed in tilapia.
WGCNA analysis has been used in many transcriptome studies to found genes or pathways that correlated with specific phenotype (Tao et al., 2018; Huang et al., 2020). In this study, we used WGCNA to find modules associated with sexually size dimorphism and only one module was significantly associated with it. Genes within the module has been reported to contributed to the energy metabolism and protein synthesis (Supplementary Table S6). This pattern is the same as SSD in olive flounder (Ryu et al., 2020) as mitochondria is the key organelle for cell energy supply and protein is the key substance for cell growth.
5 Conclusion
In summary, we used RNA-seq to study the distinct expression pattern of genes in the liver and brain of female-biased A. nigrocauda. The number of DEGs was considerably higher in the liver tissue than in the brain tissue, which could be attributed to the following reasons. First, we used six samples in each group of each tissue; thus, a large number of samples provided a statistically concrete ground for identifying authentic DEGs. Second, the ongoing protein and lipid metabolism in the liver contribute to different growth rates between the sexes at sexual maturity versus the completely differentiated brain exposed to sex steroids. Altogether, our results revealed a transcriptome pattern of liver and brain tissues in fish with SSD. In addition, the WGCNA of two tissues allowed us to study the regulatory network involved in fish growth.
Data Availability Statement
The datasets generated for this study can be found in the NCBI https://www.ncbi.nlm.nih.gov/search/all/?term=PRJNA762193.
Ethics Statement
The animal study was reviewed and approved by the Committee for Animal Experiments of the Fisheries Research Institute, Wuhan Academy of Agricultural Sciences. Written informed consent was obtained from the owners for the participation of their animals in this study.
Author Contributions
QL and GW conceived the project. YS and HW wrote and revised the article. YS, JC, and QY performed the data analysis. PL collected the samples and did the RNA extraction.
Funding
This work was supported by the Technical innovation Project of Hubei Province (Grant No. 2018ABA105).
Conflict of Interest
Authors YS, JC, PL, GW, and QL were employed by the company Wuhan Xianfeng Aquaculture Technology Co., Ltd.
The remaining authors declare that the research was conducted in the absence of any commercial or financial relationships that could be construed as a potential conflict of interest.
Publisher’s Note
All claims expressed in this article are solely those of the authors and do not necessarily represent those of their affiliated organizations, or those of the publisher, the editors and the reviewers. Any product that may be evaluated in this article, or claim that may be made by its manufacturer, is not guaranteed or endorsed by the publisher.
Supplementary Material
The Supplementary Material for this article can be found online at: https://www.frontiersin.org/articles/10.3389/fgene.2021.777581/full#supplementary-material
References
Anders, S., Pyl, P. T., and Huber, W. (2015). HTSeq--a Python Framework to Work with High-Throughput Sequencing Data. Bioinformatics 31 (2), 166–169. doi:10.1093/bioinformatics/btu638
Beardmore, J. A., Mair, G. C., and Lewis, R. I. (2001). Monosex Male Production in Finfish as Exemplified by tilapia: Applications, Problems, and Prospects. Aquaculture 197 (1-4), 283–301. doi:10.1016/b978-0-444-50913-0.50015-1
Bolger, A. M., Lohse, M., and Usadel, B. (2014). Trimmomatic: a Flexible Trimmer for Illumina Sequence Data. Bioinformatics 30 (15), 2114–2120. doi:10.1093/bioinformatics/btu170
Chen, P., Cescon, M., and Bonaldo, P. (2013). Collagen VI in Cancer and its Biological Mechanisms. Trends Mol. Med. 19 (7), 410–417. doi:10.1016/j.molmed.2013.04.001
Fang, Z., and Cui, X. (2011). Design and Validation Issues in RNA-Seq Experiments. Brief. Bioinform. 12 (3), 280–287. doi:10.1093/bib/bbr004
Fu, B., Yu, X., Tong, J., Pang, M., Zhou, Y., Liu, Q., et al. (2019). Comparative Transcriptomic Analysis of Hypothalamus-Pituitary-Liver axis in Bighead Carp (Hypophthalmichthys Nobilis) with Differential Growth Rate. BMC Genomics 20 (1), 328. doi:10.1186/s12864-019-5691-4
Huang, P., Xiong, S., Kang, J., Mei, J., and Gui, J. F. (2018). Stat5b Regulates Sexually Dimorphic Gene Expression in Zebrafish Liver. Front. Physiol. 9, 676. doi:10.3389/fphys.2018.00676
Huang, Z., Ma, A., Yang, S., Liu, X., Zhao, T., Zhang, J., et al. (2020). Transcriptome Analysis and Weighted Gene Co-expression Network Reveals Potential Genes Responses to Heat Stress in Turbot Scophthalmus maximus. Comp. Biochem. Physiol. D: Genomics Proteomics 33, 100632. doi:10.1016/j.cbd.2019.100632
Kim, D., Langmead, B., and Salzberg, S. L. (2015). HISAT: a Fast Spliced Aligner with Low Memory Requirements. Nat. Methods 12 (4), 357–360. doi:10.1038/nmeth.3317
Lamba, V., Ghodke, Y., Guan, W., and Tracy, T. S. (2014). microRNA-34a Is Associated with Expression of Key Hepatic Transcription Factors and Cytochromes P450. Biochem. Biophys. Res. Commun. 445 (2), 404–411. doi:10.1016/j.bbrc.2014.02.024
Lamba, V., Jia, B., and Liang, F. (2016). STAT5A and STAT5B Have Opposite Correlations with Drug Response Gene Expression. Biochem. Biophys. Res. Commun. 479 (2), 117–124. doi:10.1016/j.bbrc.2016.06.011
Langfelder, P., and Horvath, S. (2008). WGCNA: an R Package for Weighted Correlation Network Analysis. BMC Bioinformatics 9, 559. doi:10.1186/1471-2105-9-559
Li, W., and Lin, H. (2010). The Endocrine Regulation Network of Growth Hormone Synthesis and Secretion in Fish: Emphasis on the Signal Integration in Somatotropes. Sci. China Life Sci. 53 (4), 462–470. doi:10.1007/s11427-010-0084-6
Lindholm, A., and Breden, F. (2002). Sex Chromosomes and Sexual Selection in Poeciliid Fishes. Am. Naturalist 160, S214–S224. doi:10.1086/342898
Liu, R., Lu, S., Deng, Y., Yang, S., He, S., Cai, J., et al. (2016). PSMB4 Expression Associates with Epithelial Ovarian Cancer Growth and Poor Prognosis. Arch. Gynecol. Obstet. 293 (6), 1297–1307. doi:10.1007/s00404-015-3904-x
Loria, P., Carulli, L., Bertolotti, M., and Lonardo, A. (2009). Endocrine and Liver Interaction: the Role of Endocrine Pathways in NASH. Nat. Rev. Gastroenterol. Hepatol. 6 (4), 236–247. doi:10.1038/nrgastro.2009.33
Love, M. I., Huber, W., and Anders, S. (2014). Moderated Estimation of Fold Change and Dispersion for RNA-Seq Data with DESeq2. Genome Biol. 15 (12), 550. doi:10.1186/s13059-014-0550-8
Mank, J. E., Hultin-Rosenberg, L., Axelsson, E., and Ellegren, H. (2007). Rapid Evolution of Female-Biased, but Not Male-Biased, Genes Expressed in the Avian Brain. Mol. Biol. Evol. 24 (12), 2698–2706. doi:10.1093/molbev/msm208
McIntyre, L. M., Lopiano, K. K., Morse, A. M., Amin, V., Oberg, A. L., Young, L. J., et al. (2011). RNA-seq: Technical Variability and Sampling. BMC Genomics 12, 293. doi:10.1186/1471-2164-12-293
Mei, J., and Gui, J.-F. (2015). Genetic Basis and Biotechnological Manipulation of Sexual Dimorphism and Sex Determination in Fish. Sci. China Life Sci. 58 (2), 124–136. doi:10.1007/s11427-014-4797-9
Parker, G. A. (1992). The Evolution of Sexual Size Dimorphism in Fish*. J. Fish. Biol. 41, 1–20. doi:10.1111/j.1095-8649.1992.tb03864.x
Parsch, J., and Ellegren, H. (2013). The Evolutionary Causes and Consequences of Sex-Biased Gene Expression. Nat. Rev. Genet. 14 (2), 83–87. doi:10.1038/nrg3376
Poissant, J., Wilson, A. J., Festa-Bianchet, M., Hogg, J. T., and Coltman, D. W. (2008). Quantitative Genetics and Sex-specific Selection on Sexually Dimorphic Traits in Bighorn Sheep. Proc. R. Soc. B. 275 (1635), 623–628. doi:10.1098/rspb.2007.1361
Rotwein, P. (2012). Mapping the Growth Hormone-Stat5b-IGF-I Transcriptional Circuit. Trends Endocrinol. Metab. 23 (4), 186–193. doi:10.1016/j.tem.2012.01.001
Ryu, J.-W., Jung, J., Park, K., Lee, S., Park, I., Kim, W.-J., et al. (2020). Characterization of Sexual Size Dimorphism and Sex-Biased Genes Expression Profile in the Olive Flounder. Mol. Biol. Rep. 47 (10), 8317–8324. doi:10.1007/s11033-020-05843-3
Saether, S. A., Saetre, G. P., Borge, T., Wiley, C., Svedin, N., Andersson, G., et al. (2007). Sex Chromosome-Linked Species Recognition and Evolution of Reproductive Isolation in Flycatchers. Science 318 (5847), 95–97. doi:10.1126/science.1141506
Schurch, N. J., Schofield, P., Gierliński, M., Cole, C., Sherstnev, A., Singh, V., et al. (2016). How many Biological Replicates Are Needed in an RNA-Seq experiment and Which Differential Expression Tool Should You Use? RNA 22 (6), 839–851. doi:10.1261/rna.053959.115
Subhash, S., and Kanduri, C. (2016). GeneSCF: a Real-Time Based Functional Enrichment Tool with Support for Multiple Organisms. BMC Bioinformatics 17, 365. doi:10.1186/s12859-016-1250-z
Sun, Y., Wang, G., Gui, J.-F., Chen, J., Li, P., Zhu, D., et al. (2021). Comparative Genomic Analysis of Different Sexes and Diet-specific Amino Acid Mutation Identification in Ancherythroculter Nigrocauda. Comp. Biochem. Physiol. Part D: Genomics Proteomics 40, 100910. doi:10.1016/j.cbd.2021.100910
Tao, W., Chen, J., Tan, D., Yang, J., Sun, L., Wei, J., et al. (2018). Transcriptome Display during tilapia Sex Determination and Differentiation as Revealed by RNA-Seq Analysis. BMC Genomics 19 (1), 363. doi:10.1186/s12864-018-4756-0
Toews, J. N. C., Hammond, G. L., and Viau, V. (2021). Liver at the Nexus of Rat Postnatal HPA axis Maturation and Sexual Dimorphism. J. Endocrinol. 248 (1), R1–R17. doi:10.1530/joe-20-0286
Wan, Z. Y., Lin, V. C. L., and Hua, Y. G. (2021). Pomc Plays an Important Role in Sexual Size Dimorphism in Tilapia. Mar. Biotechnol. 23, 201–214. doi:10.1007/s10126-020-10015-2
Wang, N., Wang, R., Wang, R., and Chen, S. (2018). Transcriptomics Analysis Revealing Candidate Networks and Genes for the Body Size Sexual Dimorphism of Chinese Tongue Sole (Cynoglossus Semilaevis). Funct. Integr. Genomics 18 (3), 327–339. doi:10.1007/s10142-018-0595-y
Wang, H., He, Z., Xia, L., Zhang, W., Xu, L., Yue, X., et al. (2018). PSMB4 Overexpression Enhances the Cell Growth and Viability of Breast Cancer Cells Leading to a Poor Prognosis. Oncol. Rep. 40 (4), 2343–2352. doi:10.3892/or.2018.6588
Xiong, S., Jing, J., Wu, J., Ma, W., Dawar, F. U., Mei, J., et al. (2015). Characterization and Sexual Dimorphic Expression of Cytochrome P450 Genes in the Hypothalamic-Pituitary-Gonad axis of Yellow Catfish. Gen. Comp. Endocrinol. 216, 90–97. doi:10.1016/j.ygcen.2015.04.015
Yan, Y.-L., Batzel, P., Titus, T., Sydes, J., Desvignes, T., BreMiller, R., et al. (2019). A Hormone that Lost its Receptor: Anti-müllerian Hormone (AMH) in Zebrafish Gonad Development and Sex Determination. Genetics 213 (2), 529–553. doi:10.1534/genetics.119.302365
Keywords: sexual size dimorphism, comparative transcriptomics, tissue-specific expression patterns, RNA-seq, differentially expressed genes, WGCNA
Citation: Sun Y, Wei H, Chen J, Li P, Yang Q, Wang G and Li Q (2021) Tissue-Specific Expression Pattern in Ancherythroculter nigrocauda, a Sexually Size Dimorphic Fish. Front. Genet. 12:777581. doi: 10.3389/fgene.2021.777581
Received: 15 September 2021; Accepted: 12 November 2021;
Published: 08 December 2021.
Edited by:
Beide Fu, Institute of Hydrobiology (CAS), ChinaReviewed by:
Jie Mei, Huazhong Agricultural University, ChinaWenjing Tao, Southwest University, China
Copyright © 2021 Sun, Wei, Chen, Li, Yang, Wang and Li. This is an open-access article distributed under the terms of the Creative Commons Attribution License (CC BY). The use, distribution or reproduction in other forums is permitted, provided the original author(s) and the copyright owner(s) are credited and that the original publication in this journal is cited, in accordance with accepted academic practice. No use, distribution or reproduction is permitted which does not comply with these terms.
*Correspondence: Guiying Wang, NDY5OTI2NjQ4QHFxLmNvbQ==; Qing Li, eGZzY2tqQDE2My5jb20=