
94% of researchers rate our articles as excellent or good
Learn more about the work of our research integrity team to safeguard the quality of each article we publish.
Find out more
ORIGINAL RESEARCH article
Front. Genet., 19 November 2021
Sec. Genomics of Plants and the Phytoecosystem
Volume 12 - 2021 | https://doi.org/10.3389/fgene.2021.767883
This article is part of the Research TopicGenetic Validation and its Role in Crop ImprovementView all 19 articles
 Ann Murithi1,2
 Michael S. Olsen1*
 Daniel B. Kwemoi3
 Ogugo Veronica1
 Berhanu Tadesse Ertiro1
 Suresh L. M.1
 Yoseph Beyene1
 Biswanath Das1
 Boddupalli M. Prasanna1
 Manje Gowda1*
Maize lethal necrosis (MLN) is a viral disease with a devastating effect on maize production. Developing and deploying improved varieties with resistance to the disease is important to effectively control MLN; however, little is known about the causal genes and molecular mechanism(s) underlying MLN resistance. Screening thousands of maize inbred lines revealed KS23-5 and KS23-6 as two of the most promising donors of MLN resistance alleles. KS23-5 and KS23-6 lines were earlier developed at the University of Hawaii, United States, on the basis of a source population constituted using germplasm from Kasetsart University, Thailand. Both linkage mapping and association mapping approaches were used to discover and validate genomic regions associated with MLN resistance. Selective genotyping of resistant and susceptible individuals within large F2 populations coupled with genome-wide association study identified a major-effect QTL (qMLN06_157) on chromosome 6 for MLN disease severity score and area under the disease progress curve values in all three F2 populations involving one of the KS23 lines as a parent. The major-effect QTL (qMLN06_157) is recessively inherited and explained 55%–70% of the phenotypic variation with an approximately 6 Mb confidence interval. Linkage mapping in three F3 populations and three F2 populations involving KS23-5 or KS23-6 as one of the parents confirmed the presence of this major-effect QTL on chromosome 6, demonstrating the efficacy of the KS23 allele at qMLN06.157 in varying populations. This QTL could not be identified in population that was not derived using KS23 lines. Validation of this QTL in six F2 populations with 20 SNPs closely linked with qMLN06.157 was further confirmed its consistent expression across populations and its recessive nature of inheritance. On the basis of the consistent and effective resistance afforded by the KS23 allele at qMLN06.157, the QTL can be used in both marker-assisted forward breeding and marker-assisted backcrossing schemes to improve MLN resistance of breeding populations and key lines for eastern Africa.
Increasing trade and travel coupled with weak phytosanitary systems are accelerating the global spread of devastating crop pests and diseases (McDonald and Stukenbrock, 2016; De Groote et al., 2021). The maize lethal necrosis (MLN) is one such transboundary maize disease that emerged in eastern Africa in 2011 (Mahuku et al., 2015; Prasanna et al., 2020). The disease was first reported in Kenya in 2011 and later spread rapidly to neighboring countries in eastern Africa. MLN results from the synergistic interaction of Maize chlorotic mottle virus (MCMV) with any of the cereal viruses of the Potyviridae family including Sugarcane mosaic virus (SCMV), Wheat streak mosaic virus (WSMV), and Maize dwarf mosaic virus (MDMV) (Mahuku et al., 2015; Prasanna et al., 2020). MLN in eastern Africa was found to be due to synergistic interaction between MCMV and SCMV (Wangai et al., 2012). Maize is affected by MLN at all growth stages, resulting in chlorotic mottling of leaves, severe stunting, and necrosis (Wangai et al., 2012). An MLN survey in Kenya in 2012–2013 reported 26,000 ha of maize succumbed to MLN and about 95% of commercially available maize varieties were susceptible (Semagn et al., 2015; De Groote, et al., 2016). Subsequently, a community survey in 2013 done by De Groote et al. (2016) to assess the impact of MLN in Kenya reported a loss of 0.5 million tons of maize production, valued at US$180 million. The disease was exacerbated because of practices such as monocropping, besides lack of resistant maize varieties, and complicated nature of MLN spread and development (Beyene et al., 2017). Management and control of MLN can be achieved through effective integration of host plant resistance, vector control, and cultural practices (Prasanna et al., 2020). A review by Marenya et al. (2018) showed that, although improving agronomic practices through maize-legume rotation would be a useful approach for MLN control, application of such a method may not be feasible over large geographic areas in eastern Africa. Marenya et al. (2018) highlighted the importance of using MLN tolerant maize varieties and estimated the benefits to the tune of US$245–756 million and US$195–675 million in Ethiopia and Kenya, respectively.
Intensive evaluation of elite global maize germplasm (CIMMYT elite breeding panels, USDA virus-resistant line collection, and maize landrace accessions from CIMMYT gene bank) during 2013–2015 revealed very few sources of resistance to MLN and MCMV, with most of the germplasm showing moderate to high susceptibility (Semagn et al., 2015; Nyaga et al., 2020; Prasanna et al., 2020). Therefore, the identification of genetically diverse resistance sources and introgression of resistance into elite maize lines is considered as a high priority for maize breeding program in Africa. Understanding the nature of resistance and the genomic regions associated with MLN resistance is important for accelerating the transfer of resistance into diverse genetic backgrounds (Gowda et al., 2015, 2018). Linkage mapping and genome-wide association study (GWAS) are two major mapping strategies used for dissection of genetic architecture of traits (Holland, 2007). Earlier efforts through GWAS led to the mapping and localization of genomic regions associated with MLN resistance; these genomic regions with major and minor effects were spread across several chromosomes (Gowda et al., 2015; Nyaga et al., 2020).
Selective genotyping (SG) (Saunak et al., 2009), a strategy to genotype only individuals with extreme phenotypic values, is a useful approach for managing genotyping costs of a QTL discovery project. In simulation studies, Sun et al. (2010) suggested that detection power of large-effect QTL (>10% of trait variation) is high even when genotyping tails as small as 5% of the population. SG was initially proposed to increase the power of detecting rare alleles with large effects. This approach has been applied to identify associations between quantitative traits and genetic markers in human genetic studies including attention-deficit hyperactivity disorder (Cornish et al., 2005) and body mass index (Herbert et al., 2006), and in plants for traits such as sugarcane orange rust (McCord et al., 2019). Using a SG strategy, Uemoto et al. (2011) identified 32 loci associated with oleic acid (C18:1) in the intramuscular fat of the trapezius muscles in Japanese black cattle. Barnett et al. (2013) extended the extreme case control methods to identify rare variants in sequence-based association studies.
Results from the evaluation of thousands of maize inbred lines against MLN under artificial inoculation at the CIMMYT-managed MLN Screening Facility at KALRO-Naivasha, Kenya, identified extremely few lines with MLN resistance (Prasanna et al., 2020). Two of the most promising sources of MLN resistance identified were KS23-5 and KS23-6, originating from the University of Hawaii, United States, on the basis of source germplasm from the Kasetsart University, Thailand. The KS23 lines were identified as sources of MCMV resistance in Hawaii (Brewbaker, 2009) and added to a diverse collection of virus resistance lines at the Ohio State University, United States (Jones et al., 2018). The two KS23 lines developed only mild MLN and MCMV symptoms late into disease rating period under both field and screenhouse conditions at the MLN Screening Facility in Naivasha, Kenya (Mahuku et al., 2015).
The aim of this study was to identify genomic region(s) associated with MLN resistance within the KS23 genetic background and to validate these genomic regions in diverse bi-parental populations. The specific objectives were 1) to identify QTL associated with MLN resistance in five F2 populations and three F3 populations involving KS23 lines as donor parents and 2) to validate QTL in independent F2 populations involving KS23 lines as resistant parents. To accomplish these objectives, two sets of populations were developed on the basis of KS23 lines, and the two QTL mapping strategies—linkage mapping and GWAS—were applied to map and characterize the genomic regions associated with MLN resistance. The identified KS23 alleles that confer MLN resistance were validated using F2:3 populations.
Maize inbred lines KS23-5 and KS23-6 (Kaeppler et al., 1998; Brewbaker, 2009) were obtained from the North Central Germplasm Introduction Station, United States, and maintained at CIMMYT. Five bi-parental F2 populations were used for SG: SG1 (KS23-5 x CZL00025), SG2 (KS23-5 x CML545), SG3 (KS23-6 x CML539), SG4 (CML494 x CZL068), and SG5 (DTP-F46 x CML442). Populations 4 and 5 involved CIMMYT lines with moderate resistance to MLN (CML494 and DTP-F46). Inbred lines were crossed, and their F1 self-pollinated to generate F2 seed during 2014. In the 2015 main season, over 2,500 F2 individuals across all populations were planted at the MLN Screening Facility at Naivasha, Kenya. Each individual F2 plant was tagged, and tissue sampled prior to inoculation with MLN. Individual plants that showed any symptoms of stress or disease prior to inoculation were excluded from the trial to prevent confounding effects in identification of the susceptible tail of each population. Inoculated plants were rated at five successive time points and 10% of individuals within each population which succumbed earliest and 10% which exhibited strong resistance were selected for genotyping.
Three independent F3 bi-parental QTL mapping (QM) populations involving KS23 lines were screened and evaluated under MLN artificial inoculation at MLN Screening Facility, Naivasha, Kenya. QM1 (CML543*2/CML444:DH5 x KS23-5) comprised 150 F3 families, QM2 (CML543*2/CML444:DH6 X KS23-6) comprised 138 F3 families, and QM3 (CML543 x KS523-5) comprised 108 F3 families. The three populations were evaluated under MLN artificial inoculation in 3-m plots for two seasons in 2016 and 2017 in an alpha lattice experimental design, with two replications per entry. Standard agronomic management practices were followed.
QTL validation populations (VPs) were generated to evaluate the effect of the KS23 allele across various genetic backgrounds. Six bi-parental populations were developed in 2016: VP1 (KS23-6 x CML5458), VP2 (KS23-6 x CML539), VP3 (KS23-6 x CKDHL0186), VP4 (KS23-6 x CKDHL0221), VP5 (KS23-6 x CML 442), and VP6 (KS23-6 x CML537). F2 plants from each population were genotyped using 20 SNP markers, within or flanking the MLN-resistant QTL region, spanning a 56-cm interval position 155–159 Mb on chromosome 6. SNP genotyping was performed at Corteva, Johnston, Iowa, United States; F2 plants that had no recombination events across the target interval were self-pollinated, and F3 ears were classified as homozygous for the KS23 allele, homozygous for the alternate allele, or heterozygous. At least 90 individuals from each population (30 ears selected for each marker class) were evaluated in 2017. The trial was evaluated in an alpha lattice incomplete block design with two replicates per entry at the MLN Screening Facility, Naivasha, for one season.
The detailed protocol for MLN artificial inoculation was explained in earlier publications (Gowda et al., 2015, 2018; Nyaga et al., 2020; Awata et al., 2020; Awata et al., 2021). In brief, artificial inoculation of the materials in all the field trials was done following the standard protocols developed by CIMMYT, as below. Inoculum for each virus type, MCMV and SCMV, were prepared separately. Preparation of the inoculant began with growing of susceptible maize plants in pots in two separate greenhouses, one for MCMV and the other for SCMV. Plants were infected with each of the viruses, previously isolated from infected plants, respectively. Identified symptomatic leaves from infected plants were harvested and a diagnostic assay, enzyme-linked immunosorbent assay was conducted in the MLN Screening Facility laboratory at Naivasha to ensure the purity of the viruses. Infected leaves were harvested, weighed (4.8 kg of MCMV and 1.2 kg of SCMV) and chopped separately. Leaves were homogenized in cold 0.1 M potassium phosphate buffer at pH 7.0 and sieved to remove plant debris. Extracted MCMV and SCMV homogenate was mixed in a large mixing tank at a ratio of 1:4 (MCMV: SCMV) and Celite (an abrasive) added at 1 g/L. Inoculation of the test materials was done at the V4-6 stage using a motorized backpack mist blower (Solo 423 Mist Blower, 12 L capacity), and a repeat of the inoculation was performed after 1 week. Inoculated plots were rated for MLN severity using a scale of 1–9, where 1 = no MLN symptoms, 3 = fine chlorotic streaks on new/emerging leaves, 5 = severe chlorotic mottling throughout plant, 7 = excessive chlorotic mottling and leaf necrosis or presence of “dead heart” symptoms, and 9 = complete plant necrosis. Disease severity (DS) was taken beginning 3 weeks after the second inoculation and at 7-day intervals thereafter. Five ratings were taken for the SG experiment, and four ratings were taken for the F2:3 VPs. After analyzing DS ratings, we selected the third score (40 days after inoculation) for further analysis because of its higher heritability estimate and full expression of disease symptoms. Area under the disease progress curve (AUDPC) was calculated for each plot to provide a measure of the progression of MLN severity across time. AUDPC data were calculated by using the formula
F2 individuals with extreme MLN responses from each of the five SG populations were selected and genotyped using DArTSeq at Canberra, Australia. Approximately 27,000 SNPs were used to perform a whole genome scan to detect genomic variations that signal association with MLN resistance. Genotypic data from ∼27,000 SNP markers were filtered to generate ∼20,000 SNPs with < 20% missing genotypes and minor and maximum allele frequency of >1% filtering criteria was used on TASSEL ver. 5.0. Phenotypic values for MLN_DS and AUDPC were used for the analysis. DS scores of two populations without the KS23 background were also included in the GWAS analysis.
TASSEL ver. 5.0 was used to run GWAS analysis (Bradbury et al., 2007). To detect genomic variation underlying the observed responses in terms of MLN_DS and AUDPC values, a MLM analysis combining kinship and population structure as covariates was performed. The analysis was done by making two groups—the first three F2 populations having KS23-5 or KS23-6 as one of the parents, and other group solely based on white maize germplasm (non-KS23) developed at CIMMYT. Detailed information of population structure was described using the first three PCs using the EIGSTRAT method described by Price et al. (2006). The pattern generated from the quantile-quantile plot of the model, and at which point the observed F test deviated from the expected F test statistics, was used to determine the p value threshold (p < 5 × 10⁻⁷). All the significant SNPs were simultaneously fitted into a linear model to obtain R2adj, to determine how much the detected SNP contributed to the total phenotypic variance. The BP position of the significantly associated SNPs was used to perform BLAST searches against the maize B73 reference genome, RefGen_v2 (http://acdstagging.org/v2/genes.php).
Each crop season in which MLN evaluation was undertaken was treated as an individual environment. Analysis of variance (ANOVA) was done using multiple environments traits analysis package incorporated in R software (META-R; Gregorio et al., 2015) that integrates both fixed and random factors. Variance components (σ2G, σ2GxE, σ2e) for individual and combined environments were estimated. Correlation between trait and environment and summary statistics (means, SE, range, LSD, and CV) were also generated using standard procedures implemented in META-R. Broad sense heritability (H2) was calculated as the ratio of genotypic variance (δ2G) to the phenotypic variance. Best linear unbiased predictions were also obtained by using location and the reps as fixed effects and genotype and incomplete block as random effects.
The three F3 bi-parental QM populations were genotyped with 447 SNP markers spaced across the genome using Kompetitive Allele Specific PCR (KASP) genotyping systems of LGC Company (Semagn et al., 2013). Five F2 populations both tails were genotyped with Diversity Array Technology Pty Ltd (DArT). Genetic maps for the five F2 populations were also made in same way as done for the F3 populations. Markers with duplicate genotypes, monomorphic markers, and those with >10% missing genotypes were excluded from the analyses. QTL IciMapping was used to remove the highly correlated SNPs, resulting in retention of 360, 361, 360, 781, 770, 750, 780, and 781 high-quality SNPs in QM1, QM2, QM3, SG1, SG2, SG3, SG4, and SG5, respectively. These SNPs were used to construct linkage maps using the MAP function, by selecting the most significant markers using stepwise regression. Linkage maps for each population were constructed using IciMapping V 4.0 with Kosambi method for map distance calculation, logarithm of odds (LOD) score set at threshold of 3.0, and maximum distance of 30 cm between two loci to declare linkage between two markers. MLN_DS and AUDPC scores generated for each population were used to detect QTL on the basis of Inclusive Composite Mapping (ICIM) implemented in the software. The step of ICIM was set to 1 cm, and LOD threshold of 3.0 was used to declare putative QTL. Both additive and dominance effects of each QTL were estimated, and the favorable allele-contributing parent was identified on the basis of the sign of additive effect of each QTL. Phenotypic variation explained by individual QTL and total variation explained by the QTLs were estimated. QTL naming was done with letter “q” indicating QTL, followed by abbreviation of trait name, the chromosome number, and approximate marker position in Mb along the chromosome using the B73 v2 reference physical map.
The response of both resistant and susceptible parents used in development of five F2 populations were clearly visible in the field (Supplementary Table S1). Among the SG populations, those involving KS23 sources skewed more toward susceptibility possibly due to recessive inheritance of the resistance in these F2 populations, whereas the two non-KS23 populations showed normally distributed phenotypic data for both MLN_DS and AUDPC values (Figure 1). The distribution of MLN_DS within each SG population ranged from 2 to 9 with population mean values ranging from 4.8 in SG1 to 7.0 in SG3 (Table 1).
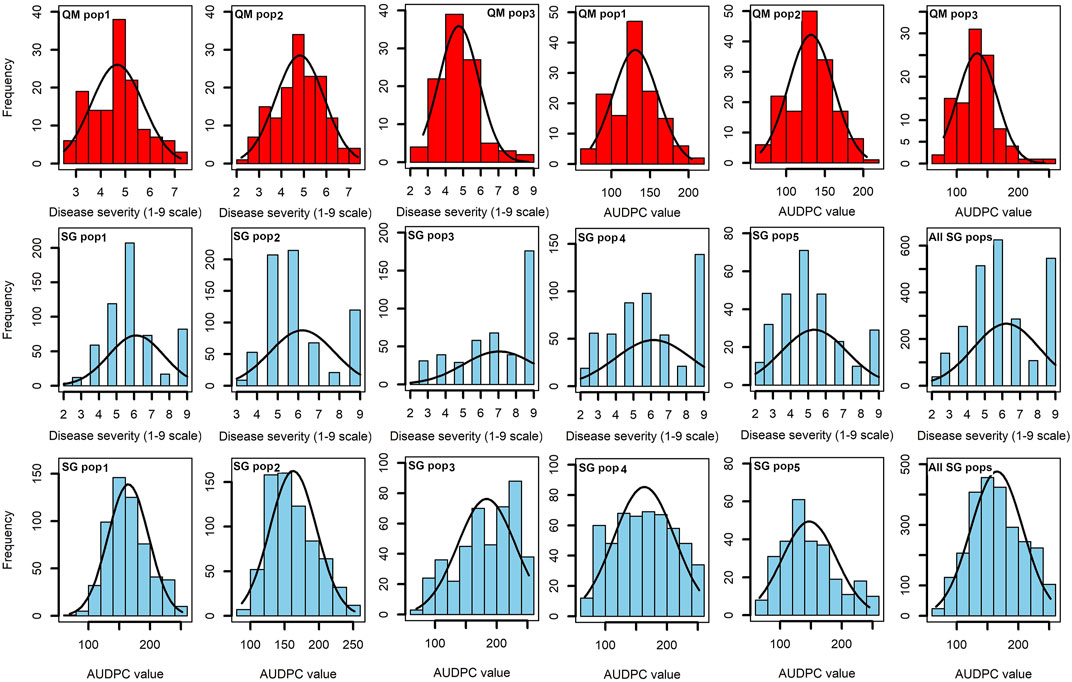
FIGURE 1. Phenotypic distribution of MLN disease severity (on a scale of 1–9) and AUDPC values in three QM populations (in red) and five SG populations (in blue).

TABLE 1. MLN disease severity and descriptive statistics of the SG populations under artificial inoculation at the MLN Screening Facility, Naivasha, Kenya.
The three QM populations each showed normal distribution of phenotypic data for MLN_DS and AUDPC values (Figure 1). The MLN_DS values ranged from 2.5 to 7.24, from 2.2 to 7.4, and from 2.73 to 8.70 with the mean of 4.67, 4.82, and 4.76 in QM1, QM2, and QM3, respectively. AUDPC values ranged from 72 to 204, from 67 to 205, and from 78 to 242 with an average of 131, 132, and 133 in QM1, QM2, and QM3, respectively. Analyses of variance in each of the QM populations revealed significant (p < 0.01) genotypic variance and genotype × environment interaction variances for both MLN_DS and AUDPC values (Table 2). The heritability estimates were moderate to high with 0.66, 0.78, and 0.69 for MLN_DS and with 0.71, 0.80, and 0.73 for AUDPC values in QM1, QM2, and QM3, respectively.
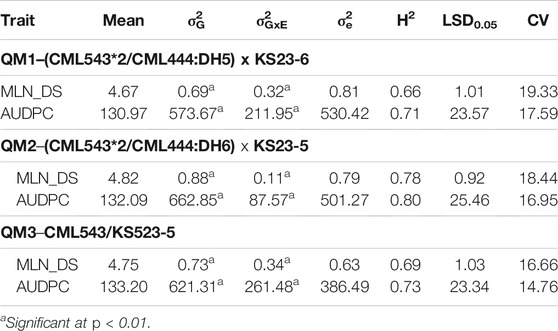
TABLE 2. Means, variance, and heritability estimates for MLN resistance in the three F3 populations used for linkage mapping.
For each F2 and F3 populations, linkage map, the number of progenies or families, markers, map lengths, and average genetic distances between the markers for each biparental population are presented in Supplementary Table S1. Major-effect QTL was identified in all the five SG populations (Table 3; Figure 2). From SG1, two major-effect QTLs were identified on chromosome 6 with LOD scores of 60.6 and 11.8, respectively, explaining >55% of the phenotypic variance for MLN_DS. These QTL were also detected for AUDPC values. In SG2, among the three QTL detected for MLN_DS, the QTL on chromosome 6 explained up to 58% of the total variation and was also detected for AUDPC values. For SG3, three and eight QTL were detected, which together explained 86.8% and 90.7% of the total variation for MLN_DS and AUDPC values, respectively. The major QTL (qMLN6-155) where favorable alleles are contributed by resistant parent KS23-6 individually explained >55% of variation for both MLN_DS and AUDPC values. The other two SG populations that are lacking KS23 parents detected completely different QTL on chromosomes 3 and 6. A major QTL was detected consistently for both MLN_DS and AUDPC values on chromosome 3 (qMLN3-142), which explained >16% of total variation in SG4. In SG5, minor effect QTL were identified in different genomic regions compared to those of detected in the KS23-based populations. Comparison across populations revealed one common genomic region on chromosome 6, between 150 and 160 Mb, with favorable alleles contributed either by KS23-5 and KS23-6.
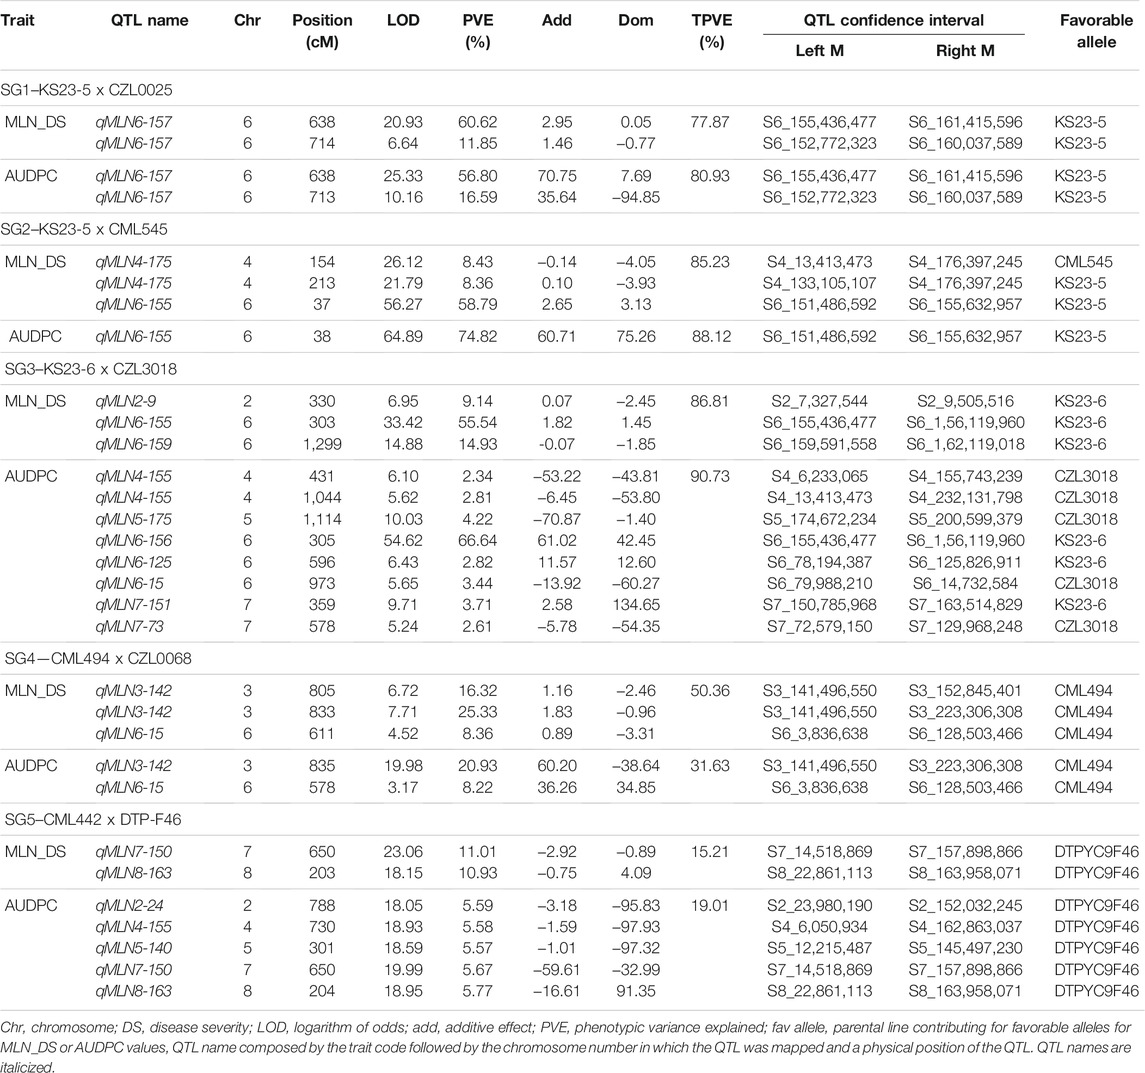
TABLE 3. QTL associated with MLN disease severity, and AUDPC value in five selective genotyping (SG) F2 populations.
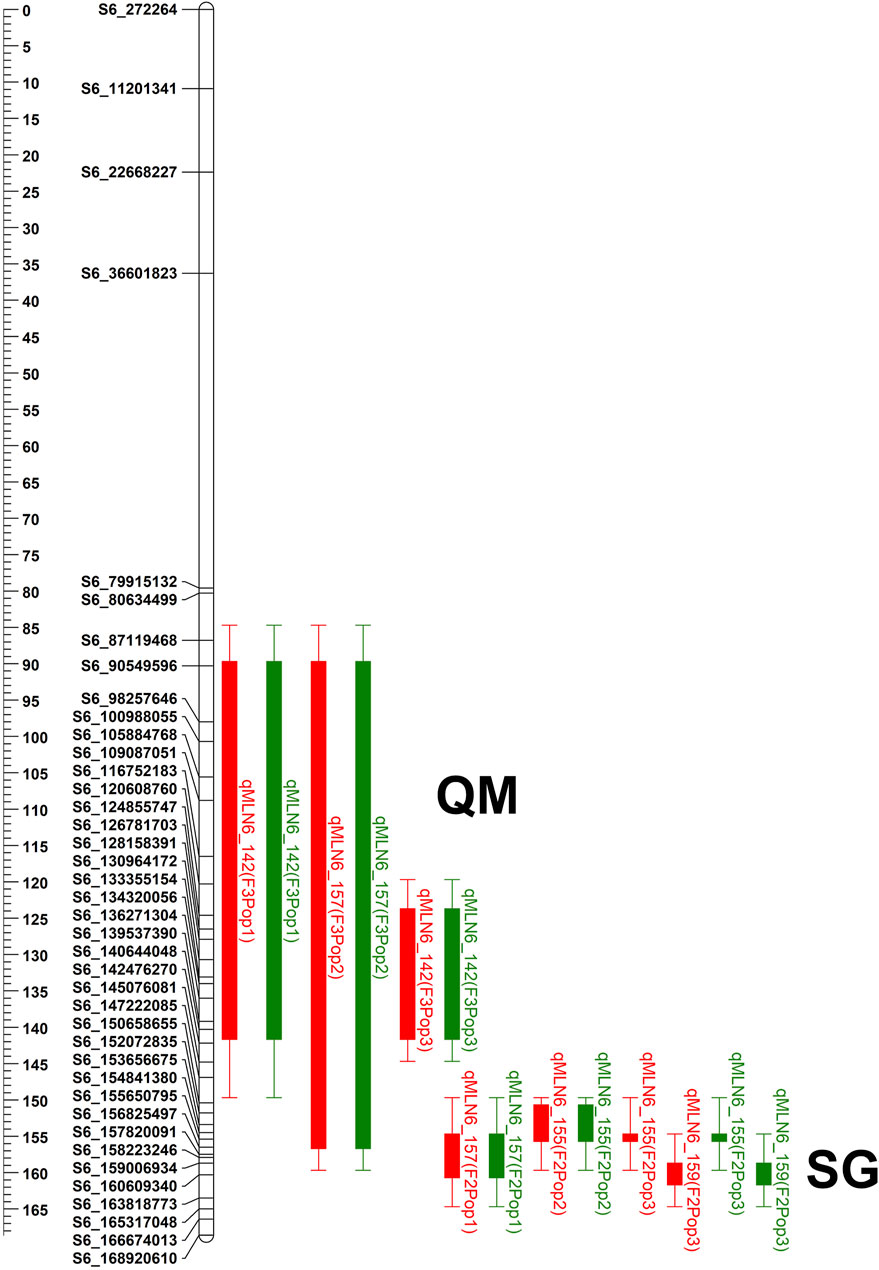
FIGURE 2. The physical positions of the QTL detected on chromosome 6 in all three F3 QTL mapping (QM) populations and three F2 selective genotyping (SG) populations. QTL bar with red color represents for MLN_DS and green bar represents QTL for AUDPC value. QTL name was composed by the trait code followed by the chromosome number in which the QTL was mapped and a physical position of the QTL.
For SG1, a major QTL (qMLN6-157) on chromosome 6 with a LOD score of 20.9 and explaining 60.6% of the phenotypic variation was significantly associated with marker S6_155,436,477 (Figure 3; Table 3). In SG1, both MLN_DS and AUDPC scores for heterozygotes were like those of individuals with two alleles from susceptible parent CZL0025 (Figure 3). In SG2, a major-effect QTL qMLN-155 that was flanked by two SNPs S6_151,486,592 and S6_155,632,957 detected on chromosome 6 was identified with LOD scores of about 50 that explained >60% of the phenotypic variation (Figure 3; Table 3). For this QTL, both MLN_DS and AUDPC scores for individuals with two alleles from CML545 were similar as of heterozygotes skewed toward susceptibility (Figure 3; Table 3). Similarly, also in SG3 for the major QTL on chromosome 6, we observed that the score of MLN_DS and AUDPC values for all heterozygotes was skewed toward susceptibility and was similar to the alleles contributed from CZL3018 (Figure 3). For SG4, a QTL on chromosome 3, centered on marker S3_141,496,550 with a LOD score of about 7, explained >20% of the phenotypic variation (Figure 3). For this population, both MLN_DS and AUDPC scores for individuals with either homozygous dominant or homozygous recessive were intermediate to those of the parents (Figure 3). In SG5, all the identified QTL are associated with the resistant parent DTPYC9F46 (Table 3).
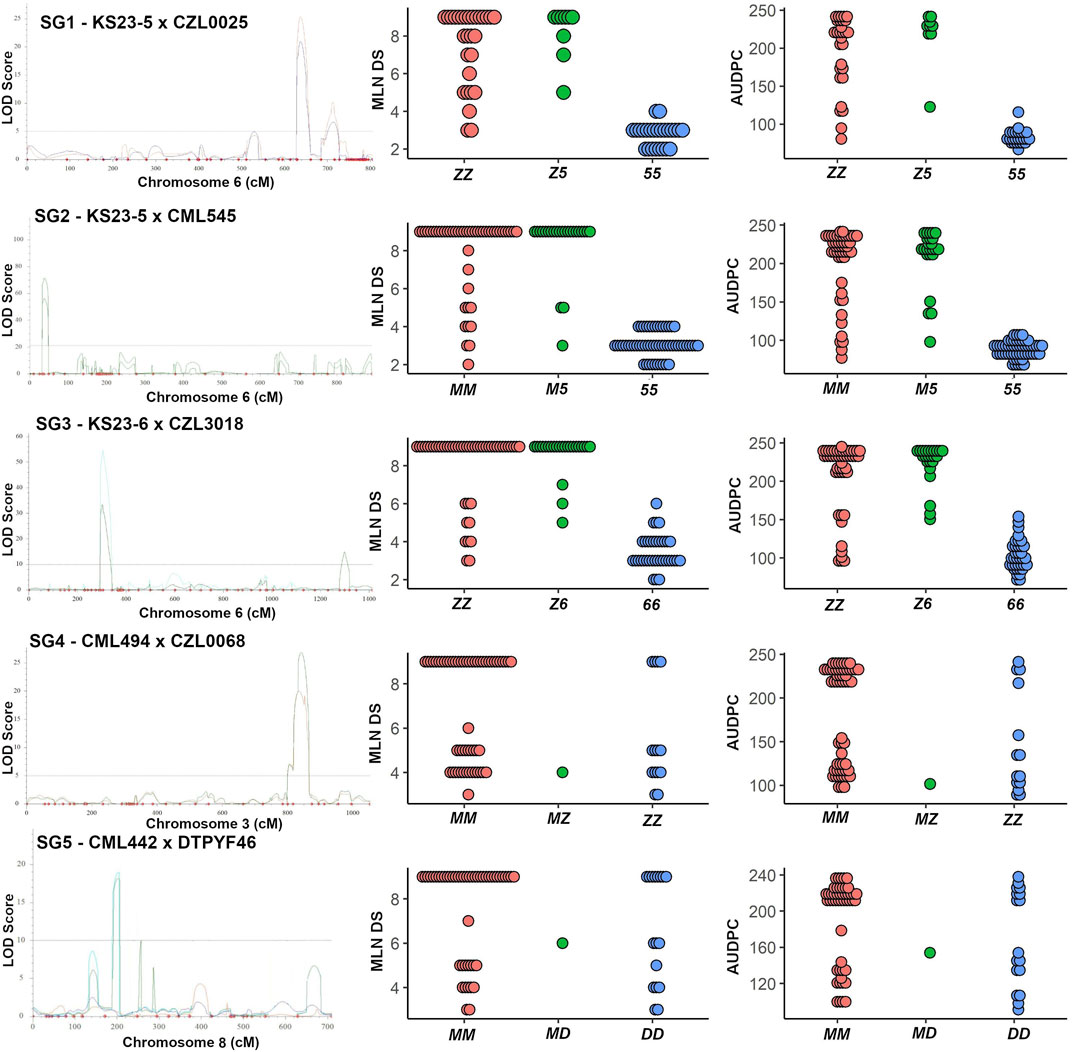
FIGURE 3. Genomic regions influencing MLN resistance in three KS23 derived populations and non-KS23–based populations. A logarithm of odds (LOD) scan showing the major QTL identified on chromosome 6 (for first three KS23-based populations) and a dot plot for the closest marker for MLN_DS and AUDPC values are shown. Similarly, a LOD scan showing the major QTL identified on chromosome 3 and 8 (SG4 and SG5) and a dot plot for the closest markers are shown. In SG1, ZZ and 55 correspond to alleles from parent CZL0025 and KS23-5, respectively. Similarly, in SG2, MM and 55 correspond to alleles from CML545 and KS23-5; in SG3, ZZ and 66 correspond to CZL3018 and KS23-6; in SG4, MM and ZZ correspond to alleles from CML494 and CZL0068; and in SG5, MM and DD correspond to alleles contributed from CML442 and DTPYF46, respectively.
For QM1, linkage analysis detected five QTLs for MLN_DS on chromosomes 6, 7, 9, and 10 with each QTL explaining 8.30%–30.40% of phenotypic variance and together explaining 65.49% of total phenotypic variance (Table 4). Four QTLs were identified for AUDPC value in the same populations on chromosomes 1, 6, 7, and 8 with each QTL explaining 3.42%–46.94% of phenotypic variance and together explaining 63.23% of total variation. One major-effect QTL on chromosome 6 (qMLN6-142) and another minor effect QTL on chromosome 7 (qMLN7-6) were consistent across traits. In QM2, three QTLs were detected on chromosome 6 that individually explained 5.83%–23.68% of phenotypic variance and together explaining 61.92% of total variance for MLN_DS. For AUDPC values, three QTLs detected on chromosome 6 together explained 61.03% of total phenotypic variance, and same QTLs were also detected for MLN_DS except one QTL qMLN6-125. In QM3, three QTLs were detected for MLN_DS, and the same QTLs were also detected for AUDPC values. These QTL individually explained 8.17%–15.86% of phenotypic variance for MLN_DS and 7.60%–13.44% of phenotypic variance for AUDPC values. Whole genome scan for MLN resistance across all the populations revealed a constant peak with a high LOD score in chromosome 6. Although the QTL was identical in all the populations, the QTL intervals and markers varied between populations (Figure 2; Table 4).
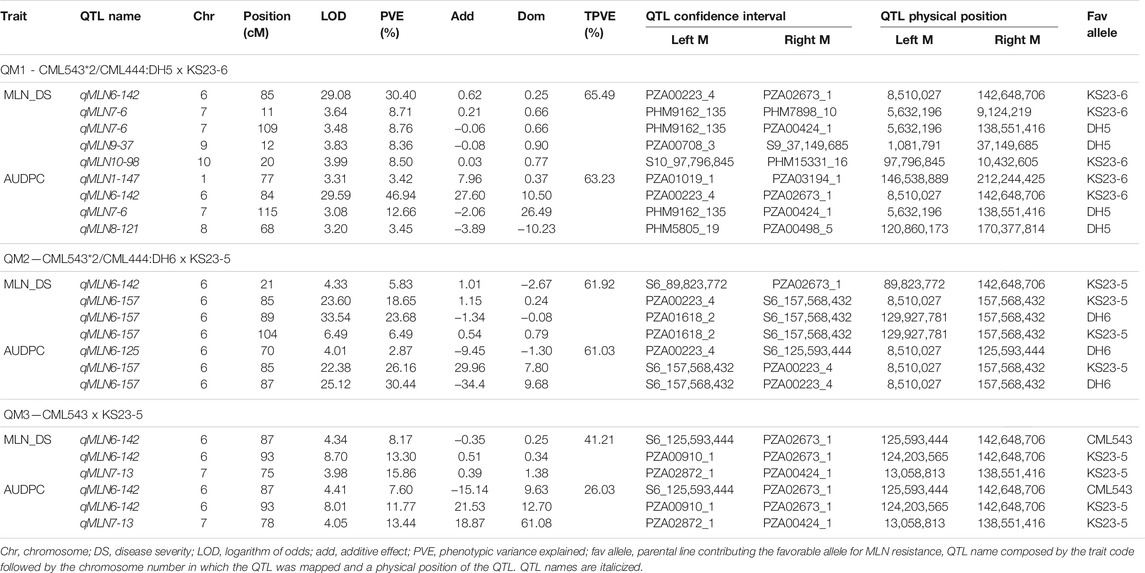
TABLE 4. QTLs identified for MLN disease severity and AUDPC values, their physical positions, and genetic effects in three F3 QTL mapping (QM) populations.
The QTL, found at the interval flanked by markers PZA02673_1, PZA00223_4, and PZA01618_2, was located between bins 6.05 and 6.06, at positions between 85 and 156 Mb on B73 reference genome v2 (Table 4). In QM1 and QM2, these SNPs were detected at the LOD above 23, where a threshold of 3 was used to declare significant QTL. Whereas in QM3, of the three SNPs, PZA02673 was detected at threshold above 3; all hits lower compared to the first two populations. PZA00223_4 was detected in QM1 and QM2, PZA01618_2 was only detected in QM2, whereas PZA02673_1 was detected in QM1 and in QM3. This indicate that favorable alleles of PZA02673_1 and PZA 01618_2 are originated from the parent KS23-5. SNP S6_156,386,857 was identified in QM1 at a LOD score of 31.03 only at the late stage of MLN_DS (data not shown), whereas S6_157,568,432 was detected in QM2 at for both MLN_DS and AUDPC values with a LOD score above 20. The QTL was constantly detected across all the populations on chromosome 6 (Table 4). Similarly, among all the populations, the MLN-resistant QTL detected in QM1 explained the highest proportion of phenotypic variance followed by QM2 (Table 4).
To delimit the physical position of the MLN-resistant QTL, we again used Maize GDB to elucidate the position of the flanking markers against maize B73 reference genome v.2 (Figure 2). All the SNPs across the intervals spanned large chromosomal intervals ranging between 25 and 30 Mb. For example, the QTL qMLN6_157 detected in QM2 is ranged from 129 to 157.5Mb, and same QTL was again detected in SG2 at 151–155 Mb with reduced confidence interval. The physical position indicated by SNPs S6_157,568,432 and S6_156,386,857 points to the location of the MLN-resistant QTL in chromosome 6 (Figure 2). This position coincided with the positions of the other flanking markers, especially PZA0022_4, which was found between S6_156,461,452 and S6_157,833,157 bps on maize B73 reference genome.
Using the eigenstate values generated in TASSEL, a clear population structure was identified in all the groupings using the first three PCs (Figure 4). Clustering using the neighbor-joining method performed using TASSEL revealed five clusters representing each of the populations used (Figure 4). GWAS results for MLN_DS and AUDPC confirmed the major QTL for MLN resistance on chromosome 6. Manhattan plots from the analysis identified a highly significant genomic region on chromosome 6 both for MLN_DS and AUDPC, whereas some minor QTL were also identified on chromosome 8 (Figures 5A,B, Supplementary Table S2). The position of the QTL on chromosome 6 was consistent for both MLN_DS and AUDPC values in populations involving KS23; on the other hand, there was no corresponding significant hits in SG4 (CML494 x CZL068) and SG5 (DTP-F46 x CML442) combined population-based GWAS (Figures 5C,D). The summary of ∼36 significant SNPs identified under MLN_DS scores is presented in Supplementary Table S2. The most significant SNPs with p < 3.57 × 10⁻²⁴ and p < 2.77 × 10⁻²² were common across MLN_DS and AUDPC values (Supplementary Table S2). QTL qMLN6_157 detected in QM2 is ranged from 129 to 157.5Mb, and same region was again detected in SG2 at 151–155Mb; in SG1 and SG3, QTL was detected between 152 and 161 Mb. With GWAS, we identified several SNPs in this region, but first best 10 SNPs were distributed between 155 and 158 Mb. Taking into account the most significant markers within the segment of 156–157 Mb, the MLN-resistant QTL was estimated to span about 1.7 Mb region on the long arm of chromosome 6.
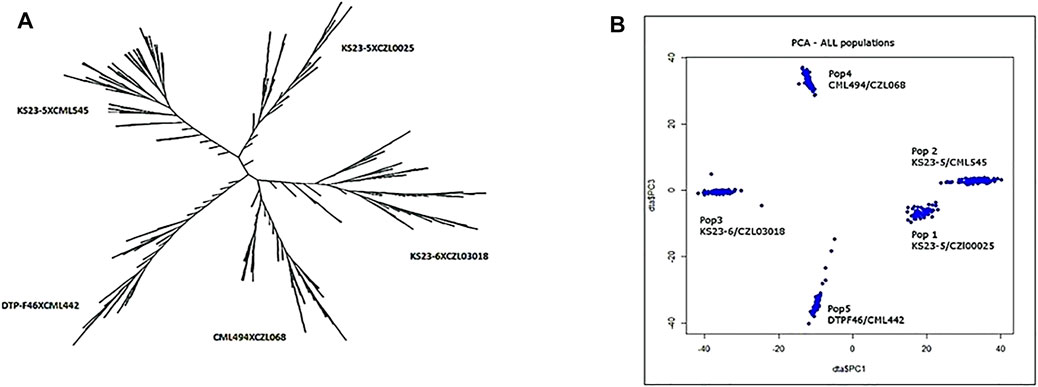
FIGURE 4. Clustering pattern of 438 genotypes forming five populations using UPGMA method (A) and grouping of the genotypes using the first three PCs (B).
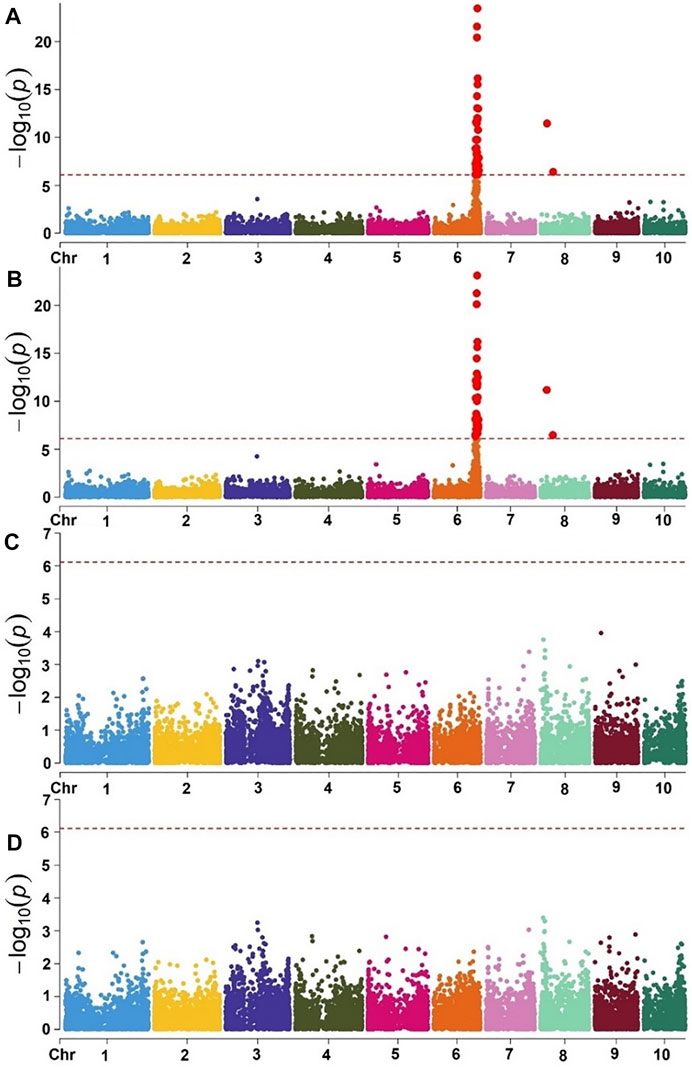
FIGURE 5. Manhattan plot of GWAS using MLM in the selective genotyping populations. Combined genome-wide association scan for MLN_DS (A) and AUDPC values (B) based on the first three F2 populations (SG) with KS23 background. Manhattan plots for MLN_DS (C) and AUDPC values (D) based on two F2 populations (CML494 X CZL068 and DTP-F46 X CML442) with no KS23 background. The horizontal dotted line indicates genome-wide significance and the plots above the line represent SNP markers that showed significance above threshold of p = 5 × 10⁻⁷.
There was a significant change in the progression of MLN disease in all the VP families, determined by their genotypic class, with a more rapid progression in the families of susceptible genotypes. During second scoring, observable segregation patterns were seen in families that were heterozygous across the qMLN_06.157 interval. Within each heterozygous family, susceptible individuals were observed a higher frequency than the resistant individuals. Genotypes in resistant families and those segregating for resistance maintained healthy status up to the fourth score.
Analysis of variance revealed significant effect of the MLN haplotypes on MLN scores (Table 5). The marker class means of the MLN disease scores varied across the population. The summary of statistics relating to each of the populations is provided in Table 5. The heritability estimates were moderate to high, with all population having heritability >0.7. The mean performance of populations varied, with CML539 (VP2) showing higher scores. Means from the contributions of the MLN-resistant locus in different marker classes are shown in Figure 6. As expected, the marker class of resistant haplotype (+/+) has lower scores, whereas high MLN scores are observed in the susceptible genotypes (−/−). The segregating class displayed higher scores, and in some population, this class had nearly the same score as the −/− genotypes (VP1 and VP5).

TABLE 5. Estimates of means, genetic variance, heritability, LSD and coefficient of variation in different populations.
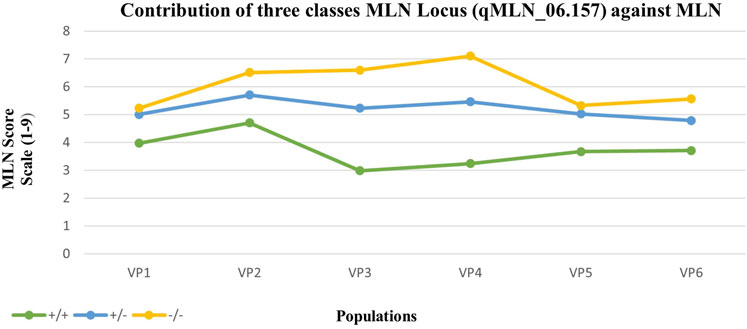
FIGURE 6. Mean response to MLN inoculation of individuals from contrasting marker classes within six populations. +/+ are homozygous for the KS23 haplotype, +/− are heterozygous, and −/− are homozygous for the susceptible haplotype. All populations were genotyped with 20 SNP markers identified along the MLN-resistant QTL region on chromosome 6.
Transboundary diseases have a devastating effect on crop production and severely impact the food security and livelihoods of resource-constrained smallholders and their families (Savary et al., 2019). The MLN disease emerged as a major threat to maize producers in eastern Africa since 2011. Intensive multi-disciplinary and multi-institutional efforts over the last 7–8 years have significantly reduced the spread and impact of the disease in Sub-Saharan Africa, but the threat still remains. Breeding and deployment of MLN-resistant elite varieties is an important component of MLN disease management strategy (Prasanna et al., 2020). Although resistance to MLN has been shown to be quantitatively inherited, we still understand very little about its genetic architecture in maize. In the present study, simultaneous mapping strategies were implemented to dissect the genetic architecture of resistance to MLN. On the basis of the excellent resistance offered by two exotic lines KS23-5 and KS23-6 against MLN under artificial inoculation in Kenya, multiple populations were developed and analyzed in this study using linkage mapping and GWAS. Furthermore, the QTL qMLN6-157, which was consistently detected at least in one of the three QM F3 population and five F2 SG populations, was validated for its effect across various genetic backgrounds in five F2 VP populations.
Previous studies conducted to map MLN-resistant loci have identified dominantly inherited QTLs in several chromosomes in various mapping populations (Gowda et al., 2015, 2018; Awata et al., 2020; Jones et al., 2018; Nyaga et al., 2020; Sitonik et al., 2019). At the same time, screening thousands of genetically diverse maize inbred lines at the MLN Screening Facility at Naivasha, Kenya, since 2013 led to the identification of two MLN-resistant sister lines, KS23-5 and KS23-6. This is in sharp contrast to the susceptibility of most of the CIMMYT germplasm as well as those of partner institutions in Africa to MLN (Prasanna et al., 2020). The present study utilized the two MLN-resistant lines and undertook linkage mapping as well as GWAS to discover and validate major QTL for resistance to MLN. The bi-parental population-based linkage mapping increased the QTL detection power, whereas GWAS increased the resolution at the detected interval (Kibe et al., 2020).
All three KS23-6– and KS23-5–based populations revealed consistent and very large effect QTL (qMLN6-157), where R2 values ranged from 14.93% to 60.61% for MLN_DS and 16.59%–74.82% for AUDPC (Figure 2, Figure 3; Table 3). Several factors including screening of large F2 populations and use of artificial inoculation to make sure uniform disease pressure and getting high heritability all helped to accurately map the QTL. On the other hand, overestimation of QTL effects is possibly due to the SG approach used and the relatively small numbers of individuals genotyped. Whenever SG is done against recombinants, it reduces the effective recombination rate near QTL and potentially might cause bias in linkage map construction (Lin and Ritland 1996). However, the population size has a larger effect on linkage maps with multiple fold increase in calculated marker distances compared to map of F3 populations (Supplementary Table S1). Silva et al. (2007) reported that population size has a larger effect on linkage maps with about a threefold increase in marker distances as population size is reduced from 800 to 100 RI lines. Furthermore, deletions or genome rearrangements, often spanning megabases, that occur between maize genotypes (Fu and Dooner 2002; Song and Messing 2003; Brunner et al., 2005; Springer et al., 2009) can cause markers to be out of place on position-based maps due to rearrangements in the genome and causing further increase in map distances. Jones et al. (2018) also reported similar large genetic maps when using F2 populations with SG approach. Further research with large, replicated field trials and fine mapping of the major-effect QTL will pave the way to find more reliable markers for the causal gene. Another major QTL on chromosome 3 was observed from the background of a population without KS23 as parent (Figure 3). The QTL identified for MLN resistance on chromosome 3 in non-KS23 populations overlaps with an earlier detected dominantly inherited MLN-resistant QTL (Gowda et al., 2018; Sitonik et al., 2019; Awata et al., 2020).
Using linkage analysis with QM populations, we reconfirmed the major QTL on the long arm of chromosome 6 conferring resistance to MLN (Figure 2; Table 3 and 4). Given the size of the mapping population, the confidence interval of MLN-resistant QTL discovered was large. For instance, the interval in QM3 was much larger (about 50 Mb) than that of QM1 and QM2. However, the phenotypic variance explained by this QTL at this interval was >10% across all the populations, indicating that the QTL has a major-effect on MLN resistance. The identification of this major QTL for MLN resistance in this experiment is consistent with the QTL identified with SG populations in the background of KS23.
GWAS has been widely used in the discovery of causal variants for resistance to many maize diseases, including MLN (Gowda et al., 2015; Sitonik et al., 2019; Kibe et al., 2020; Nyaga et al., 2020). Although GWAS has proven to be advantageous for discovery of minor alleles, the complexity of the population structure causes a high rate of false positives. The populations used here were developed from parents collected in various CIMMYT breeding programs in Africa as well as Latin America (Mexico) and KS23 lines. Along with population structure, family relatedness/kinship matrix (K matrix) was used in the present study to correct for any possible spurious associations. Principal components analysis identified five clusters that represent the genetic diversity of the populations used (Figure 4). These clusters represent allele frequency differences between the populations because of ancestral differences. For instance, the populations based on KS23-5 cluster were closer compared with other populations (Figure 4).
GWAS is known to have a high-resolution power due to possible historical recombination events accumulated within a mapping panel. On the contrary, the panel used here comprised F2 segregating populations developed from parents developed in diverse regions. Furthermore, the mode of phenotypic and genotypic data collection used was whole population phenotyping and SG, which differed from traditional methods employed in many GWAS studies. SG is a method that uses extreme phenotypes in a population to maximize their genotypic dissimilarity (Chunfang et al., 2004). It is assumed that the extreme phenotypes harbor diverse alleles/loci that were brought together through intermating of diverse parents (Sun et al., 2010). SG has been used in number of linkage mapping studies in maize to identify QTL associated with resistance to Curvularia leaf spot (Hou et al., 2013), root-lodging resistance (Farkhari et al., 2013), and, more recently, localization of QTL for resistance/tolerance to MCMV (Jones et al., 2018).
Using the selective genotyping approach, the association study identified 20 SNPs significantly associated with MLN resistance on chromosome 6 (Figure 5A−B, Table 6, Supplementary Table S2). In contrast to the linkage mapping done here, GWAS drastically increased the resolution and enabled reduction of the confidence interval of MLN-resistant QTL from 30 Mbps to an interval of 1−5 Mbps (Figures 2, 5). The groupings of the population, either having KS23 donor background or not, further reinforced the presence of a major-effect MLN-resistant QTL from KS23 background. For instance, although the clusters containing CIMMYT lines revealed two minor QTLs on chromosome 3 and 8, they did not show any significant association with the major QTL on chromosome 6 as opposed to the clusters having a K23 background (Figures 5C,D). The absence of this locus in the CIMMYT breeding lines analyzed in the study as well as the elite maize germplasm from the national agricultural research systems (NARS) institutions in eastern and southern Africa indicates that the QTL identified here is indeed unique to the KS23 background resulting in the favorable phenotype. The discovery of the major-effect QTL and the significant phenotypic variation explained by the QTL paves way for fast-tracking introgression of MLN resistance from KS23 lines into CIMMYT/NARS lines adapted to Sub-Saharan Africa. The QTL also reconfirms the MCMV resistance QTL reported in F2 populations by Jones et al. (2018).
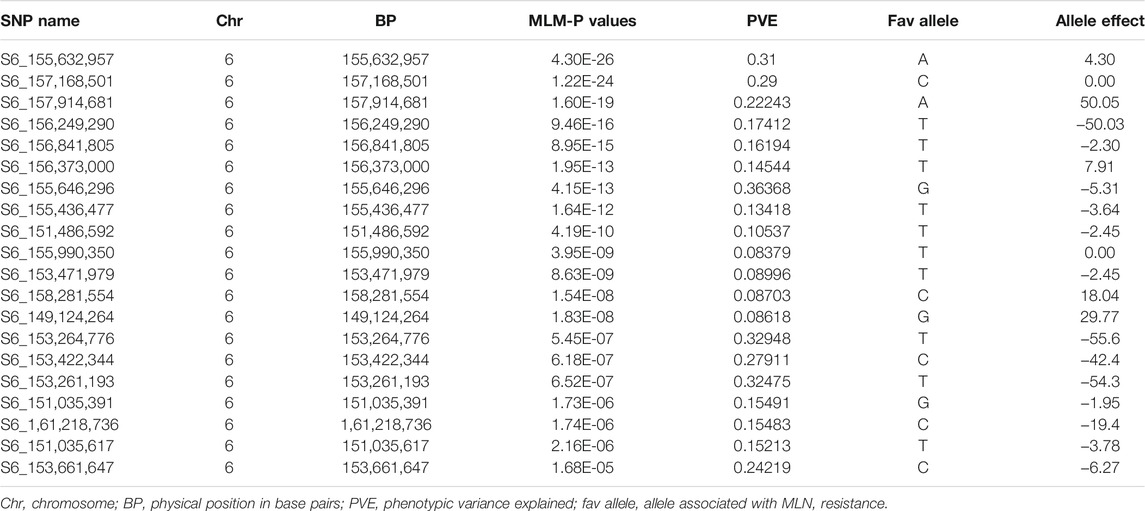
TABLE 6. Chromosomal positions and SNPs significantly associated with both MLN disease severity (DS) and area under the disease progress curve (AUDPC) and used in validation experiments.
For verification of the haplotype block associated with MLN resistance on chromosome 6 (qMLN6_157), a set of independent breeding populations were developed and tested to determine the proportion of phenotypic variance explained by the QTL. Six F2 populations were genotyped with 20 SNP markers identified along the MLN-resistant QTL (qMLN6_157) region on chromosome 6. Each population was partitioned into three marker class genotypes, homozygous for the resistant parent (donor) and homozygous for susceptible or segregating individuals. Disease progression in each of these classes was distinct, indicating the effect of qMLN_06.157 under MLN. Low scores observed within the resistant class indicate a significant effect of the QTL to MLN resistance (Table 5; Figure 6). This reconfirms the reliability of QTL detected through linkage mapping and GWAS and increases the confidence on this QTL to include as part of marker assisted breeding to improve the MLN resistance. Nevertheless, further fine mapping of this region and finding tightly linked flanking markers can enhance the efficiency to improve MLN resistance as well as introgress this QTL into elite susceptible lines.
In maize, the genetics of virus resistance has been studied in both temperate and tropical germplasm (Redinbaugh et al., 2018). Few inbred lines with strong resistance to multiple viruses have been identified. For instance, line Oh1VI was identified as highly resistant to MDMV, SCMV, WSMV, Maize chlorotic dwarf virus, Maize fine streak virus (MFSV), Maize mosaic virus (MMV), and Maize necrotic streak virus (Zambrano et al., 2014; Redinbaugh et al., 2018). After the inoculation of viruses, resistance lines for these viruses showed either no or few symptoms with significantly reduced virus titer in plant tissues. On the contrary for MCMV, Jones et al. (2018) observed high titer in systemic tissues of the identified resistant lines. Genetic analyses of F2 populations for MFSV, MMV, MDMV, SCMV, and WSMV suggest that resistance to these viruses is governed by both additive and dominant genes (Redinbaugh and Zambrano, 2014). Resistance QTLs with additive or dominant gene action for all these five viruses were clustered in the same genomic region at chromosome 3 and 6 (Zambrano et al., 2014; Awata et al., 2020). For SCMV resistance, two major dominantly inherited QTL/genes, namely, Scmv1 and Scmv2, were identified and fine mapped on the short arm of chromosome 6, and near the centromere of chromosome 3, respectively (Tao et al., 2013; Redinbaugh et al., 2018). For expression of complete resistance, both resistance genes must act together time where resistance at all developmental stages is provided by Scmv1, and resistance expressed at later stages of plant development is governed by Scmv2 (Xia et al., 1999; Ding et al., 2012). On the contrary, MCMV is governed by major QTL, and recessive nature was identified in two F2 populations (Jones et al., 2018).
The resistance exhibited by MLN-resistant QTL (qMLN6_157) in this study suggests a natural recessive inheritance. Susceptible individuals were observed at a higher frequency in the segregating families compared with the resistant counterparts (Table 5; Figure 6). More so, the mean score of the segregating families was closer to that families selected to be homozygous susceptible (Figure 6). The recessive nature of the QTL is also inferred by phenotypic distribution of the F2 population, which is skewed toward susceptible phenotype (Figure 1). Some differences in gene action on controlling the MLN resistance or tolerance were observed when the distribution of phenotypes in the F2 populations and the phenotypes of F2 plants heterozygous for closely linked markers to the MLN-resistant QTL were compared. In SG1, SG2, and SG3, the MLN_DS and AUDPC scores of plants heterozygous for the markers tightly linked to the QTL on chromosome 6 were similar to those of the susceptible parent (Figure 3), suggesting that tolerance is controlled by a recessive gene. On the contrary, in SG4 and SG5 populations, the distribution of MLN_DS and AUDPC scores appears to be more normally distributed, which is consistent with the identification of several QTL with smaller contributions to tolerance in these lines. Similar observations on the recessive nature of inheritance of the QTL were made by Jones et al. (2018) using F2 population developed from KS23 background, tested under MCMV. Both MLN_DS and the AUDPC scores of plants heterozygous for the markers are closely linked to the large effect QTL (qMLN6-157) on chromosome 6 (Figure 3), further suggesting that MLN resistance is controlled by a recessively inherited gene. The QTL validation experiment confirmed the robustness of the QTL and the potential benefit of introgression of the QTL in desired genetic backgrounds. The identity of the closely linked markers would be useful for indirect selection of the QTL especially in marker-assisted backcrossing as well as forward breeding methods. On the other hand, having single gene or QTL-based resistance is always risk of losing it quickly at any given point of time especially after introgression of the QTL to many elite lines. To avoid such scenario, it is suggested to combine the QTL (qMLN6-157) with other MLN resistant, dominantly inherited major-effect QTL from chromosome 3 (region of 130–140 Mb) and chromosome 6 (region of 5–20 Mb; Gowda et al., 2015, 2018; Sitonik et al., 2019; Nyaga et al., 2020; Awata et al., 2020; Awata et al., 2021).
The present study identified a novel QTL for MLN resistance in the genetic background of two sister lines KS23-5 and KS23-6, on the basis of a source population constituted at the University of Hawaii, United States, using germplasm from Kasetsart University, Thailand. These two lines showed excellent resistance to MLN when tested under artificial inoculation at the MLN Screening Facility at Naivasha, Kenya, and thus serve as trait donors for improving MLN resistance in maize breeding pipelines in Africa. Both linkage mapping and association mapping approaches were used in the study to discover and validate genomic regions associated with MLN resistance. Three F3 bi-parental populations and five F2 bi-parental populations were used in linkage mapping, and all the F2 populations were used in SG-based association mapping. One major QTL unique to KS23 background, and recessively inherited, was identified on the long arm of chromosome 6, designated as qMLN_06.157. This QTL was consistently detected in at least one of three F3 populations, and in the three KS23 derived F2 populations and in the GWAS. This QTL could not be identified in populations that were not based on KS23 lines. The validation study confirmed that the QTL is consistent and expressing in KS23 genetic and different environmental background, as well as it is recessively inherited with a major-effect, indicating its great potential for application in marker-assisted breeding for MLN resistance. Furthermore, the unique nature of MLN resistance conferred by qMLN_06.157 warrants further study using fine mapping and gene cloning to investigates gene(s) or casual variations within KS23 background that confers the favorable phenotype. Overall, qMLN157 is a novel major-effect recessively inherited QTL and could be targeted for further fine mapping, for developing breeder-friendly diagnostic markers and for further introgression of MLN resistance into desired genetic backgrounds in breeding programs.
The original contributions presented in the study are included in the article/Supplementary Material; further inquiries can be directed to the corresponding authors.
AM, MO, DK, BD, BP, YB, and MG conceived the experiments; BD, OV, DK, SL, BE, and AM conducted field evaluations and phenotyping; MG, MO, and OV coordinated sample genotyping; MG, DK, and AM carried out GWAS and linkage analyses; AM, BD, YB, MO, BP, DK, BE, SL, and MG interpreted the results and drafted the manuscript.
The research was supported by the Bill and Melinda Gates Foundation (B and MGF) and the United States Agency for International Development (USAID) through the Stress Tolerant Maize for Africa (STMA; B and MGF grant no. OPP1134248) Project, IMAS Project, HTPG Project, AGG (Accelerating Genetic Gains in Maize and Wheat for Improved Livelihoods; B and MGF Investment ID INV-003439) Project and the CGIAR Research Program on Maize (MAIZE). MAIZE receives W1&W2 support from the Governments of Australia, Belgium, Canada, China, France, India, Japan, Korea, Mexico, Netherlands, New Zealand, Norway, Sweden, Switzerland, United Kingdom, United States, and the World Bank. Our sincere thanks to CIMMYT technicians in Kenya; the Integrated Genotyping Service and Support (IGSS) platform, BecA, ILRI, Kenya, and Diversity Array Technology (DArT) Ltd. for the high-density genotyping and imputation service.
The authors declare that the research was conducted in the absence of any commercial or financial relationships that could be construed as a potential conflict of interest.
All claims expressed in this article are solely those of the authors and do not necessarily represent those of their affiliated organizations or those of the publisher, the editors, and the reviewers. Any product that may be evaluated in this article, or claim that may be made by its manufacturer, is not guaranteed or endorsed by the publisher.
The Supplementary Material for this article can be found online at: https://www.frontiersin.org/articles/10.3389/fgene.2021.767883/full#supplementary-material
Awata, L. A. O., Beyene, Y., Gowda, M., L. M., S., Jumbo, M. B., Tongoona, P., et al. (2020). Genetic Analysis of QTL for Resistance to Maize Lethal Necrosis in Multiple Mapping Populations. Genes 11 (1), 32. doi:10.3390/genes11010032
Awata, L. A. O., Ifie, B. E., Danquah, E., Jumbo, M. B., Suresh, L. M., Gowda, M., et al. (2021). Introgression of Maize Lethal Necrosis Resistance Quantitative Trait Loci Into Susceptible Maize Populations and Validation of the Resistance Under Field Conditions in Naivasha, Kenya. Front. Plant Sci. 12, 649308. doi:10.3389/fpls.2021.649308
Barnett, I. J., Lee, S., and Lin, X. (2013). Detecting Rare Variant Effects Using Extreme Phenotype Sampling in Sequencing Association Studies. Genet. Epidemiol. 37, 142–151. doi:10.1002/gepi.21699
Beyene, Y., Gowda, M., Suresh, L. M., Mugo, S., Olsen, M., Oikeh, S. O., et al. (2017). Genetic Analysis of Tropical maize Inbred Lines for Resistance to maize Lethal Necrosis Disease. Euphytica 213, 224. doi:10.1007/s10681-017-2012-3
Boddupalli, P., Suresh, L. M., Mwatuni, F., Beyene, Y., Makumbi, D., Gowda, M., et al. (2020). Maize Lethal Necrosis (MLN): Efforts toward Containing the Spread and Impact of a Devastating Transboundary Disease in Sub-saharan Africa. Virus. Res. 282, 197943. doi:10.1016/j.virusres.2020.197943
Bradbury, P. J., Zhang, Z., Kroon, D. E., Casstevens, T. M., Ramdoss, Y., and Buckler, E. S. (2007). TASSEL: Software for Association Mapping of Complex Traits in Diverse Samples. Bioinformatics 23 (19), 2633–2635. doi:10.1093/bioinformatics/btm308
Brewbaker, J. L. (2009). Registration of Nine maize Populations Resistant to Tropical Diseases. J. Plant Reg. 3 (1), 10–13. doi:10.3198/jpr2008.07.0396crc
Brunner, S., Fengler, K., Morgante, M., Tingey, S., and Rafalski, A. (2005). Evolution of DNA Sequence Nonhomologies Among maize Inbreds. Plant Cell 17, 343–360. doi:10.1105/tpc.104.025627
Campbell, C. L., and Madden, L. V. (1990). Introduction to Plant Disease Epidemiology. New York, NY: John Wiley & Sons.
Chunfang, J., Hong, L., Attie, A. D., Churchill, G. A., Bulutuglo, D., and Yandell, B. S. (2004). Selective Phenotyping for Increased Efficiency in Genetic Mapping Studies. Genetics 168 (4), 2285–2293.
Cornish, P. L., Knowles, S. R., Marchesano, R., Tam, V., Shadowitz, S., Juurlink, D. N., et al. (2005). Unintended Medication Discrepancies at the Time of Hospital Admission. Arch Intern. Med. 165 (4), 424–429. doi:10.1001/archinte.165.4.424
De Groote, H., Munyua, B. G., Palmas, S., Suresh, L. M., Bruce, A. Y., and Kimenju, S. (2021). Using Panel Community Surveys to Track the Impact of Crop Pests over Time and Space - the Case of Maize Lethal Necrosis (MLN) Disease in Kenya from 2013 to 2018. Plant Dis. 105 (5), 1259–1271. doi:10.1094/PDIS-08-20-1730-SR
De Groote, H., Oloo, F., Tongruksawattana, S., and Das, B. (2016). Community-survey Based Assessment of the Geographic Distribution and Impact of maize Lethal Necrosis (MLN) Disease in Kenya. Crop Prot. 82, 30–35. doi:10.1016/j.cropro.2015.12.003
Ding, J., Li, H., Wang, Y., Zhao, R., Zhang, X., Chen, J., et al. (2012). Fine Mapping of Rscmv2, a Major Gene for Resistance to Sugarcane Mosaic Virus in maize. Mol. Breed. 30, 1593–1600. doi:10.1007/s11032-012-9741-8
Farkhari, M., Krivanek, A., Xu, Y., Rong, T., Naghavi, M. R., Samadi, B. Y., et al. (2013). Root-lodging Resistance in maize as an Example for High-Throughput Genetic Mapping via Single Nucleotide Polymorphism-Based Selective Genotyping. Plant Breed 132 (1), 90–98. doi:10.1111/pbr.12010
Fu, H., and Dooner, H. K. (2002). Intraspecific Violation of Genetic Colinearity and its Implications in maize. Proc. Natl. Acad. Sci. 99, 9573–9578. doi:10.1073/pnas.132259199
Gowda, M., Beyene, Y., Makumbi, D., Semagn, K., Olsen, M. S., Bright, J. M., et al. (2018). Discovery and Validation of Genomic Regions Associated with Resistance to maize Lethal Necrosis in Four Biparental Populations. Mol. Breed. 38 (5), 66. doi:10.1007/s11032-018-0829-7
Gowda, M., Das, B., Makumbi, D., Babu, R., Semagn, K., Mahuku, G., et al. (2015). Genome-wide Association and Genomic Prediction of Resistance to maize Lethal Necrosis Disease in Tropical maize Germplasm. Theor. Appl. Genet. 128, 1957–1968. doi:10.1007/s00122-015-2559-0
Gregorio, A., Marco, L., Mateo, V., Pacheo, A., Rodriguez, F., Burgueno, J., et al. (2015). META-R (Multi Environment Trail Analysis with R for Windows). Version 6.04. https://hdl.handle.net/11529/10201, V23. CIMMYT Research Data and Software Repository Network.
Herbert, A., Gerry, N. P., McQueen, M. B., Heid, I. M., Pfeufer, A., Illig, T., et al. (2006). A Common Genetic Variant Is Associated with Adult and Childhood Obesity. Science 312 (5771), 279–283. doi:10.1126/science.1124779
Holland, J. (2007). Genetic Architecture of Complex Traits in Plants. Curr. Opin. Plant Biol. 10 (2), 156–161. doi:10.1016/j.pbi.2007.01.003
Hou, J., Xing, Y., Zhang, Y., Tao, Y., Tan, G., and Xu, M. (2013). Identification of Quantitative Trait Loci for Resistance to Curvularia Leaf Spot of maize. Maydica 58 (3), 266–273.
Jones, M. W., Penning, B. W., Jamann, T. M., Glaubitz, J. C., Romay, C., Buckler, E. S., et al. (2018). Diverse Chromosomal Locations of Quantitative Trait Loci for Tolerance to Maize Chlorotic Mottle Virus in Five maize Populations. Phytopathology 108 (6), 748–758. doi:10.1094/phyto-09-17-0321-r
Kaeppler, S. M., Galusha, D. D., Thomas‐Compton, M., Doupnik, B., Jensen, S., and Compton, W. A. (1998). Registration of N211, N217, and N218 Parental Inbred Lines of Maize. Crop Sci. 38 (1), 289. doi:10.2135/cropsci1998.0011183x003800010069x
Kibe, M., Nyaga, C., Nair, S. K., Beyene, Y., Das, B., M, S. L., et al. (2020). Combination of Linkage Mapping, GWAS, and GP to Dissect the Genetic Basis of Common Rust Resistance in Tropical maize Germplasm. Ijms 21 (18), 6518. doi:10.3390/ijms21186518
Lin, J.-Z., and Ritland, K. (1996). The Effects of Selective Genotyping on Estimates of Proportion of Recombination between Linked Quantitative Trait Loci. Theoret. Appl. Genet. 93, 1261–1266. doi:10.1007/bf00223458
Madden, L. V., Hughes, G., and van den Bosch, F. (2007). The Study of Plant Disease Epidemics. Saint Paul, MN: The American Phytopathological Society.
Mahuku, G., Lockhart, B. E., Wanjala, B., Jones, M. W., Kimunye, J. N., Stewart, L. R., et al. (2015). Maize Lethal Necrosis (MLN), an Emerging Threat to maize-based Food Security in Sub-saharan Africa. Phytopathology 105, 956–965. doi:10.1016/j.virusres.2020.19794310.1094/phyto-12-14-0367-fi
Marenya, P. P., Erenstein, O., Prasanna, B., Makumbi, D., Jumbo, M., and Beyene, Y. (2018). Maize Lethal Necrosis Disease: Evaluating Agronomic and Genetic Control Strategies for Ethiopia and Kenya. Agric. Syst. 162, 220–228. doi:10.1016/j.agsy.2018.01.016
McCord, P., Glynn, N., and Comstock, J. (2019). Identifying Markers for Resistance to Sugarcane orange Rust (Puccinia Kuehnii) via Selective Genotyping and Capture Sequencing. Euphytica 215, 150. doi:10.1007/s10681-019-2340-6
McDonald, B. A., and Stukenbrock, E. H. (2016). Rapid Emergence of Pathogens in Agro-Ecosystems: Global Threats to Agricultural Sustainability and Food Security. Phil. Trans. R. Soc. B 371 (1709), 20160026. doi:10.1098/rstb.2016.0026
Nyaga, C., Gowda, M., Beyene, Y., Muriithi, W. T., Makumbi, D., Olsen, M. S., et al. (2020). Genome-Wide Analyses and Prediction of Resistance to MLN in Large Tropical Maize Germplasm. Genes 11 (1), 16. doi:10.3390/genes11010016
Price, A. L., Patterson, N. J., Plenge, R. M., Weinblatt, M. E., Shadick, N. A., and Reich, D. (2006). Principal Components Analysis Corrects for Stratification in Genome-wide Association Studies. Nat. Genet. 38, 904–909. doi:10.1038/ng1847
Redinbaugh, M. G., Lübberstedt, T., Leng, P., and Xu, M. (2018). “The Genetics and Genomics of Virus Resistance in maize,” in The Maize Genome. Compendium of Plant Genomes. Editors J. Bennetzen, S. Flint Garcia, C. Hirsch, and R. Tuberosa (Cham: Springer), 185–200. doi:10.1007/978-3-319-97427-9_12)
Redinbaugh, M. G., and Zambrano, J. L. (2014). “Control of Virus Diseases in maize,” in Control of Plant Virus Disease: Seed-Propagated Crops. Editors G. Lobenstein, and N. Katis (Waltham, MA USA: Academic Press), Vol. 90, 391–429. Advances in Virus Research. doi:10.1016/b978-0-12-801246-8.00008-1
Saunak, S., Johannes, F., and Broman, K. W. (2009). Selective Genotyping and Phenotyping Strategies in a Complex Trait Context. Genetics 181, 1613–1626. doi:10.1534/genetics.108.094607
Savary, S., Willocquet, L., Pethybridge, S. J., Esker, P., McRoberts, N., and Nelson, A. (2019). The Global burden of Pathogens and Pests on Major Food Crops. Nat. Ecol. Evol. 3, 430–439. doi:10.1038/s41559-018-0793-y
Semagn, K., Babu, R., Hearne, S., and Olsen, M. (2013). Single Nucleotide Polymorphism Genotyping Using Kompetitive Allele Specific PCR (KASP): Overview of the Technology and its Application in Crop Improvement. Mol. Breed. 33, 1–14. doi:10.1007/s11032-013-9917-x
Semagn, K., Beyene, Y., Babu, R., Nair, S., Gowda, M., Das, B., et al. (2015). Quantitative Trait Loci Mapping and Molecular Breeding for Developing Stress Resilient maize for Sub-saharan Africa. Crop Sci. 55, 1–11. doi:10.2135/cropsci2014.09.0646
Sitonik, C. a., Suresh, L. M., Beyene, Y., and Olsen, M. S. (2019). Simulation of Population Size and Genome Saturation Level for Genetic Mapping of Recombinant Inbred Lines (RILs). Genet. Mol. Biol. 30, 1101–1108. doi:10.1590/s1415-47572007000600013
Song, R., and Messing, J. (2003). Gene Expression of a Gene Family in maize Based on Noncollinear Haplotypes. Proc. Natl. Acad. Sci. 100, 9055–9060. doi:10.1073/pnas.1032999100
Springer, N. M., Ying, K., Fu, Y., Ji, T., Yeh, C.-T., Jia, Y., et al. (2009). Maize Inbreds Exhibit High Levels of Copy Number Variation (CNV) and Presence/absence Variation (PAV) in Genome Content. Plos Genet. 5, e1000734. doi:10.1371/journal.pgen.1000734
Sun, Y., Wang, J., Crouch, J. H., and Xu, Y. (2010). Efficiency of Selective Genotyping for Genetic Analysis of Complex Traits and Potential Applications in Crop Improvement. Mol. Breed. 26, 493–511. doi:10.1007/s11032-010-9390-8
Tao, Y., Jiang, L., Liu, Q., Zhang, Y., Zhang, R., Ingvardsen, C. R., et al. (2013). Combined Linkage and Association Mapping Reveals Candidates for Scmv1, a Major Locus Involved in Resistance to Sugarcane Mosaic Virus (SCMV) in maize. BMC Plant Biol. 13, 162. doi:10.1186/1471-2229-13-162
Uemoto, Y., Abe, T., Tameoka, N., Hasebe, H., Inoue, K., Nakajima, H., et al. (2011). Whole-genome Association Study for Fatty Acid Composition of Oleic Acid in Japanese Black Cattle. Anim. Genet. 42, 141–148. doi:10.1111/j.1365-2052.2010.02088.x
Wangai, A. W., Redinbaugh, M. G., Kinyua, Z. M., Miano, D. W., Leley, P. K., Kasina, M., et al. (2012). First Report of Maize Chlorotic Mottle Virus and Maize Lethal Necrosis in Kenya. Plant Dis. 96 (10), 1582. doi:10.1094/pdis-06-12-0576-pdn
Xia, X., Melchinger, A. E., Kuntze, L., and Lübberstedt, T. (1999). Quantitative Trait Loci Mapping of Resistance to Sugarcane Mosaic Virus in maize. Phytopathology 89, 660–667. doi:10.1094/phyto.1999.89.8.660
Keywords: maize lethal necrosis, genome-wide association study, F2 population, selective genotyping, disease resistance
Citation: Murithi A, Olsen MS, Kwemoi DB, Veronica O, Ertiro BT, L. M. S, Beyene Y, Das B, Prasanna BM and Gowda M (2021) Discovery and Validation of a Recessively Inherited Major-Effect QTL Conferring Resistance to Maize Lethal Necrosis (MLN) Disease. Front. Genet. 12:767883. doi: 10.3389/fgene.2021.767883
Received: 31 August 2021; Accepted: 26 October 2021;
Published: 19 November 2021.
Edited by:
Ahmed Sallam, Assiut University, EgyptReviewed by:
Tao Zhong, China Agricultural University, ChinaCopyright © 2021 Murithi, Olsen, Kwemoi, Veronica, Ertiro, L. M., Beyene, Das, Prasanna and Gowda. This is an open-access article distributed under the terms of the Creative Commons Attribution License (CC BY). The use, distribution or reproduction in other forums is permitted, provided the original author(s) and the copyright owner(s) are credited and that the original publication in this journal is cited, in accordance with accepted academic practice. No use, distribution or reproduction is permitted which does not comply with these terms.
*Correspondence: Michael S. Olsen, TS5PbHNlbkBjZ2lhci5vcmc=; Manje Gowda, TS5Hb3dkYUBjZ2lhci5vcmc=
Disclaimer: All claims expressed in this article are solely those of the authors and do not necessarily represent those of their affiliated organizations, or those of the publisher, the editors and the reviewers. Any product that may be evaluated in this article or claim that may be made by its manufacturer is not guaranteed or endorsed by the publisher.
Research integrity at Frontiers

Learn more about the work of our research integrity team to safeguard the quality of each article we publish.