- 1Hunan Key Laboratory for Computation and Simulation in Science and Engineering and Key Laboratory of Intelligent Computing and Information Processing of Ministry of Education, Xiangtan University, Hunan, China
- 2Provincial Key Laboratory of Informational Service for Rural Area of Southwestern Hunan, Shaoyang University, Shaoyang, China
- 3Faculty of Science, Engineering and Technology, Swinburne University of Technology, Hawthorn, VIC, Australia
Alignment methods have faced disadvantages in sequence comparison and phylogeny reconstruction due to their high computational costs in handling time and space complexity. On the other hand, alignment-free methods incur low computational costs and have recently gained popularity in the field of bioinformatics. Here we propose a new alignment-free method for phylogenetic tree reconstruction based on whole genome sequences. A key component is a measure called information-entropy position-weighted k-mer relative measure (IEPWRMkmer), which combines the position-weighted measure of k-mers proposed by our group and the information entropy of frequency of k-mers. The Manhattan distance is used to calculate the pairwise distance between species. Finally, we use the Neighbor-Joining method to construct the phylogenetic tree. To evaluate the performance of this method, we perform phylogenetic analysis on two datasets used by other researchers. The results demonstrate that the IEPWRMkmer method is efficient and reliable. The source codes of our method are provided at https://github.com/ wuyaoqun37/IEPWRMkmer.
Introduction
The reconstruction of a phylogenetic tree is a primary problem in evolutionary biology. Sequence alignment is a key step in the reconstruction, aiming to identify the homology of sequences and uncover phylogenetic relationships in sequences. Traditional sequence comparison is based on pairwise or multiple sequence alignment (Felsenstein and Felenstein, 2004; Morrison, 2006) and was implemented by software packages such as BLAST (Altschul et al., 1990), ClustalW (Thompson et al., 1994), and MrBayes (Ronquist et al., 2012). However, the methods based on sequence alignment have some disadvantages, including high computational cost in handling the time and space complexity of the algorithm. Therefore, alignment-free methods have been proposed to overcome these problems (Zielezinski et al., 2017). The computational cost of alignment-free methods is low because they are generally of linear complexity (Fox et al., 1977).
Several alignment-free methods for sequence comparison are based on word counts (Blaisdell, 1986; Höhl et al., 2006; Wang et al., 2016). A key idea is to use the close distribution of k-mers to imply the high correlation degree, hence the similarity of the sequences. The methods have been implemented in software tools, such as FFP (Sims et al., 2009), kWIP (Murray et al., 2017), CVtree (Qi et al., 2004), and DLtree (Wu et al., 2017). Many k-mer methods transform the input sequence into a frequency vector of k-mers, then define the distance of the sequences by that of the frequency vector of k-mers (Qi et al., 2004; Wu et al., 2017). To reduce the statistical dependence between adjacent word matches, Spaced-Words (Leimeister and Boden, 2014) proposed to use spaced words, which are defined by patterns of matches without reference to positions. Some alignment-free methods are based on match length, which defines the distance between sequences based on the length of substring matches between two sequences. These include the shortest unique substring method (Haubold et al., 2005), ACS (Ulitsky et al. 2006), UA (Comin and Verzotto, 2012), and ALFRED (Thankachan et al. 2016). In addition, graphical representation was used to construct the probability distribution of a DNA sequence (Yu et al., 2011). The chaos game representation transforms the distribution of characters in a DNA sequence into the distribution of nodes in a graph (Hoang et al. 2016; Yin, 2017; Mendizabal-Ruiz et al., 2018). Many researchers considered extracting the position information of a k-mer (Huang and Wang, 2011; Ding et al., 2013; Tang et al., 2014). Ding et al. (2013) used the average interval distance of normalized k-mers to capture evolutionary information for sequence comparison. Tang et al. (2014) presented the average relative distance of normalized k-mers to improve the method of Ding et al. (2013). Ma et al. (2020) proposed the PWKmer method, which combines the k-mer counts and k-mer position distributions for phylogenetic analysis.
In this work, we propose a new alignment-free method which combines the position-weighted measure of k-mers proposed by Ma et al. (2020) and the information entropy of frequency of k-mers to obtain phylogenetic information for sequence comparison. It is named information-entropy position-weighted k-mer relative measure (IEPWRMkmer). To evaluate the performance of this method, we carry out phylogenetic analysis on two data sets used by other researchers.
Materials and Methods
Genomic Datasets
Dataset 1
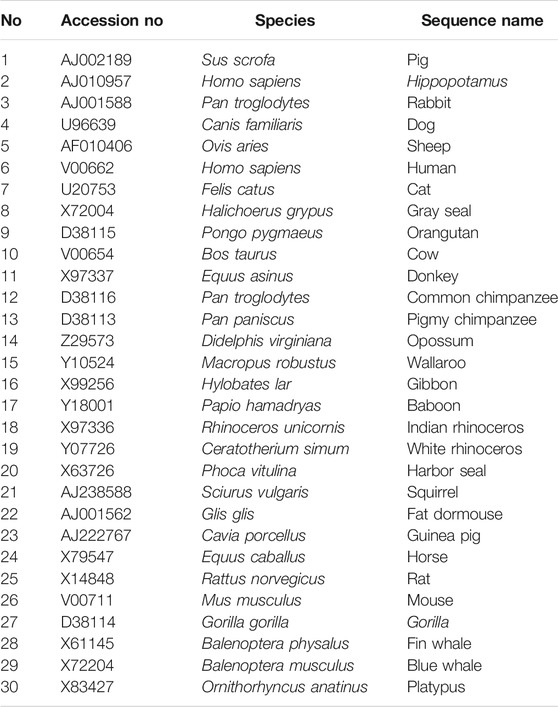
The first dataset for analysis consists of the same whole genome DNA sequences of 30 mammalian species studied in Li et al. (2001), Otu and Sayood (2003), and Tang et al. (2014). The accession numbers, species, and species name are listed in Table 1. All sequences were downloaded from NCBI GenBank.
Dataset 2
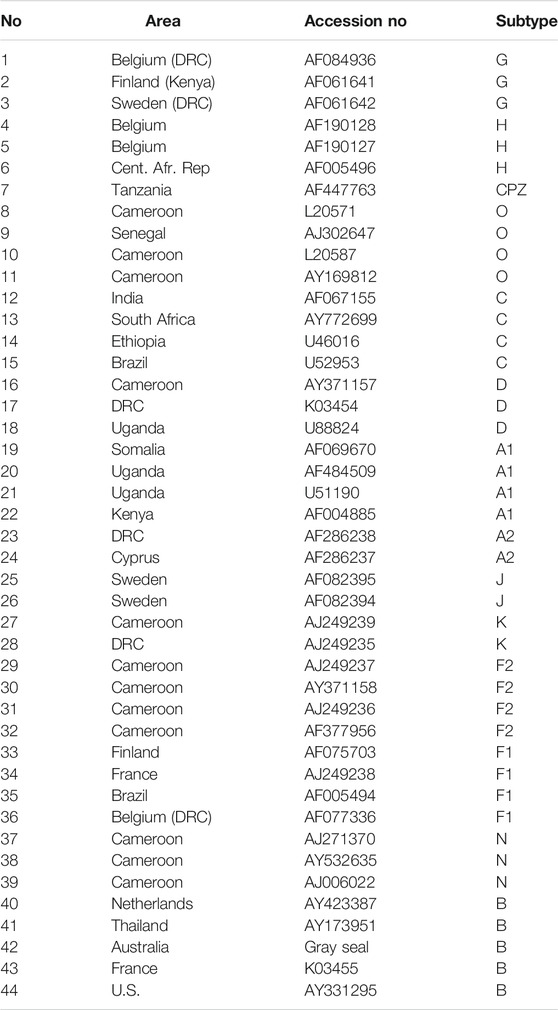
The second dataset for analysis is the HIV-1 dataset studied in Ma et al. (2020). This dataset contains 43 HIV genome sequences used in Wu et al. (2007) and a controversial taxonomic sequence used in Chang et al. (2014). The dataset includes subtypes A, B, C, D, F, G, J, K, and H of the HIV-1 M, O, N groups and the CPZ sequence. The area, accession numbers, and subtypes are listed in Table 2. All these sequences were downloaded from NCBI GenBank.
We use two approaches to validate the method. First, we use the Robinson-Foulds (RF) distance to compare our method with other alignment-free methods. Second, we use the bootstrap method to construct consensus trees and show the stability of the trees obtained by our method.
Methods
Let S =
PAA=(3,9); PAC=(4,10,14); PAG= (0); PAT= (0); PCA=(0); PCC=(5); PCG=(11); PCT=(6,15); PGA=(8,19); PGC=(0); PGG=(18); PGT=(1,12); PTA=(2,13); PTC = 0; PTG=(7,17); PTT=(16).
In this example, the 2-mers AG, AT, CA, GC, and TC do not appear. For each k-mer, its position vector provides its position distribution information in the sequence. One can use the k-mer position vectors to reconstruct the DNA sequence (Ma et al., 2020).
Ma et al. (2020) defined the position-weighted measure
where n is the length of the vector
We denote by N the number of sequences in a dataset. In order to characterize the importance of k-mers in the whole dataset, we count the number m of the sequences that contain a k-mer
where F stands for F (
In this study, we aim to get more DNA phylogenetic information by combining the above two methods and defining
Here, we regard Shannon entropy H (
For a fixed K, there are 4K k-mers. For each k-mer
For two given genome sequences A and B, we can obtain
For a given dataset, we can derive a distance matrix by Eq. 4. This distance matrix contains the sequence similarity information. After obtaining the distance matrix, we insert it into the mega 7.0 software (Sudhir et al., 2016) and use Neighbor-Joining (NJ) program (Saitou et al. 1987) to construct the phylogenetic tree.
Robinson-Foulds Distance and the Bootstrap Method
We use the Robinson-Foulds (RF) distance (Robinson and Foulds 1981) to judge the quality of the method. A smaller RF value means a closer distance between the phylogenetic tree and the reference tree.
(Yu et al., 2010) proposed a modified version of the bootstrap method to evaluate the reliability of the constructed phylogenetic tree. We also use this method in the present work. Its workflow is as follows: Each row is the feature vector (
Results
Experiment 1
We use the genomes of 30 mammalian species in dataset 1 to construct a phylogenetic tree using ClustalX (Larkin et al. 2007) as the reference tree. ClustalX is one of the widely used multiple alignment programs. The result is shown in Figure 1A. It is seen that rabbit, fat dormouse, squirrel, guinea pig, mouse, rat, platypus, opossum, and wallaroo belong to the rodents group; human, baboon, orangutan, gibbon, gorilla, pigmy chimpanzee, and common chimpanzee belong to the primates group; blue whale, fin whale, hippopotamus, cow, sheep, pig, donkey, horse, Indian-rhinoceros, white rhinoceros, cat, dog, gray seal, and harbor seal belong to the ferungulates group. When K < 5, it is not feasible to construct a phylogenetic tree using our method. When K = 5, 6, the 30 mammals cannot be divided into three groups in our tree. When K = 7, it can be divided into three groups, but the relationship between guinea pig and fat dormouse is not correct. When K = 8, 9, the branches of the tree become correct. We list the RF distances between the phylogenetic tree constructed by our method at K = 5, 6, 7, 8, 9 and the reference tree constructed by ClustalX in Table 3. From Table 3, we can see that the RF distance reaches the minimum when K = 8. We show the phylogenetic tree of K = 8 constructed by our method in Figure 1B. From Figure 1B, we can see that the species in the three main categories are grouped correctly. Primates and ferungulates are closer, and this relationship is consistent with that in Figure 1A. In terms of branches, monotremes (platypus), marsupials (wallaroo, opossum), murid rodents (mouse, rat), non-murid rodents (guinea pig, squirrel, fat dormouse, rabbit), perissodactyls (white rhinoceros, horse, Indian rhinoceros, donkey), carnivores (harbor seal, dog, gray seal, cat), artiodactyls (sheep, cow, hippopotamus, pig), primates (human, pigmy chimpanzee, common chimpanzee, gorilla, baboon, gibbon, orangutan), and cetaceans (blue whale, fin whale) are grouped into respective taxonomic classes accurately.
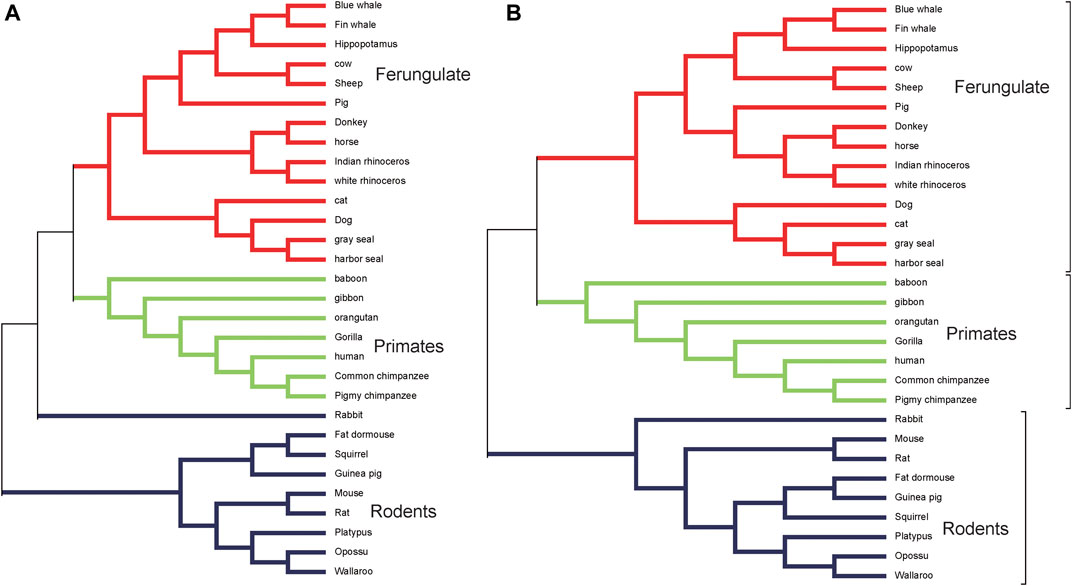
FIGURE 1. (A) The phylogenetic tree of 30 mammalian species reconstructed by ClustalX. (B) The phylogenetic tree of 30 mammalian species at K = 8 based on our method.

TABLE 3. The RF distance between the phylogenetic tree conducted by our method at K = 5,6,7,8,9 and the reference tree conducted by ClustalX.
Figure 2 shows the RF distance between the reference tree constructed by ClustalX and the phylogenetic tree constructed by our method, Tang’s method, PWKmer, DLtree, and CVtree on dataset 1. Using our method, when K = 8, the RF distance is 8. The shortest RF distance of DLtree (K = 9) is 10, the shortest distance of CVtree (K = 9) is 16, the shortest distance of Tang’s method (K = 7) is 16, and the shortest distance of PWKmer (K = 9) is 10. Therefore, the results of our method are closer to those of ClustalX than those of the other methods, which indicates that our method is effective.

FIGURE 2. The Robinson–Foulds distance between the tree reconstructed by ClustalX method and the phylogenetic trees reconstructed by our method (IEPWRMkmer K = 8), the CVTree method, the DLTree method, Tang’s method (K = 7), and the PWKmer method (K = 9) on dataset 1 (we used the optimal tree by CVTree and DLTree).
Figure 3 shows the consensus tree of 30 mammalian species based on our method. Compared with Figure 1B, 30 mammalian species are divided into the rodents group, the ferungulates group, and the primates group correctly. The support rate is 80% for the rodents group and 100% for both ferungulates and primates groups. Among the branches, marsupials (opossum, wallaroo), carnivores (dog, cat, harbor seal, gray seal), murid roots (rat, mouse), and cetaceans (fin whale, blue whale) are all supported by a 100% rate. In the artiodactyls group (cow, sheep, pig, hippopotamus), pig is separated out of the artiodactyls group, but the support rate is low at 43%. It indicates that the phylogenetic tree constructed by our method is quite robust.

FIGURE 3. The modified bootstrap consensus tree for Figure 1B based on 100 replicates.
Experiment 2
The human immunodeficiency viruses (HIV) represent a group of retroviruses, which are not presumed to have originated from human cellular DNA sequences, hence are distinct from endogenous retroviruses (Wu et al., 2007). HIV-1 can be classified into three major phylogenetic groups, namely M (major), N (new), and O (others). Group M is responsible for the HIV pandemic, it is divided into nine subtypes, namely A, B, C, D, F, G, J, K, and H. Based on differential phylogenetic clustering, the subtypes A and F are further divided into sub-subtypes (A1, A2) and (F1, F2), respectively. Groups N and O are derived from other primates and then infect humans. CPZ is a non-human primate virus isolated from chimpanzees, which is closest to human-to-human transmission of HIV.
We performed the phylogenetic analysis of 44 HIV-1 complete genome sequences in dataset 2 using ClustalX and our method. The phylogenetic trees reconstructed by ClustalX and our method (K = 7) are shown in Figure 4A and Figure 4B, respectively. From Figure 4B, we can see that the species from all subtypes can be correctly classified into their groups (A, B, C, D, F, G, J, K, H, O, and M), and CPZ as the reference sequence is separated into the outermost. From the internal branches, both F and A contain two subtypes (F1 and F2) and (A1 and A2), respectively. Our method can separate the two subtypes, and in the branches, both F and A subtypes can be closely grouped together.
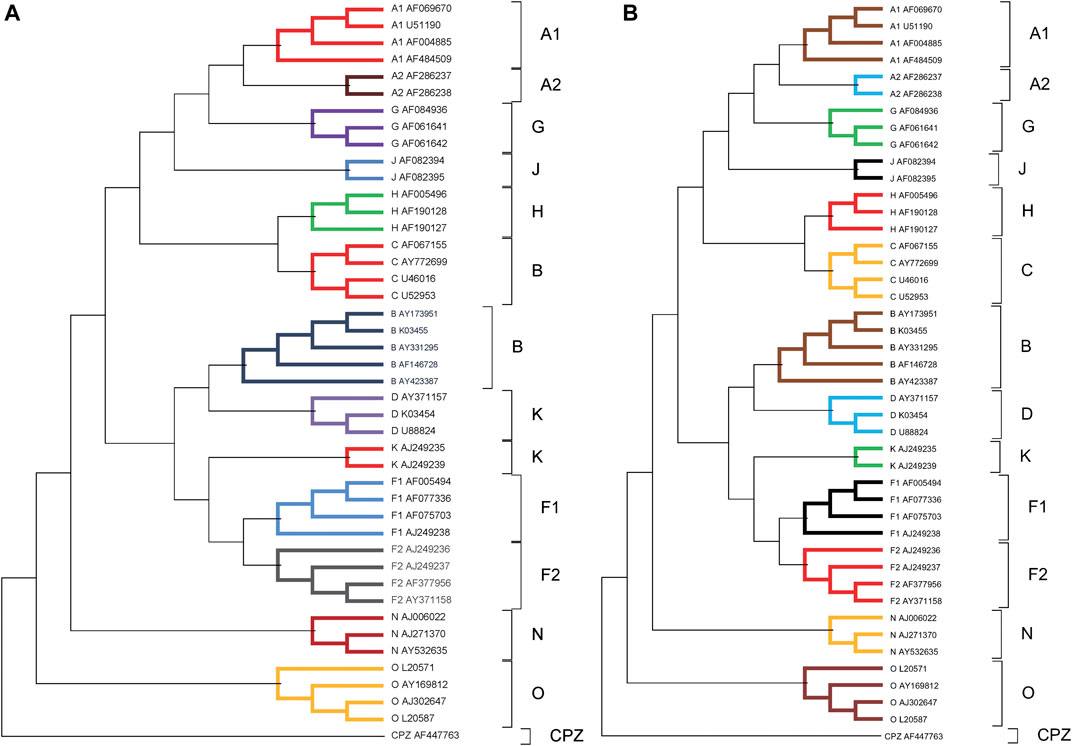
FIGURE 4. (A) The phylogenetic tree of 44 HIV-1 genomes reconstructed by ClustalX. (B) The phylogenetic tree of 44 HIV-1 genomes reconstructed by our method (K = 7).
Figure 5 shows the RF distances between the reference tree constructed by ClustalX and the phylogenetic trees constructed by our method, Tang’s method, PWKmer, DLtree, and CVtree. Using our method, when K = 7, the RF distance is 10. The shortest RF distance of the DLtree (K = 11) is 12, the shortest distance of the CVtree (K = 9) is 16, the shortest distance of the PWKmer (K =9) is 10, and the shortest distance of Tang’s method (K = 9) is 10. Therefore, our method performs better than the DLtree and the CVtree on dataset 2 and has the same performance as Tang’s method and PWKmer. The results indicate that our method is quite effective again.
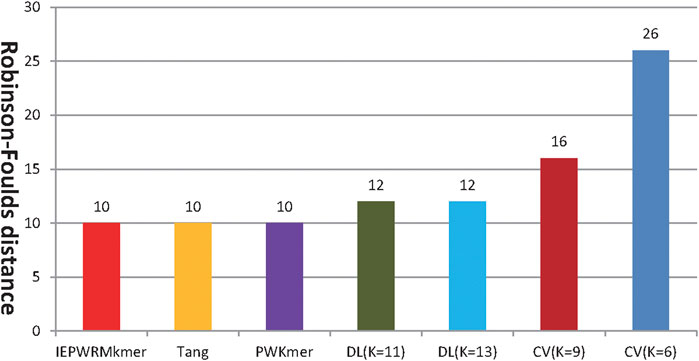
FIGURE 5. The RF distance between the reference tree constructed by Clustalx and the phylogenetic trees constructed by our method (IEPWRMkmer, K = 7), Tang’s method (K = 8), the PWKmer method (K = 9), the DLtree method, and the CVtree method. (For the PWKmer method, the DLtree method, and the CVtree method, we chose their optimal classification tree).
Figure 6 shows the consensus tree of 44 HIV-1 based on our method. Comparing with Figure 4B, all HIV-1 sequences are divided into the M, N, O, and CPZ groups, whose support rate is 100%. From the branch point of view, in group M, the branch support rate of all subtypes is 100%. For subtypes A and F, the subtypes (A1, A2) and (F1 and F2) are clustered with 100% support. It again indicates that the phylogenetic tree constructed by our method is quite robust.
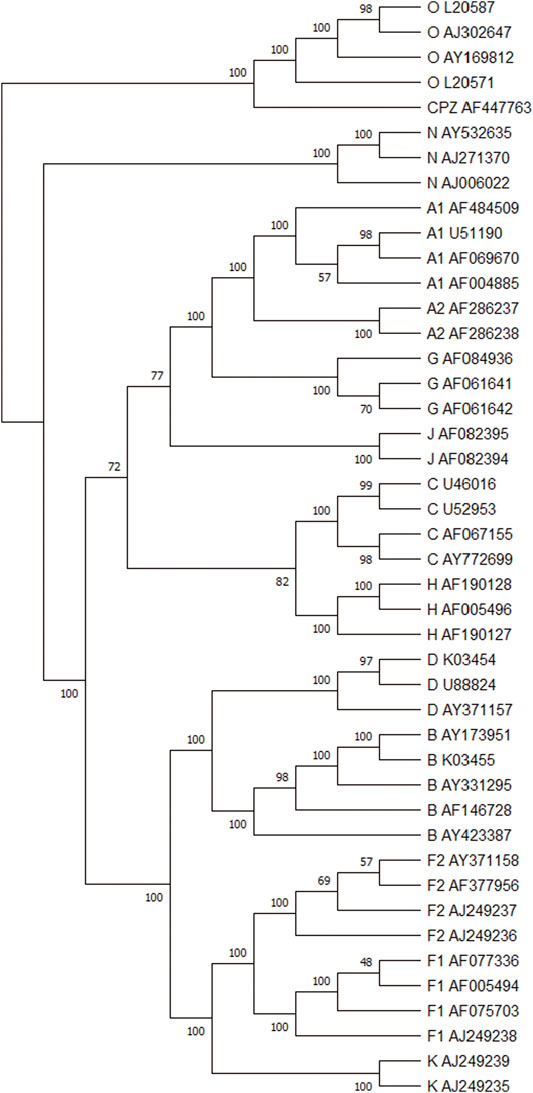
FIGURE 6. The modified bootstrap consensus tree for Figure 4B based on 100 replicates.
Estimate of the Optimal Parameter K
Different lengths of k-mers contain different phylogenetic information. Short k-mers may not contain sufficient DNA sequence information. Long k-mers contain sufficient phylogenetic information, but it needs large memory and takes a long time to calculate the distance based on information on long k-mers. Therefore, it is also very important to estimate an optimal value of K as heralded in (Yu et al., 2010) for the DLTree method and (Qi et al., 2004) for the CVTree method.
In this paper, we propose to use the Shannon entropy of the feature matrix to determine the optimal value of K. Using Eq. 3, we can obtain an N
The optimal K is the value at which
We use Eq. 5 to calculate
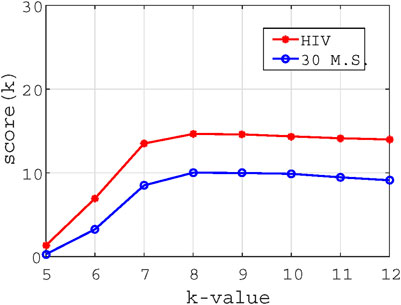
FIGURE 7. The trend chart of K value vs scoring measure
Conclusion
In this paper, a new alignment-free method is proposed for phylogenetic analysis and sequence comparison based on whole genome sequences. Our method combines the position-weighted measure of k-mers and the information entropy of frequency of k-mers. We used the Manhattan metric to measure the distance between a pair of sequences and the NJ method to construct the phylogenetic tree. In order to test the effectiveness and reliability of our method, we applied it on two datasets of 30 mammalian species and 44 HIV-1 genomes. The results demonstrated that the present method is efficient and reliable. A suitable K value is important to capture rich phylogenetic information of DNA sequences. In order to choose an optimal K value, we proposed a scoring measure based on the information entropy. The obtained results on two real datasets support that the method can capture the k-mer distribution information and is effective for whole genome sequence comparison and phylogenetic analysis.
Remark: The method of this paper is derived from the two studies Ma et al. (2020) and Murray et al. (2017). There are differences between this work and previous works: Tang et al. presented the average relative distance for normalized k-mers. PWKmer uses the counts and position distributions of k-mers to capture more evolutionary information. KWIP (Murray et al. 2017) uses information entropy to weight the inner product (Si
Data Availability Statement
The genome datasets analyzed for this study can be found in the GenBank https://www.ncbi.nlm.nih.gov/
Author Contributions
Y-QW contributed to the conception and design of the study, developed the method, and wrote the manuscript. Z-GY gave the ideas and supervised the project. All authors discussed the results and reviewed the manuscript. All authors have read and agreed to the published version of the manuscript.
Funding
This work was supported by funds from the National Natural Science Foundation of China (grant numbers: 11871061 and 12026213); The National Key Research and Development Program of China (grant number: 2020YFC0832405); Innovation Foundation of Qian Xuesen Laboratory of Space Technology.
Conflict of Interest
The authors declare that the research was conducted in the absence of any commercial or financial relationships that could be construed as a potential conflict of interest.
Publisher’s Note
All claims expressed in this article are solely those of the authors and do not necessarily represent those of their affiliated organizations, or those of the publisher, the editors, and the reviewers. Any product that may be evaluated in this article, or claim that may be made by its manufacturer, is not guaranteed or endorsed by the publisher.
References
Altschul, S. F., Gish, W., Miller, W., Myers, E. W., and Lipman, D. J. (1990). Basic Local Alignment Search Tool. J. Mol. Biol. 215 (3), 403–410. doi:10.1016/S0022-2836(05)80360-2
Blaisdell, B. E. (1986). A Measure of the Similarity of Sets of Sequences Not Requiring Sequence Alignment. Proc. Natl. Acad. Sci. 83 (14), 5155–5159. doi:10.1073/pnas.83.14.5155
Chang, G., Wang, H., and Zhang, T. (2014). A Novel Alignment-free Method for Whole Genome Analysis: Application to HIV-1 Subtyping and HEV Genotyping. Inf. Sci. 279, 776–784. doi:10.1016/j.ins.2014.04.029
Comin, M., and Verzotto, D. (2012). Alignment-free Phylogeny of Whole Genomes Using Underlying Subwords. Algorithms Mol. Biol. 7 (1), 1–12. doi:10.1186/1748-7188-7-34
Ding, S., Li, Y., Yang, X., and Wang, T. (2013). A Simple K-word Interval Method for Phylogenetic Analysis of DNA Sequences. J. Theor. Biol. 317, 192–199. doi:10.1016/j.jtbi.2012.10.010
Felsenstein, J., and Felenstein, J. (2004). Inferring Phylogenies. (Sunderland, MA: Sinauer Associates). doi:10.1086/383584
Fox, G. E., Magrum, L. J., Balch, W. E., Wolfe, R. S., and Woese, C. R. (1977). Classification of Methanogenic Bacteria by 16S Ribosomal RNA Characterization. Proc. Natl. Acad. Sci. 74 (10), 4537–4541. doi:10.1073/pnas.74.10.4537
Haubold, B., Pierstorff, N., Möller, F., and Wiehe, T. (2005). Genome Comparison without Alignment Using Shortest Unique Substrings. BMC Bioinformatics 6 (1), 123–211. doi:10.1186/1471-2105-6-123
Hoang, T., Yin, C., and Yau, S. S.-T. (2016). Numerical Encoding of DNA Sequences by Chaos Game Representation with Application in Similarity Comparison. Genomics 108, 134–142. doi:10.1016/j.ygeno.2016.08.002
Höhl, M., Rigoutsos, I., and Ragan, M. A. (2006). Pattern-based Phylogenetic Distance Estimation and Tree Reconstruction. Evol. Bioinformatics 2, 359–375. doi:10.2174/157489306775330570
Huang, Y., and Wang, T. (2011). Phylogenetic Analysis of DNA Sequences with a Novel Characteristic Vector. J. Math. Chem. 49 (8), 1479–1492. doi:10.1007/s10910-011-9811-x
Kumar, S., Stecher, G., and Tamura, K. (2016). MEGA7: Molecular Evolutionary Genetics Analysis Version 7.0 for Bigger Datasets. Mol. Biol. Evol. 33 (7), 1870–1874. doi:10.1093/molbev/msw054
Larkin, M. A., Blackshields, G., Brown, N. P., Chenna, R., McGettigan, P. A., McWilliam, H., et al. (2007). Clustal W and Clustal X Version 2.0. Bioinformatics 23 (21), 2947–2948. doi:10.1093/bioinformatics/btm404
Leimeister, C.-A., Boden, M., Horwege, S., Lindner, S., and Morgenstern, B. (2014). Fast Alignment-free Sequence Comparison Using Spaced-word Frequencies. Bioinformatics 30, 1991–1999. doi:10.1093/bioinformatics/btu177
Li, M., Badger, J. H., Chen, X., Kwong, S., Kearney, P., and Zhang, H. (2001). An Information-Based Sequence Distance and its Application to Whole Mitochondrial Genome Phylogeny. Bioinformatics 17 (2), 149–154. doi:10.1093/bioinformatics/17.2.149
Ma, Y., Yu, Z., Tang, R., Xie, X., Han, G., and Anh, V. V. (2020). Phylogenetic Analysis of HIV-1 Genomes Based on the Position-Weighted K-Mers Method. Entropy 22 (2), 255. doi:10.3390/e22020255
Mendizabal-Ruiz, G., Román-Godínez, I., Torres-Ramos, S., Salido-Ruiz, R. A., Vélez-Pérez, H., and Morales, J. A. (2018). Genomic Signal Processing for DNA Sequence Clustering. PeerJ 6 (3), e4264. doi:10.7717/peerj.4264
Morrison, D. A. (2006). Multiple Sequence Alignment for Phylogenetic Purposes. Aust. Syst. Bot. 19 (6), 479–539. doi:10.1071/sb06020
Murray, K. D., Webers, C., Ong, C. S., Borevitz, J., and Warthmann, N. (2017). KWIP: The K-Mer Weighted Inner Product, a De Novo Estimator of Genetic Similarity. Plos Comput. Biol. 13 (9), e1005727. doi:10.1371/journal.pcbi.1005727
Otu, H. H., and Sayood, K. (2003). A New Sequence Distance Measure for Phylogenetic Tree Construction. Bioinformatics 19 (16), 2122–2130. doi:10.1093/bioinformatics/btg295
Qi, J., Luo, H., and Hao, B. (2004). CVTree: a Phylogenetic Tree Reconstruction Tool Based on Whole Genomes. Nucleic Acids Res. 32 (Suppl. l_2), W45–W47. doi:10.1093/nar/gkh362
Robinson, D. F., and Foulds, L. R. (1981). Comparison of Phylogenetic Trees. Math. Biosciences 53 (1-2), 131–147. doi:10.1016/0025-5564(81)90043-2
Ronquist, F., Teslenko, M., Van Der Mark, P., Ayres, D. L., Darling, A., Höhna, S., et al. (2012). MrBayes 3.2: Efficient Bayesian Phylogenetic Inference and Model Choice across a Large Model Space. Syst. Biol. 61 (3), 539–542. doi:10.1093/sysbio/sys029
Saitou, N., and Nei, M. (1987). The Neighbor-Joining Method: a New Method for Reconstructing Phylogenetic Trees. Mol. Biol. Evol. 4 (4), 406–425. doi:10.1093/oxfordjournals.molbev.a040454
Sims, G. E., Jun, S.-R., Wu, G. A., and Kim, S.-H. (2009). Alignment-free Genome Comparison with Feature Frequency Profiles (FFP) and Optimal Resolutions. Pnas 106 (8), 2677–2682. doi:10.1073/pnas.0813249106
Tang, J., Hua, K., Chen, M., Zhang, R., and Xie, X. (2014). A Novel K-word Relative Measure for Sequence Comparison. Comput. Biol. Chem. 53, 331–338. doi:10.1016/j.compbiolchem.2014.10.007
Thankachan, S. V., Chockalingam, S. P., Liu, Y., Apostolico, A., and Aluru, S. (2016). ALFRED: a Practical Method for Alignment-free Distance Computation. J. Comput. Biol. 23 (6), 452–460. doi:10.1089/cmb.2015.0217
Thompson, J. D., Higgins, D. G., and Gibson, T. J. (1994). CLUSTAL W: Improving the Sensitivity of Progressive Multiple Sequence Alignment through Sequence Weighting, Position-specific gap Penalties and Weight Matrix Choice. Nucl. Acids Res. 22 (22), 4673–4680. doi:10.1093/nar/22.22.4673
Ulitsky, I., Burstein, D., Tuller, T., and Chor, B. (2006). The Average Common Substring Approach to Phylogenomic Reconstruction. J. Comput. Biol. 13 (2), 336–350. doi:10.1089/cmb.2006.13.336
Wang, Y., Lei, X., Wang, S., Wang, Z., Song, N., Zeng, F., et al. (2016). Effect of K-Tuple Length on Sample-Comparison with High-Throughput Sequencing Data. Biochem. Biophysical Res. Commun. 469 (4), 1021–1027. doi:10.1016/j.bbrc.2015.11.094
Wu, Q., Yu, Z.-G., and Yang, J. (2017). DLTree: Efficient and Accurate Phylogeny Reconstruction Using the Dynamical Language Method. Bioinformatics 33 (14), 2214–2215. doi:10.1093/bioinformatics/btx158
Wu, X., Cai, Z., Wan, X.-F., Hoang, T., Goebel, R., and Lin, G. (2007). Nucleotide Composition String Selection in HIV-1 Subtyping Using Whole Genomes. Bioinformatics 23 (14), 1744–1752. doi:10.1093/bioinformatics/btm248
Yin, C. (2019). Encoding and Decoding DNA Sequences by Integer Chaos Game Representation. J. Comput. Biol. 26 (2), 143–151. doi:10.1089/cmb.2018.0173
Yu, C., Deng, M., and Yau, S. S.-T. (2011). DNA Sequence Comparison by a Novel Probabilistic Method. Inf. Sci. 181 (8), 1484–1492. doi:10.1016/j.ins.2010.12.010
Yu, Z.-G., Chu, K. H., Li, C. P., Anh, V., Zhou, L.-Q., and Wang, R. W. (2010). Whole-proteome Phylogeny of Large dsDNA Viruses and Parvoviruses through a Composition Vector Method Related to Dynamical Language Model. BMC Evol. Biol. 10 (1), 1–11. doi:10.1186/1471-2148-10-192
Yu, Z.-G., Zhan, X.-W., Han, G.-S., Wang, R. W., Anh, V., and Chu, K. H. (2010). Proper Distance Metrics for Phylogenetic Analysis Using Complete Genomes without Sequence Alignment. Ijms 11 (3), 1141–1154. doi:10.3390/ijms11031141
Keywords: alignment-free method, k-mer relative distance, information entropy, phylogenetic analysis, genome
Citation: Wu Y-Q, Yu Z-G, Tang R-B, Han G-S and Anh VV (2021) An Information-Entropy Position-Weighted K-Mer Relative Measure for Whole Genome Phylogeny Reconstruction. Front. Genet. 12:766496. doi: 10.3389/fgene.2021.766496
Received: 29 August 2021; Accepted: 29 September 2021;
Published: 22 October 2021.
Edited by:
Juan Wang, Inner Mongolia University, ChinaCopyright © 2021 Wu, Yu, Tang, Han and Anh. This is an open-access article distributed under the terms of the Creative Commons Attribution License (CC BY). The use, distribution or reproduction in other forums is permitted, provided the original author(s) and the copyright owner(s) are credited and that the original publication in this journal is cited, in accordance with accepted academic practice. No use, distribution or reproduction is permitted which does not comply with these terms.
*Correspondence: Zu-Guo Yu, eXV6dWd1b0BhbGl5dW4uY29t
 Yao-Qun Wu
 Zu-Guo Yu
 Run-Bin Tang
 Guo-Sheng Han
 Vo V. Anh3