
95% of researchers rate our articles as excellent or good
Learn more about the work of our research integrity team to safeguard the quality of each article we publish.
Find out more
ORIGINAL RESEARCH article
Front. Genet. , 07 February 2022
Sec. Human and Medical Genomics
Volume 12 - 2021 | https://doi.org/10.3389/fgene.2021.762177
This article is part of the Research Topic Exploring GWAS data by biomolecular network analysis in revealing genetic disease mechanisms View all 7 articles
 Rafiatu Azumah1
 Katja Hummitzsch1
 Monica D. Hartanti1,2
 Justin C. St. John1
 Richard A. Anderson3
 Raymond J. Rodgers1*
Polycystic Ovary Syndrome (PCOS) is a multifactorial syndrome with reproductive, endocrine, and metabolic symptoms, affecting about 10% women of reproductive age. Pathogenesis of the syndrome is poorly understood with genetic and fetal origins being the focus of the conundrum. Genetic predisposition of PCOS has been confirmed by candidate gene studies and Genome-Wide Association Studies (GWAS). Recently, the expression of PCOS candidate genes across gestation has been studied in human and bovine fetal ovaries. The current study sought to identify potential upstream regulators and mechanisms associated with PCOS candidate genes. Using RNA sequencing data of bovine fetal ovaries (62–276 days, n = 19), expression of PCOS candidate genes across gestation was analysed using Partek Flow. A supervised heatmap of the expression data of all 24,889 genes across gestation was generated. Most of the PCOS genes fell into one of four clusters according to their expression patterns. Some genes correlated negatively (early genes; C8H9orf3, TOX3, FBN3, GATA4, HMGA2, and DENND1A) and others positively (late genes; FDFT1, LHCGR, AMH, FSHR, ZBTB16, and PLGRKT) with gestational age. Pathways associated with PCOS candidate genes and genes co-expressed with them were determined using Ingenuity pathway analysis (IPA) software as well as DAVID Bioinformatics Resources for KEGG pathway analysis and Gene Ontology databases. Genes expressed in the early cluster were mainly involved in mitochondrial function and oxidative phosphorylation and their upstream regulators included PTEN, ESRRG/A and MYC. Genes in the late cluster were involved in stromal expansion, cholesterol biosynthesis and steroidogenesis and their upstream regulators included TGFB1/2/3, TNF, ERBB2/3, VEGF, INSIG1, POR, and IL25. These findings provide insight into ovarian development of relevance to the origins of PCOS, and suggest that multiple aetiological pathways might exist for the development of PCOS.
Polycystic Ovary syndrome (PCOS) is a debilitating syndrome with reproductive, endocrine and metabolic symptoms, affecting up to 10% women of reproductive age, with about 72% suffering infertility due to anovulation (Joham et al., 2015). Hyperandrogenism, oligo-/anovulation and the presence of polycystic ovary morphology are the cardinal features of the syndrome. However, hyperinsulinemia, type 2 diabetes mellitus, and obesity are also associated with PCOS [reviewed in detail by Teede et al. (2010)]. Despite the high prevalence of the syndrome, a comprehensive mechanism elucidating its pathophysiology is still lacking. Research efforts to define the pathophysiology of PCOS have increased the scientific conundrum surrounding its developmental origin(s) due to the diverging nature of research outcomes.
The multifactorial aetiology of PCOS has been evident by numerous genomic studies ranging from candidate gene approaches to Genome-Wide Association Studies (GWAS) – confirming its genetic origin. Candidate gene studies have identified androgen receptor (AR) (Schüring et al., 2012), fibrillin 3 (FBN3) (Hatzirodos et al., 2011), and anti-Mullerian hormone (AMH) (Tata et al., 2018) among others to be related to PCOS. GWAS have also identified 19 PCOS susceptibility loci among the Han Chinese, European and Korean ancestry [reviewed in detail by McAllister et al. (2015); Jones and Goodarzi (2016); Hiam et al. (2019)]. More so, the fetal origin of PCOS has been studied in human (Davies et al., 2012; Echiburú et al., 2020; Mills et al., 2020) and animal models including mice (Sullivan and Moenter 2004), rats (Wu et al., 2010), sheep (Birch et al., 2003), and monkeys (Dumesic et al., 1997). The possible fetal predisposition of the syndrome has also been studied further in bovine and human fetal ovaries using qRT-PCR technique (Hartanti et al., 2020; Liu et al., 2020).
Hartanti, et al. (2020), Liu, et al. (2020) showed that all PCOS candidate genes in/near loci identified by GWAS, except small ubiquitin like modifier 1 pseudogene 1 (SUMO1P1), and three additional candidate genes AR, AMH and transforming growth factor beta 1 induced transcript 1 (TGFB1I1) were expressed in human and bovine fetal ovaries. Three distinct expression patterns were observed; some genes were highly expressed during early stages, others during late stages whilst others were expressed throughout gestation (Table 1). Notably, the mRNA levels of genes within the early and late groups significantly correlated with each other as well as mean age (Hartanti, et al., 2020; Liu, et al., 2020). The expression of these PCOS genes during fetal development has provided further insight to the fetal origin of the syndrome; necessitating further studies to delineate its pathophysiology. Thus, the molecular mechanisms and upstream regulators associated with PCOS candidate genes during fetal development that could probably lead to the expression of various phenotypes (such as lean, obese, insulin resistant) during adulthood still remain elusive.
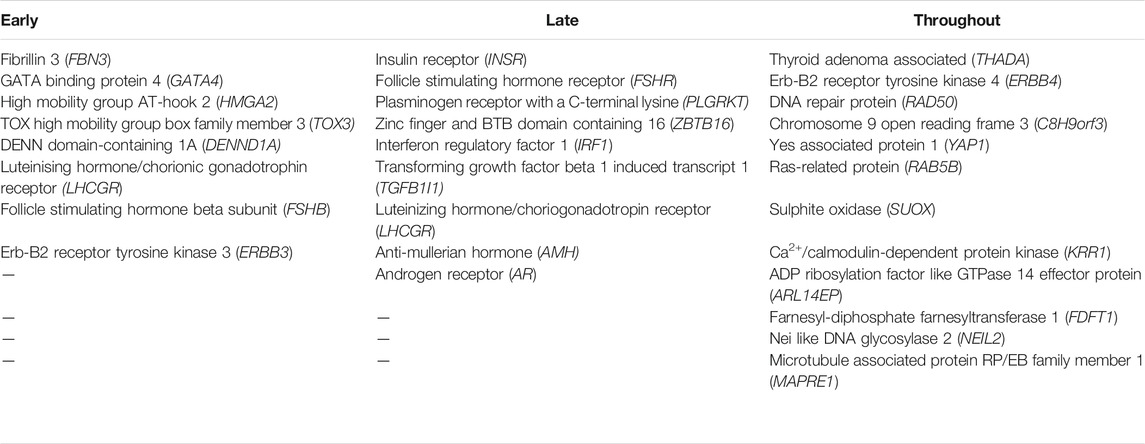
TABLE 1. The three distinct expression patterns of PCOS candidate genes observed during fetal ovary development according to Hartanti, et al. (2020), Liu, et al. (2020); early, late and throughout gestation.
Therefore, there is a need to identify the upstream regulators and pathways that operate when PCOS candidate genes are expressed during normal ovary development. This will provide more insight on the possible perturbations during fetal ovary development that could lead to PCOS in adulthood and also help clarify some of the conundra surrounding the genetic and fetal origins of the disorder. Although studies to delineate the roles of PCOS candidate genes during fetal development are on-going, acquisition of human fetal ovary samples across gestation, especially from the third trimester, is a limitation. Considering the strong similarities between human and bovine ovaries in morphology and physiology, gestational length and the propensity for singleton pregnancies as well as the similarity in expression of PCOS candidate genes between human and bovine during early stages of fetal ovary development (Hartanti, et al., 2020; Liu, et al., 2020), this study seeks to define the upstream regulators and pathways that operate when PCOS candidate genes are expressed (Hartanti, et al., 2020; Liu, et al., 2020) using bovine fetal ovaries.
Fetal ovarian pairs across gestation (62–276 days, n = 19) were collected from pregnant Bos taurus cows at the abattoir of Midfield Meat International, Warrnambool, Victoria, Australia and were immediately frozen on dry ice on site and later stored in the laboratory at −80°C. These ovaries were scavenged from animals that were being processed for human consumption and were not owned by the authors or their institutions. As such the University of Adelaide’s Animal Ethics Committee only requires notification of this. To estimate the gestational age of fetal samples, the crown-rump length (CRL) was measured (Russe 1983).
Genomic DNA was extracted from the tail of fetuses with a CRL <10 cm using the Wizard SV Genomic DNA Purification System (Promega Australia, Alexandria, NSW, Australia) according to the manufacturer’s instructions. Two pairs of primers specific for a region in the Sex determining region Y (SRY) sequence (sense primer: 5′-TCACTCCTGCAAAAGGAGCA-3′, antisense primer: 5′-TTATTGTGGCCCAGGCTTG-3′), and for the 18S ribosomal RNA (18S) gene sequence were used for amplifying the genomic DNA in individual reactions as previously described (Hummitzsch et al., 2013).
Whole fetal bovine ovaries were homogenised in 1 ml Trizol® (Thermo Fisher Scientific, Waltham, MA, United States) using the Mo Bio Powerlyser 24 (Mo Bio Laboratories Inc., Carlsbad, CA, United States) and RNA extracted according to manufacturer’s instructions. All samples were treated with DNase I (Promega/Thermo Fisher Scientific Australia Pty Ltd., Tullmarine, Vic, Australia). The RNA concentration and quality (RQI, Table 2) was then determined using the Experion™ RNA StdSens Analysis kit and the Experion™ Automated Electrophoresis System (Bio-Rad Laboratories Pty., Ltd., Gladesville, NSW, Australia). 500 ng/50 µl per well (96-well plate) of total RNA of each sample was used for RNA-seq.
RNA-seq based transcriptome profiling was performed at the SAHMRI Genomics Facility (SAHMRI, Adelaide, SA, Australia). Briefly, Single-end Poly A-selection mRNA libraries (∼35 M reads per sample) were created using the Nugen Universal Plus mRNA-Seq library kit from Tecan (Mannedorf, Switzerland) and sequenced with an Illumina Nextseq 500 using single read 75 bp (v2.0) sequencing chemistry (Illumina Inc., San Diego, CA, United States). Two sequencing runs, with 10 samples per run, were performed and sample 15/R43t was used as internal control in both runs.
The raw data containing FASTQ files were uploaded to Partek Flow® Software, version 8.0 (Partek Incorporated, St. Louis, Missouri, United States). All samples underwent a pre-alignment quality assessment and showed Phred Quality Scores larger than 30. The reads were aligned and annotated to the bovine genome ARS-UCD1.2 (bosTau9; https://www.ncbi.nlm.nih.gov/assembly/GCF_002263795.1/) using STAR 2.7.3a aligner (>97% alignment rate for all samples) and Partek E/M, respectively. Transcript abundances were determined and expression levels presented as normalised counts per million (CPM). Initial comparison of gene expression profiles in the samples was then carried out using principal components analysis (PCA) (Hotelling 1933).
Normalised RNA-seq data of bovine fetal ovaries across gestation were analysed to study the expression of PCOS candidate genes as well as their associated upstream regulators and mechanisms. The expression of 27 PCOS candidate genes, most of which are located in/near the loci associated with PCOS from previous GWAS, and three additional candidate genes AR, AMH, and TGFB1I1 were analysed using to Partek Flow® Software (version 8.0). Scatter plots showing the expression patterns for each candidate gene across gestation were also generated using GraphPad Prism version 8 (GraphPad Software Inc., La Jolla, Ca, United States). Pearson’s correlation of the genes with each other as well as with gestational age were further analysed. Fold change and statistical significance of PCOS genes across gestation (comparing late versus early) were determined using the default parameters of Gene Specific Analysis (GSA); a multi-model approach based on Akaike Information Criterion (AIC) in Partek Flow®.
A supervised hierarchical clustering (heatmap) of all 24,889 genes identified in the RNA-seq data for all samples across gestation was then carried out; the location of PCOS genes on the heatmap was determined and clusters of PCOS genes as well as genes co-expressed with them were identified. Four clusters associated with the PCOS candidate genes were further studied using the core analysis component of Ingenuity Pathway Analysis (IPA®, QIAGEN Redwood City, CA, United States). The canonical pathways, upstream regulators and networks associated with each cluster were analysed based on the statistical significance (p-value) and fold change (log2 ratio) of its gene list, determined using the default parameters of GSA in Partek Flow®. C9orf3, also known as aminopeptidase (AOPEP) replaced its bovine variant, C8H9orf3, in IPA analysis. For a more in-depth understanding of pathways associated with genes in each of the four clusters, the Database for Annotation, Visualization, and Integrated Discovery (DAVID) Bioinformatics Resources 6.8 (https://david.ncifcrf.gov/home.jsp, Frederick, MD 21702, United States) (Huang et al., 2009; Sherman and Lempicki 2009), was further used to analyse the pathway enrichment of genes for each cluster from Gene Ontology (GO) and Kyoto Encyclopedia of Genes and Genomes (KEGG) databases for bovine organisms.
Expression of PCOS genes across gestation was plotted using GraphPad Prism version 8 (GraphPad Software Inc., La Jolla, CA, United States). PCA and hierarchical clustering were performed using the Euclidian algorithm for dissimilarity with average linkage. Pearson’s correlation table and correlation coefficient (R) generated for scatterplots were determined in Partek Genomic Suite 7.0 (Partek Incorporated, St. Louis, Missouri, United States). The p-value of overlap between a set of significant molecules in each cluster and a given process/pathway/upstream regulator is determined using the Right-Tailed Fisher’s Exact Test in IPA software. The z-score, which considers the directional effect of one molecule on another molecule/process and the direction of change of molecules in the dataset, represents activation when ≥2 and inhibition when ≤ −2. R program, version 4.0.4 was used to plot GO graphs using data from DAVID bioinformatic resources.
The normalised RNA-seq data of bovine fetal ovaries identified 24,889 genes including uncharacterised and non-coding RNA. Principal Component Analysis (PCA) of all the genes in the data clustered the samples into three groups/stages; early I (62–82 days, n = 4), early II (91–135 days, n = 5), and late (154–276 days, n = 10) (Figure 1). For the purposes of this study, the two early groups were combined as “early” (62–135 days, n = 9) and all comparisons across gestation involved late versus early samples.
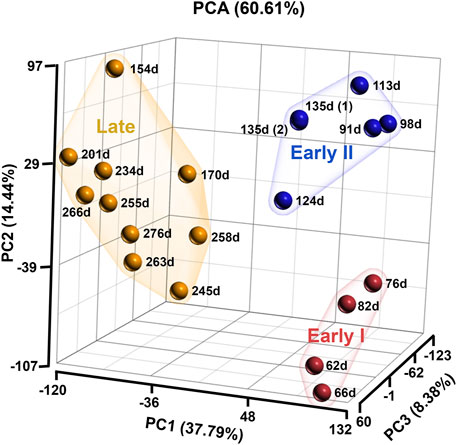
FIGURE 1. Principal Component analysis of bovine ovarian samples analysed in the RNA sequencing. The samples are grouping into three stages; early I (red; 62–82 days, n = 4), early II (blue; 91–135 days, n = 5) and late (orange; 154–276 days, n = 10).
The expression of the 27 PCOS candidate genes identified in the RNA-seq data was studied across gestation. Using Pearson’s correlation, the mRNA expression of these candidate genes across gestation showed three patterns; early, late, and throughout gestation. Thus, some PCOS candidate genes correlate significantly with gestational age negatively whilst others positively (Table 3). Genes that correlate negatively with gestational age, and therefore named “early” genes, correlate positively with each other, whilst those that correlate positively with gestational age, named “late” genes, correlate positively with each other but negatively with the “early” genes. Thus, according to this study, the “early” genes consist of C8H9orf3, ARL14EP, MAPRE1, TOX3, FBN3, GATA4, HMGA2, and DENND1A; the “late” genes include YAP1, INSR, THADA, TGFB1I1, ZBTB16, IRF1, LHCGR, FSHR, AMH, and PLGRKT; whilst genes expressed throughout gestation are NEIL2, RAB5B, KRR1, SUOX, FDFT1, ERBB3, AR, ERBB4, and RAD50 (Table 3). Also, Gene Specific Analysis (GSA) comparing the expression of these candidate genes across gestation showed significant fold change across gestation; 14 of the genes were up-regulated and 13 down-regulated with significance at p ≤ 0.05 for most candidate genes as shown in Supplementary Table S1. In addition to the “early” and “late” genes identified using Pearson’s correlation, other genes that correlate significantly with gestational age according to GSA are; ERBB3 (negatively) as well as AR and ERBB4 (positively); see Supplementary Table S1, Supplementary Figure S1.
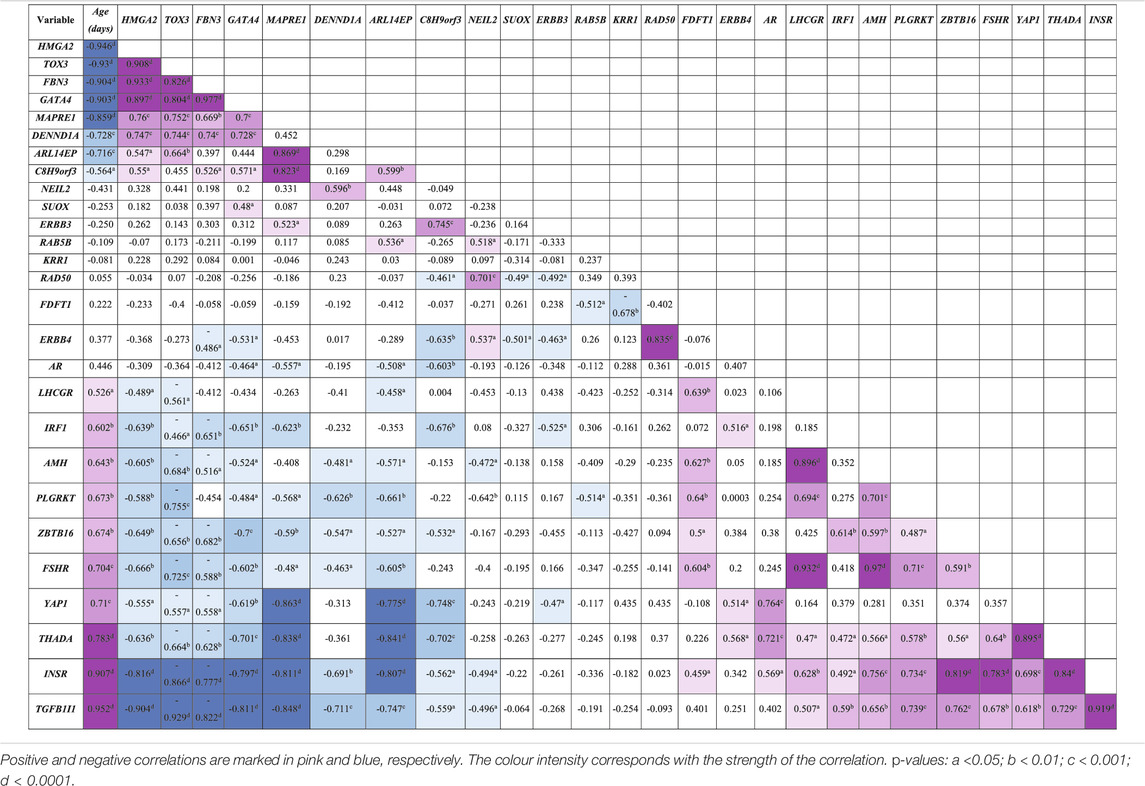
TABLE 3. Pearson’s correlation coefficients (R) between PCOS candidate genes mRNA expression levels and gestational age (n = 19) in bovine fetal ovaries.
A supervised hierarchical clustering of all 24,889 genes showed that most PCOS candidate genes formed close clusters with each other according to the patterns earlier observed. Thus, most of the PCOS candidate genes that correlate significantly with each other in Table 3 formed clusters closely with each other on the heatmap (Figure 2). Two strong clusters and two weak clusters were formed. The strong clusters contain “early” genes (cluster 1); C8H9orf3, TOX3, FBN3, GATA4, HMGA2, and DENND1A and “late” genes (cluster 4); FDFT1, LHCGR, AMH, FSHR, ZBTB16 and PLGRKT (Figure 2). The two weak clusters comprised of “late” genes (cluster 2), YAP1, INSR, THADA, and TGFB1I1 and genes expressed throughout gestation (cluster 3), RAD50, NEIL2, and ERBB4. It is worth noting that although FDFT1 does not correlate significantly with gestational age, it correlates significantly with most of the genes in cluster 4 according to the Pearson’s correlation (Table 3). Fold change and statistical significance were determined for the gene list of each of the clusters which were composed of PCOS candidate genes as well as the genes co-expressed with them (Supplementary Tables S2–S5). They were mapped to the IPA knowledge base and DAVID bioinformatics database to identify the canonical pathways, upstream regulators and networks associated with each cluster.
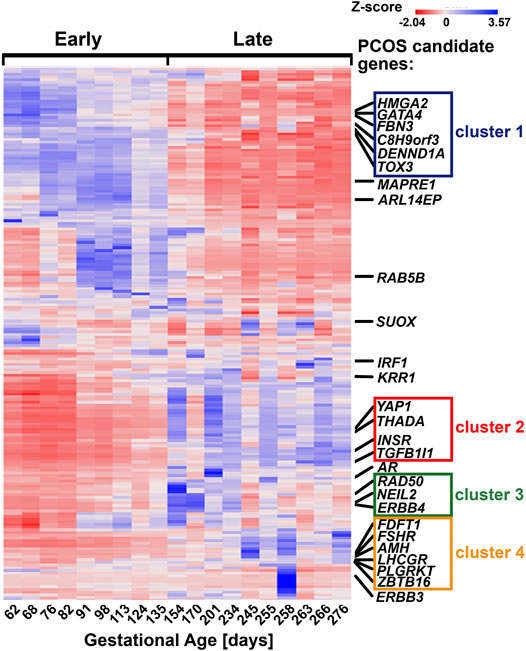
FIGURE 2. Location of PCOS candidate genes and their respective clusters on the supervised heatmap of 24,889 genes identified in the fetal ovaries (62–276 days, n = 19) using RNA sequencing. Each cluster is made up of PCOS candidate genes as well as genes co-expressed with them; detailed lists of each cluster can be found in Supplementary Tables S2–S5.
The findings of this study were then aligned with the developmental stages of the ovary. Both IPA and GO (biological processes) analyses of each cluster revealed relevant and similar canonical pathways to be associated with genes co-expressed with PCOS candidate genes across gestation. The top canonical pathways associated with the “early” genes (cluster 1) are mainly involved in mitochondrial function (Figure 3) whilst “late” genes were involved in stromal development and expansion (cluster 2) and lipid biosynthesis/steroidogenesis (cluster 4) (Figures 4, 5). Cluster 3, which consists of genes expressed throughout gestation, seems to be associated with a range of different pathways including central nervous system regulation and signalling among others (Figure 6). These pathways were also observed to some extent in the GO and KEGG pathway analysis for each cluster; with the strongest similarities to IPA observed in clusters 1 and 4 for mitochondrial function and steroidogenesis, respectively (Supplementary Tables S6–S9). Also, the number of genes extracted from each of these clusters as well as those that map to the IPA knowledge base and DAVID bioinformatic database for each cluster are shown in Supplementary Table S10.
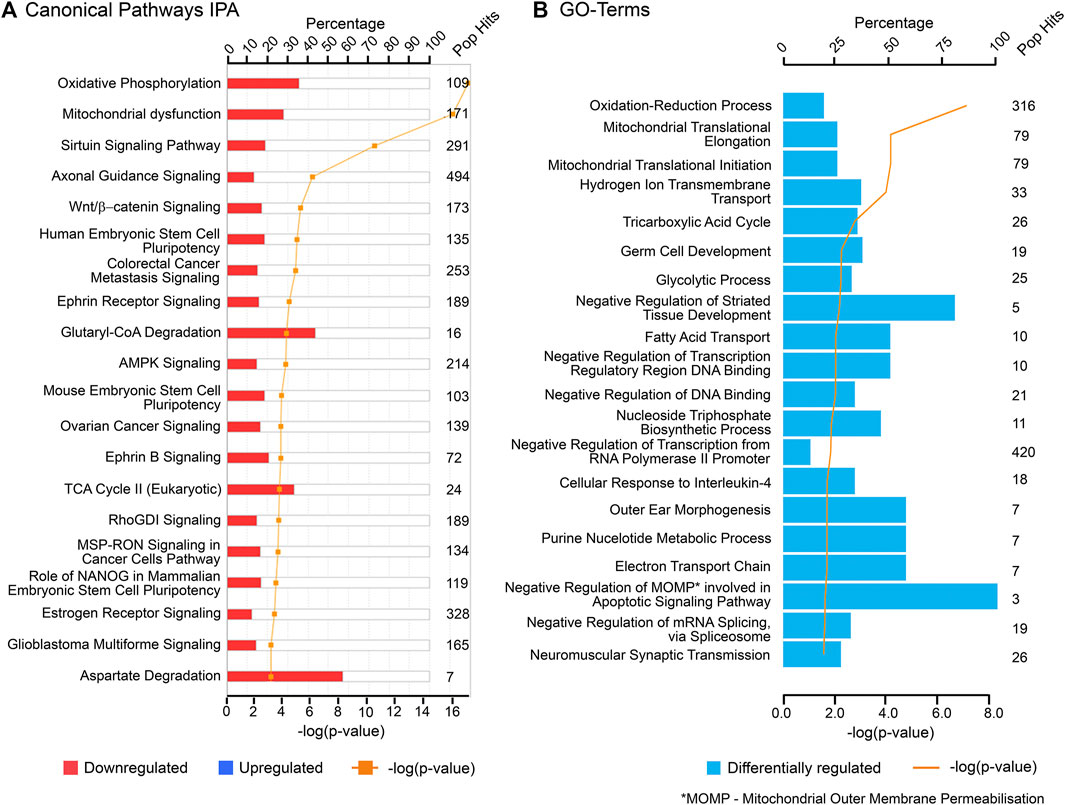
FIGURE 3. Top canonical pathways associated with cluster 1 (“early” genes) using (A) Ingenuity Pathway Analysis (IPA) and (B) Gene Ontology (GO) biological processes from DAVID database. “Pop Hits” refers to the total number of genes associated with each of the pathway in the database. The bar graphs represent the percentage of genes from the data set that map to each canonical pathway whilst the orange line shows the p-value of overlap between genes in each cluster and a given pathway.
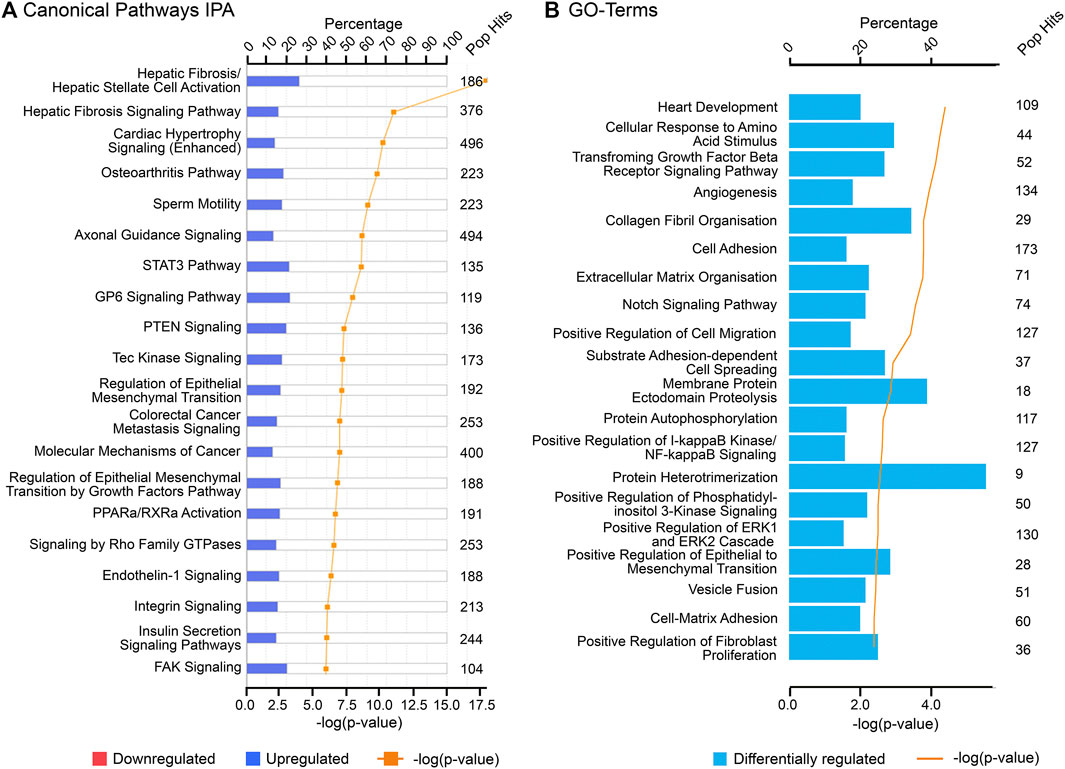
FIGURE 4. Top canonical pathways associated with cluster 2 (“late” genes) using (A) Ingenuity Pathway Analysis (IPA) and (B) Gene Ontology (GO), biological processes from DAVID database. “Pop Hits” refers to the total number of genes associated with each of the pathway in the database. The bar graphs represent the percentage of genes from the data set that map to each canonical pathway whilst the orange line shows the p-value of overlap between genes in each cluster and a given pathway.
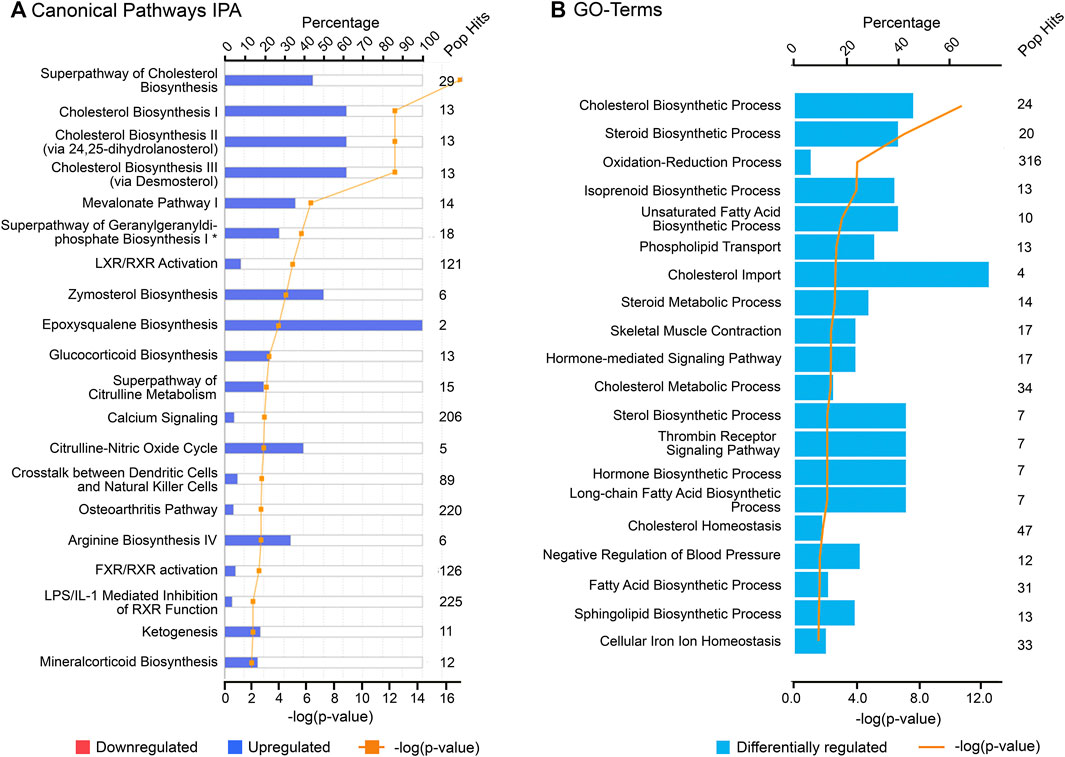
FIGURE 5. Top canonical pathways associated with cluster 4 (“late” genes) using (A) Ingenuity Pathway Analysis (IPA) and (B) Gene Ontology (GO), biological processes from DAVID database. “Pop Hits” refers to the total number of genes associated with each of the pathway in the database. The bar graphs represent the percentage of genes from the data set that map to each canonical pathway whilst the orange line shows the p-value of overlap between genes in each cluster and a given pathway.
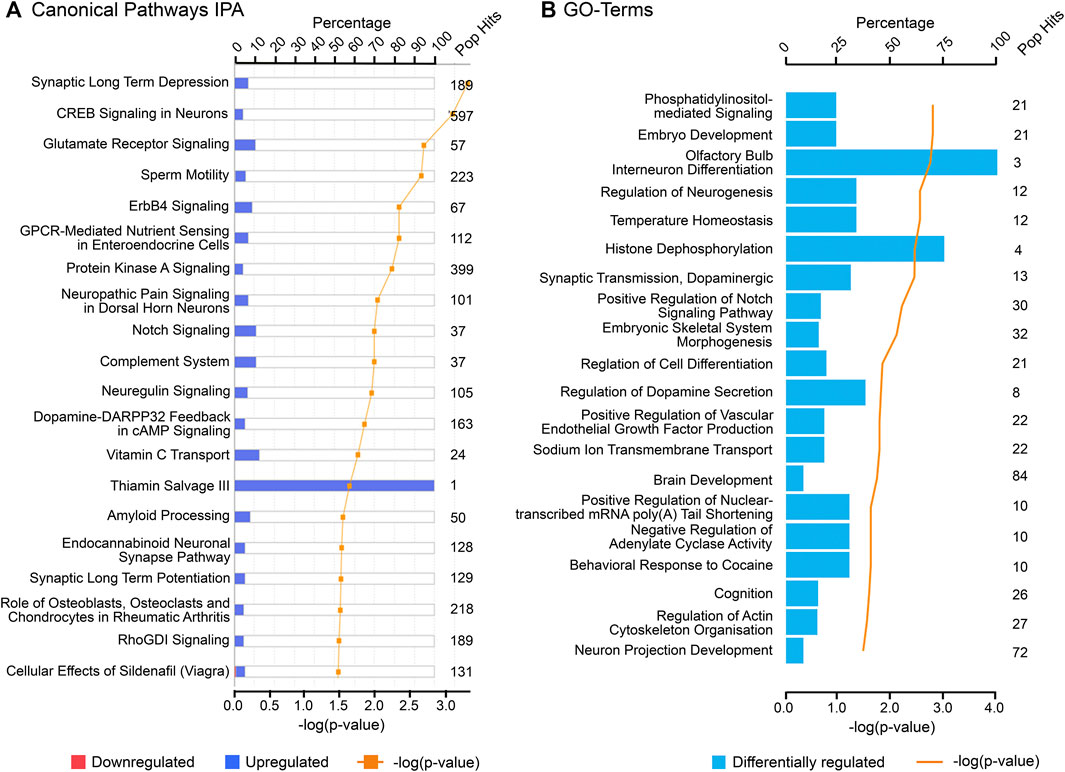
FIGURE 6. Top canonical pathways associated with cluster 3 (“throughout” genes) using (A) Ingenuity Pathway Analysis (IPA) and (B) Gene Ontology (GO), biological processes from DAVID database. “Pop Hits” refers to the total number of genes associated with each of the pathway in the database. The bar graphs represent the percentage of genes from the data set that map to each canonical pathway whilst the orange line shows the p-value of overlap between genes in each cluster and a given pathway.
Top biological upstream regulators associated with the strong clusters 1 and 4 and the weak clusters 2 and 3 were identified using IPA and are shown in Tables 4, 5, respectively. Upstream regulators such as TGFβ, TNF, angiotensin, ESR1, among others were common to the “late” clusters 2 and 4. Upstream regulators such as PTEN, HNF4A, ESRRA/G, PSEN1, MYC, mitochondrial LONP1, and TP53 among others were associated with cluster 1 whereas HNF1A, GATA2, PSENEN, IL25, REST, OCT4-NANOG, APHIA, and AGRN were associated with cluster 3. Chemical upstream regulators (including endogenous molecules) associated with each cluster was also studied. The list of the top chemical (including endogenous molecules) upstream regulators associated with each cluster are detailed in Supplementary Tables S11, S12. Estradiol is among the top chemical upstream regulators associated with certain genes in clusters 1, 2, and 4 while dexamethasone regulates some genes in cluster 2 and 4 among others.
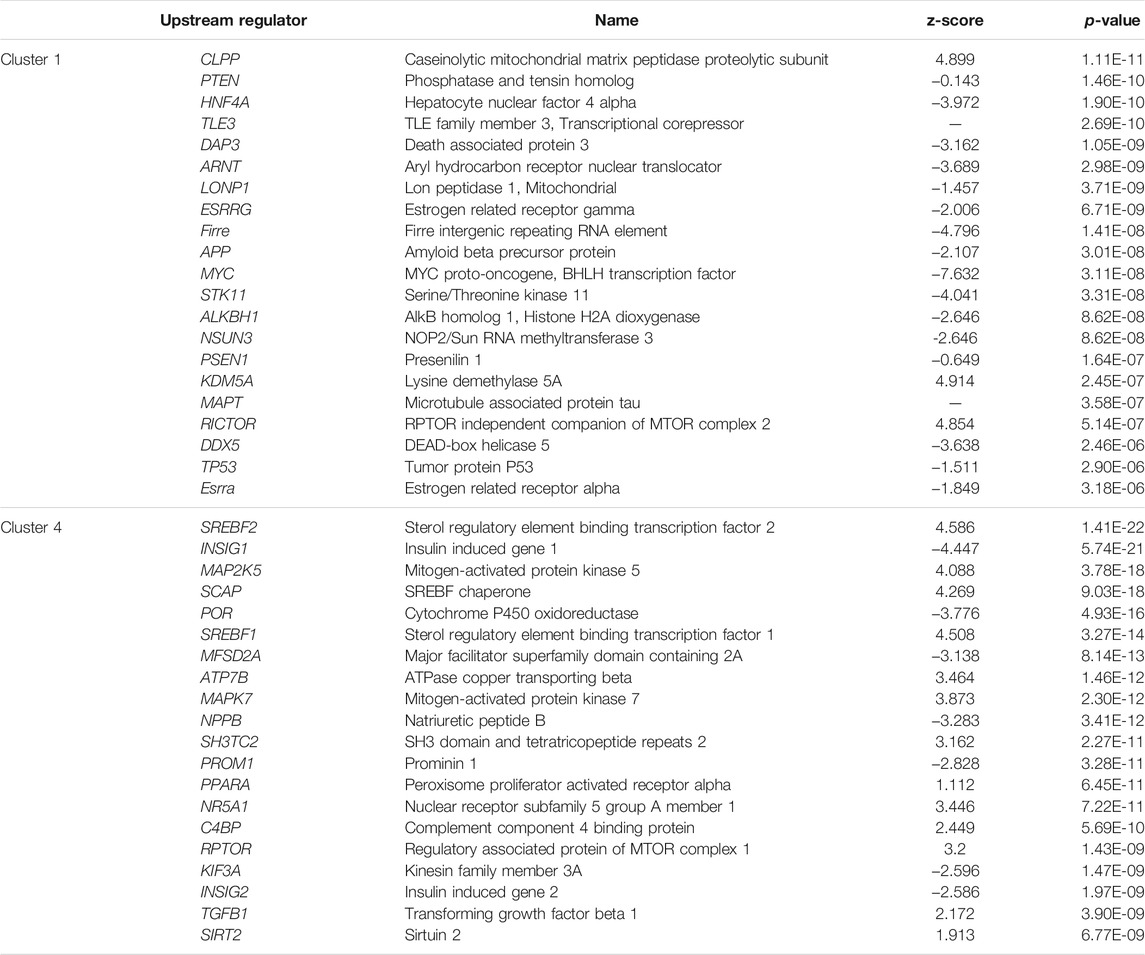
TABLE 4. Top biological upstream regulators and their respective activation z-score as well as p-value of association for the strong clusters, cluster 1 and 4.
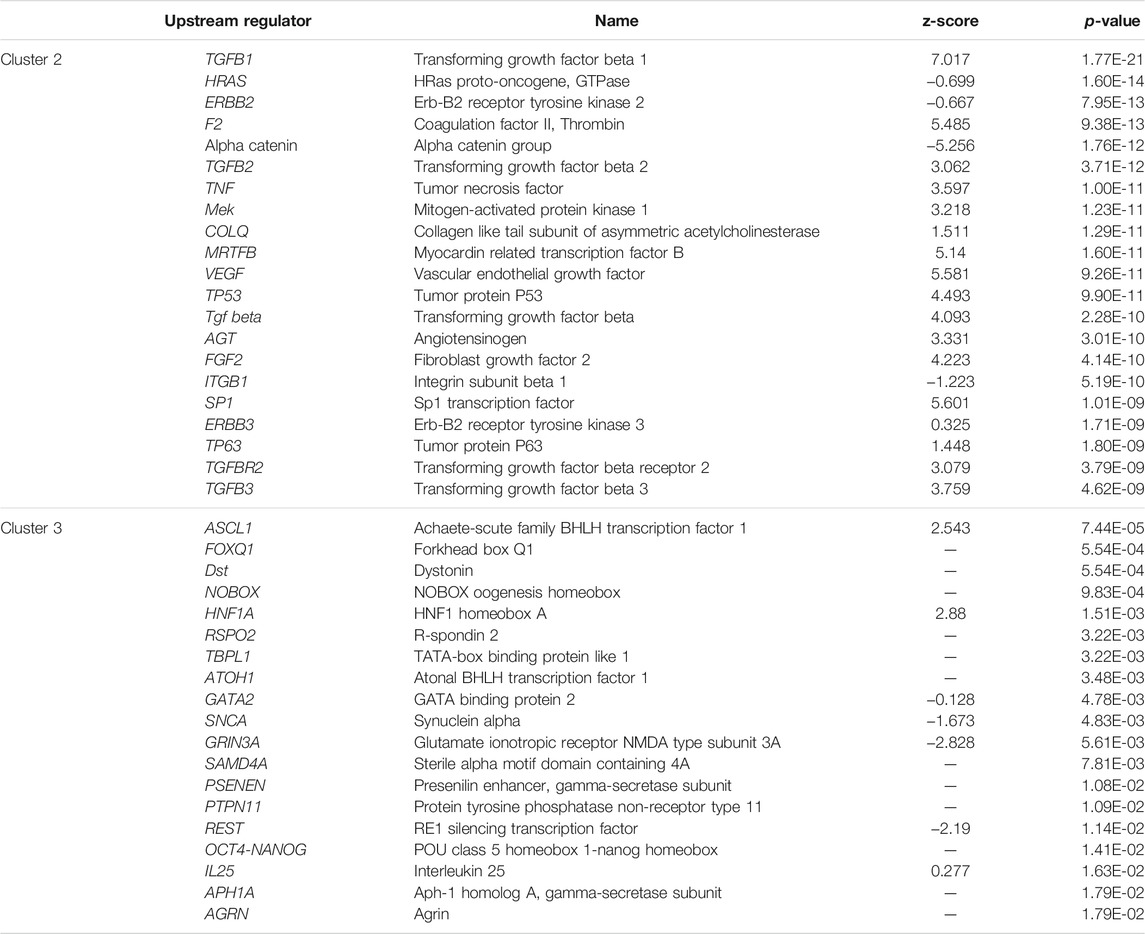
TABLE 5. Top biological upstream regulators and their respective activation z-score as well as p-value of association for the weak clusters, cluster 2 and cluster 3.
Additionally, 25 networks were generated by the IPA database for each cluster showing their functions and diseases. However, only those rated as important for fetal development and the role of PCOS candidate genes are shown in Figures 7–9. Specifically, mitochondrial function networks (1 and 3) of cluster 1 consisting of nuclear-encoded and mitochondrial DNA-encoded genes were downregulated during the second half of gestation (Figure 7). Networks associated with cluster 2, which were upregulated during the second half of gestation, consist of β-catenin as the central player (network 16) interacting with other subunits of its kind, namely frizzled molecules and cadherins, which are cell adhesion molecules (CAM) (Figure 8A). The second network of cluster 2 (network 24) consists of extracellular matrix components including the different types of collagen with two central molecules, collagen, and fibronectin (Figure 8B). The top networks for cluster 4, which were also upregulated during the second half of gestation, are associated with the effects of the transcription factor MYC in metabolism (network 1) and steroidogenesis (network 2) (Figure 9). All other relevant networks are summarized in Supplementary Figures S2–S5.
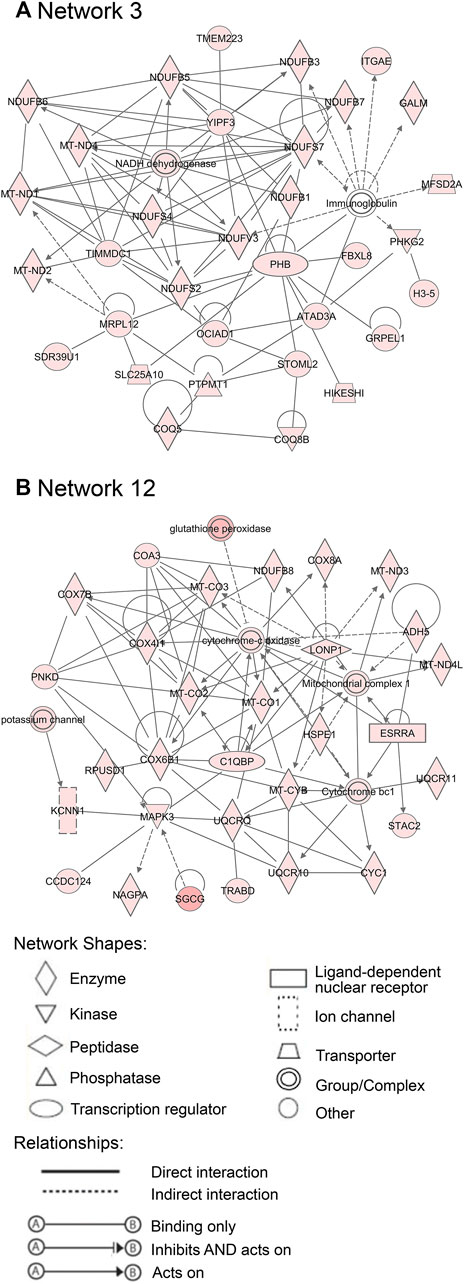
FIGURE 7. Important networks connected with cluster 1. Network 3 (A) and network 12 (B) are associated with mitochondrial functions. Red color of molecules represents downregulation in the second half of gestation and the intensity of each color shows the strength of regulation.
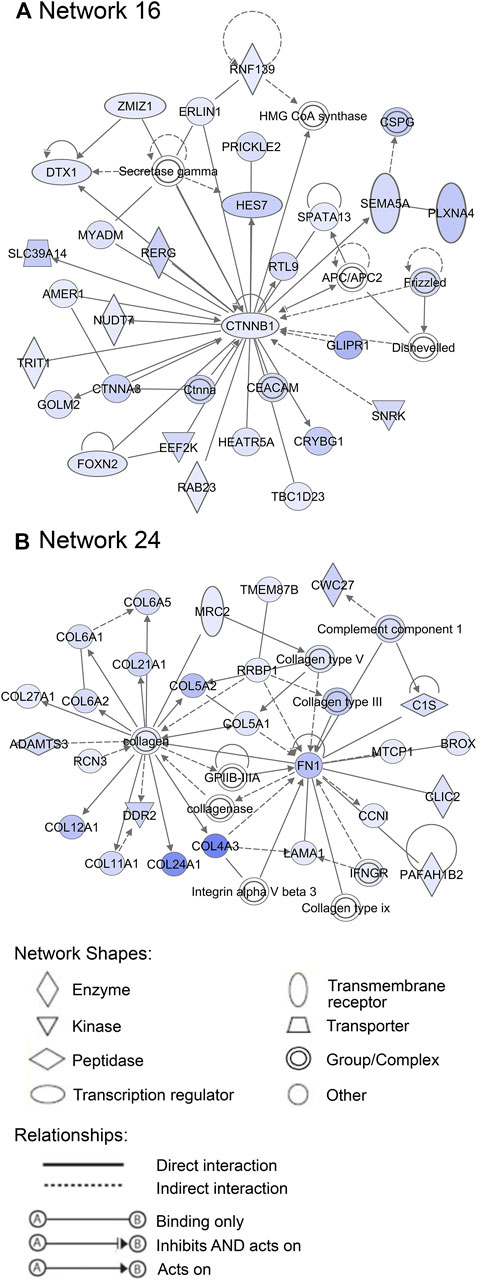
FIGURE 8. Important networks associated with cluster 2. (A) Network 16 contains β-catenin as central player, whereas (B) network 24 is associated with the components of extracellular matrix, such as collagens and fibronectin. Blue color of molecules represents upregulation in the second half of gestation and the intensity of each color shows the strength of regulation.
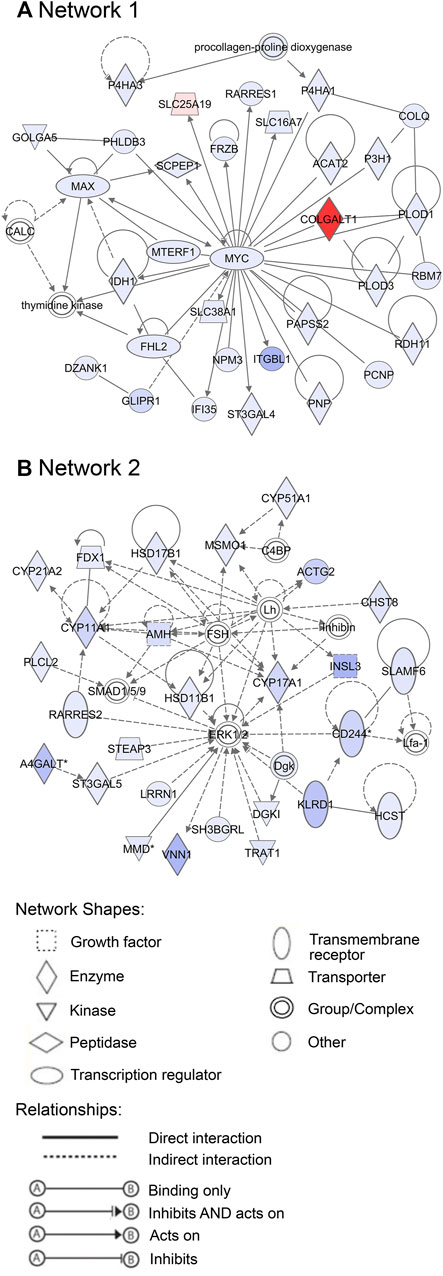
FIGURE 9. Important networks of genes associated with cluster 4. (A) Network 1 is associated with the effects of the transcription factor MYC. (B) Network 2 is connected with steroidogenesis. Red represents downregulation and blue upregulation in the second half of gestation. The strength of regulation is shown by the intensity of each color.
Oxidative phosphorylation and mitochondrial dysfunction pathways are the top canonical pathways co-expressed with the PCOS candidate genes expressed during early gestation (cluster 1). mRNA expression of nuclear-encoded mitochondrial genes associated with these top pathways as well as genes encoded by mitochondrial DNA from the RNA-seq are shown as scatterplots to outline their expression patterns across gestation (Supplementary Figures S6, S7, respectively). Similar patterns of expression were observed for both; thus, these genes are highly expressed during the early stages of gestation with expression decreasing gradually until 200 days of gestation, then the expression is maintained or increased slightly at that level in the third trimester.
Using RNA-seq data from normal fetal ovaries collected across gestation, we examined the expression patterns of PCOS candidate genes and found that most belonged to one of four gene clusters. The expression patterns of most of the PCOS candidate genes in the RNA-seq data were consistent with those previously identified by both Hartanti, et al. (2020) and Liu, et al. (2020). In addition to the PCOS candidate genes identified as expressed “early” or “late” in gestation in these previous studies, we found that MAPRE1, ARL14EP, and C8H9orf3 were also “early” genes, whilst YAP1 and THADA were “late” genes. The study then identified canonical pathways, biological and chemical upstream regulators and networks of genes that are co-expressed in each of the clusters. This knowledge could be vital for understanding the mechanisms and identifying upstream regulators for delineating the fetal origin of PCOS.
During the early stages of fetal ovary development, primordial germ cells settle in the developing ovary as oogonia and start to proliferate between the proliferating Gonadal Ridge Epithelial-Like (GREL) cells. Then stroma of the mesonephros, containing fibroblasts, fibres, and capillaries, penetrates into the gonadal ridge. This results in the formation of the ovigerous cords containing the GREL cells and proliferating oogonia. The ovigerous cords are separated from the penetrating stroma by a basal lamina and are open at the surface of the ovary during early gestation (Hummitzsch, et al., 2013; Hummitzsch et al., 2019). Interestingly, we found in cluster 1 that mitochondrial function is a key canonical pathway at this early stage of fetal ovary development. Expression patterns of nuclear-encoded mitochondrial genes and mitochondrial DNA-encoded genes across gestation showed that mitochondrial function and oxidative phosphorylation are at peak during stromal proliferation and penetration, specifically from the time of ovigerous cord formation until the cords begin to breakdown and primordial follicle formation occurs during fetal ovary development.
The relationship between mitochondrial dysfunction and the pathogenesis of PCOS remains unclear, although studies focussed on this topic began over the last decade. Mitochondrial DNA copy number and abnormal reactive oxidative species have been associated with numerous phenotypes of PCOS (Hyderali and Mala 2015; Shukla et al., 2020). Thus, insulin resistance, obesity, hyperandrogenism among others have been linked directly/indirectly to mitochondrial dysfunction [see reviews (Ilie 2018; Zhang et al., 2019; Zeng et al., 2020)]. A meta-analysis involving lean (BMI ≤ 23) and obese (BMI ≥ 23) PCOS patients using a systematic and comparative study by Idicula-Thomas et al. (2020) showed that nuclear-encoded mitochondrial genes were downregulated mainly in the cumulus cells of obese PCOS patients, but upregulated mainly in subcutaneous adipose tissues of lean PCOS patients. Furthermore, previous studies have shown that offspring of androgenised lean PCOS mice had impaired ovarian mitochondrial ultrastructure and function when compared to their controls (Chappell et al., 2020). Thus, mitochondrial ultrastructure in oocytes of androgenised offspring had disorganised cristae and swollen vacuoles without any electron dense content; a lower inner mitochondrial membrane potential of oocytes was also observed as compromised mitochondria function in the PCOS lean mice (Chappell, et al., 2020). This implies that in utero exposures to high androgen levels can significantly affect the development of the ovaries, most probably at the early stages of gestation, when germ cells undergo mitosis, ovigerous cords form, and stroma proliferates and migrates leading to the fetal programming of PCOS. More so, aberrant mitochondrial function was observed in oocytes at germinal vesicles stage of PCOS patients when compared to healthy controls in a study that compared the various stages of oocyte development in the two groups using single cell RNA sequencing (Qi et al., 2020). Additionally, studies focussed on the early stages of fetal ovary development in pig have also shown upregulation of mitochondrial activity and oxidative phosphorylation genes, inferred by higher expression of mitochondrial DNA-encoded genes at early stages of development (E31). During this stage, extensive proliferation of primordial germ cells and the global waves of methylation and demethylation occur in the porcine ovary; requiring significant levels of energy to sustain the changes (Zhu et al., 2021). The high energy produced results in by-products (e.g., alpha-ketoglutarate) that are then used to establish various epigenetic marks and modulate demethylation by oxidising of 5-methylcytosine (5mC) to 5-hydroxymethylcytosine (5hmC) (Tahiliani et al., 2009; Wu and Zhang 2017). The findings together infer that mitochondrial function could play a significant role in the predisposition of PCOS; requiring further studies.
Furthermore, the identification of upstream regulators such as DAP3, which plays significant roles in mitochondrial respiration and apoptosis (Tang et al., 2009), and MYC, which is a regulator of mitochondrial biogenesis (Li et al., 2005), as well as the downregulation of nuclear and mitochondrial DNA-encoded genes during the second half of gestation, in this study, implies that mitochondrial function is vital to the early stages of ovary development.
During mid-gestation, compartmentalisation of the ovary into the cortex and medulla becomes apparent, where there are alternating ovigerous cords and stromal areas in the cortex and stroma from the mesonephros containing extracellular matrix, fibroblasts and vasculature in the medulla. The stroma starts to migrate laterally after reaching just below the ovarian surface resulting in the closing of the ovigerous cords on the surface and the establishment of an ovarian surface epithelium underlain by a basal lamina (Hummitzsch, et al., 2019; Hummitzsch, et al., 2013). This is, to some extent, consistent with our observations of genes connected with cluster 2, which includes genes involved in stromal expansion. Notably, the presence of elevated levels of fibrous tissues and collagen in the ovarian capsule or tunica albuginea resulting in denser ovarian stroma are common features of polycystic ovaries. Increased stromal collagen and ovarian cortex expansion in PCOS patients are associated with dysfunction of fibrillin 3 (FBN3) which is highly expressed in early stages of fetal development and not expressed late in gestation or adult ovaries (Hatzirodos, et al., 2011). FBN3 regulates transforming growth factor-β (TGF-β) pathways, which stimulate fibroblast proliferation and collagen formation. TGF-β may also play significant roles in the cardiovascular and metabolic symptoms of PCOS as discussed in review by Raja-Khan et al. (2014). Upstream regulators involved in TGF-β signalling pathways such as TGFB1, TGFB2, TGFB3, and TGFBR2 and fibroblast proliferation regulators such as FGF2, coagulation factor II (F2) were consistent with findings of this study. In addition, networks associated with the components of extracellular matrix, such as collagen and fibronectin which are relevant to this stage of ovary development were associated with this cluster of genes.
Furthermore, YAP1, a PCOS candidate gene in cluster 2, is a critical regulator of granulosa cell proliferation, differentiation and survival by interaction with epidermal growth factor receptor, gonadotrophin, and TGF-β signalling pathways (Lv et al., 2019). More so, ERBB3, which is an early gene according to our GSA analysis and Liu et al. (2020) and a member of the epidermal growth factor family, was identified as an upstream regulator for genes in cluster 2. Additionally, β-catenin, which is a central molecule for one of the networks associated with this cluster, plays an essential role in Wnt signal transduction and in intercellular adhesion by interacting with cadherin (Liu et al., 2009; Bush et al., 2019). Undoubtedly, the regulation of the PCOS candidate genes during this stage plays a substantial role in the cascade of events that occur later in fetal development.
During the late stages of ovary development, follicles consisting of oocytes and granulosa cells are formed from the differentiation of ovigerous cords (Hummitzsch, et al., 2013; Heeren et al., 2015). The first primordial follicles appear in the inner cortex-medulla region, surrounded by a basal lamina. The surface epithelium, mostly single-layered, then surrounds the ovary. Stroma beneath the surface epithelial basal lamina then develops into the tunica albuginea during the final developmental stages of the human and bovine ovary (Hummitzsch, et al., 2013; Heeren, et al., 2015; Hummitzsch, et al., 2019). Activation of some primordial follicles occurs leading to their development into primary and preantral follicles. Remarkably, the genes in cluster 4 (including the PCOS candidate genes), top canonical pathways, upstream regulators and networks were involved in folliculogenesis and ovarian steroidogenesis which is consistent with occurrence during this stage of development. FDFT1, which is an essential enzyme in the synthesis of sterols further leading to the synthesis of cholesterol, correlates significantly with genes involved in folliculogenesis such as AMH, FSHR, LHCGR. More so, upstream regulators involved in steroid synthesis such as SREBF2, INSIG1, TGFB1, RPTOR, and networks such as network 2 which has a central molecule, Mitogen-Activated Protein Kinases, ERK1/2, interacting with other molecules of steroidogenesis such as FSH, LH, AMH, CYP11A1 were also identified for this cluster.
Despite the increasing number of genetics studies to define the abnormalities associated with PCOS, the pathogenesis of the syndrome still remains a challenge. Numerous studies to delineate the transgenerational susceptibility of PCOS in animals and human are on-going (Tata, et al., 2018; Risal et al., 2019; Mimouni et al., 2021) and this study provides upstream regulators as well as canonical pathways that could be further studied to delineate the pathogenesis of the syndrome. Notably, genes co-expressed with most PCOS candidate genes during both the early and late developmental stages of fetal development are involved in pathways that have previously been associated with PCOS, although mechanisms remain elusive. It would be very logical to infer that perturbations associated with mitochondrial function in the early stages of fetal ovary development lead to a cascade of events across gestation, some of which impact key canonical pathways such as stromal expansion and steroidogenesis, possibly, leading to PCOS in adulthood. The outcome of this study supports the need to further study the fetal origin of PCOS with the hope to, not only define the syndrome, but also towards the diagnosis, treatment and prevention of syndrome.
In summary, although this study is an in-silico analysis of PCOS candidate genes and their co-expressed genes from RNA-seq data, it has shown significant consistency with the literature on ovarian development and PCOS. Additional studies to delineate the pathogenesis of the syndrome will be required based on these findings. The limitations of IPA software are also acknowledged as IPA is a knowledge based curated software.
These findings highlight the involvement of PCOS-associated genes in mitochondrial function, stromal expansion and steroidogenesis during ovarian development. It could be speculated that perturbations during fetal ovary development resulting from dysregulation of these pathways could result in the different phenotypes of PCOS observed during adulthood. These perturbations could be genetic and/or environmental depending on maternal environment and fetal exposures associated with it. Further studies to delineate the role(s) of these pathways in the pathogenesis of PCOS are necessary. Notably, these findings infer a relationship between these major pathways, usually studied separately to define the syndrome and the need for studies investigating their interactions.
The datasets presented in this study can be found in online repositories. The names of the repository/repositories and accession number(s) can be found below: https://www.ncbi.nlm.nih.gov/, GSE178450.
The authors contributions included Conceptualization (RA, KH, RJR), Formal analysis (RA, KH, RJR), Funding acquisition: KH, RJR, RAA, Investigation (RA), Analysis (RA, KH, RJR), Methodology (RA, KH, MDH, JCSJ, RJR), Project administration (KH, RJR), Resources (KH, RJR), Software (RA) Writing – original draft (RA) and Writing – review and editing (KH, JCSJ, RAA, RJR).
Funding was received from the Centre for Research Excellence on Women’s Health in Reproductive life (GNT1171592), supported by the National Health and Medical Research Council of Australia and the UK Medical Research Council (G1100357).
Author RAA reports consultancy work for Ferring, Merck, IBSA, Roche Diagnostics, NeRRe Therapeutics and Sojournix Inc.
The remaining authors declare that the research was conducted in the absence of any commercial or financial relationships that could be construed as a potential conflict of interest.
All claims expressed in this article are solely those of the authors and do not necessarily represent those of their affiliated organizations, or those of the publisher, the editors and the reviewers. Any product that may be evaluated in this article, or claim that may be made by its manufacturer, is not guaranteed or endorsed by the publisher.
We thank Midfield Meat International, Warrnambool VIC, Australia for providing bovine fetal ovarian tissues. RA was supported by the Australian Research Training Program (fees-offset), the Faculty of Health and Medical Science Divisional Scholarship and the NHMRC CRE WHiRL PhD top-up scholarship. We are also grateful to the Partek team in Singapore for their quality support throughout the analysis process.
The Supplementary Material for this article can be found online at: https://www.frontiersin.org/articles/10.3389/fgene.2021.762177/full#supplementary-material
Barrett, T., Troup, D. B., Wilhite, S. E., Ledoux, P., Rudnev, D., Evangelista, C., et al. (2009). NCBI GEO: Archive for High-Throughput Functional Genomic Data. Nucleic Acids Res. 37, D885–D890. doi:10.1093/nar/gkn764
Birch, R. A., Padmanabhan, V., Foster, D. L., Unsworth, W. P., and Robinson, J. E. (2003). Prenatal Programming of Reproductive Neuroendocrine Function: Fetal Androgen Exposure Produces Progressive Disruption of Reproductive Cycles in Sheep. Endocrinology 144, 1426–1434. doi:10.1210/en.2002-220965
Bush, M., Alhanshali, B. M., Qian, S., Stanley, C. B., Heller, W. T., Matsui, T., et al. (2019). An Ensemble of Flexible Conformations Underlies Mechanotransduction by the Cadherin-Catenin Adhesion Complex. Proc. Natl. Acad. Sci. USA 116, 21545–21555. doi:10.1073/pnas.1911489116
Chappell, N. R., Zhou, B., Schutt, A. K., Gibbons, W. E., and Blesson, C. S. (2020). Prenatal Androgen Induced Lean PCOS Impairs Mitochondria and mRNA Profiles in Oocytes. Endocr. connections 9, 261–270. doi:10.1530/ec-19-0553
Davies, M. J., March, W. A., Willson, K. J., Giles, L. C., and Moore, V. M. (2012). Birthweight and Thinness at Birth Independently Predict Symptoms of Polycystic Ovary Syndrome in Adulthood. Hum. Reprod. 27, 1475–1480. doi:10.1093/humrep/des027
Dumesic, D. A., Abbott, D. H., Eisner, J. R., and Goy, R. W. (1997). Prenatal Exposure of Female Rhesus Monkeys to Testosterone Propionate Increases Serum Luteinizing Hormone Levels in Adulthood. Fertil. Sterility 67, 155–163. doi:10.1016/s0015-0282(97)81873-0
Echiburú, B., Milagro, F., Crisosto, N., Pérez-Bravo, F., Flores, C., Arpón, A., et al. (2020). DNA Methylation in Promoter Regions of Genes Involved in the Reproductive and Metabolic Function of Children Born to Women with PCOS. Epigenetics 15 (11), 1178–1194. doi:10.1080/15592294.2020.1754674
Hartanti, M. D., Rosario, R., Hummitzsch, K., Bastian, N. A., Hatzirodos, N., Bonner, W. M., et al. (2020). Could Perturbed Fetal Development of the Ovary Contribute to the Development of Polycystic Ovary Syndrome in Later Life? PloS One 15, e0229351. doi:10.1371/journal.pone.0229351
Hatzirodos, N., Bayne, R. A., Irving‐Rodgers, H. F., Hummitzsch, K., Sabatier, L., Lee, S., et al. (2011). Linkage of Regulators of TGF‐β Activity in the Fetal Ovary to Polycystic Ovary Syndrome. FASEB J. 25, 2256–2265. doi:10.1096/fj.11-181099
Heeren, A. M., Van Iperen, L., Klootwijk, D. B., de Melo Bernardo, A., Roost, M. S., Gomes Fernandes, M. M., et al. (2015). Development of the Follicular Basement Membrane during Human Gametogenesis and Early Folliculogenesis. BMC Dev. Biol. 15, 4. doi:10.1186/s12861-015-0054-0
Hiam, D., Moreno-Asso, A., Teede, H. J., Laven, J. S., Stepto, N. K., Moran, L. J., et al. (2019). The Genetics of Polycystic Ovary Syndrome: An Overview of Candidate Gene Systematic Reviews and Genome-wide Association Studies. Jcm 8, 1606. doi:10.3390/jcm8101606
Hotelling, H. (1933). Analysis of a Complex of Statistical Variables into Principal Components. J. Educ. Psychol. 24, 417–441. doi:10.1037/h0071325
Huang, D. W., Sherman, B. T., and Lempicki, R. A. (2009). Bioinformatics Enrichment Tools: Paths toward the Comprehensive Functional Analysis of Large Gene Lists. Nucleic Acids Res. 37, 1–13. doi:10.1093/nar/gkn923
Hummitzsch, K., Hatzirodos, N., Irving-Rodgers, H. F., Hartanti, M. D., Perry, V. E. A., Anderson, R. A., et al. (2019). Morphometric Analyses and Gene Expression Related to Germ Cells, Gonadal ridge Epithelial-like Cells and Granulosa Cells during Development of the Bovine Fetal Ovary. PloS One 14, e0214130. doi:10.1371/journal.pone.0214130
Hummitzsch, K., Irving-Rodgers, H. F., Hatzirodos, N., Bonner, W., Sabatier, L., Reinhardt, D. P., et al. (2013). A New Model of Development of the Mammalian Ovary and Follicles. PLoS One 8, e55578. doi:10.1371/journal.pone.0055578
Hyderali, B. N., and Mala, K. (2015). Oxidative Stress and Cardiovascular Complications in Polycystic Ovarian Syndrome. Eur. J. Obstet. Gynecol. Reprod. Biol. 191, 15–22. doi:10.1016/j.ejogrb.2015.05.005
Idicula-Thomas, S., Gawde, U., Bhaye, S., Pokar, K., and Bader, G. D. (2020). Meta-analysis of Gene Expression Profiles of Lean and Obese PCOS to Identify Differentially Regulated Pathways and Risk of Comorbidities. Comput. Struct. Biotechnol. J. 18, 1735–1745. doi:10.1016/j.csbj.2020.06.023
Ilie, I. R. (2018). Advances in PCOS Pathogenesis and Progression-Mitochondrial Mutations and Dysfunction. Adv. Clin. Chem., 127–155. doi:10.1016/bs.acc.2018.05.003
Joham, A. E., Teede, H. J., Ranasinha, S., Zoungas, S., and Boyle, J. (2015). Prevalence of Infertility and Use of Fertility Treatment in Women with Polycystic Ovary Syndrome: Data from a Large Community-Based Cohort Study. J. Women's Health 24, 299–307. doi:10.1089/jwh.2014.5000
Jones, M. R., and Goodarzi, M. O. (2016). Genetic Determinants of Polycystic Ovary Syndrome: Progress and Future Directions. Fertil. Sterility 106, 25–32. doi:10.1016/j.fertnstert.2016.04.040
Li, F., Wang, Y., Zeller, K. I., Potter, J. J., Wonsey, D. R., O'Donnell, K. A., et al. (2005). Myc Stimulates Nuclearly Encoded Mitochondrial Genes and Mitochondrial Biogenesis. Mol. Cel. Biol. 25, 6225–6234. doi:10.1128/mcb.25.14.6225-6234.2005
Liu, C. F., Bingham, N., Parker, K., and Yao, H. H. (2009). Sex-specific Roles of Beta-Catenin in Mouse Gonadal Development. Hum. Mol. Genet. 18, 405–417. doi:10.1093/hmg/ddn362
Liu, M., Hummitzsch, K., Hartanti, M. D., Rosario, R., Bastian, N. A., Hatzirodos, N., et al. (2020). Analysis of Expression of Candidate Genes for Polycystic Ovary Syndrome in Adult and Fetal Human and Fetal Bovine Ovaries†. Biol. Reprod. 103, 840–853. doi:10.1093/biolre/ioaa119
Lv, X., He, C., Huang, C., Wang, H., Hua, G., Wang, Z., et al. (2019). Timely Expression and Activation of YAP1 in Granulosa Cells Is Essential for Ovarian Follicle Development. FASEB J. 33, 10049–10064. doi:10.1096/fj.201900179rr
McAllister, J. M., Legro, R. S., Modi, B. P., and Strauss, J. F. (2015). Functional Genomics of PCOS: from GWAS to Molecular Mechanisms. Trends Endocrinol. Metab. 26, 118–124. doi:10.1016/j.tem.2014.12.004
Mills, G., Badeghiesh, A., Suarthana, E., Baghlaf, H., and Dahan, M. H. (2020). Associations between Polycystic Ovary Syndrome and Adverse Obstetric and Neonatal Outcomes: a Population Study of 9.1 Million Births. Hum. Reprod. doi:10.1093/humrep/deaa144
Mimouni, N. E. H., Paiva, I., Barbotin, A-L., Timzoura, F. E., Plassard, D., Le Gras, S., et al. (2021). Polycystic Ovary Syndrome Is Transmitted via a Transgenerational Epigenetic Process. Cel. Metab. doi:10.1016/j.cmet.2021.01.004
Qi, L., Liu, B., Chen, X., Liu, Q., Li, W., Lv, B., et al. (2020). Single-Cell Transcriptomic Analysis Reveals Mitochondrial Dynamics in Oocytes of Patients with Polycystic Ovary Syndrome. Front. Genet. 11, 396. doi:10.3389/fgene.2020.00396
Raja-Khan, N., Urbanek, M., Rodgers, R. J., and Legro, R. S. (2014). The Role of TGF-β in Polycystic Ovary Syndrome. Reprod. Sci. 21, 20–31. doi:10.1177/1933719113485294
Risal, S., Pei, Y., Lu, H., Manti, M., Fornes, R., Pui, H.-P., et al. (2019). Prenatal Androgen Exposure and Transgenerational Susceptibility to Polycystic Ovary Syndrome. Nat. Med. 25, 1894–1904. doi:10.1038/s41591-019-0666-1
Schüring, A. N., Welp, A., Gromoll, J., Zitzmann, M., Sonntag, B., Nieschlag, E., et al. (2012). Role of the CAG Repeat Polymorphism of the Androgen Receptor Gene in Polycystic Ovary Syndrome (PCOS). Exp. Clin. Endocrinol. Diabetes 120, 73–79. doi:10.1055/s-0031-1291343
Sherman, B. T., and Lempicki, R. A. (2009). Systematic and Integrative Analysis of Large Gene Lists Using DAVID Bioinformatics Resources. Nat. Protoc. 4, 44. doi:10.1038/nprot.2008.211
Shukla, P., Mukherjee, S., and Patil, A. (2020). Identification of Variants in Mitochondrial D-Loop and OriL Region and Analysis of Mitochondrial DNA Copy Number in Women with Polycystic Ovary Syndrome. DNA Cel. Biol. 39, 1458–1466. doi:10.1089/dna.2019.5323
Sullivan, S. D., and Moenter, S. M. (2004). Prenatal Androgens Alter GABAergic Drive to Gonadotropin-Releasing Hormone Neurons: Implications for a Common Fertility Disorder. Proc. Natl. Acad. Sci. 101, 7129–7134. doi:10.1073/pnas.0308058101
Tahiliani, M., Koh, K. P., Shen, Y., Pastor, W. A., Bandukwala, H., Brudno, Y., et al. (2009). Conversion of 5-methylcytosine to 5-hydroxymethylcytosine in Mammalian DNA by MLL Partner TET1. Science 324, 930–935. doi:10.1126/science.1170116
Tang, T., Zheng, B., Chen, S.-h., Murphy, A. N., Kudlicka, K., Zhou, H., et al. (2009). hNOA1 Interacts with Complex I and DAP3 and Regulates Mitochondrial Respiration and Apoptosis. J. Biol. Chem. 284, 5414–5424. doi:10.1074/jbc.m807797200
Tata, B., Mimouni, N. E. H., Barbotin, A.-L., Malone, S. A., Loyens, A., Pigny, P., et al. (2018). Elevated Prenatal Anti-müllerian Hormone Reprograms the Fetus and Induces Polycystic Ovary Syndrome in Adulthood. Nat. Med. 24, 834–846. doi:10.1038/s41591-018-0035-5
Teede, H., Deeks, A., and Moran, L. (2010). Polycystic Ovary Syndrome: a Complex Condition with Psychological, Reproductive and Metabolic Manifestations that Impacts on Health across the Lifespan. BMC Med. 8, 41. doi:10.1186/1741-7015-8-41
Wu, X. Y., Li, Z. L., Wu, C. Y., Liu, Y. M., Lin, H., Wang, S. H., et al. (2010). Endocrine Traits of Polycystic Ovary Syndrome in Prenatally Androgenized Female Sprague-Dawley Rats. Endocr. J. 57, 201–209. doi:10.1507/endocrj.k09e-205
Wu, X., and Zhang, Y. (2017). TET-mediated Active DNA Demethylation: Mechanism, Function and beyond. Nat. Rev. Genet. 18, 517–534. doi:10.1038/nrg.2017.33
Zeng, X., Huang, Q., Long, Sl., Zhong, Q., and Mo, Z. (2020). Mitochondrial Dysfunction in Polycystic Ovary Syndrome. DNA Cell Biol. 39 (8), 1401–1409. doi:10.1089/dna.2019.5172
Zhang, J., Bao, Y., Zhou, X., and Zheng, L. (2019). Polycystic Ovary Syndrome and Mitochondrial Dysfunction. Reprod. Biol. Endocrinol. 17, 67–15. doi:10.1186/s12958-019-0509-4
Keywords: polycystic ovary syndrome, mitochondrial dysfunction, stromal expansion, steroidogenesis, upstream regulators, fetal ovary
Citation: Azumah R, Hummitzsch K, Hartanti MD, St. John JC, Anderson RA and Rodgers RJ (2022) Analysis of Upstream Regulators, Networks, and Pathways Associated With the Expression Patterns of Polycystic Ovary Syndrome Candidate Genes During Fetal Ovary Development. Front. Genet. 12:762177. doi: 10.3389/fgene.2021.762177
Received: 21 August 2021; Accepted: 25 November 2021;
Published: 07 February 2022.
Edited by:
Stephen J. Bush, University of Oxford, United KingdomReviewed by:
Avi Lerner, Imperial College London, United KingdomCopyright © 2022 Azumah, Hummitzsch, Hartanti, St. John, Anderson and Rodgers. This is an open-access article distributed under the terms of the Creative Commons Attribution License (CC BY). The use, distribution or reproduction in other forums is permitted, provided the original author(s) and the copyright owner(s) are credited and that the original publication in this journal is cited, in accordance with accepted academic practice. No use, distribution or reproduction is permitted which does not comply with these terms.
*Correspondence: Raymond J. Rodgers, cmF5LnJvZGdlcnNAYWRlbGFpZGUuZWR1LmF1
Disclaimer: All claims expressed in this article are solely those of the authors and do not necessarily represent those of their affiliated organizations, or those of the publisher, the editors and the reviewers. Any product that may be evaluated in this article or claim that may be made by its manufacturer is not guaranteed or endorsed by the publisher.
Research integrity at Frontiers

Learn more about the work of our research integrity team to safeguard the quality of each article we publish.