 Victoria L. Arthur1*†
 Zhengbang Li2,1†
 Rui Cao3
 William S. Oetting4
 Ajay K. Israni5,6,7
 Pamala A. Jacobson4
 Marylyn D. Ritchie8
 Weihua Guan3Jinbo Chen1
- 1Department of Biostatistics, Epidemiology, and Informatics, University of Pennsylvania Perelman School of Medicine, Philadelphia, PA, United States
- 2Departments of Statistics, Central China Normal University, Wuhan, China
- 3Division of Biostatistics, School of Public Health, University of Minnesota, Minneapolis, MN, United States
- 4Department of Experimental and Clinical Pharmacology, College of Pharmacy, University of Minnesota, Minneapolis, MN, United States
- 5Minneapolis Medical Research Foundation, Minneapolis, MN, United States
- 6Department of Medicine, Hennepin County Medical Center, Minneapolis, MN, United States
- 7Department of Epidemiology and Community Health, University of Minnesota, Minneapolis, MN, United States
- 8Department of Genetics, Perelman School of Medicine, University of Pennsylvania, Philadelphia, PA, United States
Emerging evidence suggests that donor/recipient matching in non-HLA (human leukocyte antigen) regions of the genome may impact transplant outcomes and recognizing these matching effects may increase the power of transplant genetics studies. Most available matching scores account for either single-nucleotide polymorphism (SNP) matching only or sum these SNP matching scores across multiple gene-coding regions, which makes it challenging to interpret the association findings. We propose a multi-marker Joint Score Test (JST) to jointly test for association between recipient genotype SNP effects and a gene-based matching score with transplant outcomes. This method utilizes Eigen decomposition as a dimension reduction technique to potentially increase statistical power by decreasing the degrees of freedom for the test. In addition, JST allows for the matching effect and the recipient genotype effect to follow different biological mechanisms, which is not the case for other multi-marker methods. Extensive simulation studies show that JST is competitive when compared with existing methods, such as the sequence kernel association test (SKAT), especially under scenarios where associated SNPs are in low linkage disequilibrium with non-associated SNPs or in gene regions containing a large number of SNPs. Applying the method to paired donor/recipient genetic data from kidney transplant studies yields various gene regions that are potentially associated with incidence of acute rejection after transplant.
1 Introduction
Transplant matching usually focuses on non-genetic factors related to the donor, the recipient, or the graft itself, such as recipient age, donor sex, or organ size. Genetic matching in transplant has been limited to the human leukocyte antigen (HLA) region of the genome in the past, as this region codes for immune related genes that may lead to the recipient recognizing the allograft as non-self and mounting an immune response against it (Reddy et al., 2013; Hernandez-Fuentes et al., 2018). Although HLA matching reduces the risk of allograft rejection, it is not enough to prevent allograft rejection, even in the case of transplant between HLA-identical siblings (Grafft et al., 2010; Zanoni and Kiryluk, 2020). More recent transplant genetic studies have identified gene regions outside of the HLA region that may act as genetic modifiers for transplant outcomes (Almoguera et al., 2014; Yang and Sarwal, 2017; Steers et al., 2019; Farouk et al., 2020; Marin et al., 2020; Reindl-Schwaighofer et al., 2020). These so-called minor histocompatibility antigens may be important regions of interest to examine further in order to improve transplant outcomes.
Several studies have found evidence suggesting that donor and recipient genetic mismatch in these non-HLA regions could impact transplant outcomes. Zhang et al. (2020) showed that non-HLA donor/recipient (D/R) genetic differences were significantly associated with long-term graft survival in kidney transplant. Pineda et al. (2017) found a significantly increased number of D/R mismatched variants in the group of kidney transplant recipients with antibody-mediated rejection (AMR) compared to the group with no rejection, and they were able to identify 16 gene regions with multiple SNPs associated with AMR. Steers et al. (2019) utilized a genomic-collision model, in which a recipient who is homozygous for a deletion tagging allele obtains a transplant from a non-homozygous donor and were able to find a single polymorphism located in the LIMS1 locus with an increased hazard for rejection for D/R pairs with the collision genotype. In addition, previous work on single nucleotide polymorphism (SNP) matching in transplant found that utilizing D/R matching scores in association analyses led to discovery of SNPs potentially associated with acute rejection after liver transplant. Joint testing of these scores with the recipient genotype also suggested that the scores were measuring some aspect other than the combination of the recipient and donor genotype, since there were cases where the score was associated with transplant outcome, but the recipient and donor genotypes were not (Arthur et al., 2020). In order to improve power, increase interpretability and reproducibility of association signals, and facilitate follow-up functional studies, it is of interest to extend these single SNP methods to a multi-marker framework.
Many multi-marker methods have been proposed in the literature for assessing the association of multiple genetic markers within a gene region. Depending on how association information for individual markers is aggregated, they can largely be classified into three groups. In the first group, each test is based on combining p-values from tests of individual markers (Li et al., 2011; Chen et al., 2012; Mishra and Macgregor, 2015). Members in the second group can be seen as some quadratic form that combines statistics for testing marginal associations with each marker (Pan 2011). Well-known examples include Hotelling’s T2 statistic (Fan & Knapp, 2003), genomic-distance based regression (Wessel and Schork, 2006), variance component (VC) or kernel machine regression based tests (Tzeng and Zhang 2007; Pan 2009; Wu et al., 2010; Wu et al., 2011), the use of weighted genetic risk scores (Li et al., 2009; Iribarren et al., 2018), and the C-alpha test (Neale et al., 2011). These tests have also been extended using the framework of functional or mixed effects models (Fan et al., 2013; Chen et al., 2019; Chiu et al., 2019). In the third group, each test assesses associations between the phenotype variable and some form of aggregated genotype data. For example, the principal component regression (PCR) method (Gauderman et al., 2007; Wang and Abbot 2008; Chen and Qin, 2010; de Leeuw et al., 2015) tests the significance of top principal components of centered multi-marker genotype data, and Wang and Elston (2007) test similarly collapsed variables obtained via Fourier transformations. Similarly to tests in the second group, tests in this group have been built upon using functional data analysis methods (Luo et al., 2011; Luo et al., 2013). PCR and VC methods have been shown to generally have competitive statistical power (Ballard et al., 2010; Pan 2011; Liu et al., 2020). The connections among some of these methods have been studied in the literature (Schaid 2010; Bacanu 2012).
Only a few multi-marker D/R matching scores have been utilized for association analysis of transplant genetics data. The allogenomics mismatch score (AMS) is based on the hypothesis that observing the coding regions of both the recipient and donor genomes can help identify the number of potentially incompatible amino acids between the pair (Mesnard et al., 2016). The AMS is defined as the sum of amino acid mismatch contributions across all SNPs in the exome. A negative linear association was observed between the AMS and estimated glomerular filtration rate at 36 months post-transplant, suggesting that the AMS may be correlated with long term kidney graft function (Mesnard et al., 2016). A second method defined variant mismatch as any allele difference between the paired recipient and donor genomes (Pineda et al., 2017). This study found that the total number of D/R variant mismatches prior to transplant was significantly higher in the recipient group that developed antibody-mediated rejection versus the group with no rejection. The final method defined SNP mismatch as the donor carrying an allele not present in the recipient genome. These individual mismatches were then summed over all non-synonymous SNPs (nsSNPs) in the genome. After fitting a multivariate model that adjusted for HLA eplet mismatch, the degree of nsSNP mismatch was independently associated with graft loss (Reindl-Schwaighofer et al., 2019). While these methods were able to find some association between genome-wide mismatch and transplant outcomes, the results are difficult to interpret due to the scores spanning the entire genome. By extending existing gene-based test ideas to use both the recipient and donor genotype information, we have the potential to increase the power and interpretability over single SNP and whole genome-wide scoring methods.
Here we propose a new method called the “Joint Score Test (JST).” JST is built upon marginal likelihood scores for testing multiple SNP effects and a gene-based D/R matching score. JST uses only the most informative linear combinations of single recipient SNP marginal likelihood scores to allow for an increase in statistical power. JST also allows for flexible adjustment for covariates and therefore it can maintain nominal type-I error rates in the presence of population stratification.
We organize our paper as follows. First, we discuss the underlying model and the construction of JST. Then we present the results of extensive simulation studies. Third, we utilize JST in an association analysis of kidney transplant data. Finally, we discuss the benefits and potential limitations of the method.
2 Materials and Methods
JST jointly tests whether recipient genotype SNPs or a gene-based D/R matching score are associated with the transplant phenotype of interest.
2.1 Notation
Suppose that genotype data for m SNPs in a genomic region of interest are available for n transplant D/R pairs. Let
where g () is the link function,
2.2 Gene-Based Scores
In general, each gene-based score can be written in the form
where D
2.3 Single SNP Distance Scores
The first score, the identity-by-state (IBS) mismatch distance function, is defined as
assuming diallelic SNPs. This function is based on the degree of identity-by-state between the donor and recipient genotypes, measuring the number of alleles the pair shares at a SNP. IBS has previously been used as a kernel function in the sequence kernel association test (Wu et al., 2011) and in a kernel machine approach to test multiple genetic markers in association with quantitative traits (Kwee et al., 2008).
The second score considered, the incompatibility distance function, is calculated as
This distance metric has been utilized in a kidney transplant study, where single SNP incompatibility and a genome-wide sum of this measure were found to be associated with antibody-mediated rejection (Pineda et al., 2017). In addition, a similar score was utilized in mother/child pairs in a genetic study of pre-eclampsia (PE), where they found SNPs from three candidate gene regions to be nominally associated with PE (Parimi et al., 2008).
The third score, the Allogenomics Mismatch Score (AMS) distance function, is defined as
where a denotes alleles of a genotype (Mesnard et al., 2016). The underlying hypothesis of this method states that examining the difference between transplant donor and recipient alleles in coding regions of the genome can give insight into which amino acids coded by the donor would present as non-self to the recipient immune system, potentially leading to allograft damage.
The fourth score, the binary mismatch score, is based off a simplification of the AMS which assigned a score of 1 for all SNPs where the donor genotype contained an allele that was not present in the recipient genotype and a score of 0 otherwise (Reindl-Schwaighofer et al., 2019). The single SNP distance function can be defined as
2.4 A New Multi-Marker Test Statistic for Paired Transplant Data
In this section we will focus on deriving our JST test statistic for a binary outcome,
Here
Similarly, the likelihood score for testing the marginal association with the gene-based D/R SNP genetic matching score is equivalent to
Denote the vector of scores for all m recipient genotype SNPs and the gene-based genetic matching score as
which is asymptotically distributed as a
Here we propose a new statistic as follows.
Our statistic is based on Eigen decomposition of the sample variance-covariance matrix
where
We can show that this statistic is asymptotically distributed as a Chi-squared random variable with s+1 degrees of freedom under the null. Therefore,
2.5 Selection of s for JST
Choosing the number of PCs to retain (s) is always a difficult task in principal component analysis. One common method is to choose the number of PCs to keep based on a predefined percentage of total variance explained. We utilize this method in our simulation studies, looking at a range of 65–99% total variance explained by the retained PCs.
2.6 Simulations
Simulation studies were conducted to assess type I error and power levels of the JST, as well as to determine the number of principal components to maintain after Eigen decomposition, s.
2.6.1 Simulation Study Design
Datasets were sampled from 1,000 Genomes Phase 3 reference using HapGen2 (Su, Marchini and Donnelly, 2011). Briefly, subsets of the reference data were created based on three gene regions starting and ending positions, NAT2, CHI3L2, and ASAH1. These genes were chosen due to their differing number of SNPs and LD structures (Supplementary Figure S1). SNPs with minor allele frequency less than 0.05 were excluded from analyses. The subset reference data was then sampled with HapGen2 to generate 2n control individuals which were then paired into n donor/recipient pairs. A small sample size, n = 500, and a large sample size, n = 1,000, were considered. Recipient and donor genotype information was then extracted from these sampled datasets and used to calculate gene-based scores. A total of 5,000 simulations were conducted for each gene region and sample size combination.
For type I error analysis, null phenotypes were generated using the model
for binary outcome
for continuous outcome
For power analyses, phenotypes were generated using the model
for binary outcome
for continuous outcome
2.6.2 Comparison to Existing Methods
In addition to testing the type I error and power levels of JST, we compared our method with a standard GLM and the SKAT. For all comparisons, phenotype generation was the same as for JST. We used the same n x (m+1) matrix of combined recipient genotype SNPs and gene-based D/R matching score as input as was used for JST. For our standard GLM, we fit separate models under the null and alternative hypotheses respectively, and then calculated the likelihood ratio test (LRT) statistic using the lrtest function from the lmtest (v0.9-37, Zeileis and Hothorn, 2002) package in R or the score test statistic using the anova function in R. SKAT analysis was performed using the unweighted linear kernel and the unweighted IBS kernel as implemented in the SKAT (v1.3.2.1, Lee et al., 2017) package in R.
2.7 Real Data Analysis
2.7.1 Sample Information
Kidney transplant data was collected from two cohorts: Deterioration of Kidney Allograft Function (DeKAF, 2005–2011, NCT00270712) Genomics Study and Genomics of Kidney Transplantation (GEN-03, 2012–2016, NCT01714440) study. Genotypes from the DeKAF cohort (n = 784 donor-recipient pairs) were determined with the AFR-AMR Axiom chip (Affymetrix, Santa Clara, CA) (Hoffmann et al., 2011), which contains 837,930 variants. Genotyping of GEN-03 cohort (n = 404 donor-recipient pairs) was performed on a custom exome-plus Affymetrix TxArray SNP chip (Li et al., 2015), which contains approximately 782,000 variants. Genotype calling was performed in one batch on the Affymetrix Genotyping Console v4.0 using the GT1 algorithm, which is based on BRLMM-P (Affymetrix, Santa Clara, CA). Genotyping details can be found in our previous paper (Oetting et al., 2016). Non-Caucasian recipients were excluded from this study. In both data sets the outcome of interest incidence of acute rejection (AR) after transplant (161 cases in DeKAF cohort and 50 cases in GEN-03 cohort), was coded as a binary variable. AR was defined as time to first T-cell, antibody mediated, or mixed T-cell and antibody mediated rejection post-transplant as determined by the enrolling center and treating physician. Rejection was biopsy confirmed in ∼96% of the cases.
2.7.2 Statistical Analysis
The common SNPs in the two cohorts were grouped by physical locations within 23,062 genome-wide genes (GRCh38. p13) and then analyzed using both JST with s = 85% variance explained and SKAT with an unweighted IBS kernel. Covariates were included for recipients’ age, gender, PRA status, prior non-kidney transplantation, and an indicator for the cohort membership. p-values were adjusted for multiple comparisons using the Benjamini-Hochberg procedure to control false discovery rate (FDR).
3 Results
3.1 Results of Simulation Studies
A subset of the total simulation results is presented for both type I error testing and power testing. In all scenarios, results were similar for all combinations of gene, sample size, and any additional variables tested. Table 1 is based on scenarios using NAT2 with 500 D/R pairs, and all figures are based on 1000 D/R pairs, using data from either NAT2 or CHI3L2.
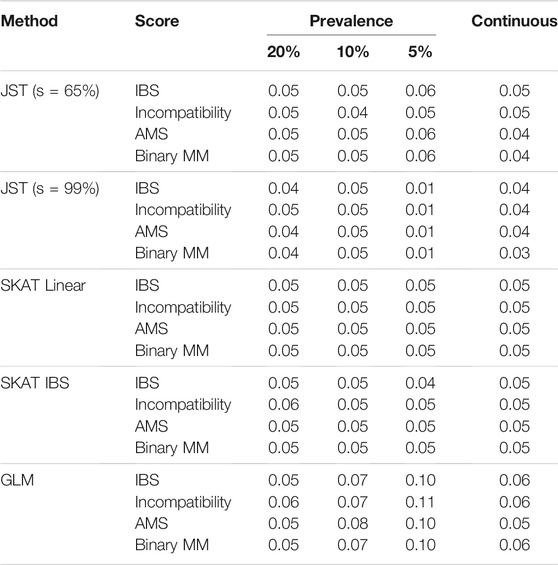
TABLE 1. Results of Type I Error simulations for the gene NAT2 with 500 D/R pairs. Method refers to one of the four multi-marker methods used for testing. Score refers to the gene-based score that was fit as part of the modeling. The columns Prevalence 20, 10, and 5% give results for binary outcome Y, and the continuous column gives results for continuous outcome Y. JST stands for Joint Score Test, with s value (percent of variance explained by the PCs) indicated in parentheses. Results for s value between 70 and 95% were similar to those for s = 65%. SKAT stands for Sequence Kernel Association Test. SKAT (Linear) refers to using SKAT with an unweighted linear kernel. SKAT (IBS) refers to fitting SKAT with an unweighted IBS kernel. GLM stands for Generalized Linear Model.
3.1.1 Type I Error
Table 1 shows the results of type I error rates for joint testing. For the proposed JST method, the type I error rate was around 0.05 for all combinations of outcome prevalence and fitted gene-based score. Type I error rates are nominal for s values between 65 and 90%, with some conservative error rates seen with s = 99% for lower outcome prevalence. Similar results can be seen for the SKAT method using either the linear or IBS kernel. The standard score test based on generalized linear model tends to have inflated type I error values when the outcome is binary, ranging from around 5–11%. When the outcome is continuous, the type I error is slightly inflated, at 6%.
3.1.2 Power—Recipient Genotype SNPs Associated
Figure 1 shows results from power analyses where the recipient genotype SNPs are associated with outcome, but the gene-based matching score is not associated. Under this scenario, SKAT using the IBS kernel performs better than SKAT using the linear kernel, so we use the IBS kernel results for our comparisons. The GLM LRT tends to have the lowest power, ranging from around 50% (Figures 1B,C) to around 80% (Figure 1D). It is probable that the power levels in panel D are being artificially inflated due to inflation of type I error rate. The power difference between the proposed JST and SKAT using the unweighted IBS kernel varies. When the R genotype SNPs associated with outcome are in low LD, JST tends to have higher power than SKAT, as seen in the Figure 1A where JST with s = 95% reaches close to 90% power but SKAT does not reach 80% power. When the SNPs associated with the outcome are in high LD, SKAT and the JST method can have similar power levels. This can be seen in the Figure 1B where both SKAT and JST with s = 65–80% reach around 85% power. When the size of the gene is increased, as in panels C and D, we see that JST tends to have higher power than SKAT in both scenarios. Additionally, when a continuous outcome is examined, JST with any value of s tends to have much higher power than SKAT using either kernel (Supplementary Figure S2).
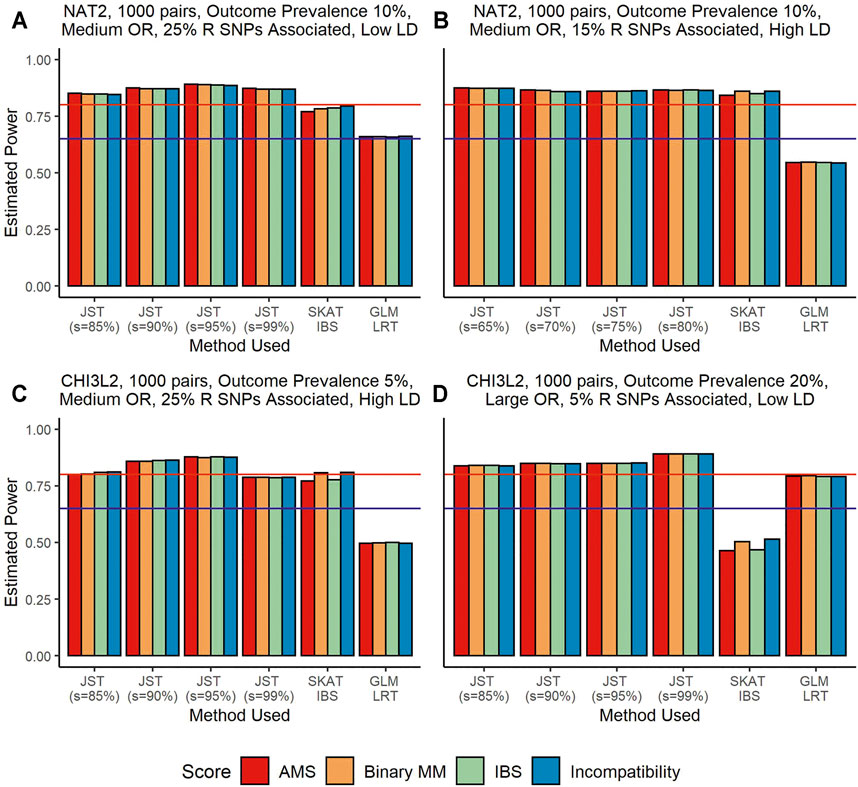
FIGURE 1. Power estimates from simulations using the genes NAT2 (Panels (A,B)) and CHI3L2 (Panels (C,D)) with 1,000 pairs of donors and recipients under the scenario that recipient genotype SNPs were associated with outcome. Panels (A,B) show an outcome prevalence of 10%. Panel (C) has an outcome prevalence of 5% and Panel (D), 20%. Panels (A–C) show results for a medium OR (1.25) and Panel (D) for a large OR (2.00). Panels (A, C) show results when 25% of recipient SNPs are associated, while 15% are associated in Panel (B) and only 5% in Panel (D). In panels (A, D), SNPs are in low LD while in panels (B, C) they are in high LD. The four colored bars represent which gene-based score was fit in the model, with red corresponding to the allogenomics mismatch score (AMS), orange to binary mismatch score, green to identity-by-state (IBS) score, and blue to Incompatibility score. From left to right in panels (A, C,D), the method used for model fitting was the joint score test (JST), with s values of 85, 90, 95, and 99% of variance explained by the principal components (PCs), the sequence kernel association test (SKAT) with the unweighted IBS kernel, and a generalized linear model (GLM) likelihood ratio test (LRT). Panel (B) shows results for JST with s values of 65–80%. The y-axis shows estimated power from 0 to 100%. The horizontal blue line corresponds to 65% power and the horizontal red line corresponds to 80% power.
For this scenario, there is not a singular s value that always results in the highest power. Figures 1A,D both show that JST has the highest power when s corresponds to 95% variance explained. Panel B shows that under different circumstances, retaining a smaller number of principal components may result in higher power, while the opposite is seen to be true for Figure 1D. We note that power levels for JST in all panels are around 80%, so changing the number of principal components retained does not seem to drastically affect the overall power of the method.
3.1.3 Power—Donor/Recipient Gene-Based Matching Score Associated
Figure 2 shows an example of results on power when the D/R gene-based matching score was associated with outcome and recipient genotype was not associated. Under this scenario, SKAT performance is slightly better using the linear kernel versus the IBS kernel, so we use the linear kernel results in our comparison. We can see that overall, SKAT has the highest power under these simulation conditions, with power levels reaching at least 80% for all four associated scores. The proposed JST method has the second highest power ranging from around 60% when the binary mismatch score is associated to around 90% when the IBS score is associated. The GLM LRT has the lowest power, ranging from around 25% to almost 65%. We note that JST tends to have the highest power when the percentage of variance explained by the s PCs is the smallest (65%). When the IBS gene-based score or the AMS is truly associated (Figures 2A,C), power tends to be higher overall than when the binary scores are associated, with all s values leading to over 80% power. The Binary mismatch score being truly associated (Figure 2B) tends to have the lowest overall power of the four scores, with four scenarios in which power does not reach 65%. Similar results are seen when outcome is continuous (Supplementary Figure S3).
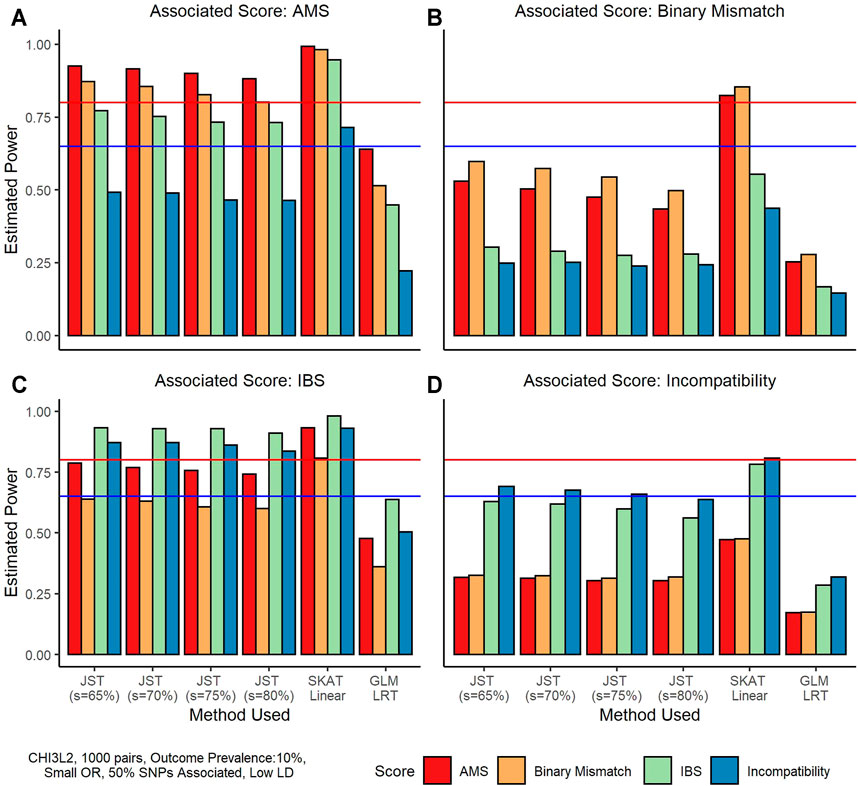
FIGURE 2. Power estimates from simulations using the gene CHI3L2 and 1,000 pairs of donors and recipients under the scenario that the gene-based score was associated with outcome. All plots shown are for a binary outcome with prevalence 10%. A small odds ratio (1.25) was used for phenotype generation. For these simulations, 50% of SNPs in the gene score were associated with the outcome, and these SNPs were in low LD. From left to right, and top to bottom the true associated gene-score is the allogenomics mismatch score (AMS), the Binary Mismatch, the identity-by-state (IBS), and the Incompatibility score. The four colors represent which score was used to fit the model, where red is the AMS, yellow is the Binary Mismatch score, green is the IBS, and blue is the Incompatibility score. In each plot, the x-axis corresponds to the method used, where from left to right methods are joint score test (JST) with s values of 65, 70, 75, and 80% of variance explained by the principal components used, the sequence kernel association test (SKAT) with unweighted linear kernel, and a generalized linear model (GLM) likelihood ratio test (LRT). The y-axis shows estimated power from 0 to 100%. The horizontal blue line corresponds to 65% power and the horizontal red line corresponds to 80% power.
3.2 Data Analysis Results
Table 2 shows the top five genes from analysis of the combined GEN03 and DeKAF data sets using JST with an s value of 85% and the top five genes from SKAT analysis of the combined data sets, using an unweighted IBS kernel. Gene ranking is based on the smallest p-value for all four score models. p-values for the four different models are relatively similar for each of the five genes. The number of genotyped SNPs in the genes ranges from 3 to 15 for the JST results and from 3 to 104 in the SKAT results. Only one of the top genes found using SKAT analyses was also found in the top five for JST analysis. All five of the genes from JST analysis are significant using a FDR cutoff of less than 0.10, while none of the genes found by SKAT are significant using this method.
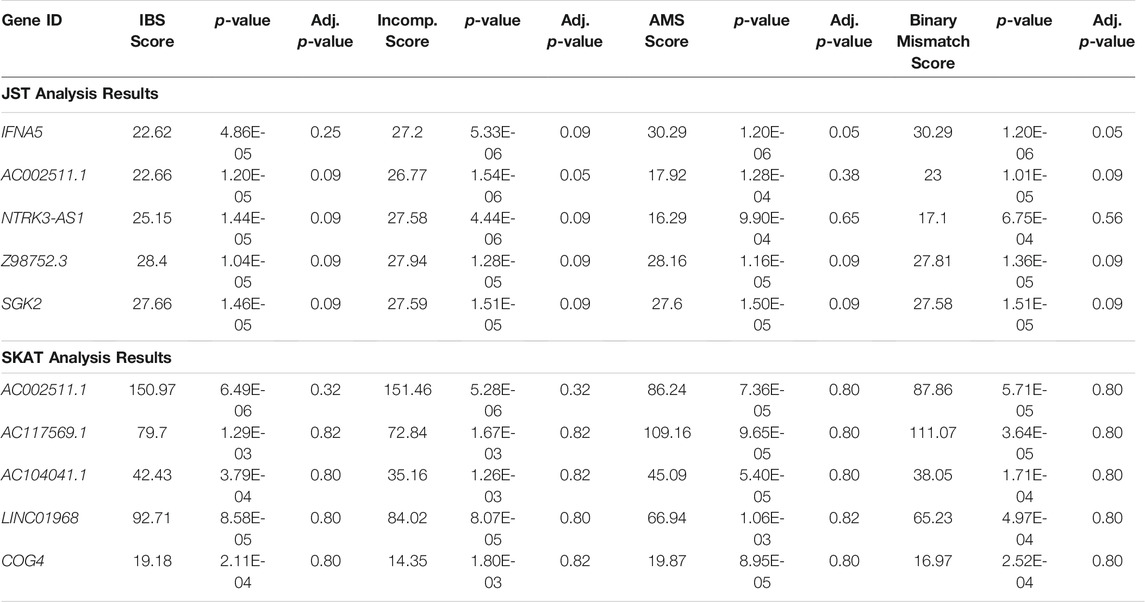
TABLE 2. Results of JST and SKAT analysis of combined GEN03 and DeKAF data sets. The top 5 genes sorted by p-value from fitting a model with the any of the four gene-based score are shown. JST was calculated using p = 85% of variance explained. SKAT was run using the IBS kernel. Adj. p-value: p-value adjusted for multiple comparisons using FDR, IBS: identity-by-state, Incomp: incompatibility, AMS: allogenomics mismatch score.
4 Discussion
We propose a multi-marker test statistic designed for use with paired genetic data in transplantation. The joint score test, or JST, can be used for testing whether specific gene regions are associated with transplant outcomes, either through the recipient genotype or D/R genetic matching. Compared to other statistical tests in this setting, the JST has the potential for increased power and reproducibility as compared to single SNP tests, as well as increased interpretability as compared to multi-SNP methods that sum across large regions of the genome.
The Eigen decomposition of the recipient genotype covariance matrix allows for a potential increase in power for JST as compared to a standard GLM likelihood ratio test. By transforming the covariance matrix into its principal components, we are able to select only those components that are most likely to be associated and discard the remaining components. We chose to keep principal components with large eigenvalues in accordance with previous theoretical and empirical work by Liu et al. (2020) in order to have the greatest power to detect genetic associations.
Our simulations showed that JST is a competitive method as compared to standard GLM, and SKAT. Type I error rates were conserved for both JST and SKAT but were inflated for GLM. This inflation could be due to the larger number of covariates being fit in this model. In power simulations, JST tended to outperform SKAT when recipient genotype SNPs, in low LD with all other SNPs in the region, were truly associated with outcome. When the recipient SNPs were in high LD, SKAT and JST performed similarly for the smallest gene but increasing the gene size while keeping the percentage of associated SNPs constant led to JST surpassing SKAT in power. These findings agree with those found by Liu et al. (2020) where the SKAT method performed closer to use of the first principal component when LD between SNPs increased, due to the increase of the first eigenvalue weighting the first PC higher in the SKAT test statistic. When gene-based score was associated with outcome, SKAT tended to have higher or similar power to JST depending on which gene-based score was used in modeling. When the AMS and IBS score were associated with the outcome, they tended to have higher power than when the Binary Mismatch score and Incompatibility score were associated. Additionally, when the Binary Mismatch score or Incompatibility score were associated with outcome, the AMS or IBS score respectively maintained relatively high power. Following these observations, it is recommended that the AMS or IBS score be used for testing. Ideally, the choice of score should be determined based on prior knowledge of the genetic mechanism.
JST and SKAT behaved similarly in some of the simulation scenarios but the construction of these two test statistics is different. Using the linear kernel, the SKAT statistic is equivalent to summing the squared score statistics of the genetic data (Wu et al., 2011). Under this scenario, SKAT is similar to JST but does not involve the variance between the marginal score functions. The main difference between the two approaches lies in different modeling approaches. SKAT is also based on a generalized linear model, but the log-odds ratio parameters for both the recipient genotypes and gene score are further modeled as following a mean zero distribution. Different ways of specifying variance in such mean zero distribution correspond to different kernel functions chosen for SKAT analysis (Sun et al., 2013). It is not straightforward to derive general insights on which method may be more powerful, but it does seem that their power would differ at least according to the true underlying genetic model and the LD structures of the genetic variants. We recommend both methods be applied for analysis with adjustment to multiple testing.
To the best of our knowledge, SKAT has not previously been evaluated under the scenario of jointly testing for an association between a set of SNPs and a gene-based score and has not been utilized with paired transplant genetics data. Our evaluation of SKAT under these circumstances found that the method works well and is robust. We determined that the choice of kernel often impacted power levels, however, such as when the SKAT method using the linear kernel had minimal power as compared to the SKAT method using the IBS kernel under the scenario where R genotype SNPs were associated with outcome. Investigation into this phenomenon found that scaling the gene-based scores from between 0 and 1, before running SKAT with a linear kernel leads to an improvement in power (Supplementary Figure S4). The IBS kernel had relatively high power under both power scenarios, with power levels only about 5% less than those of the linear kernel when gene-based score was associated, so use of the IBS kernel may be preferred when the true underlying association is unknown.
Based on the simulation studies, there is no clear value of s that leads to the highest power in all scenarios. When gene-based score was associated with the outcome, the smallest s value we considered tended to have the highest power, but power tended to be similar for s values corresponding to between 65 and 80% variance explained by the PCs. When recipient genotype SNPs were associated with the outcome, changing the value of s did not tend to drastically change the power levels. Since the true association mechanism is unknown for real data analysis, it may be beneficial to run models using a few different s values, although this will increase the number of tests. An alternative is to choose a middling value of s, around 80 or 85%, which tends to have high power under either scenario of association.
Our analysis of kidney transplant data found five genes to be statistically significant after accounting for multiple comparisons at FDR<0.10. These include genes that could plausibly lead to AR after kidney transplant. Three of the five genes, IFNA5, Z98752.3, and SGK2, have been found to be associated with the immune system or specific types of immune cells which could attack a transplanted kidney if the graft is recognized as non-self (Kichaev et al., 2019; Chen et al., 2020). IFNA5, for example, is known to be involved in differentiation and proliferation of B and T cells, as well as being involved in the adaptive immune response, which involves the creation of antibodies that may attack a donor organ (Huntley et al., 2015). In previous GWAS analyses, SNPs located in SGK2 were found to be associated with leukocyte and monocyte counts which are directly associated with immune response (Kichaev et al., 2019; Chen et al., 2020). Replication of these results will be needed to verify the significance of these findings.
The JST method does have some limitations. Transplant data analysis was limited to data from paired kidney transplants. The method can be applied to other organ data as well, as long as genotype data is available for both the donor and the recipient. For our simulation studies, we only focused on unrelated D/R pairs, but it is possible that the degree of relatedness between a donor and a recipient may impact whether the recipient experiences acute rejection. We were able to look at related versus non-related pairs in our combined kidney data sets and found that these two groups had no overlap in their top five potentially associated genes. Based on these results, we believe it is important to account for relatedness between a D/R pair in analyses. We restricted our analyses to only include common SNPs, but rare variants can be used in JST analyses. If there is interest in the association of rare variants, it is possible to construct a weighted version of the distance function as,
Then a simple weighting option that will help upweight rarer minor allele frequencies is the use of
In summary, the JST is a powerful method that can be used for the analysis of paired genetic data. Use of this method could lead to the discovery of gene regions potentially important to transplant outcome, which could be further studied to try and determine the biological mechanisms behind acute rejection.
Data Availability Statement
The original contributions presented in the study are included in the article/Supplementary Material, further inquiries can be directed to the corresponding author.
Author Contributions
JC, VA, ZL, WG, and RC contributed to statistical derivation of the proposed method. VA ran simulations. AI, WO, and PJ ran the clinical study, were responsible for data collection and oversaw the genotyping. RC and WG ran statistical analyses on the kidney transplant data. VA, JC, and ZL wrote the first draft of the manuscript. RC wrote sections of the manuscript. All authors contributed to manuscript revision, read, and approved the submitted version.
Funding
This work was supported by the National Institutes of Health. Grant numbers R01-ES016626, R21-ES020811, 5U19-AI070119, and 5U01-AI-58013.
Conflict of Interest
The authors declare that the research was conducted in the absence of any commercial or financial relationships that could be construed as a potential conflict of interest.
Publisher’s Note
All claims expressed in this article are solely those of the authors and do not necessarily represent those of their affiliated organizations, or those of the publisher, the editors and the reviewers. Any product that may be evaluated in this article, or claim that may be made by its manufacturer, is not guaranteed or endorsed by the publisher.
Supplementary Material
The Supplementary Material for this article can be found online at: https://www.frontiersin.org/articles/10.3389/fgene.2021.745773/full#supplementary-material
References
Almoguera, B., Shaked, A., and Keating, B. J. (2014). Transplantation Genetics: Current Status and Prospects. Am. J. Transplant. 14 (4), 764–778. doi:10.1111/ajt.12653
Arthur, V. L., Guan, W., Loza, B. l., Keating, B., and Chen, J. (2020). Joint Testing of Donor and Recipient Genetic Matching Scores and Recipient Genotype Has Robust Power for Finding Genes Associated with Transplant Outcomes. Genet. Epidemiol. 44, 893–907. doi:10.1002/gepi.22349
Bacanu, S.-A. (2012). On Optimal Gene-Based Analysis of Genome Scans. Genet. Epidemiol. 36 (4), 333–339. doi:10.1002/gepi.21625
Bai, Z., and Saranadasa, H. (1996). Effect of High Dimension: by an Example of a Two Sample Problem. Stat. Sinica 6 (2), 311–329.
Ballard, D. H., Cho, J., and Zhao, H. (2010). Comparisons of Multi-Marker Association Methods to Detect Association between a Candidate Region and Disease. Genet. Epidemiol. 34 (3), 201–212. doi:10.1002/gepi.20448
Chen, H., Huffman, J. E., Brody, J. A., Wang, C., Lee, S., Li, Z., et al. (2019). Efficient Variant Set Mixed Model Association Tests for Continuous and Binary Traits in Large-Scale Whole-Genome Sequencing Studies. Am. J. Hum. Genet. 104 (2), 260–274. doi:10.1016/j.ajhg.2018.12.012
Chen, L. S., Hsu, L., Gamazon, E. R., Cox, N. J., and Nicolae, D. L. (2012). An Exponential Combination Procedure for Set-Based Association Tests in Sequencing Studies. Am. J. Hum. Genet. 91 (6), 977–986. doi:10.1016/j.ajhg.2012.09.017
Chen, M.-H., Raffield, L. M., Mousas, A., Sakaue, S., Huffman, J. E., Moscati, A., et al. (2020). Trans-ethnic and Ancestry-specific Blood-Cell Genetics in 746,667 Individuals from 5 Global Populations. Cell 182 (5), 1198–1213. doi:10.1016/j.cell.2020.06.045
Chen, S. X., and Qin, Y.-L. (2010). A Two-Sample Test for High-Dimensional Data with Applications to Gene-Set Testing. Ann. Statist. 38 (2), 808–835. doi:10.1214/09-AOS716
Chiu, C. y., Yuan, F., Zhang, B. s., Yuan, A., Li, X., Fang, H. B., et al. (2019). Linear Mixed Models for Association Analysis of Quantitative Traits with Next‐generation Sequencing Data. Genet. Epidemiol. 43 (2), 189–206. doi:10.1002/gepi.22177
de Leeuw, C. A., Mooij, J. M., Heskes, T., and Posthuma, D. (2015). MAGMA: Generalized Gene-Set Analysis of GWAS Data. Plos Comput. Biol. 11 (4), e1004219. doi:10.1371/journal.pcbi.1004219
Fan, R., and Knapp, M. (2003). Genome Association Studies of Complex Diseases by Case-Control Designs. Am. J. Hum. Genet. 72 (4), 850–868. doi:10.1086/373966
Fan, R., Wang, Y., Mills, J. L., Wilson, A. F., Bailey-Wilson, J. E., and Xiong, M. (2013). Functional Linear Models for Association Analysis of Quantitative Traits. Genet. Epidemiol. 37 (7), 726–742. doi:10.1002/gepi.21757
Farouk, S., Zhang, Z., and Menon, M. C. (2020). Non‐HLA Donor-Recipient Mismatches in Kidney Transplantation-A Stone Left Unturned. Am. J. Transpl. 20 (1), 19–24. doi:10.1111/ajt.15612
Gauderman, W. J., Murcray, C., Gilliland, F., and Conti, D. V. (2007). Testing Association between Disease and Multiple SNPs in a Candidate Gene. Genet. Epidemiol. 31 (5), 383–395. doi:10.1002/gepi.20219
Grafft, C. A., Cornell, L. D., Gloor, J. M., Cosio, F. G., Gandhi, M. J., Dean, P. G., et al. (2010). Antibody-mediated Rejection Following Transplantation from an HLA-Identical Sibling. Nephrol. Dial. Transplant. 25 (1), 307–310. doi:10.1093/ndt/gfp526
Hernandez‐Fuentes, M. P., Franklin, C., Rebollo‐Mesa, I., Mollon, J., Delaney, F., Perucha, E., Stapleton, C., Borrows, R., Byrne, C., Cavalleri, G., Clarke, B., Clatworthy, M., Feehally, J., Fuggle, S., Gagliano, S. A., Griffin, S., Hammad, A., Higgins, R., Jardine, A., Keogan, M., Leach, T., MacPhee, I., Mark, P. B., Marsh, J., Maxwell, P., McKane, W., McLean, A., Newstead, C., Augustine, T., Phelan, P., Powis, S., Rowe, P., Sheerin, N., Solomon, E., Stephens, H., Thuraisingham, R., Trembath, R., Topham, P., Vaughan, R., Sacks, S. H., Conlon, P., Opelz, G., Soranzo, N., Weale, M. E., and Lord, G. M. (2018). Long‐ and Short‐term Outcomes in Renal Allografts with Deceased Donors: A Large Recipient and Donor Genome‐wide Association Study. Am. J. Transpl. 18 (6), 1370–1379. doi:10.1111/ajt.14594
Hoffmann, T. J., Kvale, M. N., Hesselson, S. E., Zhan, Y., Aquino, C., Cao, Y., et al. (2011). Next Generation Genome-wide Association Tool: Design and Coverage of a High-Throughput European-optimized SNP Array. Genomics 98 (2), 79–89. doi:10.1016/j.ygeno.2011.04.005
Huntley, R. P., Sawford, T., Mutowo-Meullenet, P., Shypitsyna, A., Bonilla, C., Martin, M. J., et al. (2015). The GOA Database: Gene Ontology Annotation Updates for 2015. Nucleic Acids Res. 43, D1057–D1063. doi:10.1093/nar/gku1113
Iribarren, C., Lu, M., Jorgenson, E., Martínez, M., Lluis-Ganella, C., Subirana, I., et al. (2018). Weighted Multi-Marker Genetic Risk Scores for Incident Coronary Heart Disease Among Individuals of African, Latino and East-Asian Ancestry. Sci. Rep. 8 (1), 6853. doi:10.1038/s41598-018-25128-x
Kichaev, G., Bhatia, G., Loh, P.-R., Gazal, S., Burch, K., Freund, M. K., et al. (2019). Leveraging Polygenic Functional Enrichment to Improve GWAS Power. Am. J. Hum. Genet. 104 (1), 65–75. doi:10.1016/j.ajhg.2018.11.008
Kwee, L. C., Liu, D., Lin, X., Ghosh, D., and Epstein, M. P. (2008). A Powerful and Flexible Multilocus Association Test for Quantitative Traits. Am. J. Hum. Genet. 82 (2), 386–397. doi:10.1016/j.ajhg.2007.10.010
Lee, S., Miropolsky, L., and Wu, M. (2017). SKAT: SNP-Set (Sequence) Kernel Association Test. R package version 1.3.2.1. Available at: https://CRAN.R-project.org/package=SKAT.
Li, M.-X., Gui, H.-S., Kwan, J. S. H., and Sham, P. C. (2011). GATES: A Rapid and Powerful Gene-Based Association Test Using Extended Simes Procedure. Am. J. Hum. Genet. 88 (3), 283–293. doi:10.1016/j.ajhg.2011.01.019
Li, M., Wang, K., Grant, S. F. A., Hakonarson, H., and Li, C. (2009). ATOM: A Powerful Gene-Based Association Test by Combining Optimally Weighted Markers. Bioinformatics 25 (4), 497–503. doi:10.1093/bioinformatics/btn641
Li, Y. R., van Setten, J., Verma, S. S., Lu, Y., Holmes, M. V., Gao, H., et al. (2015). Concept and Design of a Genome-wide Association Genotyping Array Tailored for Transplantation-specific Studies. Genome Med. 7, 90. doi:10.1186/s13073-015-0211-x
Liu, Z., Barnett, I., and Lin, X. (2020). A Comparison of Principal Component Methods between Multiple Phenotype Regression and Multiple SNP Regression in Genetic Association Studies. Ann. Appl. Stat. 14 (1), 433–451. doi:10.1214/19-AOAS1312
Luo, L., Boerwinkle, E., and Xiong, M. (2011). Association Studies for Next-Generation Sequencing. Genome Res. 21 (7), 1099–1108. doi:10.1101/gr.115998.110
Luo, L., Zhu, Y., and Xiong, M. (2013). Smoothed Functional Principal Component Analysis for Testing Association of the Entire Allelic Spectrum of Genetic Variation. Eur. J. Hum. Genet. 21 (2), 217–224. doi:10.1038/ejhg.2012.141
Marin, E. P., Cohen, E., and Dahl, N. (2020). Clinical Applications of Genetic Discoveries in Kidney Transplantation: A Review. Kidney360 1 (4), 300–305. doi:10.34067/KID.0000312019
Mesnard, L., Muthukumar, T., Burbach, M., Li, C., Shang, H., Dadhania, D., et al. (2016). Exome Sequencing and Prediction of Long-Term Kidney Allograft Function. Plos Comput. Biol. 12 (9), e1005088. doi:10.1371/journal.pcbi.1005088
Mishra, A., and Macgregor, S. (2015). VEGAS2: Software for More Flexible Gene-Based Testing. Twin Res. Hum. Genet. 18 (1), 86–91. doi:10.1017/thg.2014.79
Neale, B. M., Rivas, M. A., Voight, B. F., Altshuler, D., Devlin, B., Orho-Melander, M., et al. (2011). Testing for an Unusual Distribution of Rare Variants. Plos Genet. 7 (3), e1001322. doi:10.1371/journal.pgen.1001322
Oetting, W. S., Schladt, D. P., Guan, W., Miller, M. B., Remmel, R. P., Dorr, C., et al. (2016). Genomewide Association Study of Tacrolimus Concentrations in African American Kidney Transplant Recipients Identifies MultipleCYP3A5Alleles. Am. J. Transplant. 16 (2), 574–582. doi:10.1111/ajt.13495
Pan, W. (2009). Asymptotic Tests of Association with Multiple SNPs in Linkage Disequilibrium. Genet. Epidemiol. 33 (6), 497–507. doi:10.1002/gepi.20402
Pan, W. (2011). Relationship between Genomic Distance-Based Regression and Kernel Machine Regression for Multi-Marker Association Testing. Genet. Epidemiol. 35 (4), a–n. doi:10.1002/gepi.20567
Parimi, N., Tromp, G., Kuivaniemi, H., Nien, J. K., Gomez, R., Romero, R., et al. (2008). Analytical Approaches to Detect Maternal/fetal Genotype Incompatibilities that Increase Risk of Pre-eclampsia. BMC Med. Genet. 9 (1), 60. doi:10.1186/1471-2350-9-60
Pineda, S., Sigdel, T. K., Chen, J., Jackson, A. M., Sirota, M., and Sarwal, M. M. (2017). Novel Non-histocompatibility Antigen Mismatched Variants Improve the Ability to Predict Antibody-Mediated Rejection Risk in Kidney Transplant. Front. Immunol. 8, 1687. doi:10.3389/fimmu.2017.01687
R Core Team (2021). R: A Language and Environment for Statistical Computing. Vienna, Austria: R Foundation for Statistical Computing. Available at: https://www.R-project.org/.
Reddy, M. S., Varghese, J., Venkataraman, J., and Rela, M. (2013). Matching Donor to Recipient in Liver Transplantation: Relevance in Clinical Practice. Wjh 5 (11), 603–611. doi:10.4254/wjh.v5.i11.603
Reindl‐Schwaighofer, R., Heinzel, A., Gualdoni, G. A., Mesnard, L., Claas, F. H. J., and Oberbauer, R. (2020). Novel Insights into non‐HLA Alloimmunity in Kidney Transplantation. Transpl. Int. 33 (1), 5–17. doi:10.1111/tri.13546
Reindl-Schwaighofer, R., Heinzel, A., Kainz, A., van Setten, J., Jelencsics, K., Hu, K., et al. (2019). Contribution of Non-HLA Incompatibility between Donor and Recipient to Kidney Allograft Survival: Genome-wide Analysis in a Prospective Cohort. The Lancet 393 (10174), 910–917. doi:10.1016/S0140-6736(18)32473-5
Schaid, D. J. (2010). Genomic Similarity and Kernel Methods I: Advancements by Building on Mathematical and Statistical Foundations. Hum. Hered. 70 (2), 109–131. doi:10.1159/000312641
Steers, N. J., Li, Y., Drace, Z., D’Addario, J. A., Fischman, C., Liu, L., et al. (2019). Genomic Mismatch at LIMS1 Locus and Kidney Allograft Rejection. N. Engl. J. Med. 380 (20), 1918–1928. doi:10.1056/NEJMoa1803731
Su, Z., Marchini, J., and Donnelly, P. (2011). HAPGEN2: Simulation of Multiple Disease SNPs. Bioinformatics 27 (16), 2304–2305. doi:10.1093/bioinformatics/btr341
Sun, J., Zheng, Y., and Hsu, L. (2013). A Unified Mixed-Effects Model for Rare-Variant Association in Sequencing Studies. Genet. Epidemiol. 37 (4), 334–344. doi:10.1002/gepi.21717
Tzeng, J.-Y., and Zhang, D. (2007). Haplotype-based Association Analysis via Variance-Components Score Test. Am. J. Hum. Genet. 81 (5), 927–938. doi:10.1086/521558
Wang, K., and Abbott, D. (2008). A Principal Components Regression Approach to Multilocus Genetic Association Studies. Genet. Epidemiol. 32 (2), 108–118. doi:10.1002/gepi.20266
Wang, T., and Elston, R. C. (2007). Improved Power by Use of a Weighted Score Test for Linkage Disequilibrium Mapping. Am. J. Hum. Genet. 80 (2), 353–360. doi:10.1086/511312
Wessel, J., and Schork, N. J. (2006). Generalized Genomic Distance-Based Regression Methodology for Multilocus Association Analysis. Am. J. Hum. Genet. 79 (5), 792–806. doi:10.1086/508346
Wu, M. C., Kraft, P., Epstein, M. P., Taylor, D. M., Chanock, S. J., Hunter, D. J., et al. (2010). Powerful SNP-Set Analysis for Case-Control Genome-wide Association Studies. Am. J. Hum. Genet. 86 (6), 929–942. doi:10.1016/j.ajhg.2010.05.002
Wu, M. C., Lee, S., Cai, T., Li, Y., Boehnke, M., and Lin, X. (2011). Rare-variant Association Testing for Sequencing Data with the Sequence Kernel Association Test. Am. J. Hum. Genet. 89 (1), 82–93. doi:10.1016/j.ajhg.2011.05.029
Yang, J. Y. C., and Sarwal, M. M. (2017). Transplant Genetics and Genomics. Nat. Rev. Genet. 18 (5), 309–326. doi:10.1038/nrg.2017.12
Zanoni, F., and Kiryluk, K. (2020). Genetic Background and Transplantation Outcomes: Insights from Genome-wide Association Studies. Curr. Opin. Organ. Transplant. 25 (1), 35–41. doi:10.1097/MOT.0000000000000718
Zeileis, A., and Hothorn, T. (2002). Diagnostic Checking in Regression Relationships. R. News 2 (3), 7–10. Available at: https://CRAN.R-project.org/doc/Rnews/.
Keywords: transplant genetics, multi-marker testing, joint testing, genetic matching scores, paired genetic data
Citation: Arthur VL, Li Z, Cao R, Oetting WS, Israni AK, Jacobson PA, Ritchie MD, Guan W and Chen J (2021) A Multi-Marker Test for Analyzing Paired Genetic Data in Transplantation. Front. Genet. 12:745773. doi: 10.3389/fgene.2021.745773
Received: 22 July 2021; Accepted: 23 September 2021;
Published: 13 October 2021.
Edited by:
Nianjun Liu, Indiana University Bloomington, United StatesReviewed by:
Zhaoxia Yu, University of California, Irvine, United StatesShaoyu Li, University of North Carolina at Charlotte, United States
Copyright © 2021 Arthur, Li, Cao, Oetting, Israni, Jacobson, Ritchie, Guan and Chen. This is an open-access article distributed under the terms of the Creative Commons Attribution License (CC BY). The use, distribution or reproduction in other forums is permitted, provided the original author(s) and the copyright owner(s) are credited and that the original publication in this journal is cited, in accordance with accepted academic practice. No use, distribution or reproduction is permitted which does not comply with these terms.
*Correspondence: Victoria L. Arthur, dmx5bm5AcGVubm1lZGljaW5lLnVwZW5uLmVkdQ==
†These authors have contributed equally to this work and share first authorship