 Lei Shi
 Zilu Wen
 Hongwei Li1
 Yanzheng Song
- 1Department of Thoracic Surgery, Shanghai Public Health Clinical Center, Fudan University, Shanghai, China
- 2Department of Scientific Research, Shanghai Public Health Clinical Center, Fudan University, Shanghai, China
- 3TB Center, Shanghai Emerging and Re-emerging Infectious Diseases Institute, Shanghai, China
Improving the understanding of the molecular mechanism of tuberculous pleurisy is required to develop diagnosis and new therapy strategies of targeted genes. The purpose of this study is to identify important genes related to tuberculous pleurisy. In this study, the expression profile obtained by sequencing the surgically resected pleural tissue was used to explore the differentially co-expressed genes between tuberculous pleurisy tissue and normal tissue. 29 differentially co-expressed genes were screened by weighted gene co-expression network analysis (WGCNA) and differential gene expression analysis methods. According to the functional annotation analysis of R clusterProfiler software package, these genes are mainly enriched in nucleotide−sugar biosynthetic process (biological process), ficolin−1−rich granule lumen (cell component), and electron transfer activity (molecular function). In addition, in the protein-protein interaction (PPI) network, 20 hub genes of DEGs and WCGNA genes were identified using the CytoHubba plug-in of Cytoscape. In the end, RPL17 was identified as a gene that can be the biomarker of tuberculous pleurisy. At the same time, there are seven genes that may have relationship with the disease (UBA7, NDUFB8, UQCRFS1, JUNB, PSMC4, PHPT1, and MAPK11).
Introduction
Tuberculosis is a very ancient disease, and some studies have pointed out that Mycobacterium tuberculosis infected humans five thousand years ago (Sinha et al., 2021). Tuberculous pleurisy is a kind of extrapulmonary tuberculosis, which also includes bone tuberculosis, lymphoid tuberculosis and so on (Reichler et al., 2020). According to the World Health Organization’s 2019 global report on tuberculosis, tuberculous pleurisy accounts for 30 per cent of all tuberculosis in developing countries (WHO Global, 2019; Tuberculosis ProgrammeGlobal, 2020). But at present, there is still no more accurate diagnostic means for tuberculous pleurisy, so it is impossible to achieve early diagnosis and early treatment of tuberculous pleurisy (Tuberculosis ProgrammeGlobal, 2020).
With the development of genome technology, bioinformatics is widely used in gene expression profile analysis (De Welzen et al., 2017). Figure 1 shows the research design and workflow of this study. Disease-specific biomarkers were found. Weighted gene co-expression network analysis of (WGCNA) is an important method to understand gene function and gene association from genome-wide expression (Langfelder and Horvath, 2008). WGCNA can be used to detect the co-expression modules of highly related genes and interested modules related to clinical characteristics (Zhang and Horvath, 2005), providing great insight for predicting the function of co-expression genes and finding genes that play a key role in human diseases (Li et al., 2018). In addition, another powerful analysis in transcriptomics is differential gene expression analysis, which provides a way to study the molecular mechanisms of genomic regulation and to find quantitative changes in expression levels between the experimental group and the control group (Saris et al., 2009; Yang et al., 2014; San Segundo-Val and Sanz-Lozano, 2016). This difference in gene expression may lead to the discovery of potential biomarkers for specific diseases. Therefore, two methods are used, combined with the results of WGCNA and differential gene expression analysis, to improve the recognition ability of highly related genes, which can be used as candidate biomarkers.

FIGURE 1. Study design and workflow of this study.
In this study, through the bioinformatics analysis of the sequencing data of pleural tissue collected during the operation, we hope to find the biomarkers that can be used for early diagnosis or treatment of tuberculous pleurisy. To contribute to the diagnosis and treatment of tuberculous pleurisy.
Materials and Methods
The workflow for screening hub genes is shown in Figure 1. We describe the screening process in detail in each section.
Acquisition of Transcriptome Sequencing Data
All the patients signed the informed consent form and completed the PET-CT examination before operation. During the operation of each patient, we obtained the pleura with high metabolic activity (PET-high) and low metabolic activity (PET-low) according to FDG PET-CT. Total RNA of each sample was extracted by TRIzol Reagent (Invitrogen, US) and RNeasy Mini Kit (Qiagen, Germany) according to the instructions of kit. Total RNA of each sample was quantified by Agilent 2100 Bioanalyzer (Agilent Technologies, United States), NanoDrop (Thermo Fisher Scientific Inc., United States). Total RNA (1 μg) with the value of RNA integrity number (RIN) > 7 was used for library preparation, which conducted by the NEBNext Ultra II Directional RNA Library Prep. Kit of Illumina. The rRNA was depleted from total RNA using Ribo-Zero™ rRNA removal Kit (Illumina, United States), and cDNA libraries were generated by protocols. Then, libraries with different indices were multiplexed and loaded on Illumina HiSeq instrument (Illumina, United States) for 2 × 150 paired-end sequencing in the Medical Laboratory of Nantong ZhongKe. Finally, the row reads were transformed as gene expression matrix by Trimmomatic (version 0.30), which was used to subsequently analysis. A total of 15 samples were included in the study, of which nine samples were PET-high and six samples were PET-low. This study was approved by the Ethics Committee of the Shanghai Public Health Clinical Center.
Identification of Co-Expression Module Based on WGCNA
Co-expression network is a gene screening method which is based network that can be used to screen possible biomarkers and therapeutic targets. In this study, we constructed a co-expression network based on gene expression matrix and implemented it using R-package WGCNA (Langfelder and Horvath, 2008). WGCNA was used to explore the modules of highly correlated genes among samples for relating modules to external sample traits. To build a scale-free network, soft powers β = 3 and 20 were selected using the function pickSoftThreshold. Next, the adjacency matrix was created by the following formula:
and was transformed into a topological overlap matrix (TOM) as well as the corresponding dissimilarity (1-TOM). Afterwards, a hierarchical clustering dendrogram of the 1-TOM matrix was constructed to classify the similar gene expressions into different gene co-expression modules. To further identify functional modules in a co-expression network, the module-trait associations between modules, and clinical trait information were calculated according to the clinical data (Wang et al., 2019). Therefore, modules with high correlation coefficient were considered candidates relevant to clinical traits, and were selected for subsequent analysis.
Identification of DEGs and Interaction With the Modules
We used R-package limma to screen DEGs, and DEGs were screened based on gene expression matrix (Ritchie et al., 2015). The limma package was used to analyze sequencing data and microarray data, and was a commonly used tool in bioinformatics. The screening criterion of DEGs were as follows: p-value < 0.05 and |logFC| > 1. The DEGs were visualized as a volcano plot and heatmap by using the R package ggplot2 and pheatmap. Subsequently, the overlapping genes between DEGs and co-expression genes that were extracted from the co-expression network were used to identify potential valueable genes, which were presented as a Venn diagram using the R package VennDiagram (Chen and Boutros, 2011).
Functional Annotation for Genes
In order to describe the function and pathway of the selected gene, we conducted analysis using R package clusterProfiler (Yu et al., 2012), with a cut-off criterion of adjusted p < 0.05. Gene Ontology (GO) analysis consists of three different parts, biological process (BP), cellular component (CC), and molecular function (MF), which can accurately describe the function of the gene. Kyoto Encyclopedia of Genes and Genomes (KEGG) analysis describes the pathways involved in genes (Balachandran et al., 2015; Kanehisa et al., 2017).
Construction of PPI and Screening of Hub Genes
In our study, we used the STRING (Search Tool for the Retrieval of Interacting Genes) online tool, which is designed for predicting protein–protein interactions (PPI), to construct a PPI network of selected genes (Szklarczyk et al., 2015). Using the STRING database, genes with a score ≥0.4 were chosen to build a network model visualized by Cytoscape (v3.8.0) (Smoot et al., 2011). In PPI network, Maximal Clique Centrality (MCC) algorithm was reported to be the most effective method of finding hub nodes. The MCC of each node was calculated by CytoHubba (Chin et al., 2014), a plugin in Cytoscape. In this study, the genes with the top 20 MCC values were considered as hub genes. Subsequently, we used the R package VennDiagram to identify key genes related to tuberculosis pleurisy.
Results
Identification of Weighted Gene Co-Expression Modules
In order to find the gene-set most related to the tissue with PET-high, we established a gene weighted co-expression network. Each gene set was treated as a module, and each module was assigned a different color. A total of 15 modules were identified (Figure 2A), and then we drew a module-phenotypic relationship heatmap to evaluate the relationship between modules and clinical phenotypes. The results of the model-phenotypic relationship were shown in Figure 2B, indicating that the grey module in the gene matrix has the highest correlation with the tissue with PET-high.
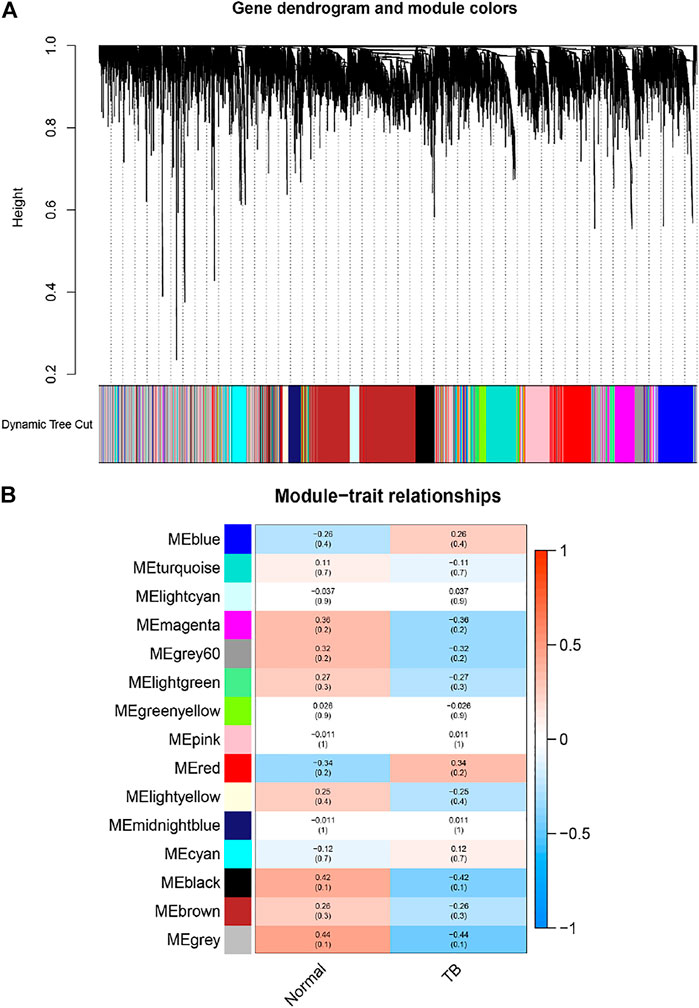
FIGURE 2. Identification of modules associated with the clinical information in the dataset. (A) The Cluster dendrogram of co-expression network modules was ordered by a hierarchical clustering of genes based on the 1-TOM matrix. Each module was assigned different colors. Each module contains genes that belong to the same center in a weighted co-expression network. These genes in module had the same expression profiles. (B) Module-trait relationships. Each row corresponds to a color module and column corresponds to a clinical trait (TB and normal). Each cell contains the corresponding correlation and p-value. The module with the highest correlation coefficient had the greatest association with tuberculous pleurisy.
Intersection Between DEGs and Co-Expression Modules
Based on the cut-off criteria of |logFC| ≥ 1.0 and p < 0.05, a total of 62 DEGs in the gene matrix were found to be dysregulated in tissues with PET-high by the limma package (Figures 3A,B). As shown in Figure 3C, 1178 co-expression genes were found in the grey module in gene matrix. In total, the 29 overlapping genes were extracted as key genes in tissues with PET-high (Figure 3C).
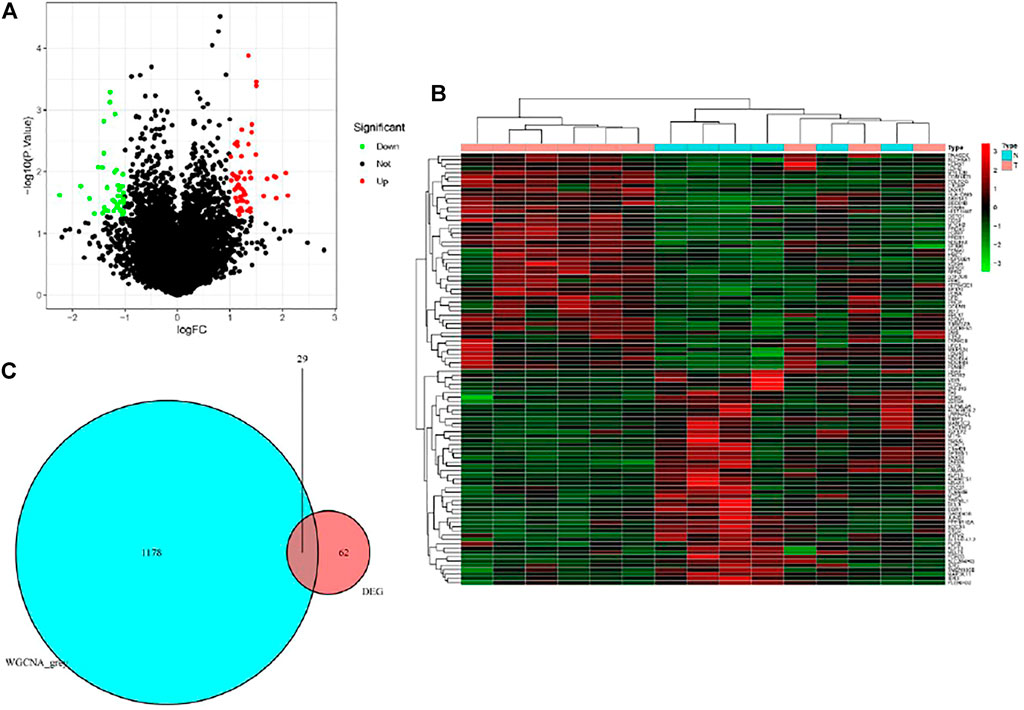
FIGURE 3. Identification of differentially expressed genes (DEGs) in the datasets with the cut-off criteria of |logFC| ≥ 1.0 and p < 0.05. (A) Volcano plot of DEGs. (B) Heatmap of DEGs. (C) The Venn diagram of genes among DEG list and co-expression module. In total, 29 overlapping genes in the intersection of DEG lists and co-expression module.
Functional Enrichment Analyses for Selected Genes
In order to further understand the functions and pathways of the co-expression module (Supplementary Table S1), DEGs (Supplementary Table S2) and 29 overlapping genes (Supplementary Table S3), we used clusterProfiler R package for functional enrichment analysis. After screening of GO enrichment analysis, we observed several enriched gene sets shown in Figure 4A; Tables 1, 2. The genes in grey module mainly enriched in cell activation involved in immune response, cellular protein catabolic process and protein domain specific binding. The DEGs mainly enriched in regulation of inflammatory response, regulation of hemopoiesis and negative regulation of immune system process. The 29 overlapping genes mainly enriched in neutrophil degranulation, neutrophil activation involved in immune response and neutrophil activation. After screening of KEGG enrichment analysis, we observed several enriched gene sets shown in Figure 4B; Tables 3, 4. The genes in grey module mainly enriched in Endocytosis, Epstein-Barr virus infection and Human T-cell leukemia virus 1 infection. The DEGs mainly enriched in Complement and coagulation cascades, Proteasome and Arginine and proline metabolism. The 29 overlapping genes mainly enriched in Pathways of neurodegeneration-multiple diseases, Prion disease and Amyotrophic lateral sclerosis.
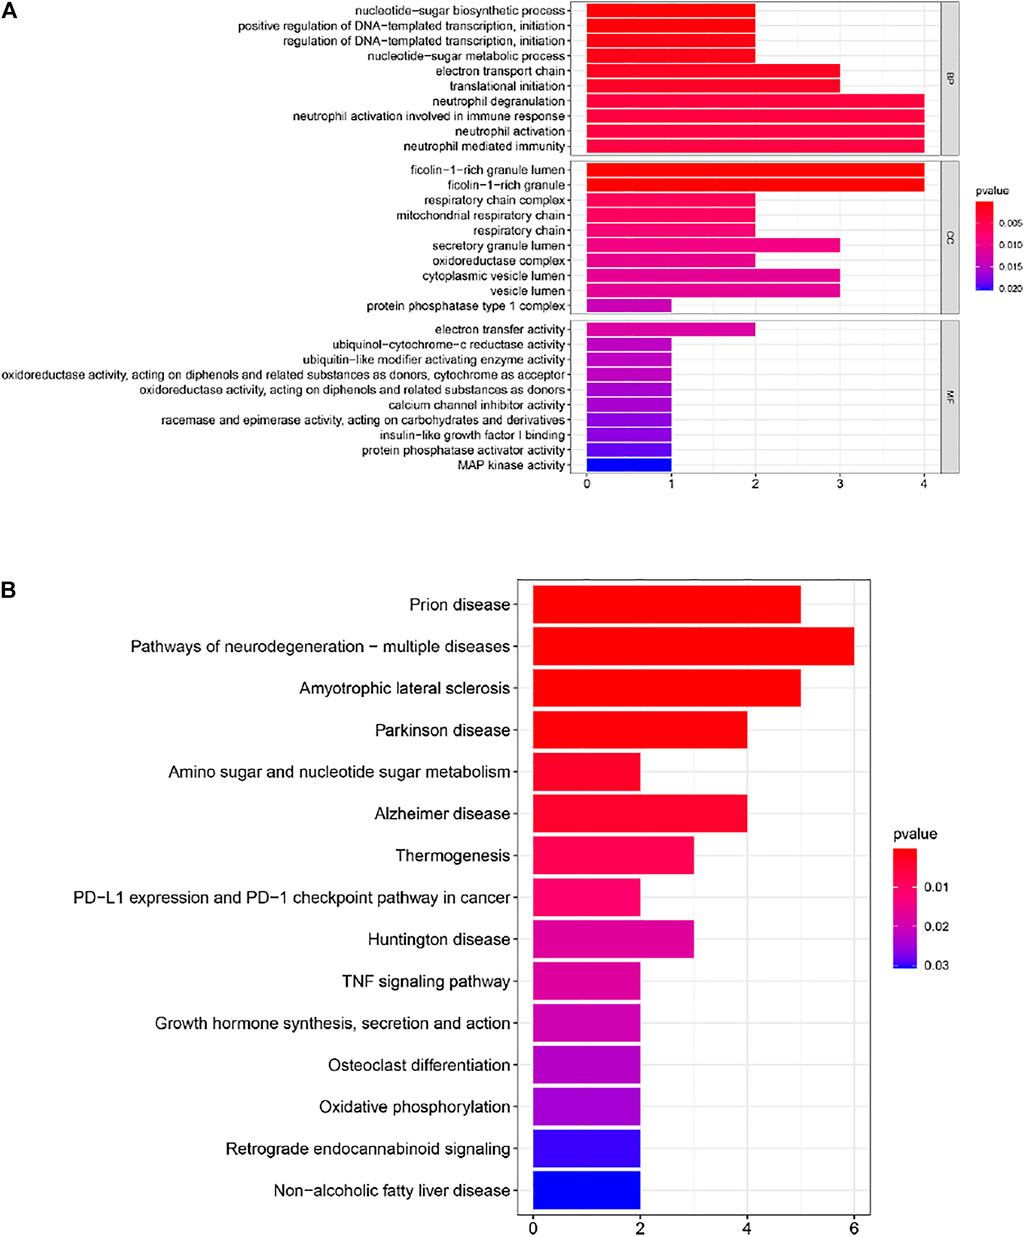
FIGURE 4. (A) Gene Ontology (GO) enrichment analysis for the 29 genes. (B) Kyoto Encyclopedia of Genes and Genomes (KEGG) enrichment analysis for 29 genes. The color represents the adjusted p-values (BH), and the size of the bars represents the gene number.
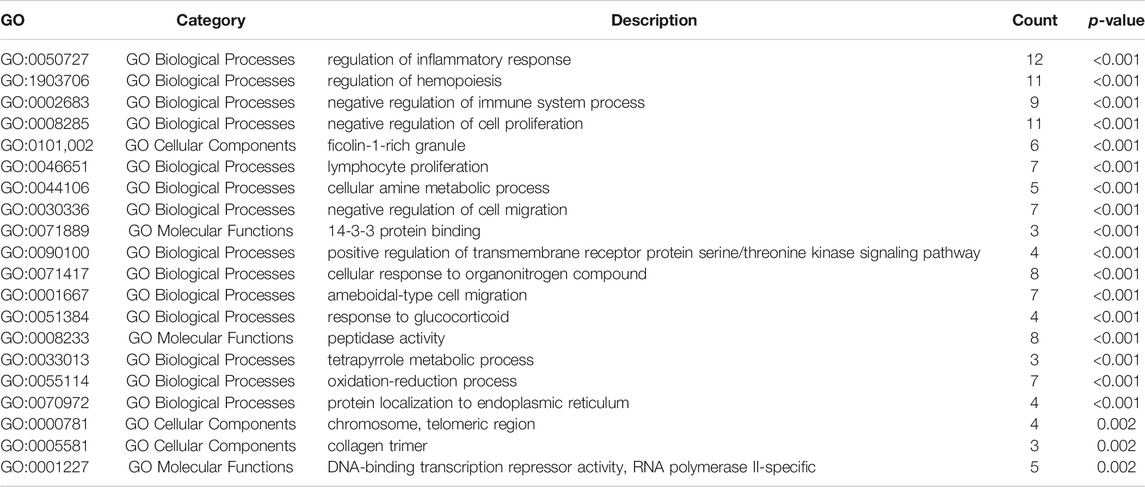
TABLE 1. GO analysis of DEGs.
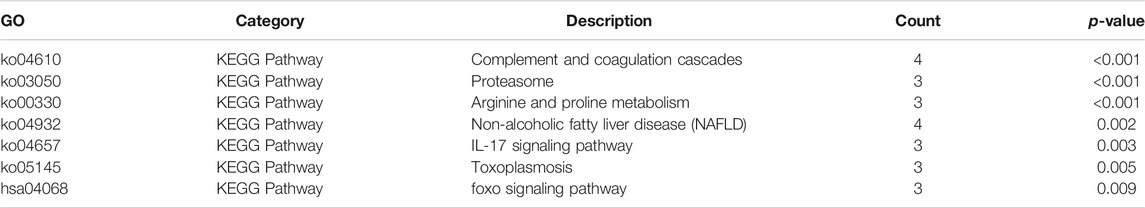
TABLE 2. KEGG analysis of DEGs.
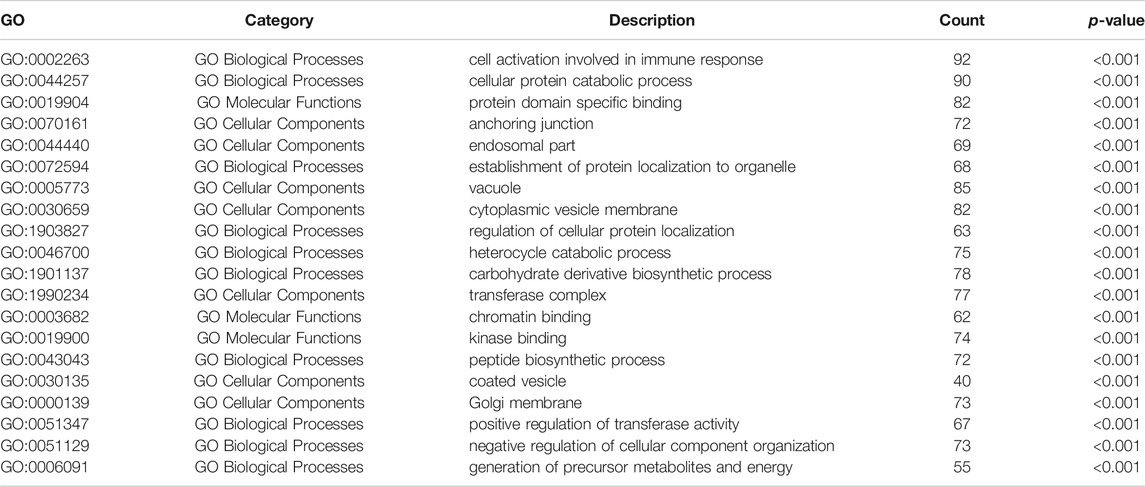
TABLE 3. GO analysis of WCGNA grey module.
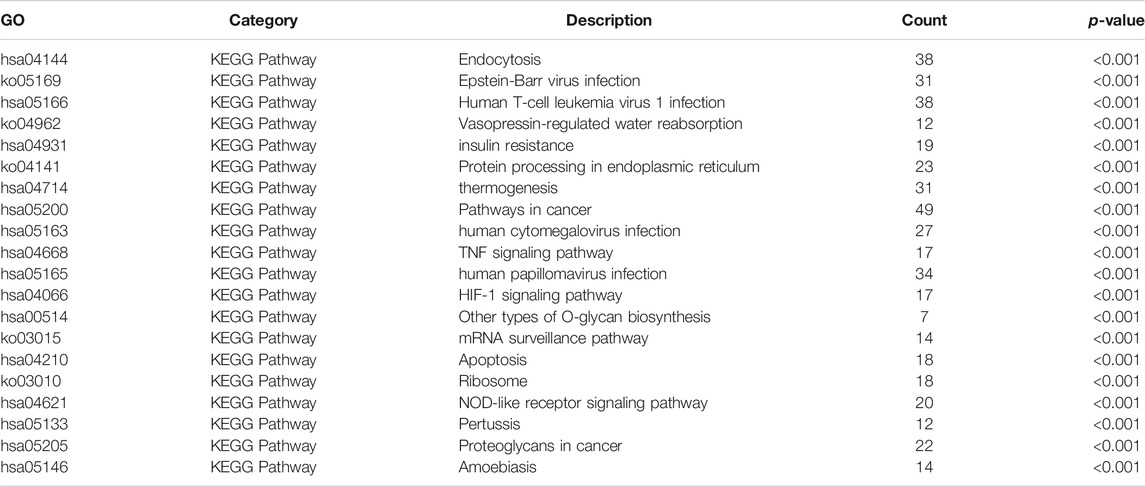
TABLE 4. KEGG analysis of WCGNA grey module.
PPI Network Construction and Hub Genes Identification
The PPI network of the grey module and DEGs was established by using the STRING database. The hub genes selected from the PPI network using the MCC algorithm of CytoHubba plugin were shown in Figures 5A,B. Then, the top 20 MCC scores genes were identified as hub genes. The intersection among hub genes in grey module, hub genes of DEGs and 29 overlapping genes was used to screen key genes as biomarker (Figure 5C). Finally, one gene named RPL17 was the candidate biomarker, and seven genes included UBA7, NDUFB8, UQCRFS1, JUNB, PSMC4, PHPT1, and MAPK11 can also be the candidate biomarkers.
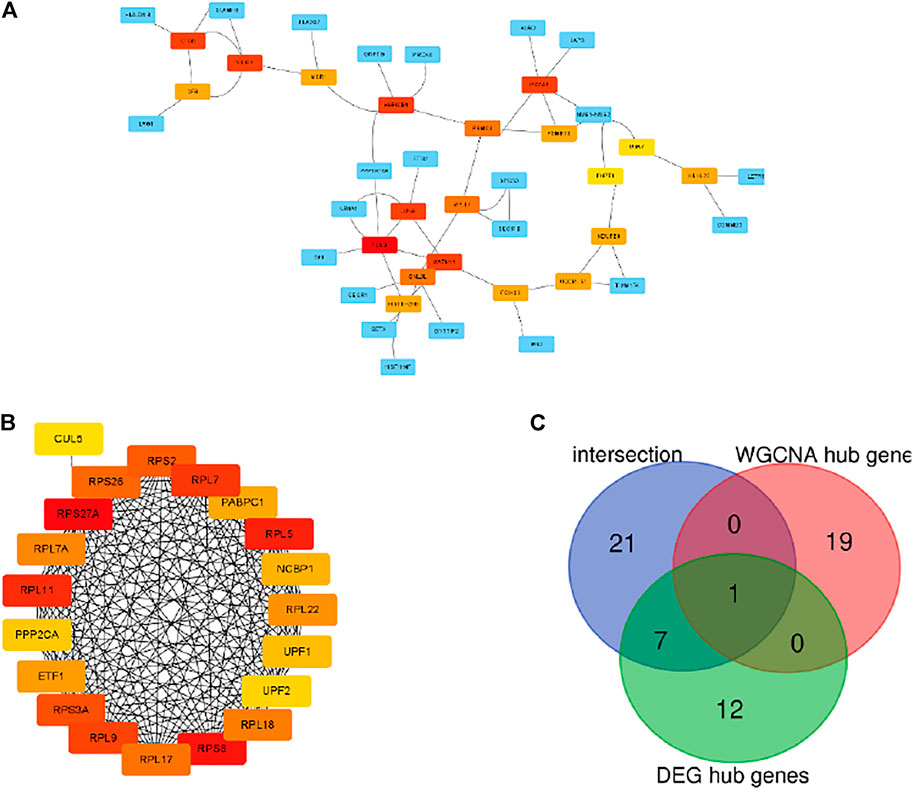
FIGURE 5. Visualization of the protein-protein interaction (PPI) network and the candidate hub genes. (A) PPI network of the hub genes of DEGs list. (B) Identification of the hub genes of WGCNA grey module from the PPI network using maximal clique centrality (MCC) algorithm. Edges represent the protein-protein associations. The red nodes represent genes with a high MCC sores, while the yellow node represent genes with a low MCC sore. (C) The venn diagram among intersection gene list, WGCNA hub gens and DEG hub genes.
Discussion
Tuberculous pleurisy is an uncommon type of tuberculosis in developed countries, but it is more common in developing countries. According to the global report on tuberculosis of the World Health Organization, tuberculous pleurisy accounts for only 3% tuberculosis in developed countries, more than 30% in India and 20% in China. Pleural effusion caused by tuberculous pleurisy can lead to shortness of breath, fever, and other clinical symptoms. However, there are still difficulties in the diagnosis and treatment of tuberculous pleurisy. In this study, through transcriptome sequencing and bioinformatics analysis of surgically resected pleural tissue, we hope to find a biomarker that can be used in the diagnosis and treatment of tuberculous pleurisy. A total of eight possible biomarkers of tuberculous pleurisy were screened (RPL17, UBA7, NDUFB8, UQCRFS1, JUNB, PSMC4, PHPT1, and MAPK11). Through GO analysis and KEGG analysis of these genes, we found that the main functions of these genes were immune response and protein synthesis. In addition, we conducted MCC analysis, and the intersection of the three gene sets was screened out. In the intersection there was only one gene, that is, RPL17. Finally, we determined that RPL17 may be a biomarker of tuberculous pleurisy.
RPL17, also known as ribosomal protein L17, belongs to the L22P family of ribosomal proteins. Ribosome is an important unit involved in protein synthesis, which is composed of 40s subunit, 60s subunit and ribosomal RNA. RPL17 encodes a ribosomal protein in the 60s subunit (Smolock et al., 2012; Zhang et al., 2013). The expression of RPL17 is significantly increased in organs with increased protein synthesis, such as ovaries, bone marrow, and lymph nodes (Wang et al., 2015; Huang et al., 2016). Some studies have pointed out that under the pathological condition, the protein synthesis and metabolism of some organs will be enhanced, which is consistent with our research results (Yuan et al., 2018; Jahejo et al., 2020). However, a study has suggested that RPL17 may act outside the ribosome. A study from the United States showed that RPL17 is an inhibitor of vascular smooth muscle cell growth and can inhibit the formation of the inner lining of the internal carotid artery (Smolock et al., 2012). This suggests that RPL17 is not restricted to acting within the ribosome. It is possible that there is also an extra-ribosomal mechanism of RPL17 in tuberculous pleurisy, which requires further studies to confirm. In tuberculous pleurisy, the enhancement of protein anabolism may be an important mechanism of fibrosis, which is closely related to the diagnosis and treatment of tuberculous pleurisy.
There are several shortcomings in this study. First of all, RPL17 as a diagnostic or therapeutic biomarker requires a large number of blood samples for verification. Secondly, the detailed biomolecular mechanism of RPL17 still needs a lot of experiments to explore. Finally, although we have performed a detailed bioinformatics analysis, some genes that play a key role in the occurrence and development of tuberculous pleurisy may still be missed. We hope to solve the above problems step by step in the follow-up study.
In summary, by integrating WGCNA with differential gene expression analysis, our study generated the significant gene RPL17 that has potential for diagnosis and treatment in tuberculous pleurisy.
Data Availability Statement
The data presented in the study are deposited in the GEO repository, accession number PRJNA780665.
Ethics Statement
The studies involving human participants were reviewed and approved by Shanghai public health clinical center ethics committee. The patients/participants provided their written informed consent to participate in this study.
Author Contributions
Study design: YS. Data collection: LS and ZW. Data analysis: LS. Writing: LS and HL.
Funding
This research was supported by a grant from the Thirteen-Fifth Mega-Scientific Project on “prevention and treatment of AIDS, viral hepatitis and other infectious diseases” (grant no. 2017ZX10201301-003-002)
Conflict of Interest
The authors declare that the research was conducted in the absence of any commercial or financial relationships that could be construed as a potential conflict of interest.
Publisher’s Note
All claims expressed in this article are solely those of the authors and do not necessarily represent those of their affiliated organizations, or those of the publisher, the editors and the reviewers. Any product that may be evaluated in this article, or claim that may be made by its manufacturer, is not guaranteed or endorsed by the publisher.
Supplementary Material
The Supplementary Material for this article can be found online at: https://www.frontiersin.org/articles/10.3389/fgene.2021.730491/full#supplementary-material
Reference
Balachandran, V. P., Gonen, M., Smith, J. J., and DeMatteo, R. P. (2015). Nomograms in Oncology: More Than Meets the Eye. Lancet Oncol. 16 (4), e173–e180. doi:10.1016/s1470-2045(14)71116-7
Chen, H., and Boutros, P. C. (2011). VennDiagram: a Package for the Generation of Highly-Customizable Venn and Euler Diagrams in R. BMC bioinformatics 12, 35. doi:10.1186/1471-2105-12-35
Chin, C.-H., Chen, S.-H., Wu, H.-H., Ho, C.-W., Ko, M.-T., and Lin, C.-Y. (2014). cytoHubba: Identifying Hub Objects and Sub-networks from Complex Interactome. BMC Syst. Biol. 8, S11. doi:10.1186/1752-0509-8-s4-s11
De Welzen, L., Eldholm, V., Maharaj, K., Manson, A. L., Earl, A. M., and Pym, A. S. (2017). Whole-Transcriptome and -Genome Analysis of Extensively Drug-Resistant Mycobacterium tuberculosis Clinical Isolates Identifies Downregulation of ethA as a Mechanism of Ethionamide Resistance. Antimicrob. Agents Chemother. 61 (12). doi:10.1128/AAC.01461-17
Huang, X., Gao, Y., Jiang, B., Zhou, Z., and Zhan, A. (2016). Reference Gene Selection for Quantitative Gene Expression Studies during Biological Invasions: A Test on Multiple Genes and Tissues in a Model Ascidian Ciona Savignyi. Gene 576, 79–87. doi:10.1016/j.gene.2015.09.066
Jahejo, A. R., Zhang, D., Niu, S., Mangi, R. A., Khan, A., Qadir, M. F., et al. (2020). Transcriptome-based Screening of Intracellular Pathways and Angiogenesis Related Genes at Different Stages of Thiram Induced Tibial Lesions in Broiler Chickens. BMC genomics 21 (1), 50. doi:10.1186/s12864-020-6456-9
Kanehisa, M., Furumichi, M., Tanabe, M., Sato, Y., and Morishima, K. (2017). KEGG: New Perspectives on Genomes, Pathways, Diseases and Drugs. Nucleic Acids Res. 45, D353–D361. doi:10.1093/nar/gkw1092
Langfelder, P., and Horvath, S. (2008). WGCNA: an R Package for Weighted Correlation Network Analysis. BMC bioinformatics 9, 559. doi:10.1186/1471-2105-9-559
Li, J., Zhou, D., Qiu, W., Shi, Y., Yang, J.-J., Chen, S., et al. (2018). Application of Weighted Gene Co-expression Network Analysis for Data from Paired Design. Sci. Rep. 8 (1), 622. doi:10.1038/s41598-017-18705-z
Reichler, M. R., Khan, A., Sterling, T. R., Zhao, H., Chen, B., Yuan, Y., et al. (2020). Risk Factors for Tuberculosis and Effect of Preventive Therapy Among Close Contacts of Persons with Infectious Tuberculosis. Clin. Infect. Dis. : official Publ. Infect. Dis. Soc. America 70 (8), 1562–1572. doi:10.1093/cid/ciz438
Ritchie, M. E., Phipson, B., Wu, D., Hu, Y., Law, C. W., Shi, W., et al. (2015). Limma powers Differential Expression Analyses for RNA-Sequencing and Microarray Studies. Nucleic Acids Res. 43 (7), e47. doi:10.1093/nar/gkv007
San Segundo-Val, I., and Sanz-Lozano, C. S. (2016). Introduction to the Gene Expression Analysis. Methods Mol. Biol. (Clifton, NJ) 1434, 29–43. doi:10.1007/978-1-4939-3652-6_3
Saris, C. G., Horvath, S., van Vught, P. W., van Es, M. A., Blauw, H. M., Fuller, T. F., et al. (2009). Weighted Gene Co-expression Network Analysis of the Peripheral Blood from Amyotrophic Lateral Sclerosis Patients. BMC genomics 10, 405. doi:10.1186/1471-2164-10-405
Sinha, P., Lönnroth, K., Bhargava, A., Heysell, S. K., Sarkar, S., Salgame, P., et al. (2021). Food for Thought: Addressing Undernutrition to End Tuberculosis. Lancet Infect. Dis. doi:10.1016/s1473-3099(20)30792-1
Smolock, E. M., Korshunov, V. A., Glazko, G., Qiu, X., Gerloff, J., and Berk, B. C. (2012). Ribosomal Protein L17, RpL17, Is an Inhibitor of Vascular Smooth Muscle Growth and Carotid Intima Formation. Circulation 126 (20), 2418–2427. doi:10.1161/circulationaha.112.125971
Smoot, M. E., Ono, K., Ruscheinski, J., Wang, P.-L., and Ideker, T. (2011). Cytoscape 2.8: New Features for Data Integration and Network Visualization. Bioinformatics 27 (3), 431–432. doi:10.1093/bioinformatics/btq675
Szklarczyk, D., Franceschini, A., Wyder, S., Forslund, K., Heller, D., Huerta-Cepas, J., et al. (2015). STRING V10: Protein-Protein Interaction Networks, Integrated over the Tree of Life. Nucleic Acids Res. 43, D447–D452. doi:10.1093/nar/gku1003
Tuberculosis Programme Global, (2020). WHO Consolidated Guidelines on Tuberculosis: Module 1: Prevention: Tuberculosis Preventive Treatment. Geneva: World Health Organization.
Wang, C. C. N., Li, C. Y., Cai, J. H., Sheu, P. C., Tsai, J. J. P., Wu, M. Y., et al. (2019). Identification of Prognostic Candidate Genes in Breast Cancer by Integrated Bioinformatic Analysis. J. Clin. Med. 8 (8). doi:10.3390/jcm8081160
Wang, M., Parshin, A. V., Shcherbik, N., and Pestov, D. G. (2015). Reduced Expression of the Mouse Ribosomal Protein Rpl17 Alters the Diversity of Mature Ribosomes by Enhancing Production of Shortened 5.8S rRNA. Rna 21 (7), 1240–1248. doi:10.1261/rna.051169.115
Yang, Y., Han, L., Yuan, Y., Li, J., Hei, N., and Liang, H. (2014). Gene Co-expression Network Analysis Reveals Common System-Level Properties of Prognostic Genes across Cancer Types. Nat. Commun. 5, 3231. doi:10.1038/ncomms4231
Yu, G., Wang, L.-G., Han, Y., and He, Q.-Y. (2012). clusterProfiler: an R Package for Comparing Biological Themes Among Gene Clusters. OMICS: A J. Integr. Biol. 16 (5), 284–287. doi:10.1089/omi.2011.0118
Yuan, F., Wang, W., and Cheng, H. (2018). Co-expression Network Analysis of Gene Expression Profiles of HER2+ Breast Cancer-Associated Brain Metastasis. Oncol. Lett. 16 (6), 7008–7019. doi:10.3892/ol.2018.9562
Zhang, B., and Horvath, S. (2005). A General Framework for Weighted Gene Co-expression Network Analysis. Stat. Appl. Genet. Mol. Biol. 4. doi:10.2202/1544-6115.1128
Keywords: tuberculous pleurisy, differential gene expression analysis, weighted gene co-expression network analysis, the differential co-expression genes, biomarkers
Citation: Shi L, Wen Z, Li H and Song Y (2021) Identification of Hub Genes Associated With Tuberculous Pleurisy by Integrated Bioinformatics Analysis. Front. Genet. 12:730491. doi: 10.3389/fgene.2021.730491
Received: 25 June 2021; Accepted: 26 October 2021;
Published: 03 December 2021.
Edited by:
Divakar Sharma, University of Delhi, IndiaReviewed by:
Amit Dubey, Independent researcher, Khushinagar, IndiaPaul Lasko, McGill University, Canada
Copyright © 2021 Shi, Wen, Li and Song. This is an open-access article distributed under the terms of the Creative Commons Attribution License (CC BY). The use, distribution or reproduction in other forums is permitted, provided the original author(s) and the copyright owner(s) are credited and that the original publication in this journal is cited, in accordance with accepted academic practice. No use, distribution or reproduction is permitted which does not comply with these terms.
*Correspondence: Yanzheng Song, eWFuemhlbmdzb25nQDE2My5jb20=
†These authors contributed equally to this work.