 Xiao-Li Zhang1
 Bo-Ping Han
- 1Department of Ecology, Jinan University, Guangzhou, China
- 2Division of Biological Sciences, College of Arts and Sciences, University of the Philippines Visayas, Iloilo, Philippines
- 3Department of Biology, Ghent University, Ghent, Belgium
Phyllodiaptomus tunguidus (Copepoda: Calanoida) is largely endemic to and widespread in freshwater in southern China, where it inhabits a complex landscape from lowland to highland across an elevation gradient of 2000m. A deep genetic differentiation can be expected between its most distant geographic populations. Here, we sequenced nine mitogenomes from diverse populations. All mitogenomes contained 37 genes, including 13 protein-coding genes (PCG), two rRNA genes, 22 tRNA genes and one control region. Their base composition, genetic distance and tRNA structure indeed revealed a wide differentiation between mitogenomes. Two P. tunguidus from Guangxi near Vietnam differed from the other seven by up to 10.1%. Their tRNA-Arg had a complete clover-leaf structure, whereas that of the others did not contain an entire dihydrouridine arm. The nine mitogenomes also differed in the length of rRNA. NJ, ML, and Bayesian analyses all split them into two clades, viz. the two P. tunguidus from Guangxi (Clade 1), and the other seven (Clade 2). Both the structure and phylogeny of the mitogenomes suggest that P. tunguidus has complex geographic origin, and its populations in Clade 1 have long lived in isolation from those in Clade 2. They currently reach the level of subspecies or cryptic species. An extensive phylogenetic analysis of Copepoda further verified that Diaptomidae is the most recently diverging family in Calanoida and that P. tunguidus is at the evolutionary apex of the family.
Introduction
Copepods are omnipresent in aquatic ecosystems. They are extremely abundant in freshwater and constitute a major component of most planktonic, benthic and groundwater communities, including semi-terrestrial situations such as damp mosses and leaf litter on forest floors (Boxshall and Jaume, 2000; Boxshall and Defaye, 2008). Of an estimated 13,000 morphospecies known, about 2,800 species inhabit freshwater. Freshwater copepods are comprised of five orders (Calanoida, Harpacticoida, Cyclopoida, Gelyelloida, and Siphonostomatoida; Boxshall and Halsey, 2004). Among them, calanoids show interesting ecological characteristics (Andronov, 1974; Park, 1986; Blanco-Bercial et al., 2011). Diaptomidae (Sars, 1903) is the dominant family in inland waters of Europe, Asia, North America, Africa, and northern low-altitude South America.
Most freshwater Diaptomidae are planktonic, inhabiting the pelagic (Boxshall and Defaye, 2008). They are filter-feeding and an important regulator of bottom-up (available resources) and top-down (consumers) effects in freshwater zooplankton communities (Gliwicz, 2002; Lin et al., 2018). They respond quickly to environmental changes and most are endemic to well-defined regions (Matsumura-Tundisi and Tundisi, 2003; Boxshall and Defaye, 2008). As copepods have a high dispersal potential, it is interesting to know how much their populations differentiate within species’ ranges (Marrone et al., 2013). Molecular phylogenetic analysis with mitochondrial DNA has been used in a variety of studies including evolutionary genomics, systematics, and molecular evolution has become a robust and reliable tool due to such unique features of mitogenomes as high mutation rates, an absence of introns, and maternal inheritance (Ki et al., 2009). In calanoids, several partial mitochondrial sequences, such as Cytb, COI, and 16S rRNA, have been utilized for species diagnoses (Marrone et al., 2013; Perbiche-Neves et al., 2015; Previšić et al., 2016), phylogenetic analysis (Blanco-Bercial et al., 2011) and population genetics (Makino and Tanabe, 2009; Chen and Hares, 2011). For a phylogenetic relationship multiple gene analysis is more powerful than analysis using single markers (Blanco-Bercial et al., 2011). Complete mitochondrial sequences can provide improved resolution and sensitivity in such investigations. The complete mitogenomes of copepods are typically circular molecules, approximately 16kb in length (Jooste et al., 2019). Overall, they consist of 37 genes, including 13 protein coding genes (PCGs), two ribosomal RNA genes (rRNAs), 22 transfer RNA genes (tRNAs), and a control region.
To date, only two complete mitochondrial genomes have been isolated from Diaptomidae, a tiny fraction of the number of known species (Jooste et al., 2019; Zhang et al., 2020b). Here, we discuss another eight geographical mitogenomes of Phyllodiaptomus tunguidus, a freshwater species, widespread in a variety of waters including ponds, lakes and reservoirs in southern China (Chen, 1990; Dumont and Reddy, 1993; Xue et al., 2006). Shen and Tai (1964) first described it from Guangdong Province, southern China. Dumont and Reddy (1993) re-described the species from the River Li in Guangxi and Lake Erh in Yunnan Province, also southern China, and they characterized it as a Chinese endemic (Dumont and Reddy, 1993). Literature and our own field investigation show that most of P. tunguidus is currently distributed in the Pearl River Basin, but also in Hunan, Sichuan and Fujian provinces (Chen, 1990; Dumont and Reddy, 1993). From lowland (Guangdong) to highland (Yunnan), this includes a complex landscape with an elevation gradient of 2000m, mainly pertaining to the Pearl River Basin. This large area not only has a strong environmental gradient, but also a complex geological history, affected by the uplift of the Tibetan Plateau (Hall, 2002; Clark et al., 2004; Zheng, 2015). Therefore, a deep genetic differentiation is expected between at least the most extreme of its geographic populations. To document this, we here sequenced eight mitogenomes of far-apart geographical origin plus the mitogenome we previously sequenced (Zhang et al., 2020b). We searched for differences in genomic structure, base composition, codon usage, gene order, and other genetic information. We also conducted an extensive phylogenetic analysis that included 11 species from other copepod groups. Such a comparative analysis of whole mitogenomes was expected to provide new insights into the evolutionary relationships in Copepoda and to reaffirm the taxonomic position of P. tunguidus.
Materials and Methods
Sample Collections, Identification, and DNA Extraction
Eight populations of P. tunguidus were sampled across southern China, one from Yunnan Province [Cibi Lake in Dali (CBH, 99.95°E, 26.15°N)], three from Guangxi Province, [Naban Reservoir (NB, 108.07°E, 22.02°N), Tianbao Reservoir (TB, 108.24°E, 22.87°N), Dalonghu Reservoir (DLH, 108.56°E, 23.61°N)], and four from Guangdong Province [Gaozhou Reservoir (GZR, 111.01°E, 21.69°N), a pond in Gaozhou (GZP, 110.87°E, 21.71°N), Xiaokeng Reservoir (XK, 113.84°E, 24.72°N) and a pond in Guangzhou Botanical Garden (ZWY, 113.283°E, 23.31°N; Figure 1)]. One previously sequenced mitogenome (GenBank accession: MN927223) came from Liuxihe Reservoir (LXH, 113.46°E, 23.76°N) in Guangdong Province, also southern China. The samples were fixed in 100% ethanol for total DNA extraction. All the specimens were identified following the description and illustration in Dumont and Reddy (1993). Total genomic DNA was extracted by the TIANamp Marine Animals DNAKit (TIANGEN BIOTECH CO., LTD) according to the manufacturer’s instructions. In order to verify whether these eight specimens represent the entire distribution range, we constructed a phylogenetic tree based on Cytb sequences (details in the Supplementary Table S2). The Bayesian tree of Cytb built with BEAST split P. tunguidus into two Clades with strong support (Supplementary Figure S1).
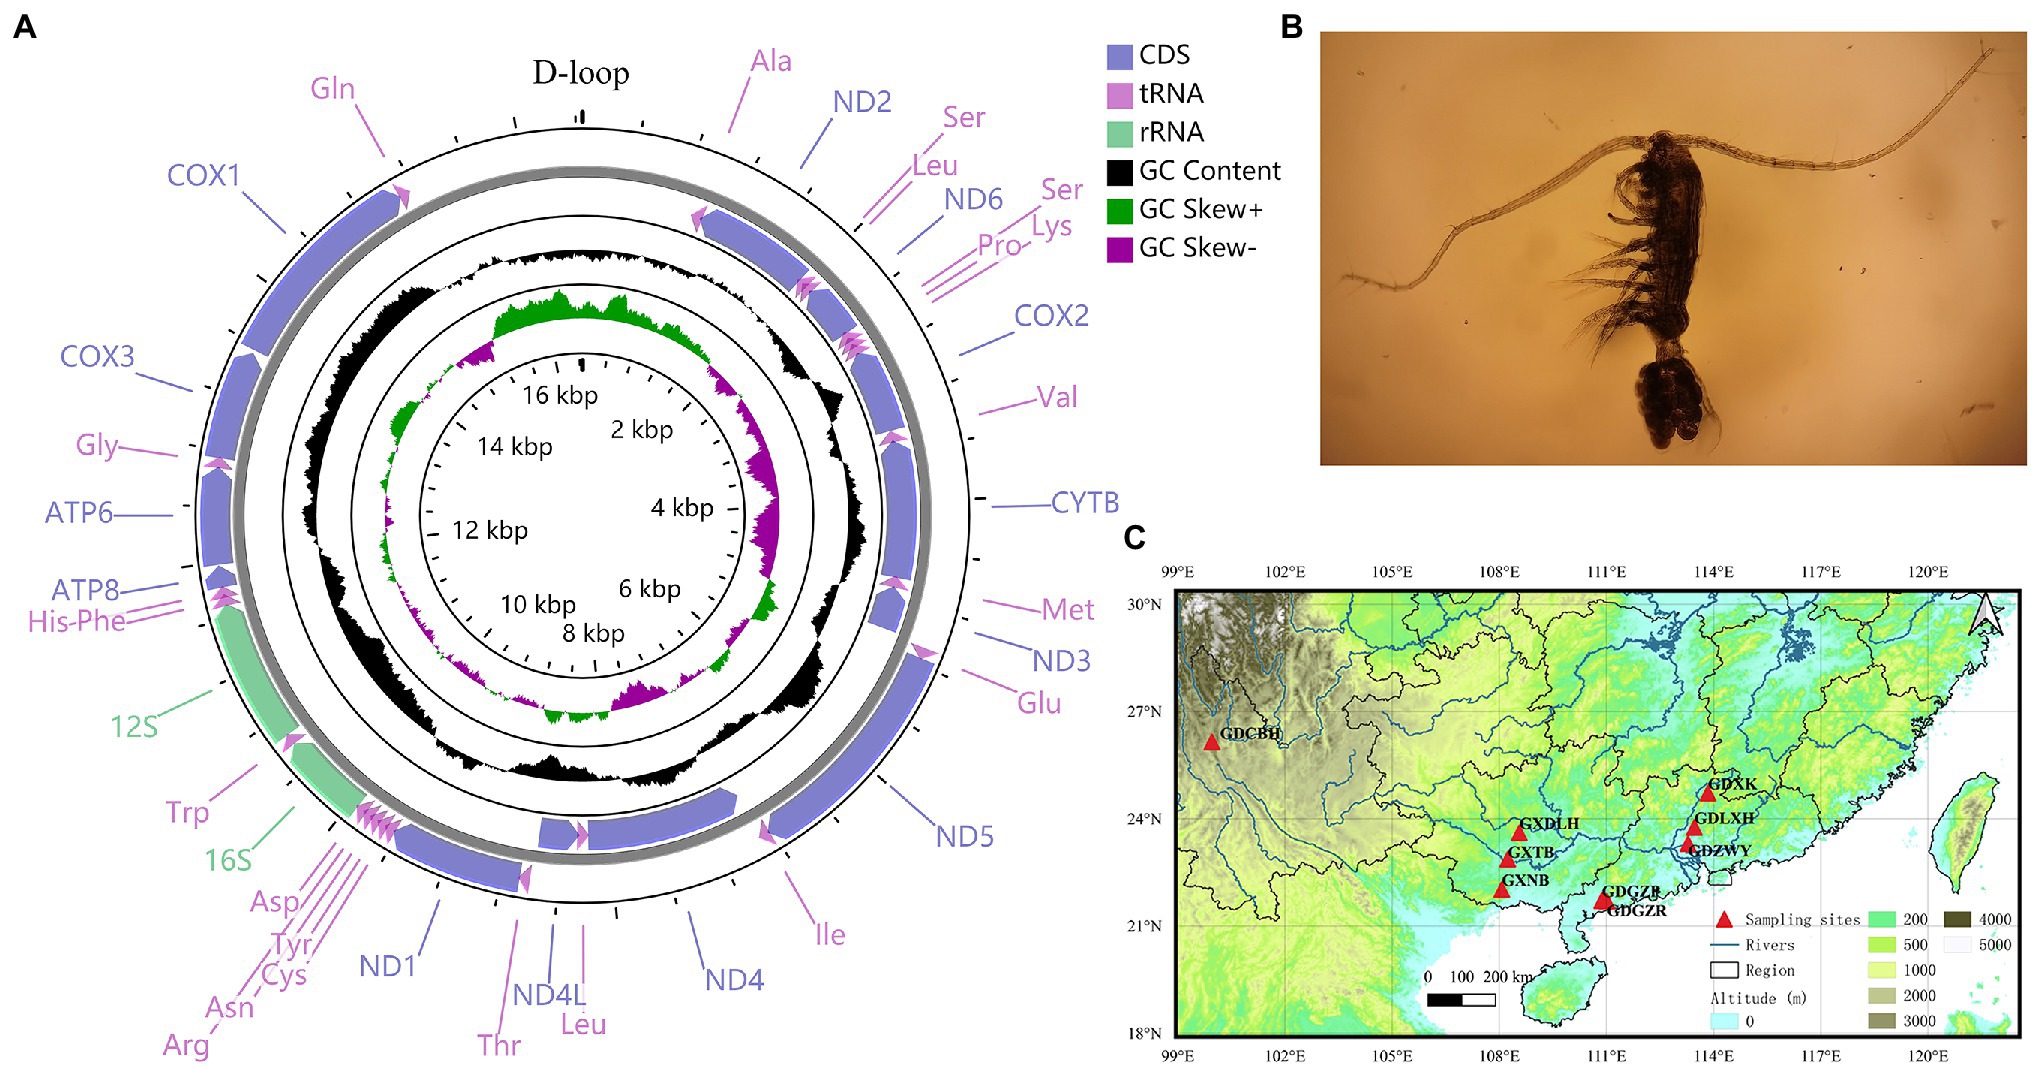
Figure 1. (A) Circular map of the mitochondrial genome of Phyllodiaptomus tunguidus. (B) P. tunguidus female (C) sample localities (N=9) in southern China.
Mitogenome Sequencing, Assembly, and Annotation
We sequenced and assembled the complete mitochondrial genomes of P. tunguidus following the next-generation method. A sequence library was generated from the genomic DNA using an Illumina Hiseq 2,500 platform. COI sequence (GenBank accession: MN12844) was used as reference seed for assembly by MITObim v.1.8 (Hahn et al., 2013; Xu et al., 2017). The contigs were extended using the assembly parameters with minimum overlap of 50bp and minimum overlap similarity of 95%.
The mitochondrial genomes were annotated with MITOS WebServer (Bernt et al., 2013) and verified via BLAST (Altschul et al., 1990). Transfer RNA genes were double-checked with tRNAscan-SE v.2 (Love and Eddy, 1997) and ARWEN v.1.2.3 (Laslett and Canback, 2008). Secondary structures of tRNA were predicted by tRNAscan-SE. PCGs were identified by searching open reading frames using BLAST searches in NCBI1 with invertebrate mitochondrial genetic codes. The ribosomal RNA genes (rRNAs) were identified by the boundary of the tRNA genes and by BLAST searches in NCBI. Non-coding regions were identified based on their sequence homology using Clustal X (Thompson et al., 1997) and MAFFT 7.2 (Katoh and Standley, 2013). The gene map of P. tunguidus was generated using CG View (Stothard and Wishart, 2005). The nine mitogenomes were grouped into four groups according to similarity in gene characteristic: (1) GZR, GZP, and CBH; (2) LXH, ZWY, and XK; (3) NB and TB; and (4) DLH. One representative mitogenome from each group, i.e., four mitogenome were selected for detailed analysis, the information of the other mitogenomes is shown in the supplements. The base composition and the relative synonymous codon usage (RSCU) were obtained using MEGA X (Kumar et al., 2018). The K2P genetic distances between PCGs were also calculated in MEGA X (Kumar et al., 2018). The rate of non-synonymous substitutions (Ka), rate of synonymous substitutions (Ks), and ratio of Ka/Ks were determined by DnaSP 5.1 (Librado and Rozas, 2009). Strand asymmetry was calculated using the formula: AT-skew=(A-T)/(A+T); GC-skew=(G-C)/(G+C; Perna and Kocher, 1995).
Genetic Differentiation and Phylogenetic Analysis
To estimate the pairwise genetic distance in MEGA X (Kumar et al., 2018), all mitogenomes were pooled. A mantel test was applied to two matrixes of pairwise genetic distance and geographical distance to detect possible patterns of isolation by distance (IBD) using the R package ade4 (Dray and Dufour, 2017). A geographic distance matrix was obtained using the function “distm” in R packages “geosphere.” The distance between the sampling sites was calculated with the “Vincenty’s formula (ellipsoid)” method (Vincenty, 2013).
To verify the taxonomic location of P. tunguidus in copepoda, we carried out phylogenetic analysis based on an alignment of the nucleotide sequences of 13 PCGs. We obtained the concatenated nucleotide sequences of 13 PCGs from another 11 Copepoda species downloaded from GenBank for further analysis (Supplementary Table S1). The 11 species included five Calanoida species (one Diaptomidae, one Temoridae, and three Calanidae species), two Cyclopoida (one Lernaeidae and one Cyclopettidae species) and four Harpacticoida species (one Miraciidae and three Harpacticidae). We used Diaphanosoma dubium (Sididae, Ctenopoda, Branchipoda) as outgroup (GeneBank accession numbers: MG428405.1). Sequences of 13 PCGs and two rRNAs were used for phylogenetic analysis. PCGs were aligned based on amino acid sequences and rRNAs were aligned based on nucleotide sequences with MEGA X (Kumar et al., 2018). A Monte Carlo Markov Chain (MCMC) based Bayesian consensus tree was constructed using BEAST 2.4.3 (Bouckaert et al., 2014). Maximum Likelihood (ML) tree and Neighbor (NJ) tree were constructed using MEGA X (Kumar et al., 2018). The best fit model of substitution and best partition schemes for the dataset were identified with the corrected Akaike information criterion (AICc; Akaike, 1974) using PhyloSuite 1.1.15 (Zhang et al., 2020a). GTR+G+I, was chosen as the optimal model of the evolution of 13 PCGs. We performed Bayesian inference analysis using MCMC chains from 100 million generations and sampled one tree at every 1,000 generations using a burn-in of 5,000 generations. ML and NJ analyses were calculated with 1,000 bootstrap replications. The resulting phylogenetic trees were visualized in FigTree v1.4.0.
Results
Sequence Characteristics of Complete Mitogenome of P. tunguidus
We obtained eight mitochondrial genomes of P. tunguidus and submitted them to GenBank (Accession no: MW971441-MW971448). Including the one we published previously (Accession no: MN927223), all nine mitogenomes contained 13 PCGs, 2 rRNA (12S rRNA and 16S rRNA), 22 tRNA, and one control region (Figure 1; Table 1; Supplementary Table S3). The size and genetic sequencing of the nine P. tunguidus were similar, and the 37 genes were uniformly distributed in the H and L strands. Twenty-one genes are on the H-strand (13 tRNAs, seven PCGs, and two rRNAs), while 16 genes are on the L-strand (nine tRNAs and seven PCGs). All PCGs initiate strictly with ATA, ATT and ATG as the start codon. The PCGs end up strictly with TAA and TAG stop codons. The nine mitochondrial control regions were all flanked by tRNA-Gln and tRNA-Ala.
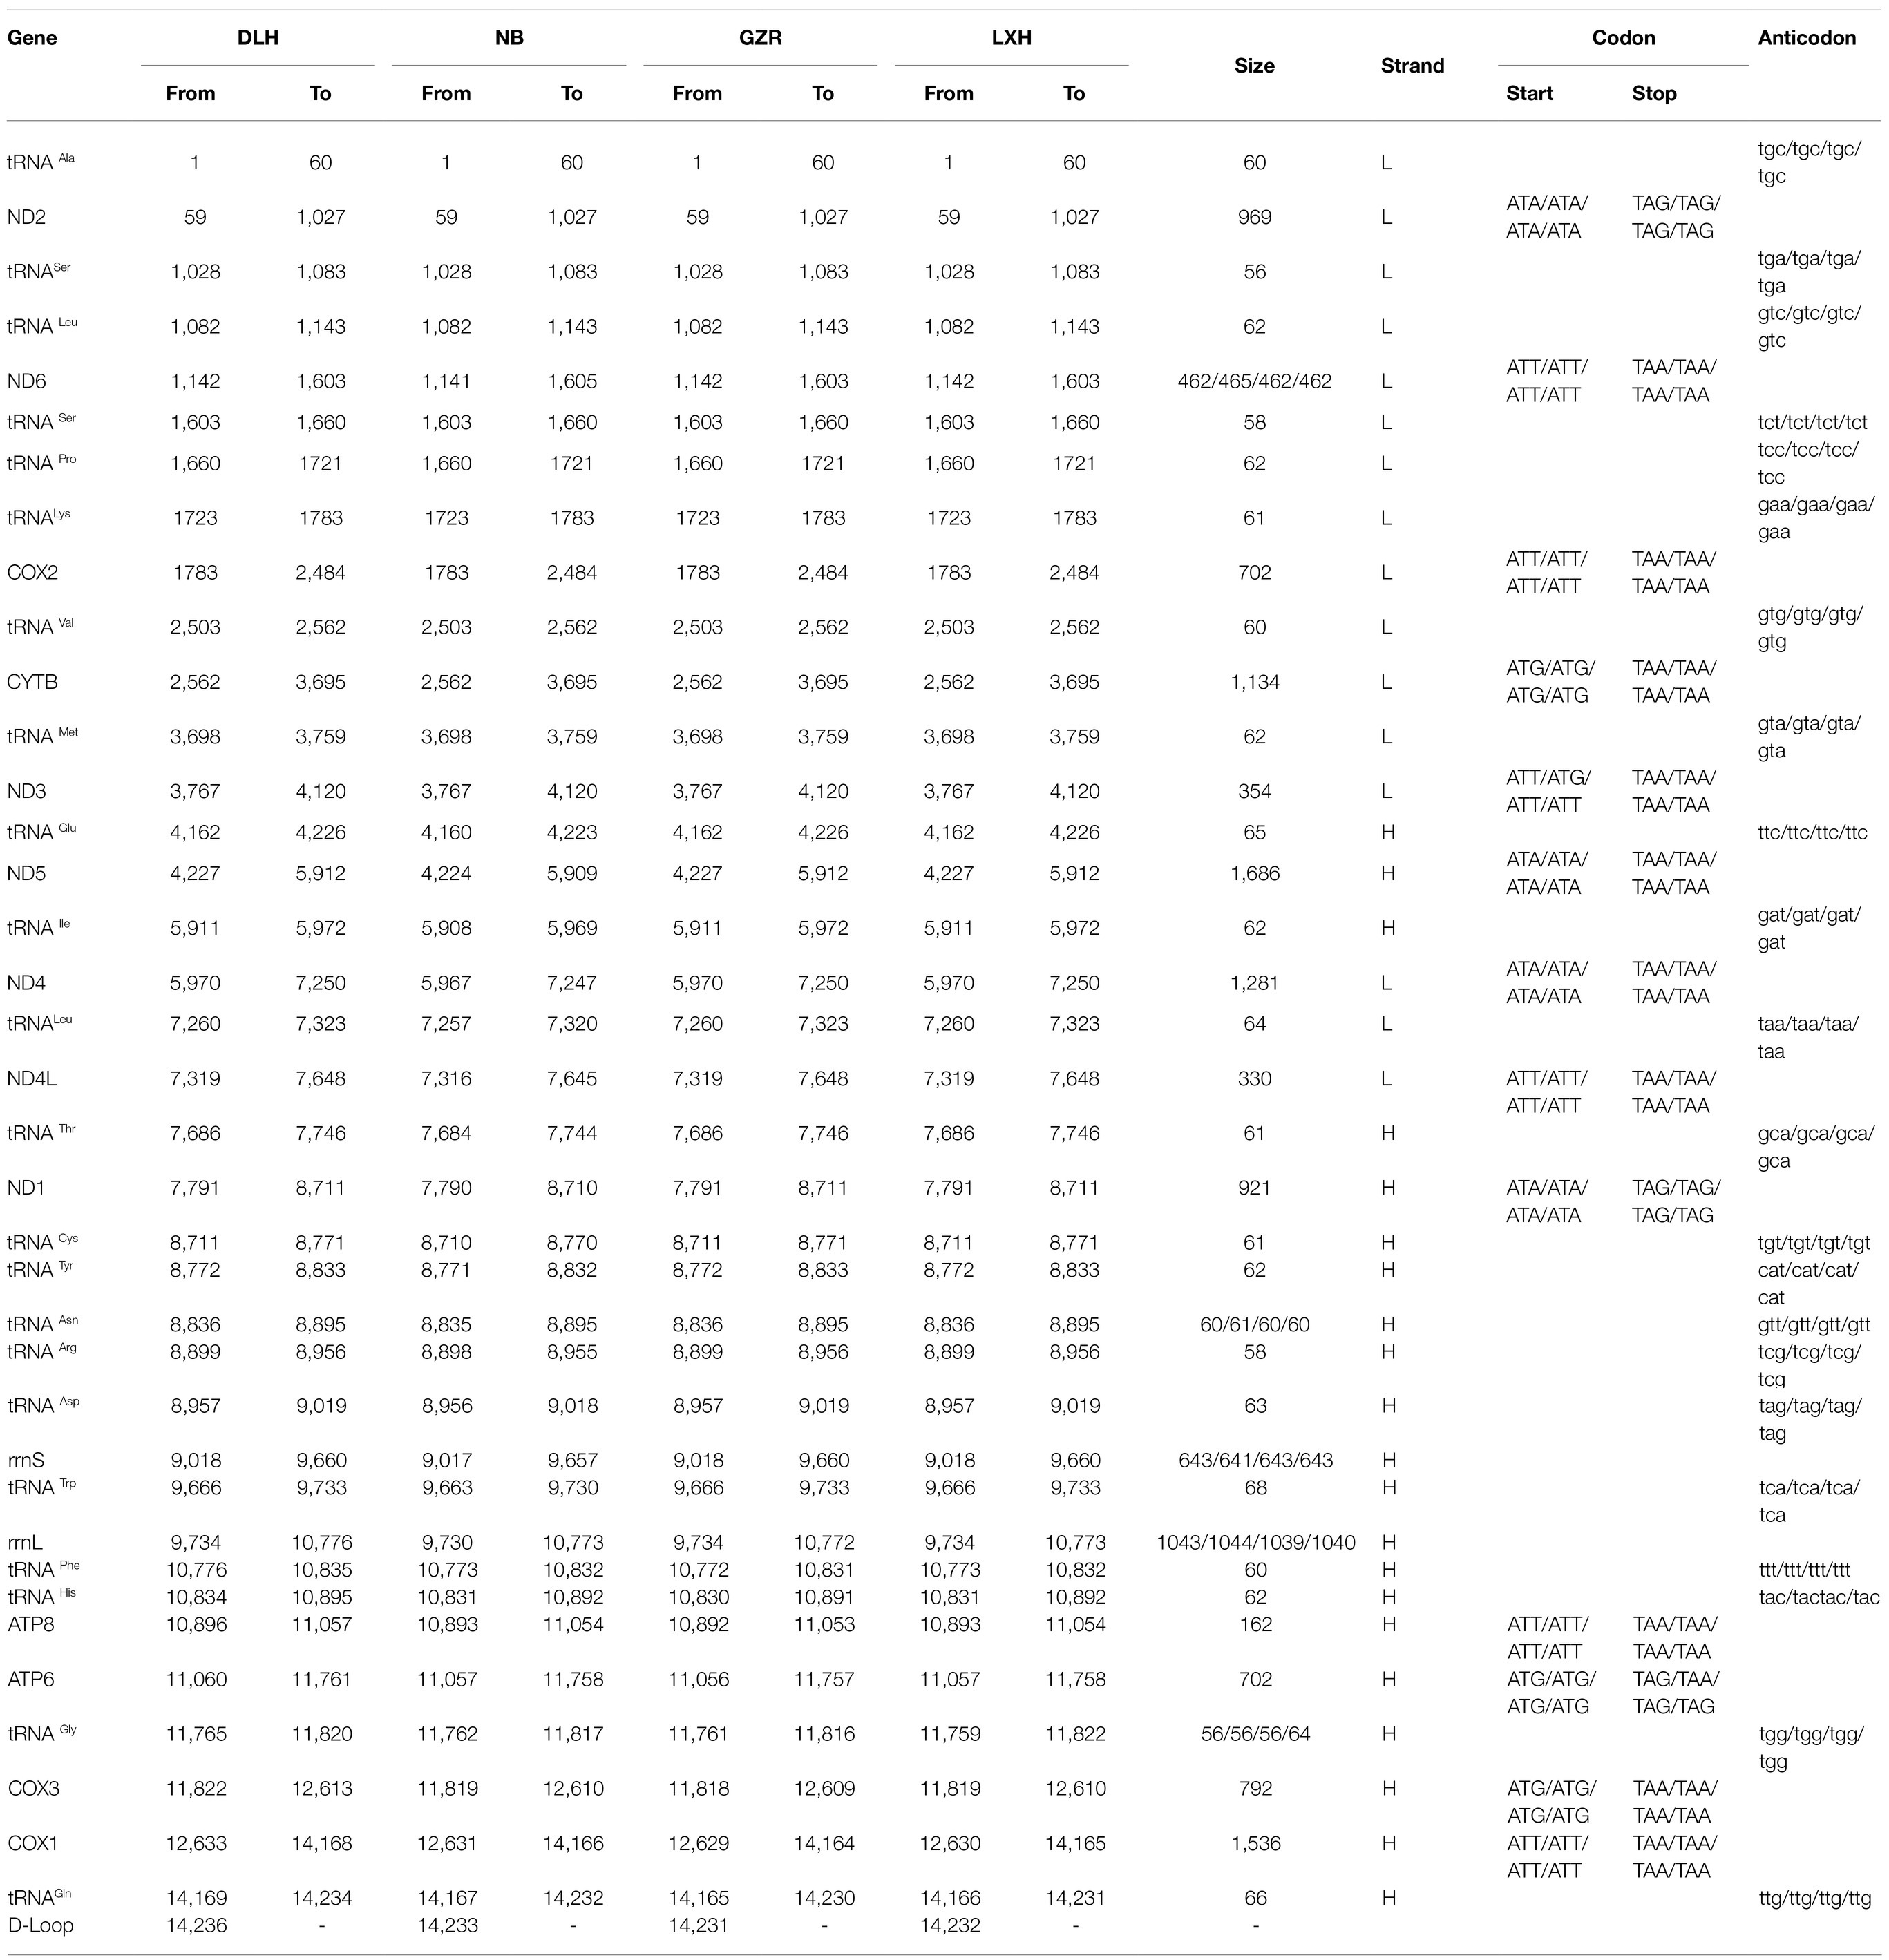
Table 1. Annotation of four representative complete mitochondrial genomes of P. tunguidus.
Comparative Analysis of Nine Mitogenomes of P. tunguidus
Base Composition
The nucleotide composition of the nine mitogenomes showed A+T bias (whole genomes AT contents: 68.83–69.49%; PCGs: 66.43–66.9%; Table 2; Supplementary Table S4). The AT-skew is negative for both whole genomes (−0.002 to −0.013) and 13 PCGs (−0.227 to −0.234), i.e., a higher occurrence of Ts than As. In addition, the first, the second and the third codon of PCGs showed a different base composition (especially A+T content and G content) and bias against T. The A+T content of PCGs at the 3rd codon position is higher than that of 1st and 2nd codon positions, and the G content at the 3rd codon position was lower than that 1st and 2nd codon positions. Bias against T is prominent in the whole genome (34.8–34.9%), all protein-coding genes (PCGs; 41.0–41.2%), the first (35%), the second (47%) and the third (41–42%) codon of PCGs, especially at the second codon.
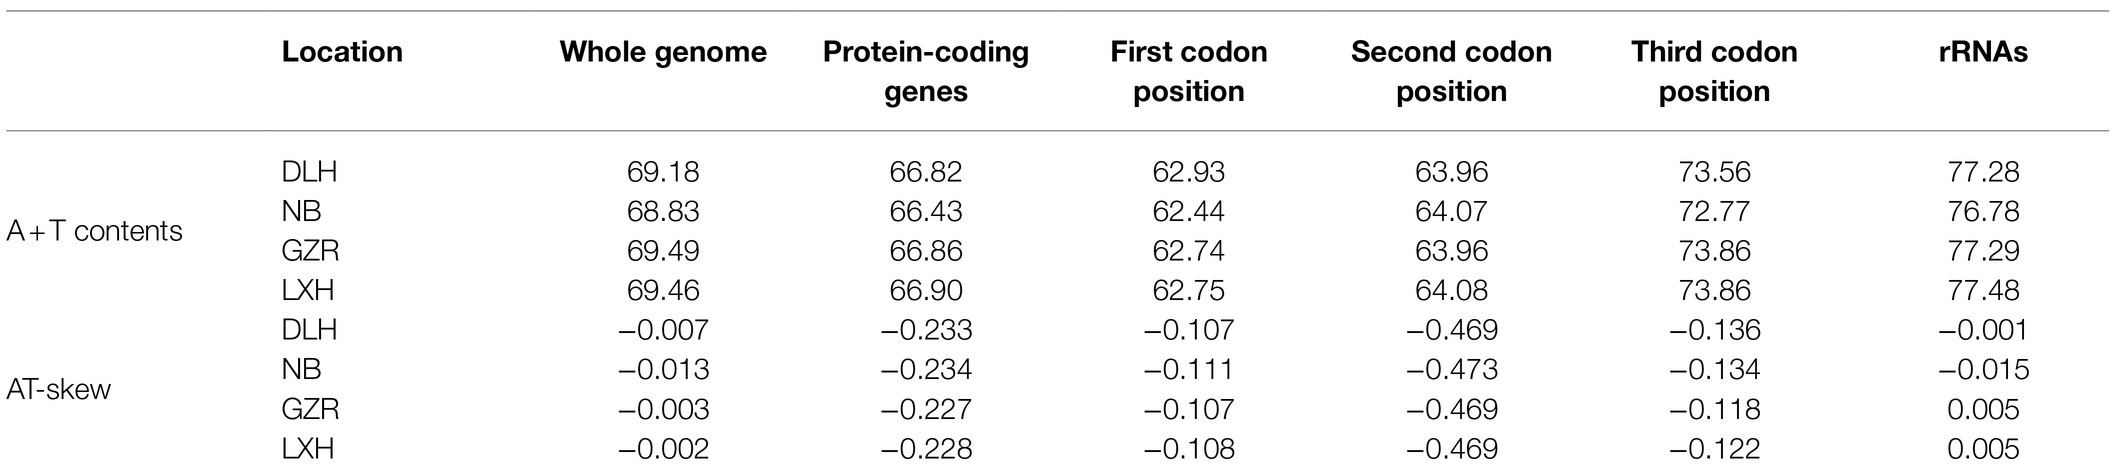
Table 2. A+T contents, AT-skew of the four representative mitogenomes of P. tunguidus.
Protein-Coding Genes and Codon Usage
There were differences in PCGs among nine P. tunguidus. ND3 started with ATG in two mitogenomes collected at NB and TB from Guangxi Province (near Vietnam), but with ATT in the other seven mitogenomes. The ATP6 gene stopped with TAA in the two P. tunguidus at NB and TB but with TAG in the other seven P. tunguidus. This difference indicated that the P. tunguidus from NB and TB in Guangxi Province and those from the other seven sites might have undergone selection for different mechanisms of transcriptional initiation and termination during evolution. Gene-overlap was detected between tRNA and tRNA and between tRNA and PCG, but not between PCG and PCG. tRNA-Ser and tRNA-Leu overlapped by two nucleotides and tRNA-Leu – ND4L shared five nucleotides.
The total length of the PCGs was 11, 034bp for the two P. tunguidus from TB and NB and 11, 031bp for the others. Excluding stop codons, the 13 PCGs in the nine mitogenomes consisted of 3, 664–3, 665 codons (CDs) in total and showed similar properties in terms of codon usage (Figure 2). The two most predominant codon families were phenylalanine (Phe), and leucine (Leu1, UUR), each with more than 100 CDsp T (codons per thousand codons). Among them, Phe exhibited the highest usage bias (118.9–121.5 CDsp T), which might be associated with the coding function of the chondriosome. In contrast, His (11.55–12.40 CDsp T) showed the smallest number of CDsp T.
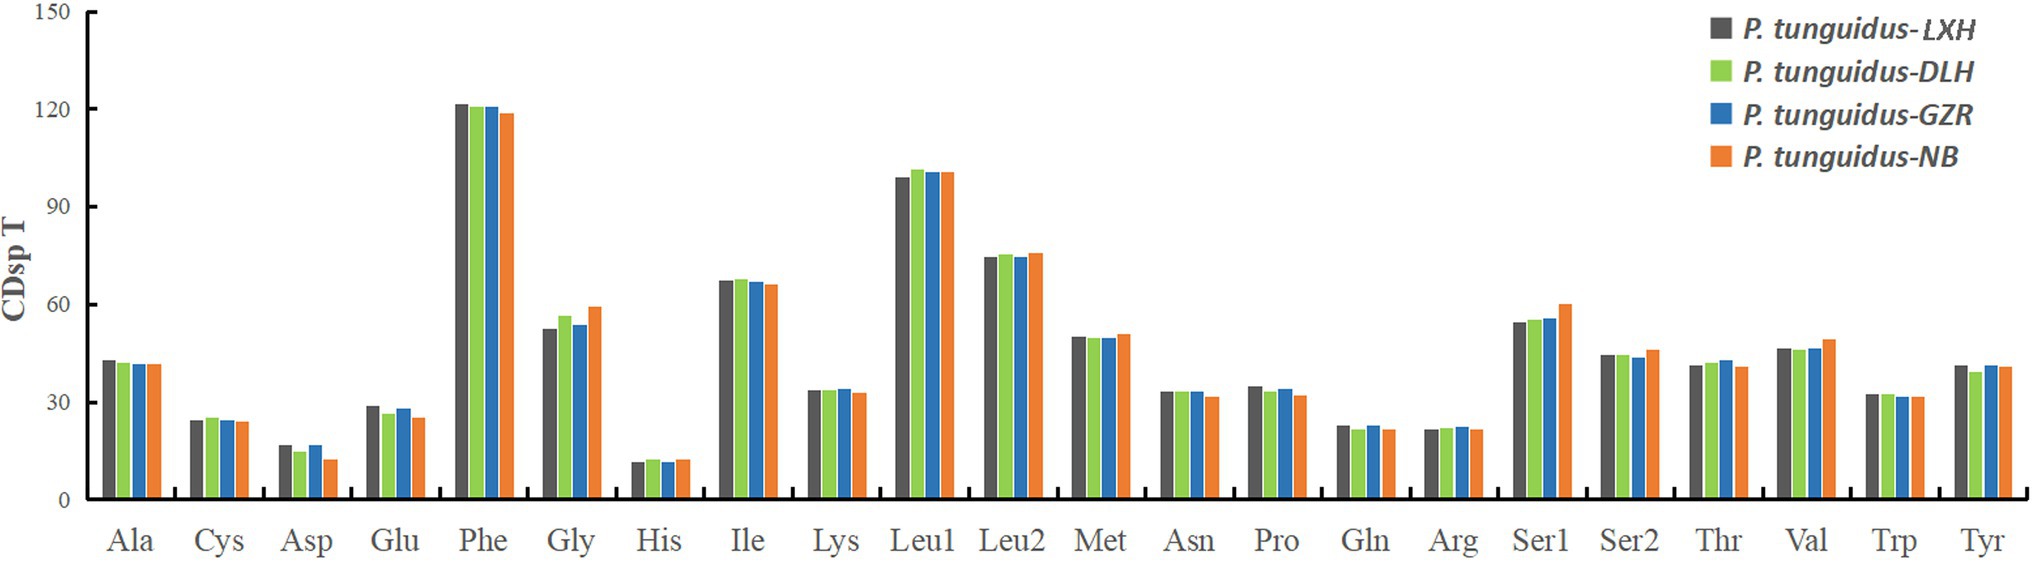
Figure 2. The codon usage pattern for the four representative mitogenomes of P. tunguidus. The codon families are shown on the X-axis and CDsp T on the Y-axis.
Subsequently, we evaluated the relative synonymous codon usage (RSCU) to determine the preference for specific synonymous codons. The codon usage is generally similar among the four representative mitogenomes. The high A+T content in the frequently used codons (i.e., UUA, CCU, UCU; Figure 3) effectively contributes to the high A+T composition in the PCGs and the whole mitogenomes.
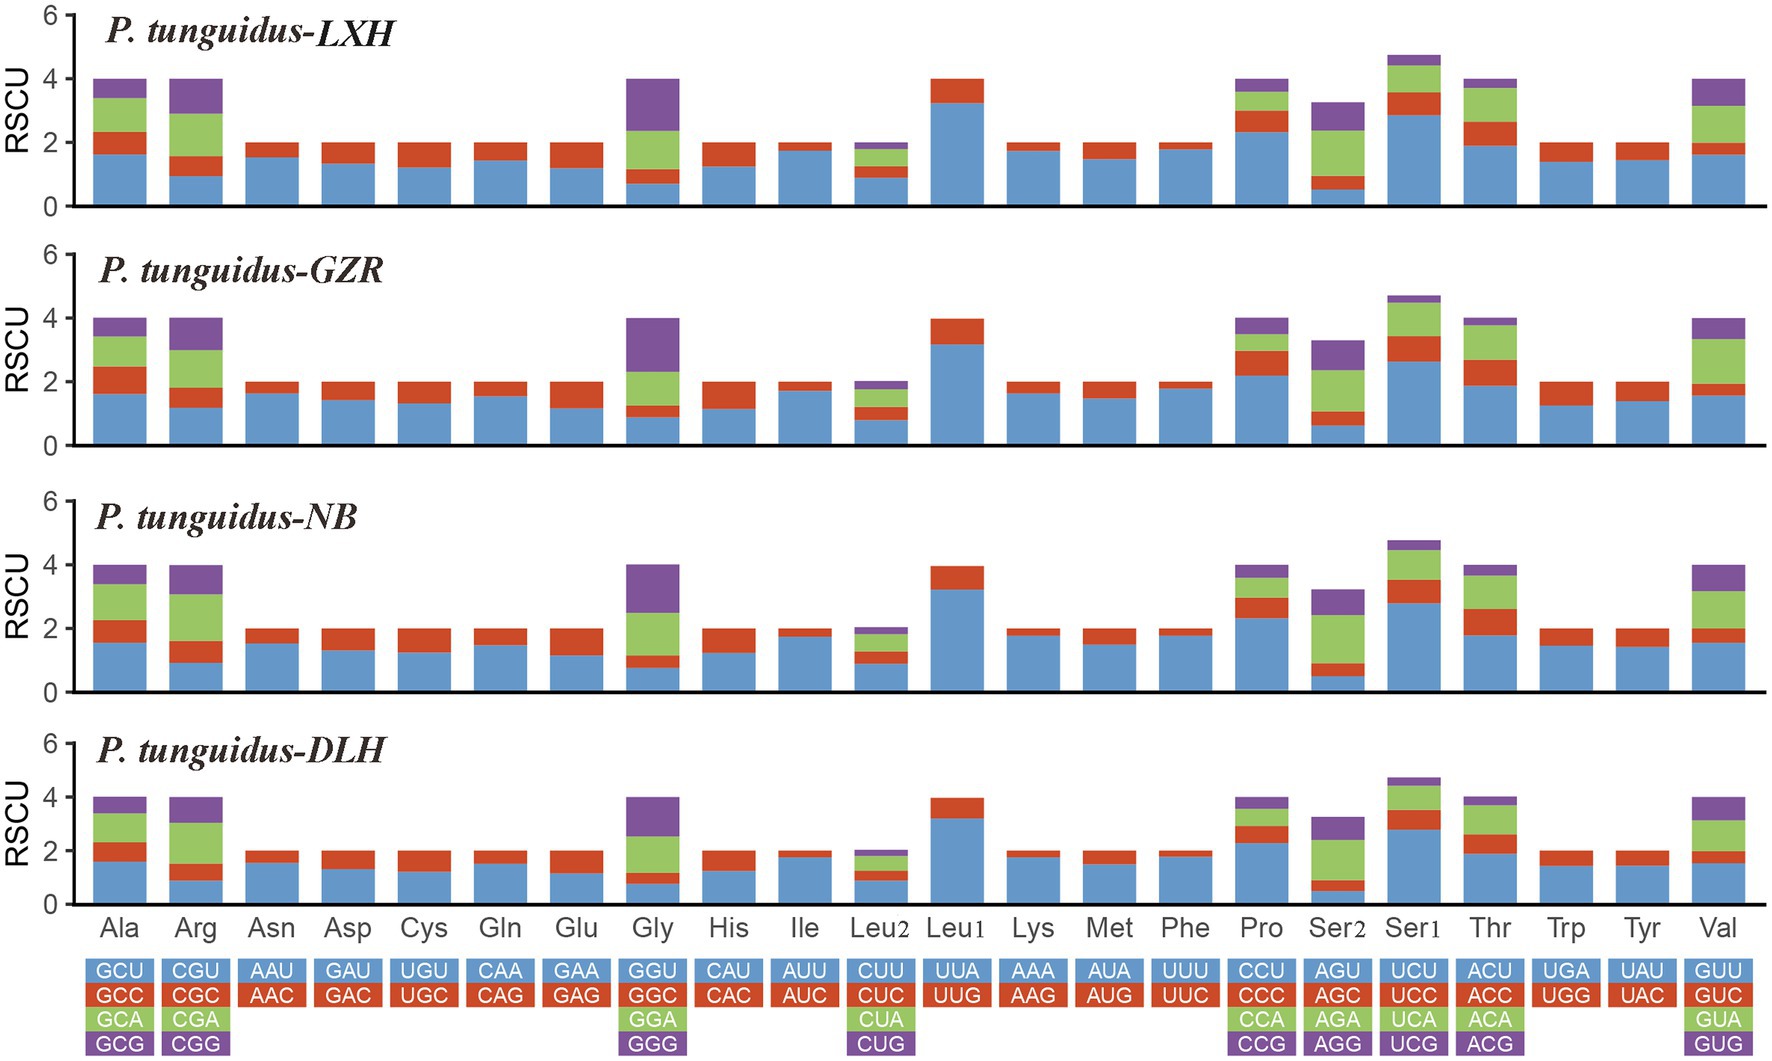
Figure 3. Relative synonymous codon usage in the four representative mitogenomes of P. tunguidus. Codon families are indicated below the X-axis.
To evaluate possible selection of mtDNA protein-coding sequences, Ka/Ks ratio was estimated for the four representative P. tunguidus. Their Ka/Ks ratio was less than 1 for all 13 PCGs (Figure 4), indicating that the PCGs were under purifying selection. COI had the lowest Ka/Ks ratio (0.001–0.03), i.e., this gene was under the strongest selective pressure. The ND3 gene had the highest Ka/Ks ratio (0–0.928).
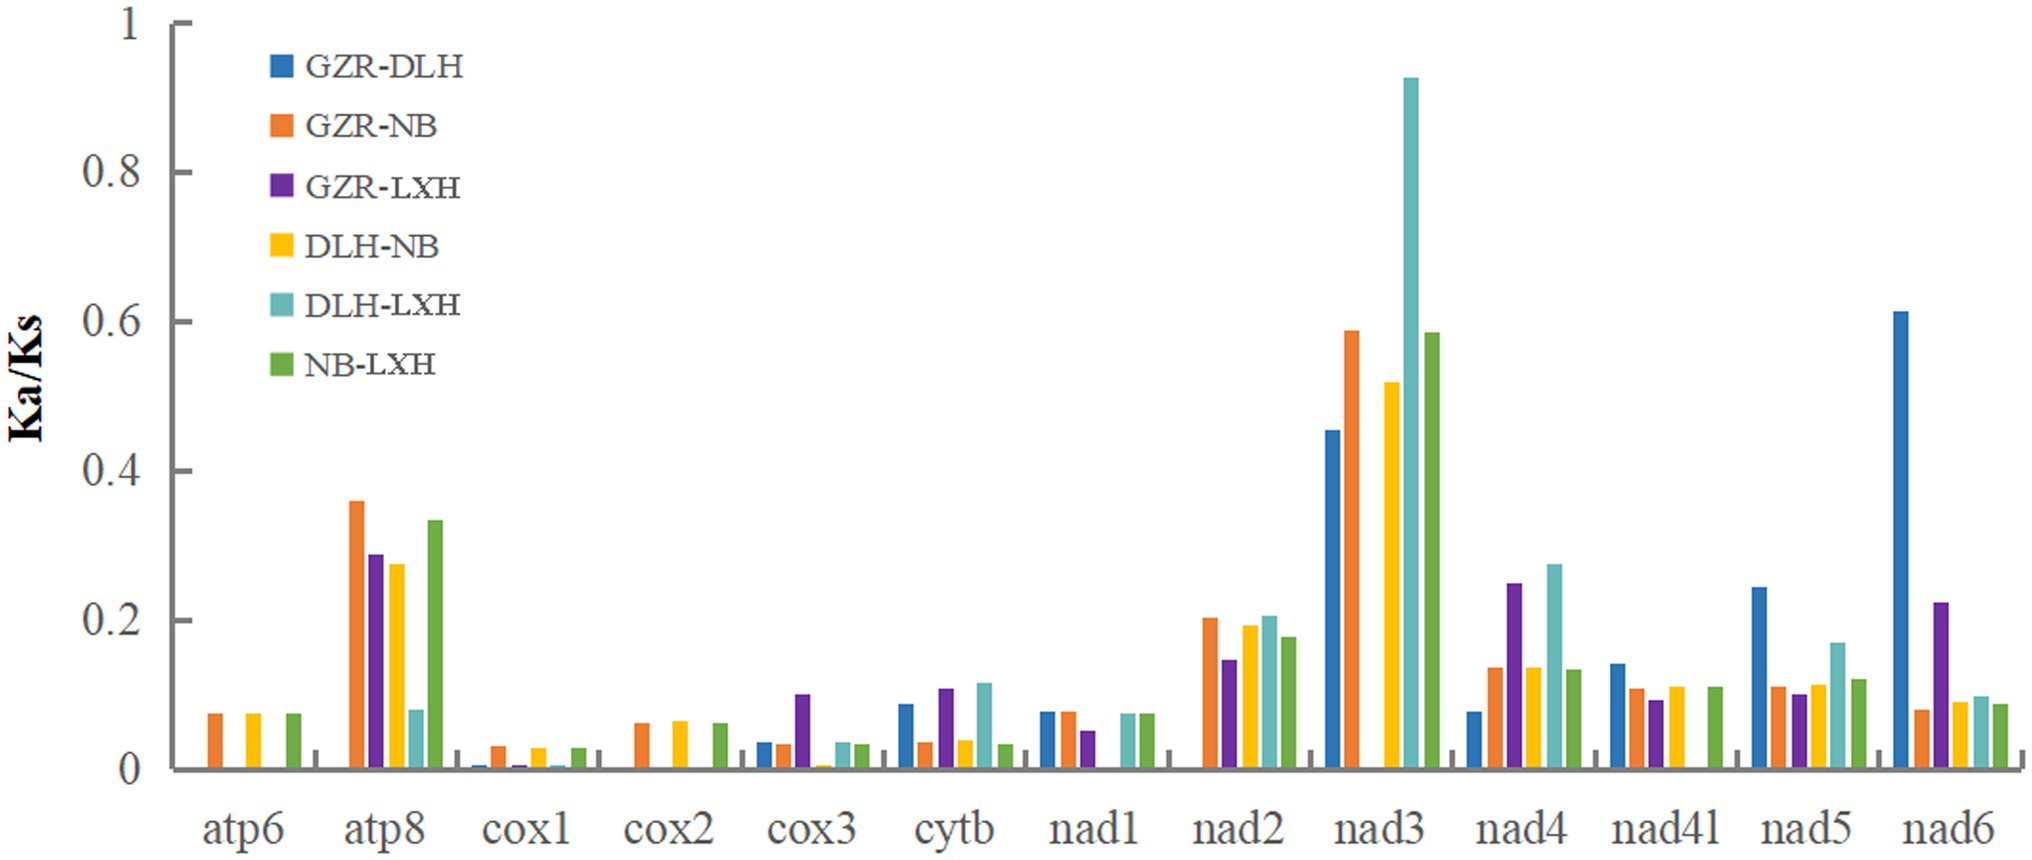
Figure 4. The evolutionary rate indicated by Ka/Ks for each PCG in the four representative mitogenomes of P. tunguidus (see Table 1). The names of 13 PCGs are shown on the X-axis, and the ratio of Ka/Ks is shown on the Y-axis.
To explore sequence divergence among the nine mitogenomes, we analyzed the pairwise genetic distances based on whole mitogenomes and 13 PCGs, respectively (Table 3). The whole mitochondrial genomes and PCGs of nine P. tunguidus showed significant genetic differentiation. For example, the genetic distance between the two P. tunguidus collected at NB and TB and those from the other seven sites is about 10% (mitogenomes K2P: 8.6–10.1%; PCGs K2P: 8.2–9.6%, Figure 3). The ATP8 gene had the smallest genetic distance among the 13 single PCGs (5.2–6.5%, Supplementary Table S5), whereas the ND4 gene had the largest genetic distance (12.8–13.4%, Supplementary Table S5). Additionally, the pair distance based on amino acid sequences (9.2–11.2%, Supplementary Table S6) was found to be higher than those based on nucleotides sequences. Mantel test showed no significant correlation between geographic distance and genetic differentiation (mitogenome, amino acid, PCGs, ribosomal RNA; Supplementary Figure S2).
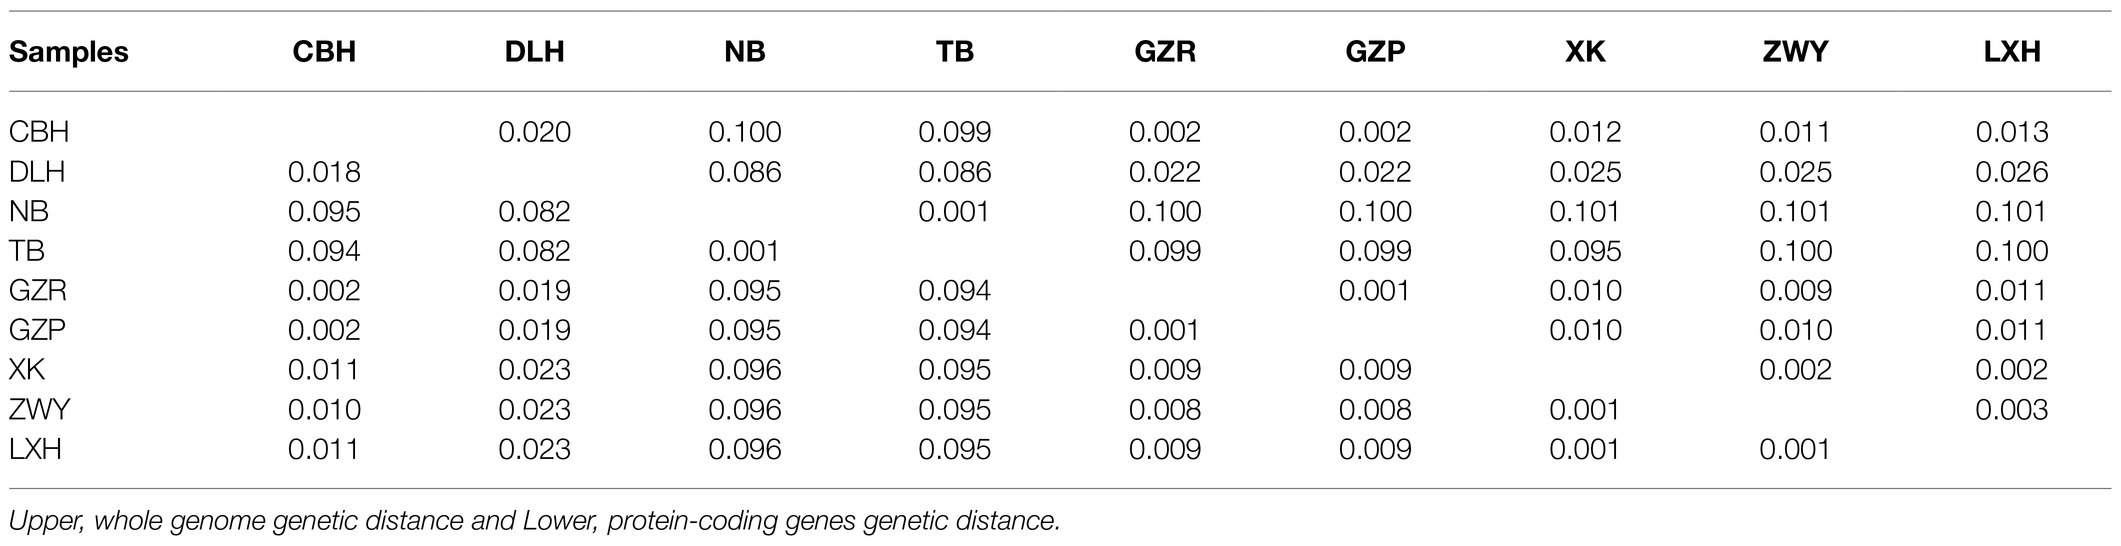
Table 3. Pairwise genetic distance of 13 PCGs and whole genomes.
Transfer and Ribosomal RNA Genes
The length of tRNA genes ranged from 56 (tRNA-Ser and tRNA-Gly) to 68bp (tRNA-Trp). Most of the tRNAs were in a clover-leaf structure, except for tRNA-Arg, tRNA-Ser1 and tRNA-Ser2, which did not contain the entire dihydrouridine arm (Figure 5). However, tRNA-Arg of the two P. tunguidus from NB and TB in Guangxi Province had a complete clover-leaf structure. Mismatched base pairs G-U were found in most tRNAs.
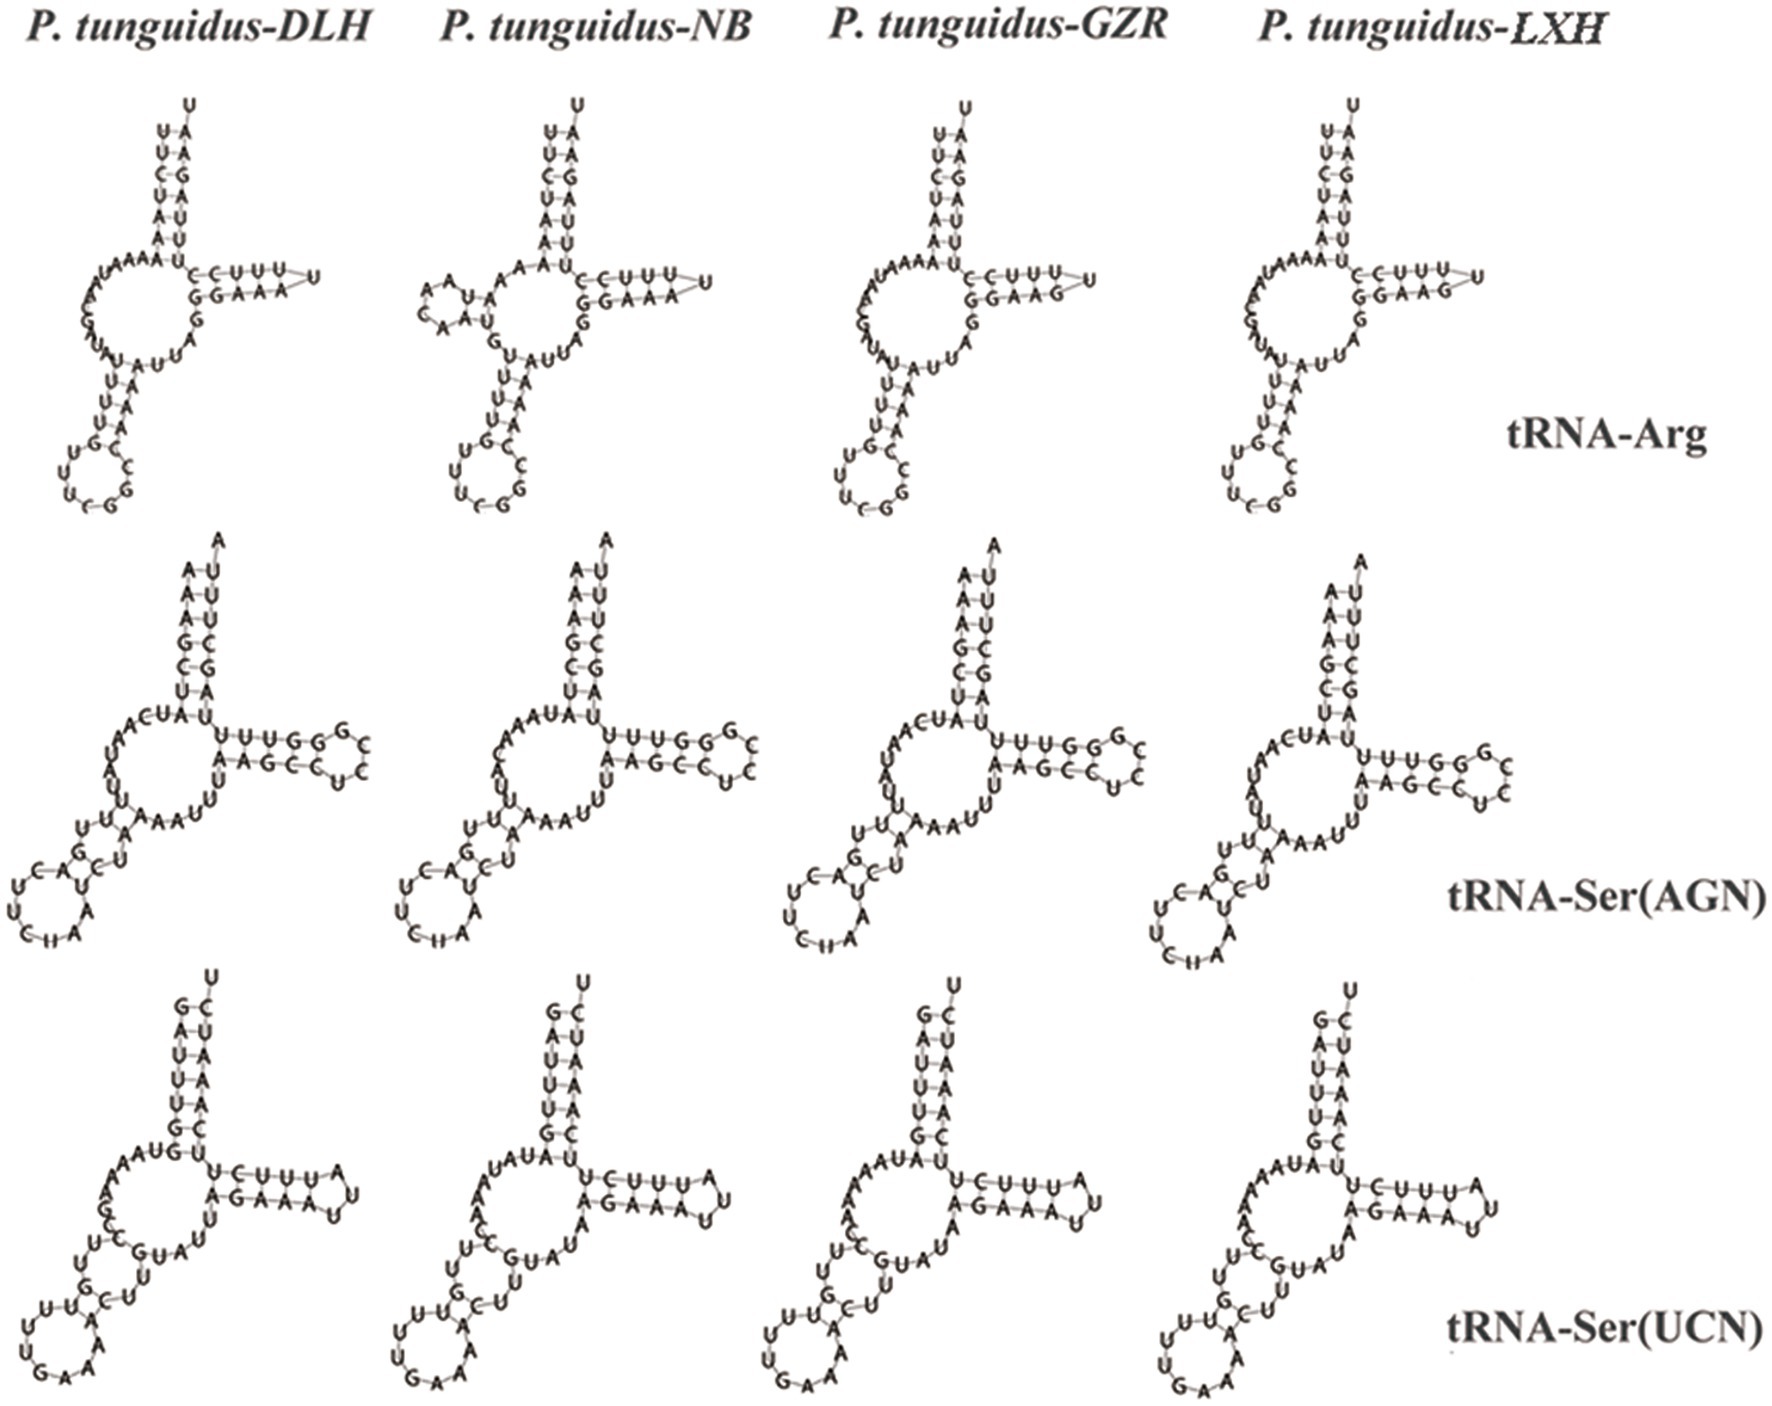
Figure 5. Secondary structures of three transfer tRNA genes from the four representative P. tunguidus mitogenome.
The two rRNA genes were located between tRNA-Asp and tRNA-Phe, and isolated by tRNA-Trp (Table 1). The location and sequence feature of the rRNAs were identical to those observed in other Diaptomid species. However, the lengths of the 12S and 16S genes for the nine P. tunguidus were different from each other. The length of 12S was 641bp for the two P. tunguidus from TB and NB, and 643bp for those from the other seven sites. The length of 16S was 1,044bp for the P. tunguidus from TB and NB, 1043bp for that from DLH, and 1,040bp for those from ZWY, XK, and LXH, 1039bp for those from GZR, GZP, and CBH (Table 1). The rRNA genes in the P. tunguidus mitogenome exhibited a heavy AT nucleotide bias, with an A+T content of 76.78–77.48%. The skewed value of AT in the rRNAs of the nine P. tunguidus mitogenomes was from −0.015 to 0.005.
Comparative Analysis of Our Mitochondrial Genomes With Those of Other Copepods
For comparison, we downloaded all available mitogenomes of Copepoda species in the NCBI database, with only two mitogenome available for Diaptomidae (Figure 6). A total of three orders and 11 species were examined for mitogenome structure, and PCGs and rRNA indicated the direction of the strands. Gene order in Copepoda was not conserved, and not only tRNA but also protein coding genes showed rearrangements. Our nine P. tunguidus had exactly the same gene order. P. tunguidus and Lovenula raynerae, both Diaptomidae, had the same PCGs gene order. The order of their six tRNAs between ND4 and ND1 was slightly different, but the order of the other tRNAs was consistent. There was a difference in PCGs and tRNA genes order between Diaptomidae (P. tunguidus) and Temoridae (Eurytemora affinis), Calanoidae (Undinula vulgaris, Calanus hyperboreus, and Calanus sinicus). Nevertheless, Diaptomidae genes were arranged in a relatively conservative order.
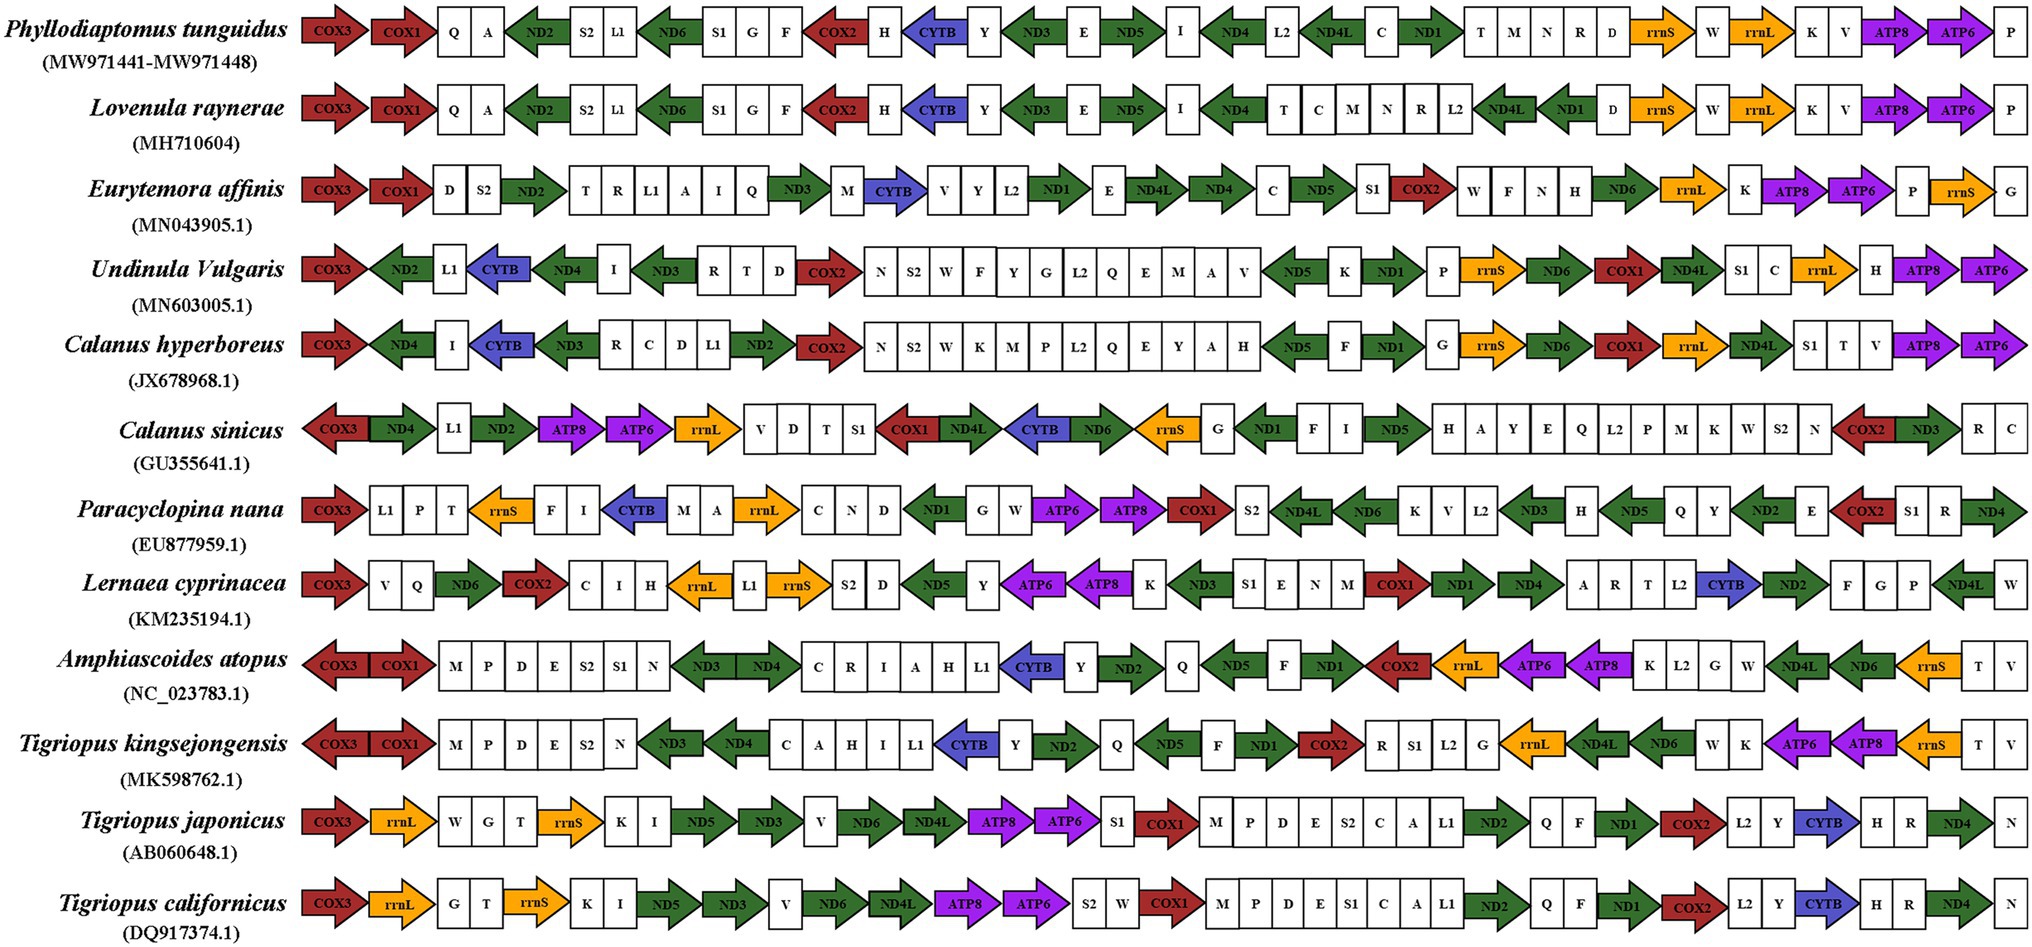
Figure 6. The mitochondrial genome composition and arrangement of Copepoda. The protein-coding genes (PCGs) are colored according to functional group and tRNA genes are portrayed using their single-letter amino acid code.
Mitochondrial Phylogeny of P. tunguidus
Although under the GTR+G+I substitution model, the Bayesian, NJ, and ML tree split all Copepoda into three orders (Calanoida, Cyclpoida, and Harpacticoida) with strong support (Figure 7). NJ, ML, and Bayesian analyses revealed a slightly different topology (Figure 7; Supplementary Figure S3). NJ and ML analyses showed that three orders, Calanoida, Cyclopoida, and Harpacticoida, form a monophyletic clade (Supplementary Figure S3). Harpacticoida is sister to Cyclopoida and Calanoida, Cyclopoida is recovered as sister group to Calanoida. Bayesian analyses showed that Calanoida and Cyclpoida form a monophyletic clade, but Harpacticoida not. Amphiascoides atopus of Harpacticoida is sister to Calanoida; Harpacticoida and Cyclpoida is the sister group of A. atopus. In addition, Bayesian analysis supported a sister relationship between Harpacticoida and Cyclopoida.
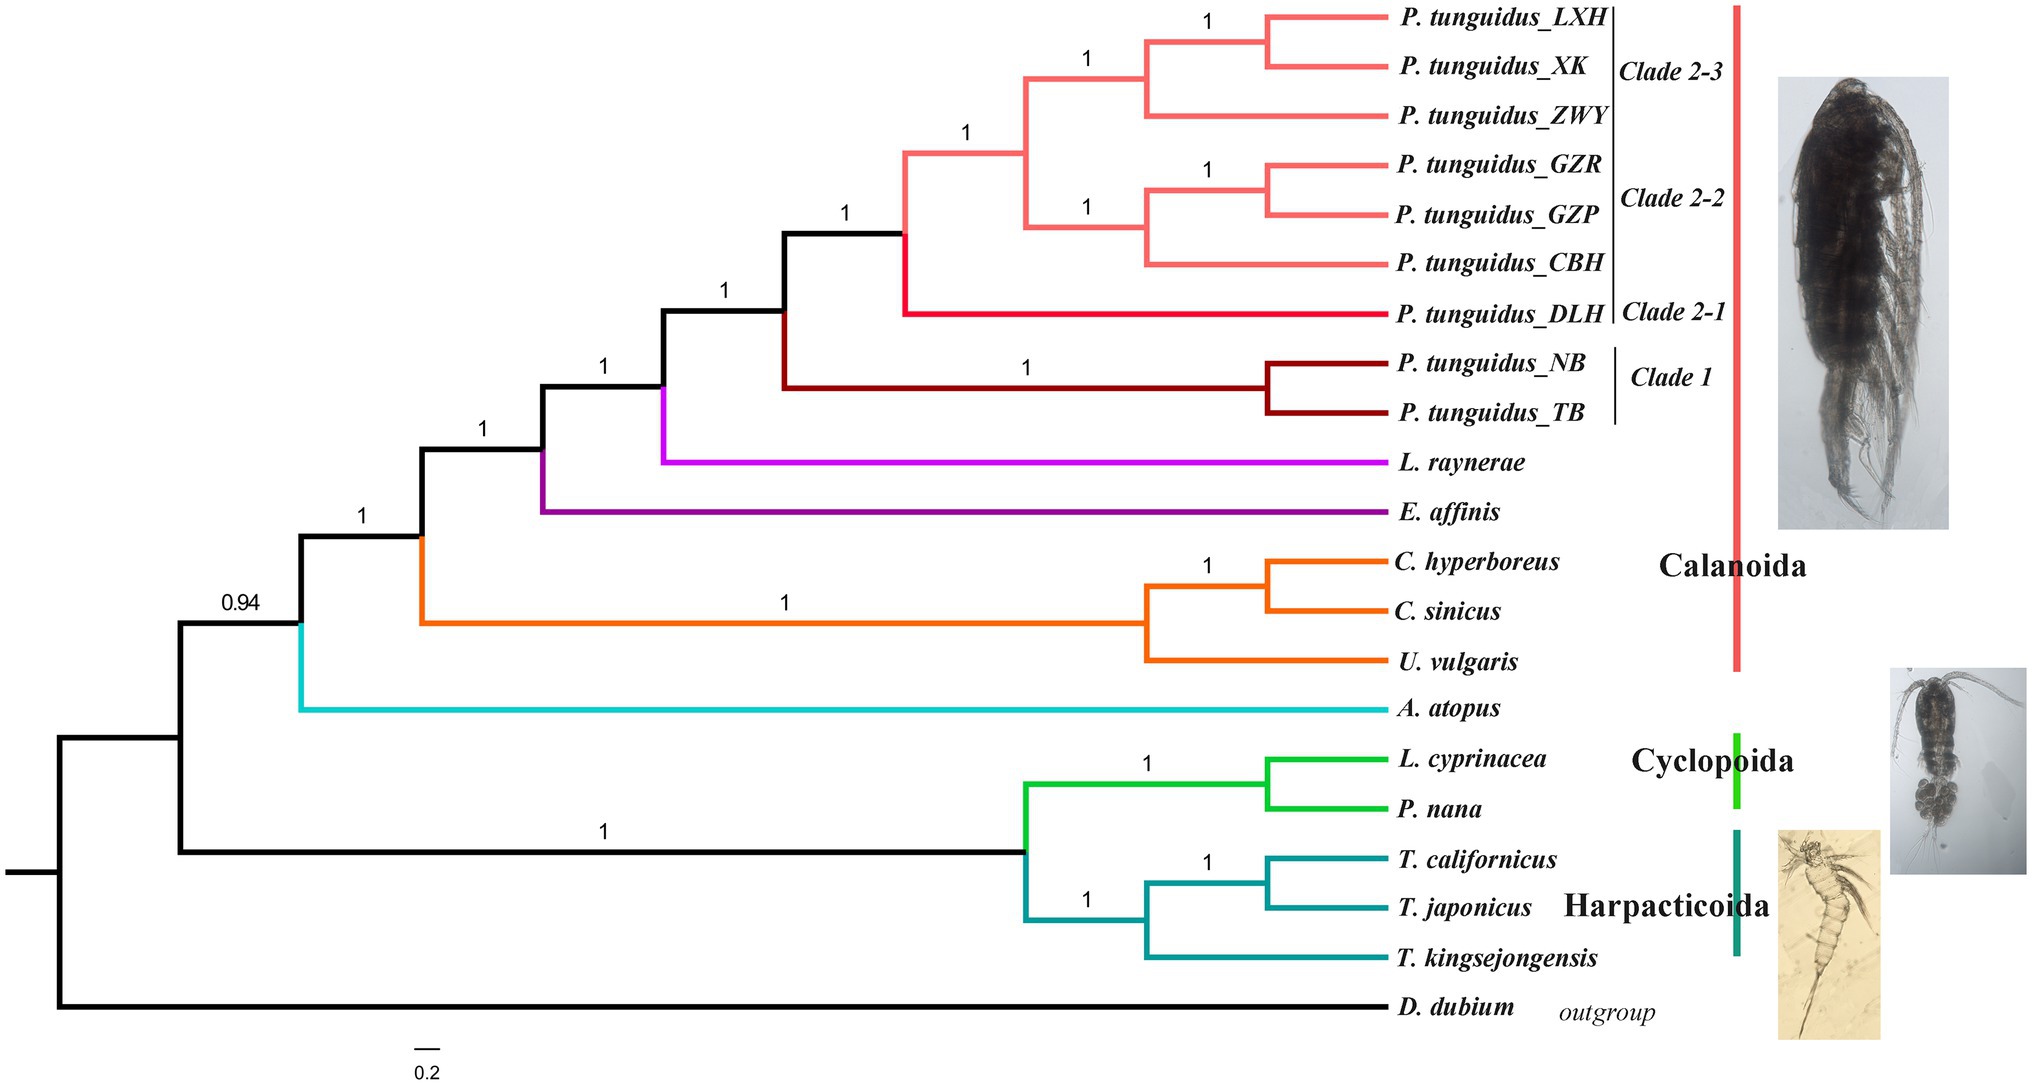
Figure 7. Phylogenetic relationship among Copepods reconstructed with 13 mitochondrial PCGs. Numbers at nodes represent the posterior probability in the BEAST analysis.
Phylogenetic analysis of the Calanoida showed that species of the Calanoidae occupy a basal position and species of Diaptomidae are at the apex of the evolutionary tree. Temoridae (E. affinis) was split from Calanoidae, whereas Diaptomidae (L. laynerae and P. tunguidus were clustered in one branch with high support, placing P. tunguidus in Diaptomidae) separated from Temoridae. NJ, ML, and Bayesian analyses based on mitochondrial genomes all split the nine P. tunguidus into two clades with high support (Clade 1 and 2, K2P=10%). The two P. tunguidus from TB and NB in Guangxi Province (near Vietnam) grouped in Clade 1, and the other seven P. tunguidus in Clade 2. Clade 1, the sister group of Clade 2 that contained Clade 2–1, Clade 2–2 and Clade 2–3, consisted of specimens from southern Guangxi Province. Clade 2–1, the sister of Clade 2–2 and Clade 2–3, occurred mainly in the center of Guangxi Province. Clade 2–2 and Clade 2–3 are in a sister group relationship, and they included the specimens from the upper and lower basins of Pearl River (Figure 1). Phylogeny of P. tunguidus in copepods using rrnL and rrnS was consistent with that based on PCGs (Supplementary Figure S4).
Discussion
The mitogenomes of P. tunguidus were found to be similar to those of other copepods in terms of gene quantity and organizational structure (Ki et al., 2009; Jooste et al., 2019). Their characteristics conformed to the typical invertebrate mitogenome without gene insertion and deletion but with rearrangements. A common feature in metazoan mitochondrial genomes is bias toward a higher representation of nucleotides As and Ts leading to a subsequent bias in corresponding encoded amino acids (Wang et al., 2018; Ding et al., 2020; Liu et al., 2020; Sun et al., 2020). At this point, DNA with a high AT-content makes the double helix less stable because the AT pair is bound by two hydrogen bonds while GC pairs are bound by three such bonds (Yakovchuk et al., 2006); therefore, the high AT-content of mitogenome could have a higher mutation rate such that may accelerate the evolutionary process for Diaptomidae (Triant and DeWoody, 2006; Ding et al., 2020). Interestingly, the A+T content of PCGs at the 3rd codon position is higher than that of 1st and 2nd codon positions, and the G content at the 3rd codon position was lower than that 1st and 2nd codon positions. In addition, bias against T is prominent in the whole genome, all PCGs, the first, the second and the third codon of PCGs, especially at the second codon. A possible explanation is that the AT bias can selectively avoid the formation of stop codons and the loss of amino acids, and results in T-rich codons (Charneski et al., 2011; Ding et al., 2020). We determine preference for specific synonymous codons by evaluating the relative synonymous codon usage (RSCU; Granthan et al., 1980; Meganathan et al., 2012). The codon usage patterns were similar among the four P. tunguidus, with both 2- and 4-fold degenerate codons exhibiting over-usage of A and T at the third codon positions. The over-usage of A and T at the third codon is consistent with the observation in other animal species (Mindell et al., 1998; Ding et al., 2020; Sun et al., 2020). This might be related to genome bias, optimal selection of tRNA usage, or DNA repair efficiency (Crozier and Crozier, 1993).
The Ka/Ks ratio is an indicator of selective pressure acting on PCG (Yang and Bielawski, 2000; Hurst, 2002). It changed in the 13 PCGs, reflecting different functional constraints between genes (Muse, 2000). Specifically, COI had the lowest Ka/Ks ratio, indicating that this gene was under the strongest selective pressure. The ND3 gene had the highest Ka/Ks ratio, i.e., it was under the least selective pressure (Yang and Nielsen, 2000; Sun et al., 2011). Molecular evolution (Ka/Ks ratio) of single PCGs seems to be different in all nine P. tunguidus. However, it was consistent for the two P. tunguidus from NB and TB in Guangxi Province (near Vietnam). We failed to detect significant adaptive mutations in the nine mitogenomes. Therefore, purifying selection may be the predominant force governing mitogenome evolution in the species. Previous studies showed that energetic constraints are the main factors contributing to the evolution of mitochondrial-encoded proteins (Sun et al., 2011; Wagner et al., 2018). Combining the ratio of Ka/Ks and the genetic distance, we considered the P. tunguidus from NB and TB a unique lineage compared to the seven from the other sites, and the PCGs gene plays a crucial role in the evolutionary adaption under selection.
The ATP8 gene had the smallest genetic distance among the 13 single PCGs, whereas the ND4 gene had the largest distance, revealing different mutation pressures among genes (Sun et al., 2011). Additionally, the pair distance based on amino acid sequences was found to be higher than those based on nucleotides sequences. In other words, there are fewer synonymous substitutions than non-synonymous substitution in PCGs of the P. tunguidus mitogenomes, suggesting that some PCGs have undergone positive selection.
There is no evidence of resting eggs from P. tunguidus until now, thus it may be passively dispersed mainly following water flow. Isolation by distance (IBD) is expected in the dispersal limitation. However, the result showed no significantly correlation between the geographical distance and genetic differentiation (mitogenome, amino acid, PCGs, ribosomal RNA). This spatial pattern without IBD indicated that the current geographic distribution of P. tunguidus could have a complex historical origin. The geographical topography is indeed extremely complex in southern China (Clark et al., 2004; Xiang et al., 2007; Zheng, 2015), where Yunnan-Guizhou Plateau, Yunkai mountain and Shiwan mountain structure the landscape for P. tunguidus. Genetic differentiation between adjacent populations such as GZR and GZP, LXH and ZWY indicated that there are strong environmental filters or selections.
The exact position of 22 tRNA genes of the eight P. tunguidus was identified as being the same genomic position observed for our published P. tunguidus mitogenome (Zhang et al., 2020b). The tRNA gene in all the nine P. tunguidus had anti-codons that match the invertebrate mitochondrial code (Weydmann et al., 2017). However, tRNA-Arg of the two P. tunguidus from NB and TB in Guangxi Province had the complete clover-leaf structure. The structure of tRNA-Ser1 was not the typical clover-leaf structure that occurs in other invertebrates and vertebrates (Wolstenholme, 1992; Hong et al., 2008; Yang et al., 2019). The secondary structure of lacking a dihydrouridine arm is likely related its structural compensation mechanism among tRNA arms (Steinberg and Cedergren, 1994). Mismatched and wobble pairs are commonly found in invertebrate tRNAs and can be corrected by post-transcriptional RNA editing processes (Lavrov et al., 2000). Two rRNA genes were identified for P. tunguidus through alignment with other Diaptomidae mitogenomes (Jooste et al., 2019; Zhang et al., 2020b). The rRNA genes exhibited a heavy AT nucleotide bias in the P. tunguidus mitogenomes. The RNA-Seq analysis in many species demonstrates that a TAA stop codon is created by post-transcriptional polyadenylation that changes T or TA residues to a complete TAA stop codon. Therefore, the rRNA with a high AT-content species has a less stable double helix, which helps to implement the above mechanisms (Yakovchuk et al., 2006).
Phylogenetic analysis indicates that Copepoda species fall into three orders. Calanoida and Cyclpoida for a monophyletic clade, but Harpacticoida do not. Calanoida is identified as the most recently diverging order of the three, and Diaptomidae is the most recently diverging family of the Calanoida. Morphological taxonomic studies are generally consistent the current molecular phylogenies except for the A. atopus in Harpacticoida.
In this study, we clarified the phylogeny and hidden diversity of P. tunguidus in southern China. Focusing on the mitochondrial genomes of nine P. tunguidus, the phylogeny showed that the two P. tunguidus from NB and TB (Clade 1) are separated from the other seven. A phylogenetic tree based on mitogenomes and Cytb showed that Clade 1 is restricted to the southern Guangxi Province. In addition, two P. tunguidus populations (TB and NB) near Vietnam can be considered older, if we look at the fact that most species in Phyllodiaptomus are limited to Southeast Asia (Dumont and Reddy, 1993, 1994; Dumont et al., 1996; Sanoamuang and Yindee, 2001; Sanoamuang and Teeramaethee, 2006; Sanoamuang and Watiroyram, 2020). In contrast, Clade 2 is widely distributed in many relatively isolated basins, including the Lancnagjiang River (Yunnan Dali), Upper Pearl River (Yunnan, Kunming), Lower Pearl River (Gaozhou, Guangzhou and Shaoguan), the Minjiang River (Fujian, Fuzhou) and the Yangtze River (Hunan, Changsha; Supplementary Table S2 and Supplementary Figure S1). The spatial proximity among these basins allows P. tunguidus populations in the Pearl River basin to expand into nearby basins easily, especially in flooding seasons. At the same time, the hypothesis of active river capture in southwestern China may explain the close relationship of populations between the Yangtze and Upper Pearl River (Clark et al., 2004; Zheng, 2015). In addition to the two strongly supported mitogenome Clades, a high level of mtDNA genetic differentiation, observed between the two Clades (5.2–13.4%) supports a deep divergence among P. tunguidus populations. This finding is shared with several small-sized freshwater fish species in China, e.g., Hemiculter leucisculus (Chen et al., 2017), Opsariichthys bidens (Perdices et al., 2005), Rhynchocypris oxycephalus (Yu et al., 2014).
Similar to the phylogenetic relationship, the gene arrangement of mitochondrial genomes demonstrates that Calanoida have a more complete classification system, while the classification of Harpacticoida is currently unresolved.
Conclusion
The nine mitogenomes of P. tunguidus have similar size and gene arrangement, but their base composition, genetic distance and tRNA structure indicate a large genetic differentiation between mitogenomes. Deep genetic differentiation occurs between two clades of widely different geographic origins. This differentiation is also shown in the difference in the structures of tRNA and rRNA. Two clades have reached the level of subspecies or cryptic species. The mitogenome-based phylogeny of Copepoda further shows that Diaptomidae is the most recently diverging family of Calanoida and that P. tunguidus is at the evolutionary apex of the family.
Data Availability Statement
The original contributions presented in the study are included in the article/Supplementary Material; further inquiries can be directed to the corresponding author.
Author Contributions
B-PH: conceptualization. X-LZ, PL, and S-LX: methodology and software. X-LZ: formal analysis and writing – original draft preparation. X-LZ, QZ, and PL: data curation. X-LZ, B-PH, ER, and HD: writing – review and editing. All authors have read and agreed to the published version of the manuscript.
Funding
This study was supported by the grant for NSF of China (no. 31670460).
Conflict of Interest
The authors declare that the research was conducted in the absence of any commercial or financial relationships that could be construed as a potential conflict of interest.
Publisher’s Note
All claims expressed in this article are solely those of the authors and do not necessarily represent those of their affiliated organizations, or those of the publisher, the editors and the reviewers. Any product that may be evaluated in this article, or claim that may be made by its manufacturer, is not guaranteed or endorsed by the publisher.
Supplementary Material
The Supplementary Material for this article can be found online at: https://www.frontiersin.org/articles/10.3389/fgene.2021.711992/full#supplementary-material
Abbreviations
Mitogenome, Mitochondrial genome; rRNA, Ribosomal RNA; tRNA, Transfer RNA; RSCU, Relative synonymous codon usage; PCG, Protein-coding gene; NJ, Neighbor-Joining; ML, Maximum-likelihood; AICc, Akaike information criterion; MCMC, Monte Carlo Markov Chain.
Footnotes
References
Akaike, H. (1974). A new look at the statistical model identification. IEEE Trans. Automat. Contr. 19, 716–723. doi: 10.1109/TAC.1974.1100705
Altschul, S. F., Gish, W., Miller, W., Myers, E. W., and Lipman, D. J. (1990). Basic local alignment search tool. J. Mol. Biol. 215, 410–430. doi: 10.1016/S0022-2836(05)8036-2
Andronov, V. N. (1974). Phylogenetic relations of large taxa within the suborder Calanoida (Crustacea, Copepoda). Zool. Zh. 53, 1002–1012.
Bernt, M., Donath, A., Juehling, F., Externbrink, F., Florentz, C., Fritzsch, G., et al. (2013). MITOS: improved de novo metazoan mitochondrial genome annotation. Mol. Phylogenet. Evol. 69, 313–319. doi: 10.1016/j.ympev.2012.08.023
Blanco-Bercial, L., Bradford-Grieve, J., and Bucklin, A. (2011). Molecular phylogeny of the Calanoida (Crustacea: Copepoda). Mol. Phylogenet. Evol. 59, 103–113. doi: 10.1016/j.ympev.2011.01.008
Bouckaert, R., Heled, J., Kühnert, D., Vaughan, T., Wu, C. H., Xie, D., et al. (2014). BEAST 2: a software platform for Bayesian evolutionary analysis. PLoS Comput. Biol. 10:e1003537. doi: 10.1371/journal.pcbi.1003537
Boxshall, G. A., and Defaye, D. (2008). Global diversity of copepods (Crustacea: Copepoda) in freshwater. Hydrobiologia 595, 195–207. doi: 10.1007/s10750-007-9014-4
Boxshall, G. A., and Halsey, S. H. (2004). An Introduction to Copepod Diversity, The Ray Society, London.
Boxshall, G. A., and Jaume, D. (2000). Making waves: the repeated colonization of fresh water by copepod crustaceans. Adv. Ecol. Res. 31, 61–79. doi: 10.1016/S0065-2504(00)31007-8
Charneski, C. A., Honti, F., Bryant, J. M., Hurst, L. D., and Feil, E. J. (2011). A typical AT skew in firmicute genomes results from aelection and not from mutation. PLoS Genet. 7:e1002283. doi: 10.1371/journal.pgen.1002283
Chen, S. Z. (1990). Microcrustaceans at the mouth of Tuojiang River. Transact. Oceanol. Limnol. 3, 86–91. doi: 10.13984/j.cnki.cn37-1141.1990.03.015
Chen, G., and Hares, M. P. (2011). Cryptic diversity and comparative phylogeography of the estuarine copepod Acartia tonsa on the US Atlantic coast. Mol. Ecol. 20, 2425–2441. doi: 10.1111/j.1365-294X.2011.05079.x
Chen, W. T., Zhong, Z. X., Dai, W., Fan, Q., and He, S. P. (2017). Phylogeographic structure, cryptic speciation and demographic history of the sharpbelly (Hemiculter leucisculus), a freshwater habitat generalist from southern China. BMC Evol. Biol. 17:216. doi: 10.1186/s12862-017-1058-0
Clark, M. K., Schoenbohm, L. M., Royden, L. H., Whipple, K. X., Burchfiel, B. C., Zhang, X., et al. (2004). Surface uplift, tectonics, and erosion of eastern Tibet from large-scale drainage patterns. Tectonics 23, 1–20. doi: 10.1029/2002TC001402
Crozier, R. H., and Crozier, Y. C. (1993). The mitochondrial genome of the honeybee Apis mellifera: complete sequence and genome organization. Genetics 133, 97–117. doi: 10.1093/genetics/133.1.97
Ding, L., Zhou, Q., Sun, Y. H., Feoktistova, N. Y., and Liao, J. C. (2020). Two novel cricetine mitogenomes: insight into the mitogenomic characteristics and phylogeny in Cricetinae (Rodentia: Cricetidae). Genomics 112, 1716–1725. doi: 10.1016/j.ygeno.2019.09.016
Dray, S., and Dufour, A. B. (2017). The ade4 package: implementing the duality diagram for ecologists. J. Stat. Softw. 22, 1–20. doi: 10.18637/jss.v022.i04
Dumont, H. J., and Reddy, Y. R. (1993). A reappraisal of the genus Phyllodiaptomus Kiefer, 1936, with the description of P. wellekensae n.sp. from India, and a redescription of P. tunguidus Shen & Tai, 1964 from China (Copepoda, Calanoida). Hydrobiologia 263, 65–93. doi: 10.1007/BF00006205
Dumont, H. J., and Reddy, Y. R. (1994). Phyllodiaptomus praedictus n. sp. (Copepoda, Clanoida) from Thailand. Hydrobiologia 273, 101–110. doi: 10.1007/BF00006852
Dumont, H. J., Reddy, Y. R., and Sanoamuang, L. (1996). Description of Phyllodiaptomus christineae n. sp. from Thailand, and distinction of two subgenera within Phyllodiaptomus Kiefer, 1936 (Copepoda, Calanoida). Hydrobiologia 323, 139–148. doi: 10.1007/BF00017591
Gliwicz, Z. M. (2002). On the different nature of top-down and bottom-up effects in pelagic food webs. Freshw. Biol. 47, 2296–2312. doi: 10.1046/j.1365-2427.2002.00990.x
Granthan, R., Gautier, C., Gouy, M., Mercier, R., and Pavé, A. (1980). Codon catalog usage and the genome hypothesis. Nucleic Acids Res. 8, 49–62. doi: 10.1093/nar/8.1.197-c
Hahn, C., Bachmann, L., and Chevreux, B. (2013). Reconstructing mitochondrial genomes directly from genomic next-generation sequencing reads: a baiting and iterative mapping approach. Nucleic Acids Res. 41:e129. doi: 10.1093/nar/gkt371
Hall, R. (2002). Cenozoic geological and plate tectonic evolution of SE Asia and the SW Pacific: computer-based reconstructions, model and animations. J. Asian Earth Sci. 20, 353–431. doi: 10.1016/S1367-9120(01)00069-4
Hong, M. Y., Lee, E. M., Jo, Y. H., Park, H. C., Kim, S. R., Hwang, J. S., et al. (2008). Complete nucleotide sequence and organization of the mitogenome of the silk moth Caligula boisduvalii (Lepidoptera: Saturniidae) and comparison with other lepidopteran insects. Gene 413, 49–57. doi: 10.1016/j.gene.2008.01.019
Hurst, L. D. (2002). The Ka/Ks ratio: diagnosing the form of sequence evolution. Trends Genet. 18:486. doi: 10.1016/S0168-9525(02)02722-1
Jooste, C. M., Emami-Khoyi, A., Gan, H. M., Wasserman, R. J., Dalu, T., and Teske, P. R. (2019). The complete mitochondrial genome of Africa’s largest freshwater copepod, Lovenula raynerae. Mitochondrial DNA B Resour. 4, 725–727. doi: 10.1080/23802359.2018.1555013
Katoh, K., and Standley, D. M. (2013). MAFFT multiple sequence alignment software version 7: improvements in performance and usability. Mol. Biol. Evol. 30, 772–780. doi: 10.1093/molbev/mst010
Ki, J. S., Park, H. G., and Lee, J. S. (2009). The complete mitochondrial genome of the cyclopoid copepod Paracyclopina nana: a highly divergent genome with novel gene order and a typical gene number. Gene 435, 13–22. doi: 10.1016/j.gene.2009.01.005
Kumar, S., Stecher, G., Li, M., Knyaz, C., and Tamura, K. (2018). MEGAX: molecular evolutionary genetics analysis across computing platforms. Mol. Biol. Evol. 35, 1547–1549. doi: 10.1093/molbev/msy096
Laslett, D., and Canback, B. (2008). ARWEN: a program to detect tRNA genes in metazoan mitochondrial nucleotide sequences. Bioinformatics 24, 172–175. doi: 10.1093/bioinformatics/btm573
Lavrov, D., Brown, W., and Boore, J. (2000). A novel type of RNA editing occurs in the mitochondrial tRNAs of the centipede Lithobius forficatus. Proc. Natl. Acad. Sci. U. S. A. 97, 13738–13742. doi: 10.1073/pnas.250402997
Librado, P., and Rozas, J. (2009). DnaSP v5: a software for comprehensive analysis of DNA polymorphism data. Bioinformatics 25, 1451–1452. doi: 10.1093/bioinformatics/btp187
Lin, Q. Q., Peng, L., Yang, Y., and Han, B. P. (2018). Copepods act as omnivores in a (sub)tropical reservoir: implication for the top-down effect on phytoplankton. J. Limnol. 77, 316–329. doi: 10.4081/jlimnol.2018.1748
Liu, H. Y., Xu, N., Zhang, Q. Z., Wang, G. B., Xu, H. M., and Ruan, H. H. (2020). Characterization of the complete mitochondrial genome of Drawida gisti (Metagynophora, Moniligastridae) and comparison with other Metagynophora species. Genomics 112, 3056–3064. doi: 10.1016/j.ygeno.2020.05.020
Love, T. M., and Eddy, S. R. (1997). tRNAscan-SE: a program for improved detection of transfer RNA genes in genomic sequence. Nucleic Acids Res. 25, 955–964. doi: 10.1093/nar/25.5.955
Makino, W., and Tanabe, A. S. (2009). Extreme population genetic differentiation and secondary contact in the freshwater copepod Acanthodiaptomus pacificus in the Japanese archipelago. Mol. Ecol. 18, 3699–3713. doi: 10.1111/j.1365-294X.2009.04307.x
Marrone, F., Brutto, S. L., Hundsdoerfer, A. K., and Arculeo, M. (2013). Overlooked cryptic endemism in copepods: systematics and natural history of the calanoid subgenus Occidodiaptomus Borutzky 1991 (Copepoda, Calanoida, Diaptomidae). Mol. Phylogenet. Evol. 66, 190–202. doi: 10.1016/j.ympev.2012.09.016
Matsumura-Tundisi, T., and Tundisi, J. G. (2003). Calanoid (Copepoda) species composition changes in the reservoirs of São Paulo state (Brazil) in the last twenty years. Hydrobiologia 504, 215–222. doi: 10.1023/B:HYDR.0000008521.43711.35
Meganathan, P. R., Pagan, H. J. T., McCulloch, E. S., Steves, R. D., and Ray, D. A. (2012). Complete mitochondrial genome sequences of three bats species and whole genome mitochondrial analyses reveal patterns of codon bias and lend support to basal split in Chiroptera. Gene 492, 121–129. doi: 10.1016/j.gene.2011.10.038
Mindell, D. P., Sorenson, M. D., and Dimcheff, D. E. (1998). Multiple independent origins of mitochondrial gene order in birds. Proc. Natl. Acad. Sci. 95, 10693–10697. doi: 10.1073/pnas.95.18.10693
Muse, S. V. (2000). Examining rates and patterns of nucleotide substitution in plants. Plant Mol. Biol. 42, 25–43. doi: 10.1023/A:1006319803002
Perbiche-Neves, G., Boxshall, G. A., Previattelli, D., Nogueira, M. G., and da Rocha, C. E. F. (2015). Identification guide to some Diaptomid species (Crustacea, Copepoda, Calanoida, Diaptomidae) of “de la Plata” River Basin (South America). ZooKeys 497, 1–111. doi: 10.3897/zookeys.497.8091
Perdices, A., Sayanda, D., and Coelho, M. M. (2005). Mitochondrial diversity of Opsariichthys Bidens (Teleostei, Cyprinidae) in three Chinese drainages. Mol. Phylogenet. Evol. 37, 920–927. doi: 10.1016/j.ympev.2005.04.020
Perna, N. T., and Kocher, T. D. (1995). Patterns of nucleotide composition at fourfold degenerate sites of animal mitochondrial genomes. J. Mol. Biol. 41, 353–358. doi: 10.1007/BF00186547
Previšić, A., Gelemanović, A., Urbanič, G., and Ternjej, I. (2016). Cryptic diversity in the Western Balkan endemic copepod: four species in one? Mol. Phylogenet. Evol. 100, 124–134. doi: 10.1016/j.ympev.2016.04.010
Sanoamuang, L., and Teeramaethee, J. (2006). Phyllodiaptomus thailandicus, a new freshwater copepod (Copepoda, Diaptomidae) from Thailand. Crustaceana 79, 475–487. doi: 10.1163/156854006777554802
Sanoamuang, L., and Watiroyram, S. (2020). Phyllodiaptomus roietensis, a new diaptomid copepod (Copepoda, Calanoida) from temporary waters in Thailand and Cambodia, with a key to the species. ZooKeys 911, 1–20. doi: 10.3897/zookeys.911.38496
Sanoamuang, L., and Yindee, W. (2001). A new species of Phyllodiaptomus (Copepoda, Diptomidae) from Northeast Thailand. Crustaceana 74, 435–448. doi: 10.1163/156854001750243027
Sars, G. O. (1903). An account of the Crustacea of Norway with short descriptions and figures of all the species: IV. Copepoda Calanoida. Bergen.
Shen, C., and Tai, A. (1964). Descriptions of eight new species of freshwater Copepods chiefly from the Pearl River delta, South China. Acta Zoologica Sinica 16, 225–339.
Steinberg, S., and Cedergren, R. (1994). Structural compensation in atypical mitochondrial tRNAs. Nat. Struct. Biol. 1, 507–510. doi: 10.1038/nsb0894-507
Stothard, P., and Wishart, D. S. (2005). Circular genome visualization and exploration using CGView. Bioinformatics 21, 537–539. doi: 10.1093/bioinformatics/bti054
Sun, C. H., Liu, H. Y., and Lu, C. H. (2020). Five new mitogenomes of Phylloscopus (Passeriformes, Phylloscopidae): sequence, structure, and phylogenetic analyses. Int. J. Biol. Macromol. 146, 638–647. doi: 10.1016/j.ijbiomac.2019.12.253
Sun, Y. B., Shen, Y. Y., Irwin, D. M., and Zhang, Y. P. (2011). Evaluating the roles of energetic functional constraints on teleost mitochondrial-encoded protein evolution. Mol. Biol. Evol. 28, 39–44. doi: 10.1093/molbev/msq256
Thompson, J. D., Gibson, T. J., Frédéric, P., Franois, J., and Higgins, D. G. (1997). The CLUSTAL-X windows interface: flexible strategies for multiple sequence alignment aided by quality analysis tools. Nucleic Acids Res. 24, 4876–4882. doi: 10.1093/nar/25.24.4876
Triant, D. A., and DeWoody, J. A. (2006). Accelerated molecular evolution in Microtus (Rodentia) as assessed via complete mitochondrial genome sequences. Genetica 128, 95–108. doi: 10.1007/s10709-005-5538-6
Vincenty, T. (2013). Direct and inverse solutions of geodesics on the ellipsoid with application of nested equations. Surv. Rev. 23, 88–93. doi: 10.1179/sre.1975.23.176.88
Wagner, S., Van Aken, O., Elsässer, M., and Schwarzländer, M. (2018). Mitochondrial energy signaling and its role in the low-oxygen stress response of plants. Plant Physiol. 176, 1156–1170. doi: 10.1104/pp.17.01387
Wang, Z. F., Wang, Z. Q., Shi, X. J., Wu, Q., Tao, Y. T., Guo, H. Y., et al. (2018). Complete mitochondrial genome of Parasesarma affine (Brachyure: Sesarmidae): gene rearrangements in Sesarmidae and phylogenetic analysis of the Brachyura. Int. J. Biol. Macromol. 118, 31–40. doi: 10.1016/j.ijbiomac.2018.06.056
Weydmann, A., Przylucka, A., Lubośny, M., Walczyńska, K. S., Serrão, E. A., Pearson, G. A., et al. (2017). Mitochondrial genomes of the key zooplankton copepods Arctic Calanus glacialis and North Atlantic Calanus finmarchicus with the longest crustacean non-coding regions. Sci. Rep. 7:13702. doi: 10.1038/s41598-017-13807-0
Wolstenholme, D. R. (1992). Animal mitochondrial DNA: structure and evolution. Int. Rev. Cytol. 141, 173–216. doi: 10.1016/S0074-7696(08)62066-5
Xiang, H. F., Wan, J. L., Han, Z. J., Guo, S. M., Zhang, W. X., Chen, L. C., et al. (2007). Geological analysis and FT dating of the large-scale right-lateral strike-slip movement of the red river fault zone. Sci. China Earth Sci. 50, 331–342. doi: 10.1007/s11430-007-2037-x
Xu, S. L., Guan, Z. Y., Huang, Q., Xu, L., Vierstraete, A., Dumont, H. J., et al. (2017). The mitochondrial genome of Atrocalopteryx melli Ris, 1912 (Zygoptera: Calopterygidae) via lon torrent PGM NGS sequencing. Mitochondrial DNA B Resour. 3, 115–117. doi: 10.1080/23802359.2017.1413307
Xue, J. Z., Ye, L., Cai, Q. H., and Liu, J. K. (2006). Variation of copepod from Maoping to Guizhou in the three gorges reservoir before and after impoundment. Acta Hydrobiol. Sin. 30, 113–115. doi: 10.1051/jp4:20011138
Yakovchuk, P., Protozanova, E., and Frankkamenetskii, M. D. (2006). Base-stacking and base-pairing contributions into thermal stability of the DNA double helix. Nucleic Acids Res. 34, 564–574. doi: 10.1093/nar/gkj454
Yang, Z., and Bielawski, J. P. (2000). Statistical methods for detecting molecular adaptation. Trends Ecol. Evol. 15, 496–503. doi: 10.1016/S0169-5347(00)01994-7
Yang, Z., and Nielsen, R. (2000). Estimating synonymous and nonsynonymous substitution rates under realistic evolutionary models. Mol. Biol. Evol. 17, 32–43. doi: 10.1093/oxfordjournals.molbev.a026236
Yang, Z. H., Yang, T. T., Liu, Y., Zhang, H. B., Tang, B. P., Liu, Q. N., et al. (2019). The complete mitochondrial genome of Sinna Extrema (Lepidoptera: Nolidae) and its implications for the phylogenetic relationships of species. Int. J. Biol. Macromol. 137, 317–326. doi: 10.1016/j.ijbiomac.2019.06.238
Yu, D., Chen, M., Tang, Q. Y., Li, X. J., and Liu, H. Z. (2014). Geological events and Pliocene climate fluctuations explain the phylogeographical pattern of the cold water fish Rhynchocypris Oxycephalus (Cypriniformes: Cyprinidae) in China. BMC Evol. Biol. 14:225. doi: 10.1186/s12862-014-0225-9
Zhang, D., Gao, F., Jakovlić, I., Zhou, H., Zhang, J., Li, W. X., et al. (2020a). PhyloSuite: an integrated and scalable desktop platform for streamlined molecular sequence data management and evolutionary phylogenetic studies. Mol. Ecol. Resour. 20, 348–355. doi: 10.1111/1755-0998.13096
Zhang, X. L., Xu, S. L., Liu, P., Huang, Q., Li, H. M., Dumont, H. J., et al. (2020b). The mitochondrial genome of Phyllodiaptomus tunguidus Shen & Tai, 1964 (Copepoda, Calanoida) and its phylogeny. Mitochondrial DNA B Resour. 5, 2521–2522. doi: 10.1080/23802359.2020.1763863
Keywords: tRNA-Arg, calanoid, southern China, genetic differentiation, phylogeny
Citation: Zhang X-L, Liu P, Xu S-L, Rizo EZ, Zhang Q, Dumont HJ and Han B-P (2021) Geographic Variation of Phyllodiaptomus tunguidus Mitogenomes: Genetic Differentiation and Phylogeny. Front. Genet. 12:711992. doi: 10.3389/fgene.2021.711992
Edited by:
Genlou Sun, Saint Mary’s University, CanadaReviewed by:
Chris Dietrich, University of Illinois at Urbana-Champaign, United StatesSandeep Kumar Gupta, Wildlife Institute of India, India
Copyright © 2021 Zhang, Liu, Xu, Rizo, Zhang, Dumont and Han. This is an open-access article distributed under the terms of the Creative Commons Attribution License (CC BY). The use, distribution or reproduction in other forums is permitted, provided the original author(s) and the copyright owner(s) are credited and that the original publication in this journal is cited, in accordance with accepted academic practice. No use, distribution or reproduction is permitted which does not comply with these terms.
*Correspondence: Bo-Ping Han, dGJwaGFuQGpudS5lZHUuY24=; dGJwaGFuQDEyNi5jb20=